
Abstract
Multiple sclerosis (MS) is a central nervous system (CNS) disease with autoimmune inflammation, demyelination, and neurodegeneration. Untreated MS patients exhibit subnormal activation of the p-Ser-STAT1 transcription factor in peripheral blood mononuclear cells (PBMCs), causing weak interferon (IFN) signaling and low expression of some IFN-stimulated genes (ISGs). IFN-β therapy reduces MS exacerbations, delays progression, and largely corrects abnormal gene expression in PBMC. We hypothesize that long-term IFN-β therapy improves weak IFN responses and regulates MS immunity through a priming effect and induction of a more IFN-responsive state. The duration and strength of IFN-stimulated gene expression during prolonged therapy and their diminution after discontinuation are unknown. Using paired comparisons of 1- and 7-month PEG-IFN-β-treated MS patients’ PBMCs, we investigated short- and long-term responses to in vivo IFN-β. Prolonged therapy created a new IFN setpoint with elevated expression of antiviral, immune, anti-inflammatory, and neuroprotective ISG while decreasing inflammatory and metabolic gene expression, often doubling their half-life. Genes that inhibit IFN-β signaling also showed long-term induction, reflecting a regulatory state that prevents overactivation. Strong IFN responses during long-term therapy of MS reflect a shift from subnormal IFN signaling and dysregulated immune control to a more responsive state that persists for months.
Keywords
Introduction
Multiple sclerosis (MS) is an inflammatory, demyelinating, neurodegenerative autoimmune disease of the central nervous system. Interferon-β (IFN-β), the first FDA-approved treatment for MS, corrects the subnormal type I IFN signature seen in untreated MS, reduces exacerbations, delays progression, and slows brain atrophy (Ebers, 1998; Li et al, 2025; The IFNβ Multiple Sclerosis Study Group, 1993). Type I IFNs are antiviral, block cancer cell proliferation, and have pleiotropic immunomodulatory effects (Kasper and Reder, 2014). The mechanism of action of IFN-β treatment in MS, however, remains to be defined.
In untreated patients with active MS, activated p-Ser-STAT1 transcription factor levels are markedly reduced, resulting in low expression of 25% of IFN-stimulated genes (ISGs), largely those affecting immunity (Feng et al, 2002). Intrinsic type I IFN dysregulation may underlie excessive inflammation in MS. We find that IFN-β therapy reverses this chronic immune dysregulation after correcting subnormal. Therapy corrects p-Ser-STAT1 levels to near-normal levels, enhances IFN responses and type I IFN production, and balances pro- and anti-inflammatory cytokines and neuroprotective proteins (Comabella et al, 2009; Feng et al, 2019b; Li et al, 2025; Reder and Feng, 2013,2014).
A moderate intracellular type I IFN signal enables cells to respond to stimuli, readying cells for activation and priming the pump to prolong and strengthen secondary responses. This baseline signal causes cells to be “ready-to-go,” enabling rapid and amplified type I IFN production in response to viral infection or other cytokines in vitro (Takaoka and Taniguchi, 2003). In untreated MS, serum IFN levels and in vitro responses to IFN are subnormal (Feng et al, 2002). IFN therapy, however, elevates baseline ISG expression and balances IFN-stimulated serum protein levels (Fogel et al, 2024; Nguyen et al, 2023).
To define long-term IFN effects in vivo, we investigated gene expression and kinetics of ISG decay. Paired comparisons of PEG-IFN-β-1a-treated MS peripheral blood mononuclear cells (PBMC) at long-term (1 and 7 months) and short-term (0, 6, and 24 h post-injection) points were used. Global RNA microarray analysis and functional pathway analysis focused on IFN-β-stimulated genes (ISGs), innate (antiviral) and adaptive immunity [immunoglobulins (Igs)], cellular metabolism (ribosomal subunit genes), and neuroprotection [metallothioneins (MTs)].
Materials and Methods
A total of 29 subjects included 9 untreated, clinically stable relapsing/remitting MS (RRMS) patients, 10 healthy controls (HCs), and 10 PEG-IFN-β-1a-treated RRMS, exacerbation-free for at least 3 months, averaging 3 years since last exacerbation (Table 1). All subjects signed University of Chicago Institutional Review Board-approved written informed consents. Sixty-seven blood samples were collected from pegylated-IFN-β-treated patients after a 2-week washout after the last injection (370.0 ± 12.6 hours, mean ± SEM). Patients then injected 125 μg of PEG-IFN-β at 8 to 9 AM, and samples were drawn at 6 and 24 h afterward. Samples from each subject were drawn at 1 and 7 months after starting treatment. Washout times did not differ between 1 and 7 months. The term “washout” is used because circulating IFN-β from prior injections is largely eliminated by 1 h, and a second wave of induced type I IFN is minimal by 40 h (Feng et al., 2019a).
Demographics
Values are mean ± SEM. No demographic differences are significant.
B, Black; C, Chinese; EDSS, expanded disability status scale; F, female; Flare, multiple sclerosis exacerbation; H, Hispanic; I, Indian; M, male; MS, multiple sclerosis; RRMS, relapsing/remitting MS; W, White.
No subject had exacerbations or progression during this 6-month period. The 1-month point minimized confounding from initial flu-like side effects and dose uptitration. The 7-month point follows the 3-month lag in benefit on relapses seen in the pivotal IFN-β trial (The IFNβ Multiple Sclerosis Study Group, 1993).
PBMC isolation by density gradient centrifugation (Lympholyte, Cedarlane Laboratories, Burlington, NC) within 1–4 h of phlebotomy at each time point. Total RNA isolation and storage (Qiagen) and highly sensitive and comprehensive Clariom D microarrays (Thermo Fisher Scientific) were performed according to the manufacturer protocol. Microarray expression was validated with QuantiGene assays (Thermo Fisher) (Feng et al, 2019a).
Differentially expressed genes (DEGs) were analyzed with Transcriptome Analysis Console (TAC) version 4.0.2 (Thermo Fisher), based on raw CEL files from Affymetrix DNA microarray image analysis software, followed by log2-transformation and normalization, as previously described (Fogel et al, 2024). Genes identified as pseudogenes, unassigned, or uncharacterized (“AceView Identified”) were excluded from TAC analysis. Pathway enrichment analysis and Gene Ontology (GO) were performed on TAC-identified genes using Enrichr (Xie et al, 2021).
Principal component analysis (PCA) was visualized with TAC. Gene expression was determined using limma Bioconductor in TAC. Gene expression decay was analyzed with custom R functions that extract normalized gene-expression signals, align them to patient-specific washout durations, and plot expression against washout time with linear regressions for each treatment group. Linear fits provided estimates of decay rates. Lmertest was used to compare 1- and 7-month regression slopes (decay rates) with paired t-tests with fixed group effects (Bates et al, 2015). Thresholds were FDR-corrected P value < 0.05 and fold-change > |1.5|. Analysis of variance and Tukey multiple comparison tests assessed differences among untreated, 1-month, and 7-month washout samples. Paired t-tests assessed differences among samples at 0, 6, and 24 h after reinjection at 1 and 7 months.
Raw microarray data files are available in the National Center for Biotechnology Information Gene Expression Omnibus repository. GEO accession number GSE224351 (Nguyen et al, 2023).
Results
Interferon stimulated gene (ISG) induction after IFN-β therapy
Global differential gene expression in MS PBMC differed between 1 month and 7 months of PEG-IFN-β therapy. A PCA of paired gene expression at 1 month versus 7 months at washout combined with postinjection points showed clear separation of differentially expressed gene (DEG) between early versus late therapy (Fig. 1A). Comparing early versus late gene induction at 6 and 24 h after reinjection of this long-acting IFN therapy, compared with respective washouts, there were more DEGs at 1 month than at 7 months (Fig. 1B). The 24-h gene expression peak is delayed with PEG-IFN compared with natural IFN-β-1a, where pro-inflammatory, immune regulatory, and neuroprotective ISG expression is highest at 6 h (Nguyen et al, 2023).
Gene expression 1 and 7 months after starting PEG-IFN-β-1a, after a 2-week therapy washout and after reinjection.
Many genes are uniquely expressed at 1 month. Combining genes induced 6 and 24 h after injections, 2,524 unique DEGs were induced at 1 month, but only 20 unique DEGs were induced at 7 months. A total of 337 overlapping DEGs were induced at both 1 and 7 months (Fig. 1C). Despite this difference, absolute gene expression reached similar maximum levels 6 and 24 h after reinjection at both 1 and 7 months. The difference in short-term gene induction can be attributed to higher postwashout gene expression and thus less short-term relative induction following reinjection at 7 months compared with 1 month. Differential gene expression is induced and decays rapidly over a 2-week washout at 1 month but is sustained at 7 months.
Long-term IFN therapy prolongs induction of interferon-stimulated genes (ISG) and MTs: IFN-β-treated MS post-washout compared with untreated MS and HC
Rates of decay in gene expression after an injection at 1 and 7 months were modeled with linear regression and compared for significant differences in slope (Fig. 2A). Classical ISGs showed a significantly slower rate of decay at 7 months (P < 0.05). This pattern was present across many IFN functions, such as interferon signaling (IFITs, STATs), antiviral response (OASs, APOBECs), and interferon inhibition (USP18). Decay curves were extrapolated to their intercepts with untreated MS expression levels. Though gene expression kinetics are not necessarily linear, comparisons between paired samples do reflect differences in decay rate after reinjection. Predicted OAS1 decay was projected to return to untreated MS expression levels at 900 h after reinjection at 1 month but was prolonged to 2,400 h at 7 months. USP18 was projected to decay to untreated levels at 1,200 h at 1 month and 2,100 h at 7 months. This change in decay rate indicates that ISG expression is higher after a therapy washout at 7 months compared with 1 month.
Long-term IFN-β therapy slows the decay of interferon-stimulated gene (ISG) expression.
Responders to IFN-β therapy have lower serum type I IFN levels and weaker IFN induction than partial responders to therapy (Li et al., 2025). There were no exacerbations in these treated patients, preventing investigation of different kinetics in responders/partial responders.
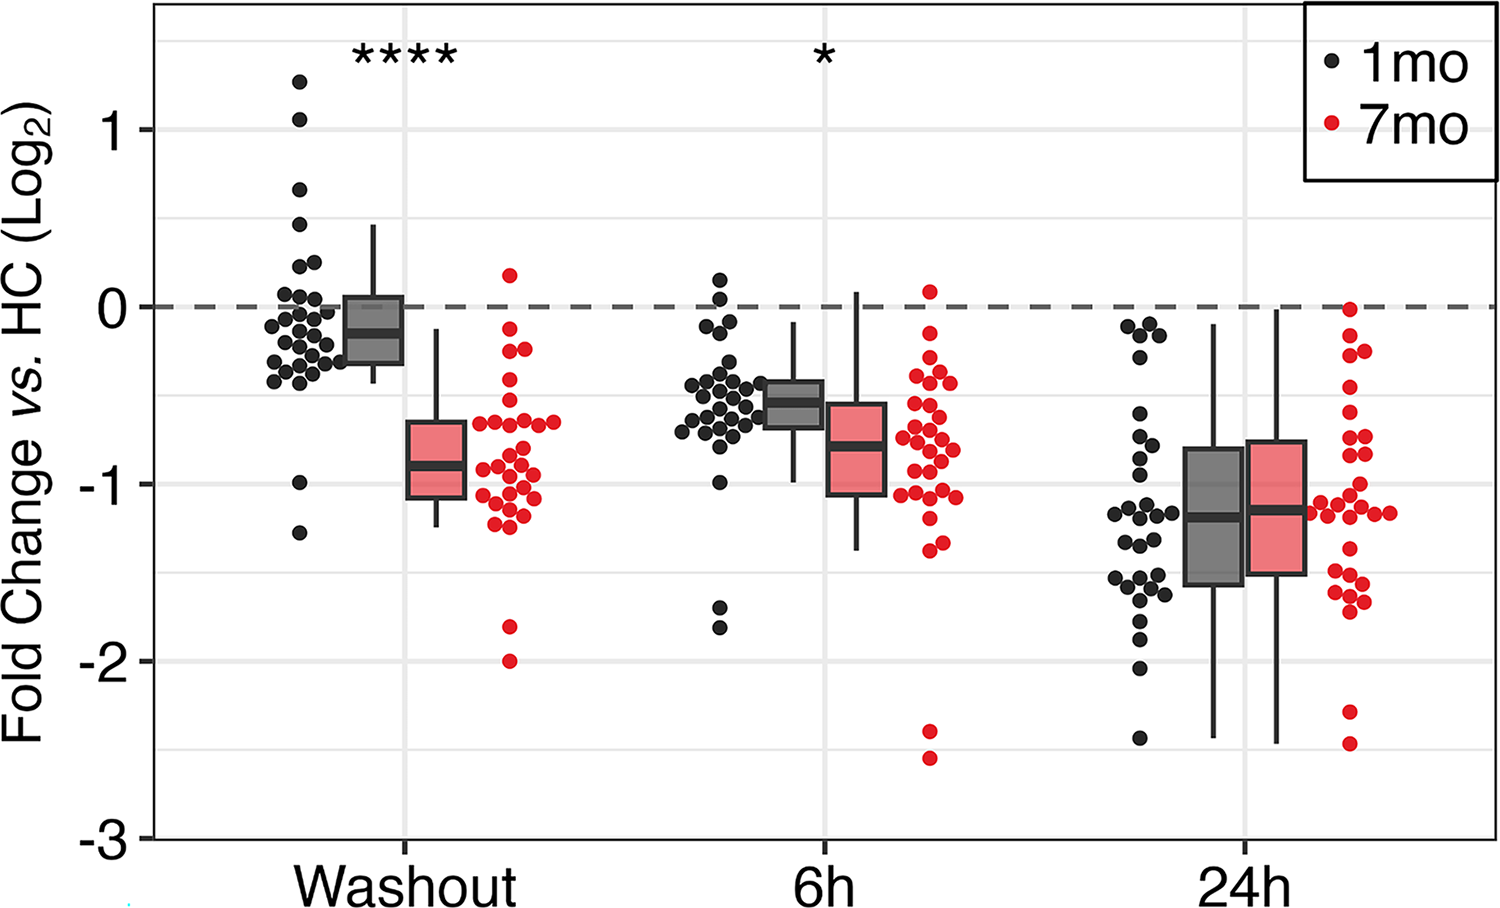
Fifty-five antiviral and immune ISGs had fold-change (≥1.5) at 7-month washout compared with 1-month washout (Fig. 2B; Supplementary Table S1). These ISGs are involved in antiviral and immune processes: Gene Ontology Defense Response to Virus (GO:0051607) and Reactome Immune System (R-HSA-168256) gene sets. After 1 month of IFN-β therapy, at washout, 37 of these genes were upregulated, while 18 were downregulated compared with HC. At 7 months, this profile shifted to more induction, with 55 genes upregulated, and none downregulated. ISG expression after washout at 7 months was 2.84-fold higher than untreated and 2.22-fold higher than washout at 1 month (both P < 0.0001). Genes coded for proteins involved in interferon regulation (IFI27, IFI44L, IRFs, ISG15), antiviral response (APOBECs, MX1, OASs, RSAD2, TLR7), and immune suppression (CD85/LILRBs, CD274/PD-L1) (Fig. 2B). There was some variation in IFN response between patients, but there was no correlation with disease activity, as there were no exacerbations in these non-smoking subjects with sufficient vitamin D levels (Supplementary Fig. S1).
MT gene expression was elevated after 7 months of IFN-β therapy (Fig. 2C; Supplementary Table S2). Ten MTs were selected for fold-change ≥1.5 after washout at 7 months versus 1 month. These MTs had significantly higher expression at 7-month washout and 1.42-fold higher than untreated and 1.64-fold higher than 1-month washout (both P < 0.0001). Absolute MT expression was lower 6 h after reinjection at 7 months than at 1 month but reached similar peaks after 24 h. This delayed induction despite an elevated baseline suggests counter-regulation during long-term IFN-β therapy. Elevated postwashout levels of MT gene expression at 7 months would elevate antioxidant proteins and potentially promote anti-inflammatory and neuroprotective effects.
Long-term and short-term changes in Ig and platelet signaling gene expression
Genes coding for Ig complex components had elevated expression at 7 months compared with 1 month (Fig. 3A and C; Supplementary Table S3). Fifty Ig complex genes were selected from Gene Ontology Immunoglobulin Complex (GO:0019814), including Ig heavy chains (IGH) and kappa light chains (IGK). Ig genes were upregulated at 7 months compared with 1 month at washout and 6 and 24 h after IFN-β reinjection: 1.52-fold at washout (P < 0.0001), 1.32-fold at 6 h (P < 0.001), and 1.60-fold at 24 h (P < 0.0001).
Long- and short-term IFN-β induction and priming of immunoglobulin complex and megakaryocyte/platelet family genes.
Megakaryocyte (MK)/platelet family genes had reduced expression at 7 months compared with 1 month at washout and at 6 and 24 h after IFN-β reinjection (Fig. 3B and D; Supplementary Table S4). There were 25 genes from Reactome Platelet Activation, Signaling, and Aggregation (R-HSA-76002) with fold-change ≤ −1.5 at 7 months compared with 1 month at one or more time points (washout, 6 and 24 h). Genes were involved in platelet formation (MPL), adhesion and aggregation (GP1BA, ITGB3, SELP), activation and signaling (GNG11, P2RY12), and degranulation (MMRN1, PF4, PPBP, PROS1, RAB27B, SPARC). At 1 month, average postwashout platelet-related gene expression was below HC levels but rose above HC at 6 and 24 h after injection. After 7 months, platelet gene expression always falls below HC levels. At 7 months, average platelet-related gene expression differences compared with 1 month were −1.37-fold-change at washout (P < 0.01), −2.35 at 6 h (P < 0.0001), and −1.85 at 24 h (P < 0.0001).
Long-term IFN-β suppression of ribosomal and translation factor genes
Expression of genes involved in protein synthesis was suppressed at 7 months compared with 1 month (Fig. 4; Supplementary Table S5). Thirty protein synthesis genes, including small and large ribosomal protein subunit (RPS, RPL) and translation factor (EIF) genes, were selected for fold-change (≤−1.5) at 7-month washout compared with 1 month. Ribosomal genes included pseudogenes with potential molecular regulatory effects. Average expression of these protein synthesis genes at 7 months compared with 1 month was −2.15-fold at washout (P < 0.0001), −1.34 at 6 h post-injection (P < 0.05), and was not different at 24 h.
Long-term IFN-β-induced suppression of protein synthesis genes. Twenty-five ribosomal and transcription initiation genes at 0, 6, and 24 h after 1 (black) and 7 months (red) of PEG-IFN-β-1a therapy. Description as in Figure 3.
Discussion
Sustained postwashout ISG induction with prolonged IFN-β therapy
Extended IFN-β treatment led to prolonged expression of many genes in PBMC. After an injection, ISG RNA decayed more slowly after 7 months of therapy compared with 1 month. ISG levels were lowest in untreated patients, higher at 1 month after washout, and highest at 7 months. The predicted duration of gene induction was generally twice as long after 7 months than at 1 month (Fig. 2A). ISGs with prolonged expression included classical antiviral ISGs (IFITMs, MX1, OAS) and immune genes (CD274, LILRBs, TNFSF13B) (Feng et al, 2019a; Schoggins, 2019). Serum proteins are likely to have even more prolonged induction with long-term IFN treatment. This suggests that the strong antiviral state in MS (Li et al, 2025; Sibley et al, 1985) is amplified with long-term therapy, in keeping with the fall in COVID infections in MS patients on IFN-β therapy (Louapre et al, 2020).
Sustained postwashout induction of anti-inflammatory and IFN-β-inhibitory genes with prolonged IFN-β therapy
Anti-inflammatory genes also had reduced decay and sustained expression at 7 months (Fig. 2B). Inhibitory leukocyte Ig‐like receptor B family (LILRB/CD85) proteins bind MHC class I and recruit immune-inhibitory SHP-1 (Jensen et al, 2010; Katz, 2006). The SHP-1 tyrosine phosphatase (PTPN6) suppresses cytokine levels by dephosphorylating STAT1, 3, and 6. Low SHP-1 levels in macrophages and B and T cells correlate with high pro-inflammatory cytokine production in MS and with demyelination in scurfy mice (Christophi et al, 2008). PD-L1 (CD274) from monocytes binds to PD-1 and CD80 on T cells to inhibit cytokine secretion and T cell immunity (Curiel et al, 2003). PTEN is a phosphatidylinositol phosphatase that inhibits the development and activation of T cells by blocking PI3K/ATK signaling. In MS, PTEN deficiency is linked to weak suppression by CD4+ Tregs and more inflammation (Schlöder et al, 2025).
Genes that inhibit IFN-β signaling were also sustained at 7 months, perhaps preventing overactivation. IFN-α inducible protein 6 (IFI6) impairs RIG-I activation, innate antiviral responses, and IFN signaling (Villamayor et al, 2023b). Interferon-alpha inducible protein 27 (IFI27) activates PKR to decrease virus protein synthesis but inhibits RIG-I and innate immunity (Villamayor et al, 2023a). It is a potential MS biomarker (Fogel et al, 2024; Sellebjerg et al, 2009). IFN-stimulated protein 44-like (IFI44L) downregulates antiviral responses. IFI44L binds FKBP prolyl isomerase 5 to inhibit IκB kinase activity and diminish type I IFN signaling (DeDiego et al, 2019). Ubiquitin-specific peptidase 18 (USP18) deconjugates ISG15 from target proteins to suppress downstream IFN-β and TLR4 effects. USP18 also binds directly to IFNAR2 and STAT2, inhibiting JAK1 binding and type I IFN signaling (Basters et al, 2018). Finally, B-cell-activating factor (BAFF, TNFSF13B) increases B cell proliferation and differentiation (Fong et al, 2023; Gandhi et al, 2008) which could be detrimental in MS. However, BAFF also induces Tregs and IL-10-producing B cells (Catalán et al, 2021) and appears to have a strong anti-inflammatory role in experimental autoimmune encephalomyelitis (EAE) (Rojas et al, 2019) and MS (Li et al, 2025). Supporting an anti-inflammatory effect of BAFF in MS, serum levels are higher in stable patients than in relapsing patients, while anti-BAFF/Blys therapy (Atacicept) provokes MS exacerbations (Kannel et al, 2015).
MT induction is sustained during prolonged IFN-β therapy
MT genes were also sustained at 7 months (Fig. 2C). MTs are small, cysteine-rich metal-binding proteins that regulate oxidative stress and homeostasis of Zn, Cu, Fe, As, Hg, and Pb. The MT1 subfamily reduces inflammation and ferroptosis and promotes neuronal regeneration (Dai et al, 2021; Pedersen et al, 2009). MT1G suppresses NF-κB to reduce oxidative stress and pro-inflammatory cytokine production in macrophages (Yang et al, 2021). In MS lesions, MT proteins are expressed by astrocytes and macrophages (Penkowa et al, 2003). In response to brain injury, MT overexpression rapidly induces JAK1/STAT3 signaling and neuro-regenerative astrogliosis (Leung et al, 2010). Elevated postwashout levels of MT gene expression here may reflect a long-term anti-inflammatory and neuroprotective IFN-β impact and replicates findings with IFN-β treatment in a different cohort (Fogel et al, 2024). Likely related, IFN-β treatment reduces MS exacerbations and new MRI lesions, and enhances repair and prevents black hole formation when lesions appear during therapy (Filippi et al, 2011).
Ig component gene expression is elevated with prolonged IFN-β therapy
Long-term IFN therapy upregulates genes coding for Ig components (Fig. 3A and C), likely enhancing vaccine responses (Mok and Chan, 2020). Igs bind Fc receptors on the surface of immune cells, setting their activation threshold. Igs also enhance the function of CD4+ Tregs, inducing secretion of anti-inflammatory IL-10 and TGF-β (Nimmerjahn and Ravetch, 2010), corresponding to the long-term IFN-β-induced shift toward a more balanced immune state in MS (Li et al, 2025; Nguyen et al, 2023).
Platelet gene expression diminishes with prolonged IFN-β therapy
Long-term IFN therapy downregulates genes relating to platelet function (Fig. 3B and D). Platelets are anuclear cells that are hemostatic. They are also immunoregulatory and beneficial in aging and neurodegenerative diseases (Wang et al, 2024). Platelet precursors, MKs, are large cells (50–100 μm; 1,000× the volume of a lymphocyte) found primarily in bone marrow and lung but also in blood at ∼10 cells/mL, 0.05% of PBMC (Gelon et al, 2022). Their platelet progeny are large exosomes that not only contain pro-inflammatory and antiviral cytokines but also anti-inflammatory cytokines, depending on the MK lineage (Wang et al, 2024).
IFN-β therapy decreases blood platelet levels and represses nuclear factor erythroid 2 (NFE2), which is crucial for MK development (Pozner et al, 2010). SOCS-1, induced by IFN-β therapy (Li et al, 2025), inhibits thrombopoietin (TPO) signaling to decrease megakaryopoiesis (Wang et al, 2000). Platelet-related gene expression decreases after 7 months of IFN-β exposure (Fig. 3B and D). A decrease in these platelet-related genes could reduce thrombocytopoiesis.
MS lesions contain platelets and the platelet-derived coagulation factors, protein C inhibitor, thrombospondin, fibronectin, and vitronectin (Langer et al, 2012). Platelet-derived β-thromboglobulin and platelet factor 4 (PF4) are elevated in untreated MS plasma (Cananzi et al, 1987). MKs and platelets secrete pro-inflammatory cytokines such as IL-1β and PF4 (Cunin and Nigrovic, 2019). Platelet-derived serotonin increases CD4 T cell proliferation and Th1 differentiation; PF4 and platelet-activating factor promote Th17 differentiation (Starossom et al, 2015). Opposing these actions, PF4 reduces neuroinflammation, enhances cognition, and restores CNS synapses in aging (Wang et al, 2024). Platelets have dose- and time-dependent effects on remyelination (Rivera et al, 2025).
Protein synthesis genes are suppressed by long-term IFN-β therapy
Genes involved in protein translation [ribosomal protein genes (RPL, RPS) and translation factor genes (EIF)] are overexpressed in untreated MS whole blood and PBMC compared with HC (Riveros et al., 2010). RPS6 RNA levels are highly correlated with other ribosomal protein genes and EIF2AK3 (coding for eIF2α kinase, PERK). RPS6KB1 is elevated in untreated MS and reduced by IFN-β therapy (Feng et al, 2019a; Parnell et al, 2014) (RPS6KB1, Fig. 4). EIF2AK3 mediates the integrated stress response that protects oligodendrocytes from inflammation (Way and Popko, 2016). EIF2AK3 suppression during IFN-β therapy (Fig. 4) parallels reduced CNS damage and less peripheral inflammation. 40s ribosomal subunit genes were also reduced by IFN-β therapy, suggesting it causes a global reduction of cellular metabolism. This reduction of cellular metabolism is consistent with findings that IFN-β decreases mitochondrial activity in CD4+ lymphocytes (Haghikia et al, 2015).
Two protein translation genes, EIF4EBP1 and RPS6KB1, are downstream targets of mTOR (mechanistic target of rapamycin). mTOR and its downstream targets induce cellular proliferation and are upregulated in MS (Akbarian et al, 2020). Blocking mTOR suppresses inflammatory dendritic and microglial cells, increases Tregs, and causes T-effector cell anergy (Vakrakou et al, 2022). Type I IFNs suppress the mTOR pathway and reduce EIF4EBP1 and RPS6KB1 expression and RPS6KB1 phosphorylation (Schmeisser et al, 2013) and downregulate EIF and RBP in HCV during IFN-α/ribavirin therapy (Gupta et al, 2012). Suppression of protein synthesis may quell inflammation in MS. Evaluation of IFN effects on the balance of pro- and anti-inflammatory cells is in progress.
Antiviral ISG: hepatitis as a model of antiviral effects of long-term IFN-β therapy
Genes induced with long-term IFN-β therapy in MS are clinically relevant in infections such as hepatitis B (HBV) and hepatitis C virus (HCV). The APOBEC3 (A3) subfamily (A3A-G) is induced by IFN-α to inhibit HBV replication through cytidine deamination (Bonvin et al, 2006). A3A, A3B, A3C, and A3D expressions were induced by IFN-β reinjection and sustained after washout at 7 months. IFIT3 expression is high in chronic HBV patients, inducing ISG (Xu et al, 2022). Sustained expression of IFIT3 after 7 months of IFN-β therapy will enhance antiviral responses. IFI6, also elevated at 7 months, protects against HBV by inhibiting EnhII/Cp promoter activity (Sajid et al, 2021). IFI27 had sustained expression and further induction after reinjection after 7 months versus 1 month of IFN-β therapy (priming). IFI27 overexpression blocks HBV RNA transcription through ubiquitination-dependent proteasomal degradation of the C/EBPα transcription factor (Yu et al, 2025). Thus, long-term therapy may enhance the antiviral benefit of IFN.
During HCV infection, MTs protect against reactive oxygen species and ameliorate liver damage. MT expression is 3-fold lower in chronic HCV patients than in HC, with an inverse relationship between MT protein and mRNA levels versus the necro-inflammatory Histological Activity Index, measuring fibrosis in chronic HCV (Carrera et al, 2003). MT genes were induced with prolonged PEG-IFN therapy (Fig. 2C) and potentially protect the liver and the CNS.
Limitations
A moderate sample size was countered by clinically well-defined patients and carefully timed samples, paired at multiple time points to increase statistical power. The data validate and replicate two different cohorts of MS patients receiving subcutaneous IFN-β-1a therapy (Feng et al, 2019a; Fogel et al, 2024). Second, the use of only two postinjection time points limits short-term gene expression analysis. A higher sampling frequency after reinjection would improve time-scale resolution and analysis but is logistically challenging. IFN-β therapy can take several months before exacerbations decline (The IFNβ Multiple Sclerosis Study Group, 1993). A transition point at three months was not studied here. Third, single-cell analysis would provide complementary data on gene expression in immune cell subsets, but scRNAseq expression coverage is not as deep. Here, the aggregate immune milieu is derived from high-sensitivity, extensive-coverage microarrays of PBMC RNA that quantitate global gene expression at a deep level equivalent to >200 million RNAseq reads (Nazarov et al., 2017).
Implications
There is clinical evidence for prolonged effects of IFN therapy in MS. Even with 4-week gaps between injections, PEG-IFN-β therapy has benefit, albeit slightly less than with 2-week gaps (Calabresi et al., 2014). Relapses persist for 3 months after starting IFN-β therapy and then diminish (IFNβ-MSG, 1993). Five years of IFN-β-1b therapy extends life by 7 years versus placebo, an effect on survival seen 20 years after starting therapy (Goodin, Reder et al, 2012). Priming and longer duration of responses with long-term IFN-β therapy suggest that there will be more benefit over time. Long-term IFN-β response signatures suggest mechanisms for correcting MS pathology and personalizing targets for IFN-β and other therapies in MS, prolonged virus infections, and cancer.
Conclusions
Prolonged IFN-β therapy enhances short-term (6 and 24 h post-IFN injection) and long-term (1 and 7 months at washout) gene expression in MS PBMC. IFN-β-induced gene expression is “primed” for robust short-term responses and prolonged with in vivo treatment duration, expanding prior in vitro studies (Takaoka and Taniguchi, 2003). In vivo therapy increases gene expression in IFN-β-stimulated genes (ISGs), innate (antiviral) and adaptive immunity (Igs), and neuroprotective pathways (MT), but decreases cellular metabolism (ribosomal subunit, translation factors). Expression of genes that inhibit IFN-β production or signaling was also induced and more prolonged with treatment duration, indicating negative feedback. This study validates and replicates gene expression and protein findings in two different MS cohorts (Feng et al, 2019a; Fogel et al, 2024; Li et al, 2025) and expands in vitro studies (Takaoka and Taniguchi, 2003) to in vivo human responses.
Authors’ Contributions
Conceptualization: X.F. and A.T.R.; methodology: J.K., C.M., X.F., and A.T.R.; formal analysis: J.K., C.M., X.F., and A.T.R.; investigation: J.K., C.M., X.F., and A.T.R.; writing—original draft preparation: J.K., C.M., X.F., and A.T.R.; writing—review and editing: J.K., C.M., X.F., and A.T.R.
Footnotes
Acknowledgments
The authors are grateful for funding provided by unrestricted grants from Biogen (US-PEG-14-10648) and the Teshinsky Family Foundation and for technical help from Dr. Douglas Bates, creator of lme4 and lmertest R packages. Summary figure created with BioRender.com.
Data Availability Statement
Raw microarray data files are available in the National Center for Biotechnology Information Gene Expression Omnibus repository. GEO accession number GSE224351.
Author Disclosure Statement
The authors declared no potential conflicts of interest with respect to the research, authorship, and/or publication of this article.
Funding Information
The author(s) disclosed the receipt of the following financial support for the research, authorship, and/or publication of this article: This work was supported by Biogen (US-PEG-14-10648) and the Teshinsky Family Foundation. C.M. received grants from the Jeff Metcalf Internship Program. J.K. received grants from the Katen Foundation and Jeff Metcalf Internship Program.
Supplemental Material
Supplemental Material
Supplemental Material
Supplemental Material
Supplemental Material
Supplemental Material
References
Supplementary Material
Please find the following supplemental material available below.
For Open Access articles published under a Creative Commons License, all supplemental material carries the same license as the article it is associated with.
For non-Open Access articles published, all supplemental material carries a non-exclusive license, and permission requests for re-use of supplemental material or any part of supplemental material shall be sent directly to the copyright owner as specified in the copyright notice associated with the article.