
Abstract
Purpose:
This study aimed to evaluate the efficacy and safety of topically administered ganciclovir (GC) eye drops at varying concentrations.
Methods:
Fifteen New Zealand white rabbits were divided into 5 groups (n = 3 per group): control (saline), 0.15%, 2%, 4%, and 8% GC eye drops. GC eye drops were applied to both eyes 4 times a day for 10 days. The concentration of GC in the aqueous humor was measured using liquid chromatography-tandem mass spectrometry. Ocular toxicity scores were graded using slit-lamp microscopy. Specular microscopy was performed after final instillation. Corneal tissues were analyzed for scanning electron microscopy (SEM) and transmission electron microscopy (TEM). Intraocular pressure (IOP) was also measured.
Results:
The mean GC concentrations in aqueous humor were significantly increased in a dose-dependent manner: 0.15% (40.75 ± 18.54 ng/mL), 2% (287.66 ± 114.67 ng/mL), 4% (855.70 ± 408.22 ng/mL), and 8% (1916.85 ± 985.97 ng/mL) (P = 0.004, K-W test). Total ocular surface toxicity scores rose with increasing concentrations, with the most pronounced toxicity observed in the 8% group. Specular microscopy and SEM showed no significant differences in endothelial cell density or morphology. TEM revealed increased cell vacuoles in the 8% group, though intercellular junctions remained intact. There were no significant differences in IOP values across all groups.
Conclusions:
Topical GC achieved effective ocular penetration, reaching concentrations above the 50% inhibitory dose for cytomegalovirus replication at 2% or higher. Dose-dependent ocular surface toxicity was observed, particularly at higher concentrations. However, no structural or cellular damage to the corneal endothelium was detected.
Introduction
Cytomegalovirus (CMV), one of the major causes of hypertensive anterior uveitis, is characterized by sudden elevation in intraocular pressure (IOP) and frequent recurrences. 1 Chronic uveitis with elevated IOP may occur during the course of the disease due to frequent recurrences and inflammation fluctuations, requiring the use of antiviral agents alongside IOP-lowering medications to control CMV activity.2–4 Additionally, proper antiviral therapy is important because frequent recurrence of CMV infection can result in corneal decompensation and glaucoma, causing irreversible vision loss.1,5 Currently, 0.15% ganciclovir (GC) gel and oral valganciclovir are commonly used to treat CMV-associated ocular disease, such as anterior uveitis and endotheliitis.2,6 However, 0.15% GC gel, which is the only commercialized topical GC formulation, has limited efficacy because it achieves aqueous humor concentrations below the 50% inhibitory dose (ID50) that is required to inhibit CMV replication. 7 On the contrary, oral valganciclovir accompany potentially severe side effects such as renal dysfunction and hematological disturbance; therefore, it requires cautious use for long-term treatment. 8
Since repeated inflammation can lead to surgical intervention and ultimately to irreversible vision loss, maintaining effective intraocular drug levels is essential in managing CMV endotheliitis or anterior uveitis with frequent recurrences.9,10 To achieve higher intraocular concentrations, either intraocular injection or a higher-concentration topical formulation is required. However, GC has been reported to exhibit a potential cytotoxic effect in vitro model, including a delay in cell cycle, low proliferation rate, and increased number of apoptotic cells. 11 Regarding intracameral injection, corneal endothelial cell damage occurred after injection of 2% GC in rabbit eyes.
Several studies have reported the clinical effectiveness of 2% GC eye drop in preventing CMV-induced corneal endothelial cell loss, assisting IOP control, and preventing recurrence.9,12,13 As an alternative to invasive delivery, hospital-compounded 2% GC eye drop formulation, which are not commercially available, has been used for CMV endotheliitis and CMV-associated anterior uveitis. 2 A previous study has reported stability, safety, and ocular pharmacokinetics of 2% GC eye drops prepared from intravenous formulations, supporting their clinical feasibility for topical ocular administration. 14 However, the direct in vivo effects of 2% GC eye drops on corneal endothelial cells have not been studied yet. While topical administration of GC is generally considered safer than intravitreal and intracameral injection, its drug penetration according to varying concentrations and the potential toxicity at higher concentrations have not been fully elucidated.
Therefore, this study aimed to assess the aqueous humor concentration of GC using liquid chromatography-tandem mass spectrometry (LC-MS/MS) after topical administration at different concentrations and to investigate its potential toxicity, particularly its effect on the cornea and ocular surface.
Materials and Methods
Chemicals and reagents
Analytical standard of GC was purchased from MedChemExpress (Monmouth Junction, NJ, USA). Internal standards, including water and methanol, were purchased from Burdick & Jackson; dimethyl sulfoxide (DMSO) was purchased from Sigma Aldrich (St. Louis, MO, USA); and formic acid was purchased from Samchun Chemicals (Incheon, Korea).
Standards and quality control sample preparation
A stock solution of GC 0.0100 g in DMSO in a 10 mL volumetric flask to obtain a concentration of 1,000 ug/mL. The stock solution was serially diluted with water to prepare standard solutions at concentrations of 2, 5, 10, 50, 100, 500, 1,600, and 2,000 ng/mL. These solutions were used to establish the calibration curve for quantification. The stock solution was diluted with water to prepare quality control solutions at 6, 1,000, and 1,500 ng/mL. These solutions were used for method validation and sample analysis. Rabbit aqueous humor sample were analyzed without any pretreatment. Samples exceeding the upper limit of quantification were diluted with water prior to analysis to ensure accurate quantification. The relationship between GC and peak area was determined using weighted (1/x2) linear regression. Data processing and calculation were performed using SCIEX OS and Microsoft® Excel.
Chromatography and instrumentation
LC-MS/MS quantification of GC in rabbit aqueous humor was performed by the Korean Testing & Research Institute (KTR, Hwasun, Korea) using validated analytic protocols. LC analysis was performed on a SCL-40D X3 system (Shimadzu Co., Japan). Chromatographic separation was achieved using a C18 Synergi-Fusion-RP column (50 × 2 mm, 4 μm particle size; Phenomenex). The column oven was maintained at 30°C, and the autosampler was kept at 10°C. The mobile phase consisted of 0.1% formic acid in water (A) and 0.1% formic acid in methanol (B); the flow rate was set at 0.3 mL/min, with an injection volume of 2 uL. The following mobile phase gradient was used: Phase A was started at 95% for 0.2 min, then decreased to 5% from 0.2 to 3.0 min, after which it was returned to the initial composition and equilibrated until 4.5 min. Phase B was started at 5% and held for 0.2 min, then increased to 95% from 0.2 to 2.5 min, and maintained at 95% until 3.0 min, after which it was returned to the initial composition and equilibrated until 4.5 min.
MS analysis was performed using a QTRAP 5500 + system (AB SCIEX Co.) equipped with a turbo spray ion source. The electrospray ionization mode was applied, operating in positive ion mode. The ion source conditions were as follow: interface voltage, 5,000 V; gas temperature, 500°C. Quantification was conducted in multiple reaction-monitoring mode.
Linearity and calibration curve
Calibration curves were constructed by measuring standard solutions at each concentration level. The peak area of the analyte was used to determine the correlation coefficient (r2). The calibration curve was considered valid if the accuracy of each concentration should be within 15% (20% lower limit of quantification) of the theoretical concentration.
LOQ (limit of quantification)
The limit of quantification (LOQ) for GC was based on a signal-to-noise ratio of ≥10, was set at 2 ng/mL. Low-level GC signals detected in sterile water control samples were close to the assay’s lower LOQ and were considered attributable to analytical background or matrix-related effects rather than true drug exposure. Accordingly, background values measured in control samples were subtracted from all treatment groups during quantitative analysis.
Animal study
A total of 15 New Zealand white rabbits (male, 14 weeks, 2.0–2.5 kg) were enrolled and underwent pre-study screening with slit-lamp microscopy to exclude preexisting conjunctival inflammation, corneal epithelial defects, corneal opacity, or anterior chamber (AC) inflammation. Following confirmation of normal ocular status, rabbits were allocated to 5 groups (n = 3 for each group) using weight-based block randomization: 15 control group (normal saline), 0.15%, 2%, 4%, and 8% GC eyedrop group. GC eyedrop were prepared from GC powder in 20 mL of sterile water at 0.03g/20 mL, 0.4 g/20 mL, 0.8g/20 mL, and 1.6 g/20 mL. Representative images of GC solutions at each concentration were shown in Figure 1. GC eyedrops were administered to both eyes 4 times daily at 8:00 AM, 11:00 AM, 2:00 PM, and 3:00 PM for 10 days. Each administration consisted of 1 drop (∼50 uL) per eye. Aqueous humor samples were collected from both eyes after 2 h of final administration. AC paracentesis was performed with a 30-gauge needle introduced through the corneal limbus, and 0.1–0.15 mL of aqueous humor was removed from the AC. The samples were collected separately from each eye and immediately analyzed as independent samples without pooling using LC-MS/MS without additional processing.
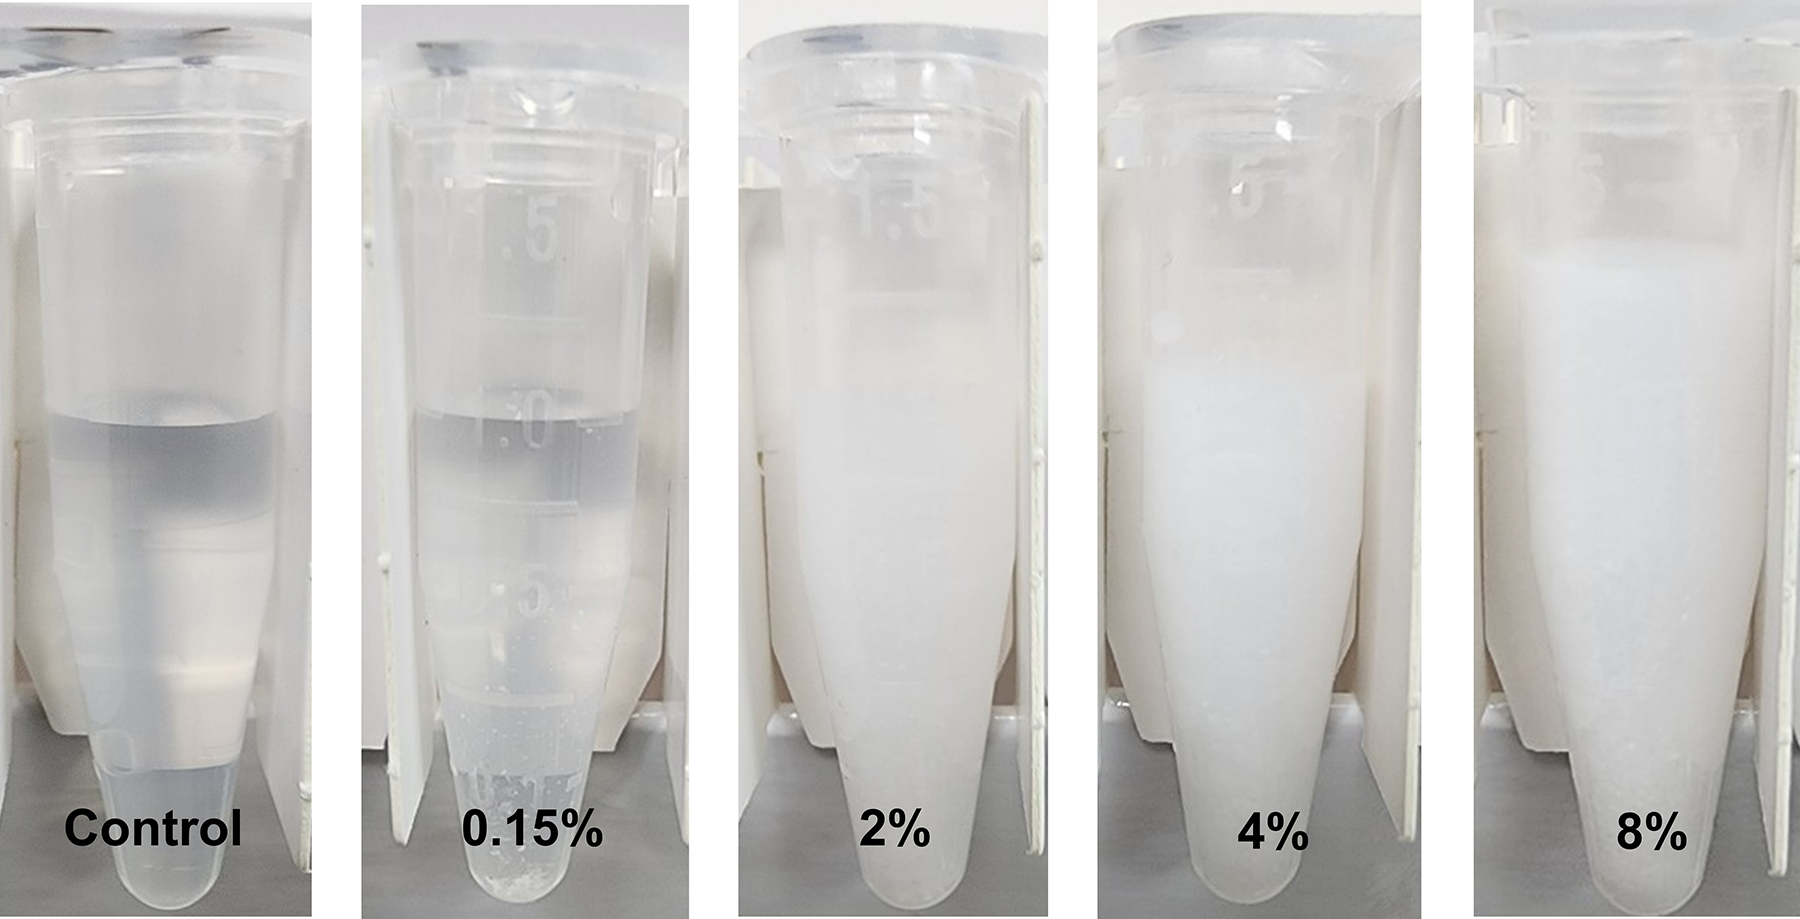
Representative images of ganciclovir (GC) solutions at different concentrations. Ganciclovir solutions prepared at 0.15%, 2%, 4%, and 8% concentrations. The solutions were presented to compare appearance and transparency at different concentration.
All procedures involving rabbits were conducted in strict adherence to the ARVO Statement on the Use of Animals in Ophthalmic and Vision Research. The study was carried out at Catholic university, Seoul, Korea, with the approval of the Institutional Animal Care and Use Committee (Approval No. CMCDJ-AP-2024-002) and ensuring the ethical treatment and housing of the animals throughout the research.
pH and osmolarity measurements
The pH of each formulation was measured using the RapidLab 348Ex analyzer (Siemens Healthineers, Germany). Osmolarity was measured using a freezing point osmometer (OsmoPro, Advanced Instruments, USA) according to the manufacturer’s instructions.
Intraocular pressure measurement
Prior to aqueous humor collection, IOP was measured in both eyes using a rebound tonometer (TonoVet, Icare, Finland). Each eye was measured 3 consecutive times, and the average value was recorded for analysis.
Ocular toxicity evaluation
Clinical grading of ocular toxicity was performed using slit-lamp microscopy on baseline and day 10. The eyes were evaluated according to a modified MacDonald-Shadduck (mMS) scoring system 16 and the Standardization of Uveitis Nomenclature (SUN) criteria. 17 Ocular surface toxicity was scored by the total of corneal opacification by severity (0 to +6), corneal opacification by surface area (0 to +4), corneal vascularization (0 to +2), conjunctival congestion (0 to +3), conjunctival chemosis (0 to +4), conjunctival discharge (0 to +3), and corneal staining (0 to +4). The AC inflammation was scored by AC cells and flared (0 to +4).
Specular microscopy
Specular microscopy (NPD3-1373, Konan medical, Japan) was performed to evaluate the corneal endothelium for cell density, morphology, and hexagonality following GC eyedrop administration. Rabbits were sacrificed using CO2 inhalation, following the AVMA guideline 2020. Both eyeballs were enucleated using sterile surgical techniques and conducted for immediate specular microscopy analysis. The studied parameters included endothelial cell density (cells/mm2), and corneal thickness (mm). The coefficient of variation (CV; SD of cell area/mean cell area) was used as a measure of polymegethism, and the percentage of hexagonal cells was used as an index of pleomorphism.
Scanning electron microscopy
A portion of the corneal tissue was excised and immediately fixed in 2.5% glutaraldehyde in 0.1M PB, washed 3 times with PBS, and then dehydrated through a graded series of ethanol. Critical point drying and gold coating were conducted to scanning electron microscopy (SEM) analysis. The samples were observed using SEM Regulus 8220 (Hitachi, Japan).
Transmission electron microscopy
For transmission electron microscopic (TEM) observations, the specimens were fixed in 2.5% glutaraldehyde in 0.1 M phosphate buffer (PB) for 12 h. After rinsing in 0.1M PB, the samples were post-fixed in 1% osmium tetroxide for 1 h. They were then dehydrated in a graded ethanol series (50, 70, 80, 90, 95, and 100%) for 10 min each, and resin infiltration was performed with ascending concentration of epoxy resin. The samples were embedded in resin and then polymerize it in a 60°C oven for 36 h. Ultrathin sections were cut on an ultramicrotome (Leica UC7, Germany) to a thickness of about 80 nm. The sectioned slices were collected on grids (200 mesh) and stained with 2% uranyl acetate and lead citrate. The prepared grids were examined in HT7800 TEM (Hitachi, Japan) operating at 80 kV.
Data Analysis
Kruskal–Wallis test was performed to compare the concentration of GC, toxicity scores, parameters of specular microscopy, and IOP among 5 groups. If a statistically significant difference was observed between groups (P < 0.05), pairwise comparisons between groups were conducted using the Mann–Whitney U test. A Bonferroni correction was applied to adjust for multiple comparisons, and a corrected P-value of P < 0.05/10 was considered statistically significant. All statistical analyses were performed using IBM SPSS Statistics (version 20.0, IBM Corp., Armonk, NY, USA). Data were presented as mean ± standard deviation (SD).
Results
Concentration of ganciclovir in aqueous humor
Mean concentrations of GC in rabbits’ aqueous humor are shown in Figure 2. The mean values (±SD) for each group were as follows: Control (0.52 ± 1.35 ng/mL), 0.15% GC group (40.75 ± 18.54 ng/mL), 2% GC group (287.66 ± 114.67 ng/mL), 4% GC group (855.70 ± 408.22 ng/mL), and 8% GC group (1916.85 ± 985.97 ng/mL). There were significant differences between the control group versus all other groups as well as the 0.15% GC group versus the 2%, 4%, and 8% GC groups (P < 0.005). Additionally, significant differences were observed between the 2% and 8% GC group (P = 0.004). Their findings showed that drug penetration of GC increased in a dose-dependent manner.
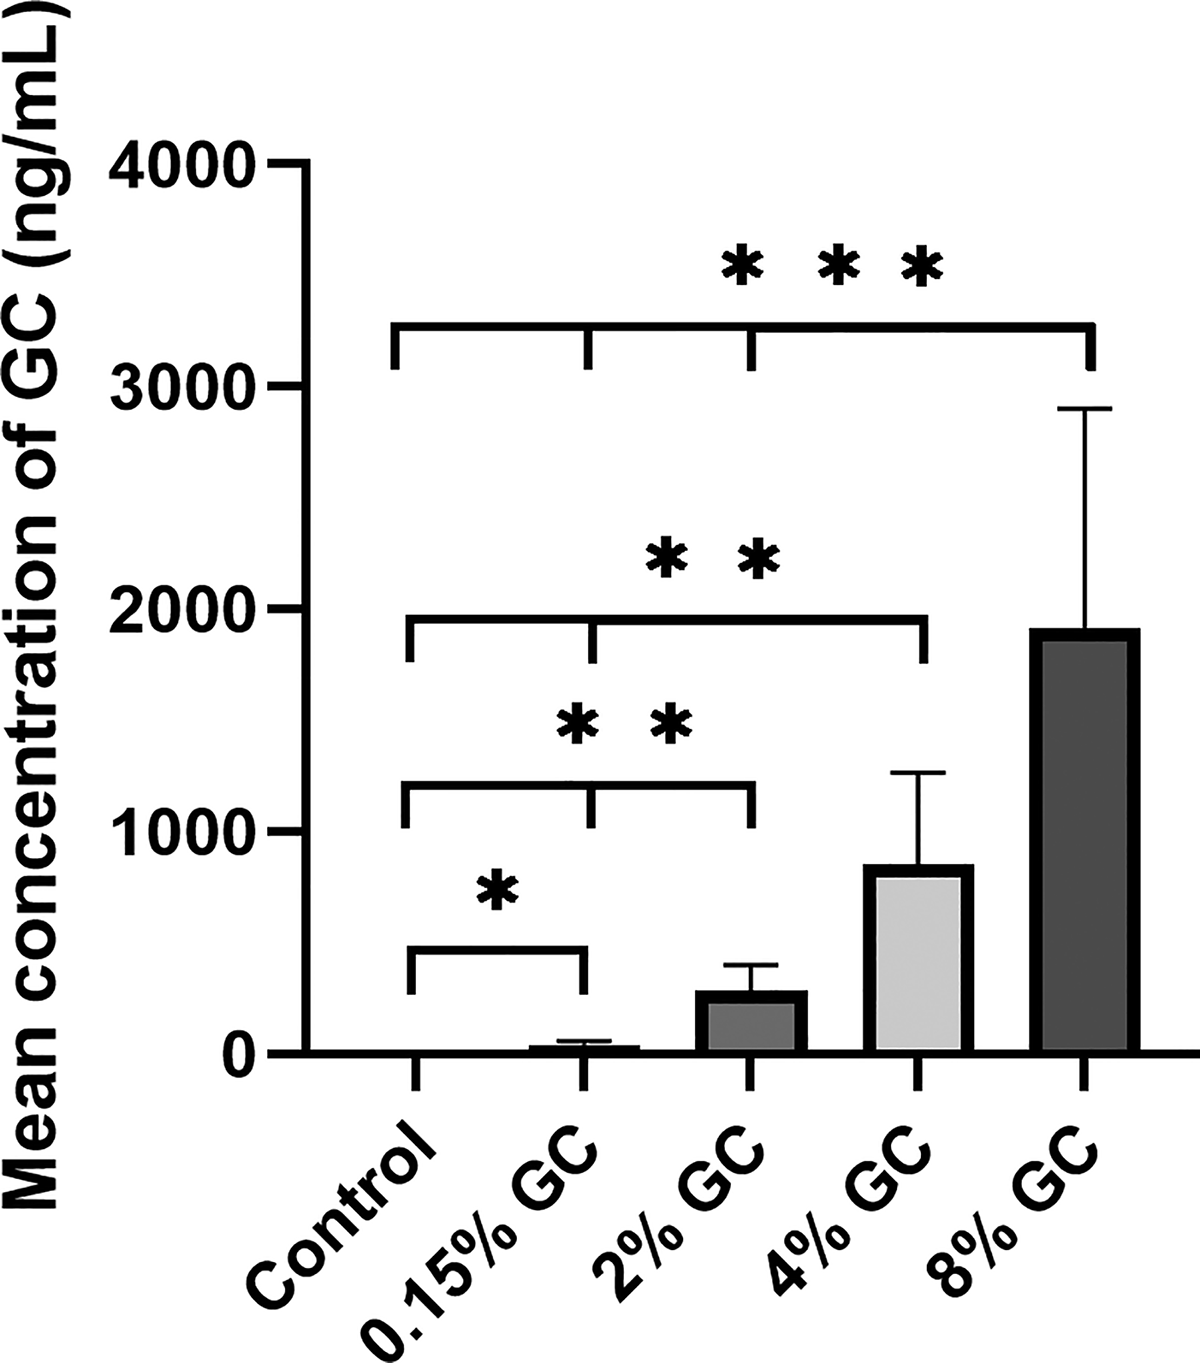
Concentration of ganciclovir in aqueous humor using mass spectrometry. The mean values (±SD) for each group were as follows: Control (0.52 ± 1.35 ng/mL), 0.15% GC group (40.75 ± 18.54 ng/mL), 2% GC group (287.66 ± 114.67 ng/mL), 4% GC group (855.70 ± 408.22 ng/mL), and 8% GC group (1916.85 ± 985.97 ng/mL). *P < 0.005, N = 6, values are mean ± SD and Mann–Whitney U test with Bonferroni correction was done.
pH and osmolarity measurements of each formulation
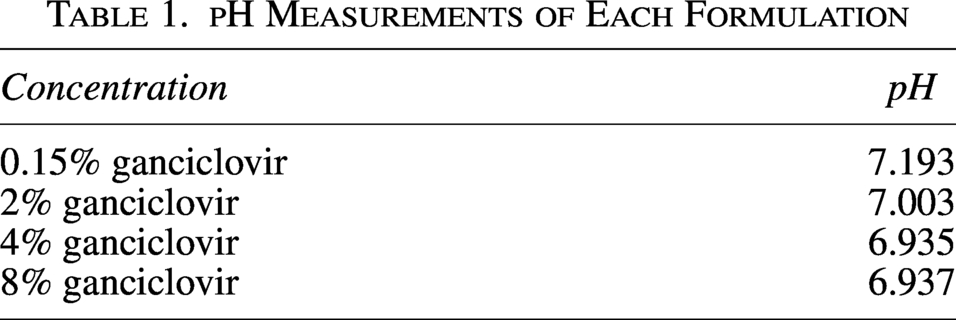
The pH was close to neutral in all GC formulations (Table 1). The osmolarity of all GC formulations was below the detection limit of the osmometer.
pH Measurements of Each Formulation
Ocular toxicity score
There were no cases of corneal opacity or AC inflammation in either group. The 2% GC and 8% GC group had significantly higher conjunctivitis score compared to the control group (P = 0.002, both). As shown in Figure 3, 8% GC treatment induced higher total ocular toxicity scores compared to the control, 0.15%, and 2% GC group (P < 0.001, 0.003, and 0.004, respectively). Detailed analyses of toxicity parameters by group and time point are presented in Supplementary Table S1 and Supplementary Figure S1. These results indicate a dose-dependent ocular surface toxicity of GC, with higher concentration leading to more severe conjunctival and eyelid irritation.
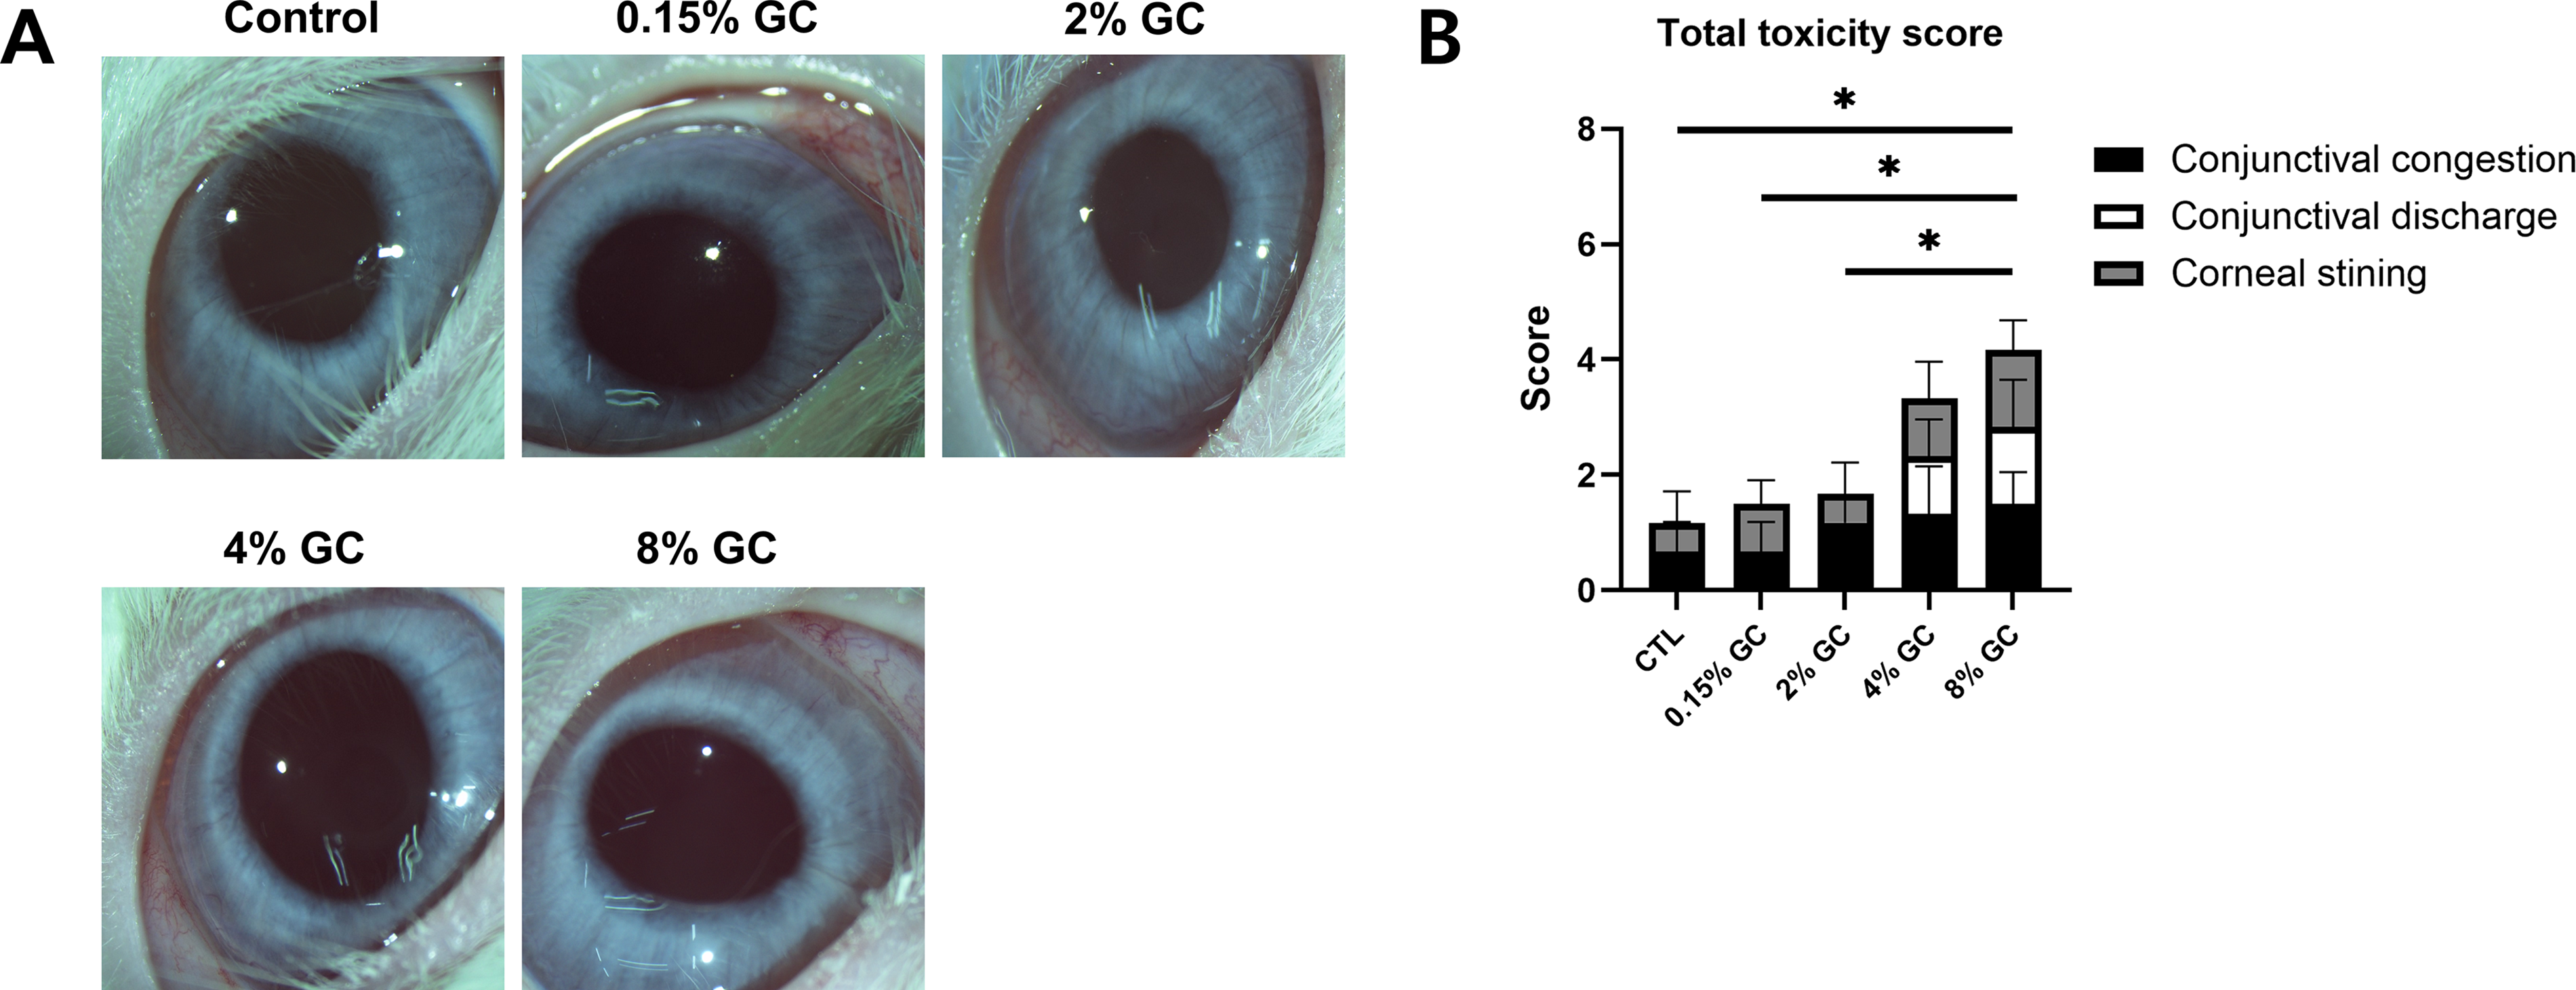
Clinical toxicity scores increased with increasing ganciclovir concentration. Total clinical toxicity scores rose with increasing concentrations, with the most pronounced ocular surface toxicity observed in the 8% group. Representative anterior segment pictures
Specular microscopy
There were no significant differences in endothelial cell density, coefficient of variation of cell area, hexagonality, and central corneal thickness among all groups (Fig. 4A). The representative specular microscopy images of the control group and 8% GC group are shown in Figure 4B.
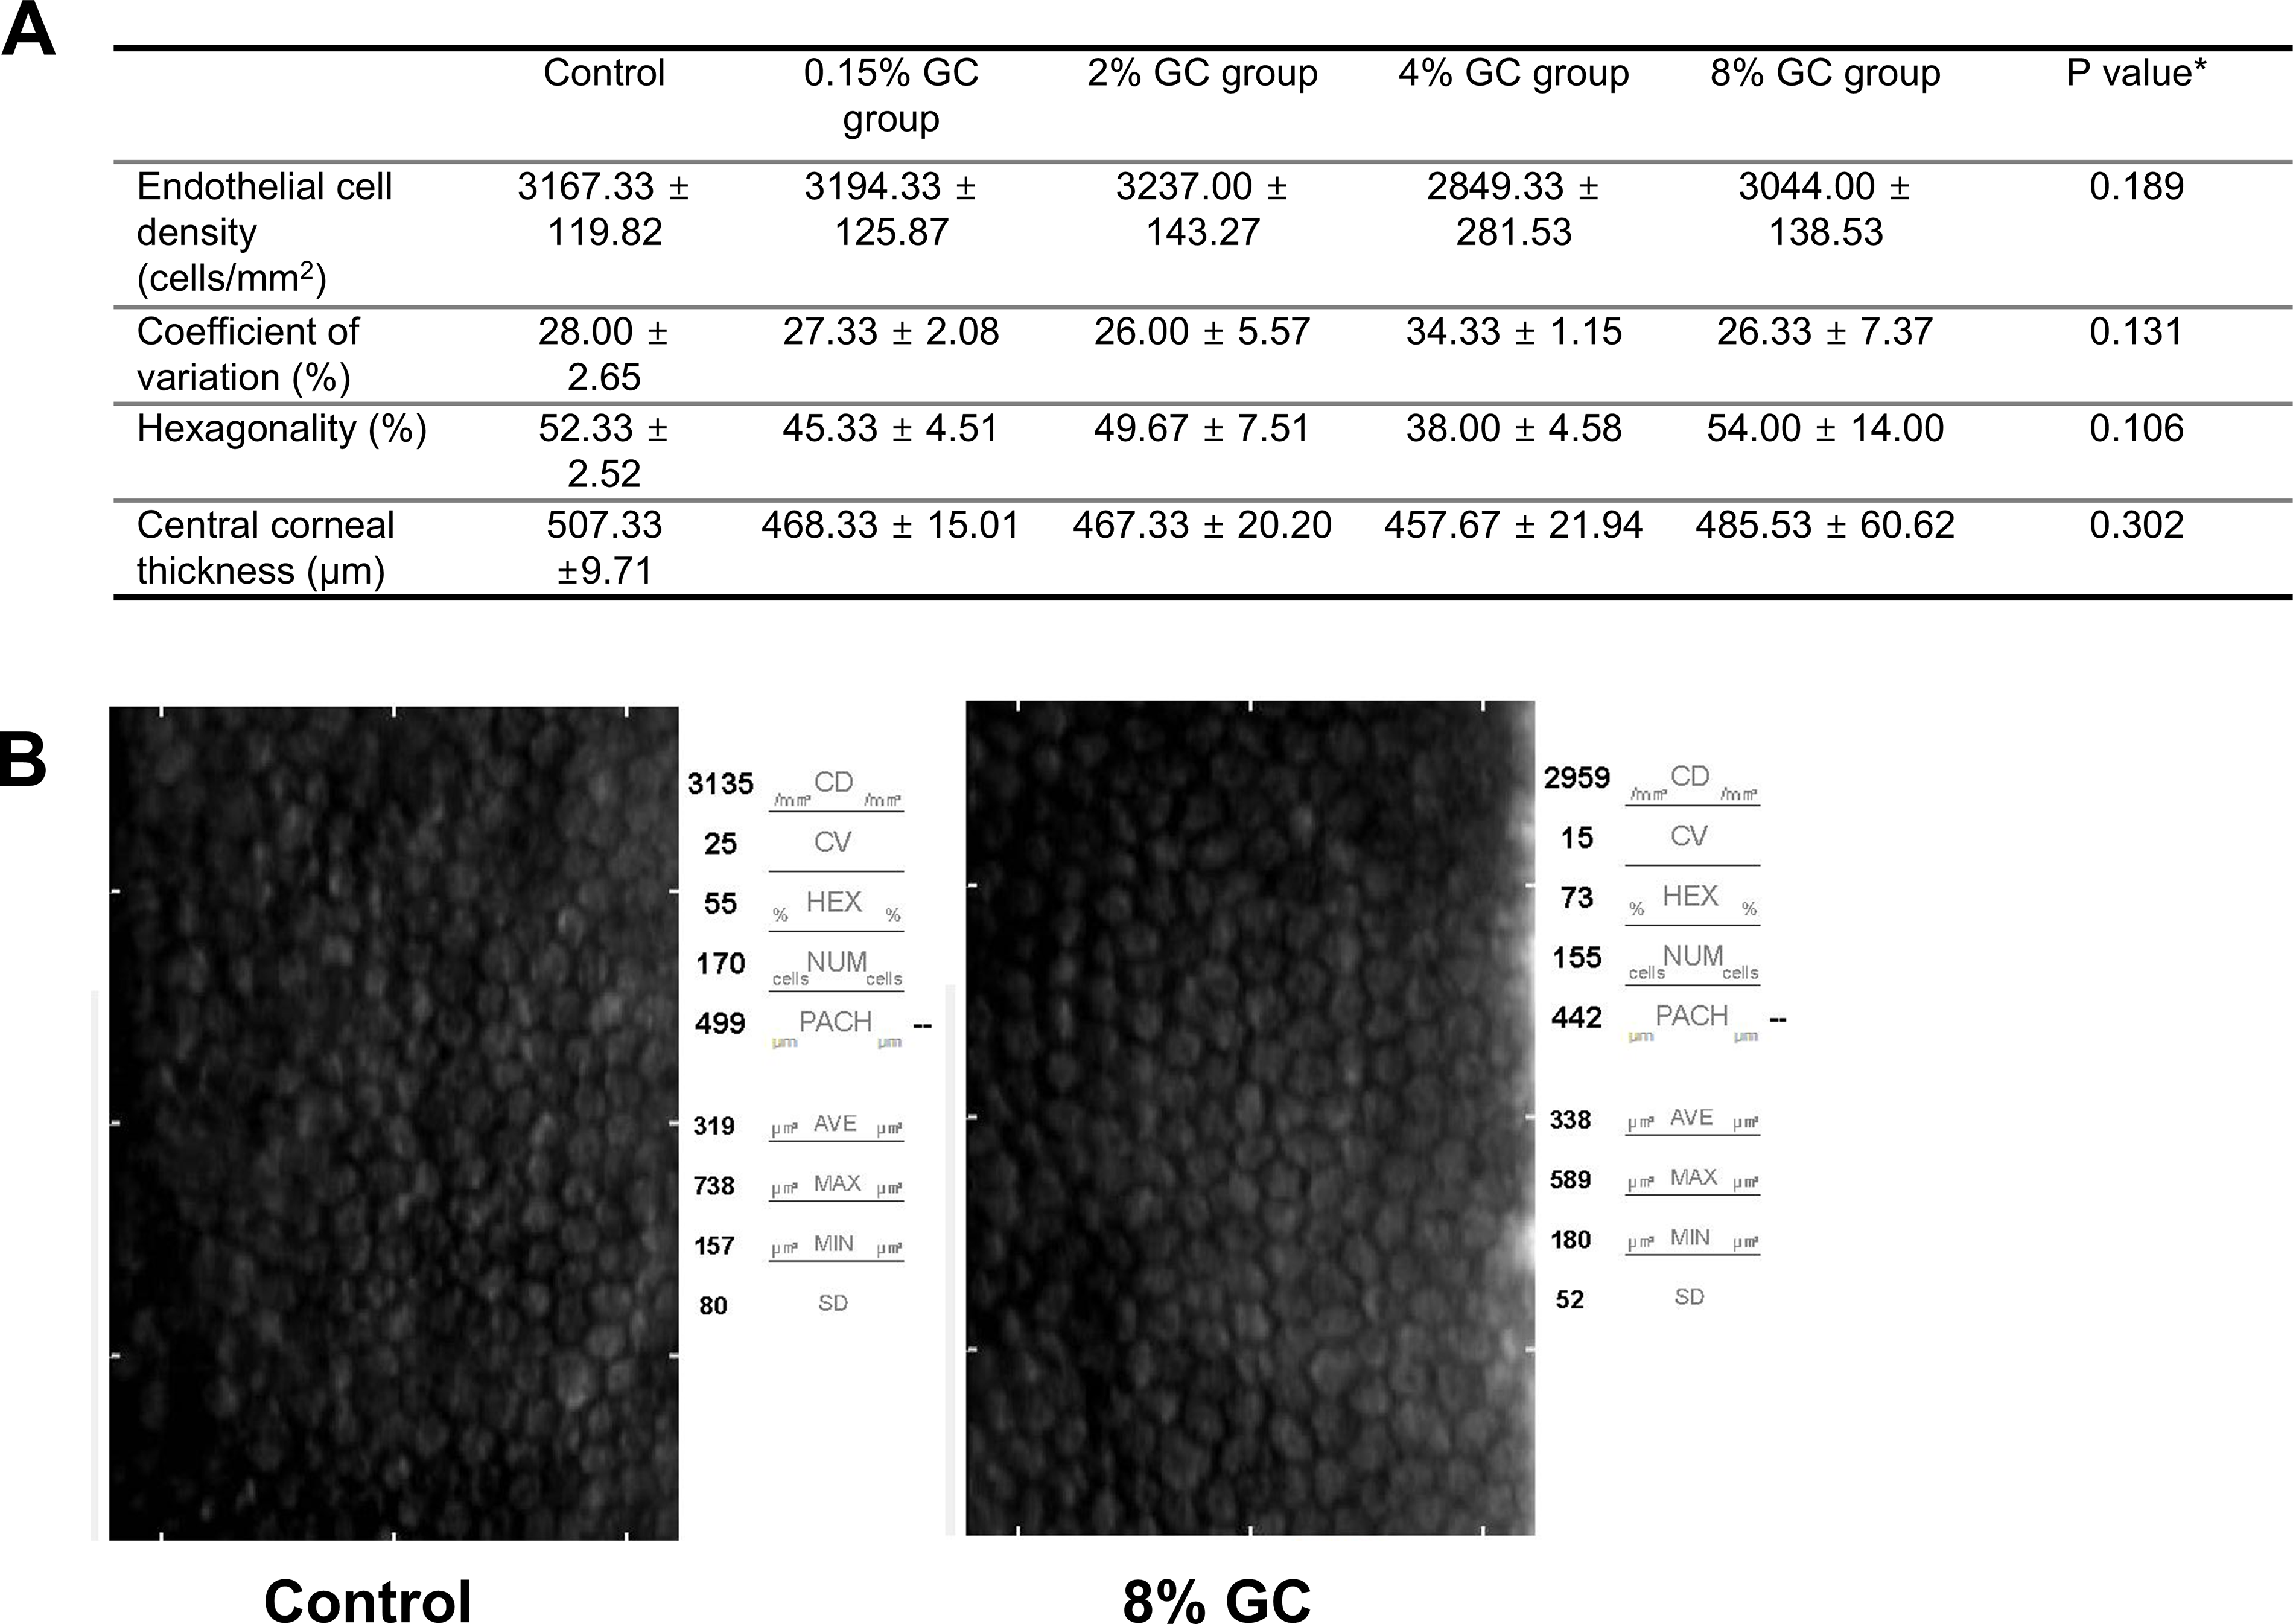
Corneal endothelial cells and central corneal thickness by specular microscopy in each group. Specular microscopy shows no significant differences in endothelial cell density, coefficient of variation of cell area, hexagonality, and central corneal thickness between the groups
Scanning electron microscopy
SEM analysis revealed no abnormalities in the corneal endothelium after different concentrations of GC instillation. Corneal endothelial cells exhibited normal cytoarchitecture with well-defined hexagonal boundaries and intact intercellular connections. The cells remained interconnected, and the microvilli on the cell surface appeared structurally intact. Representative images are shown in Figure 5(A–C).
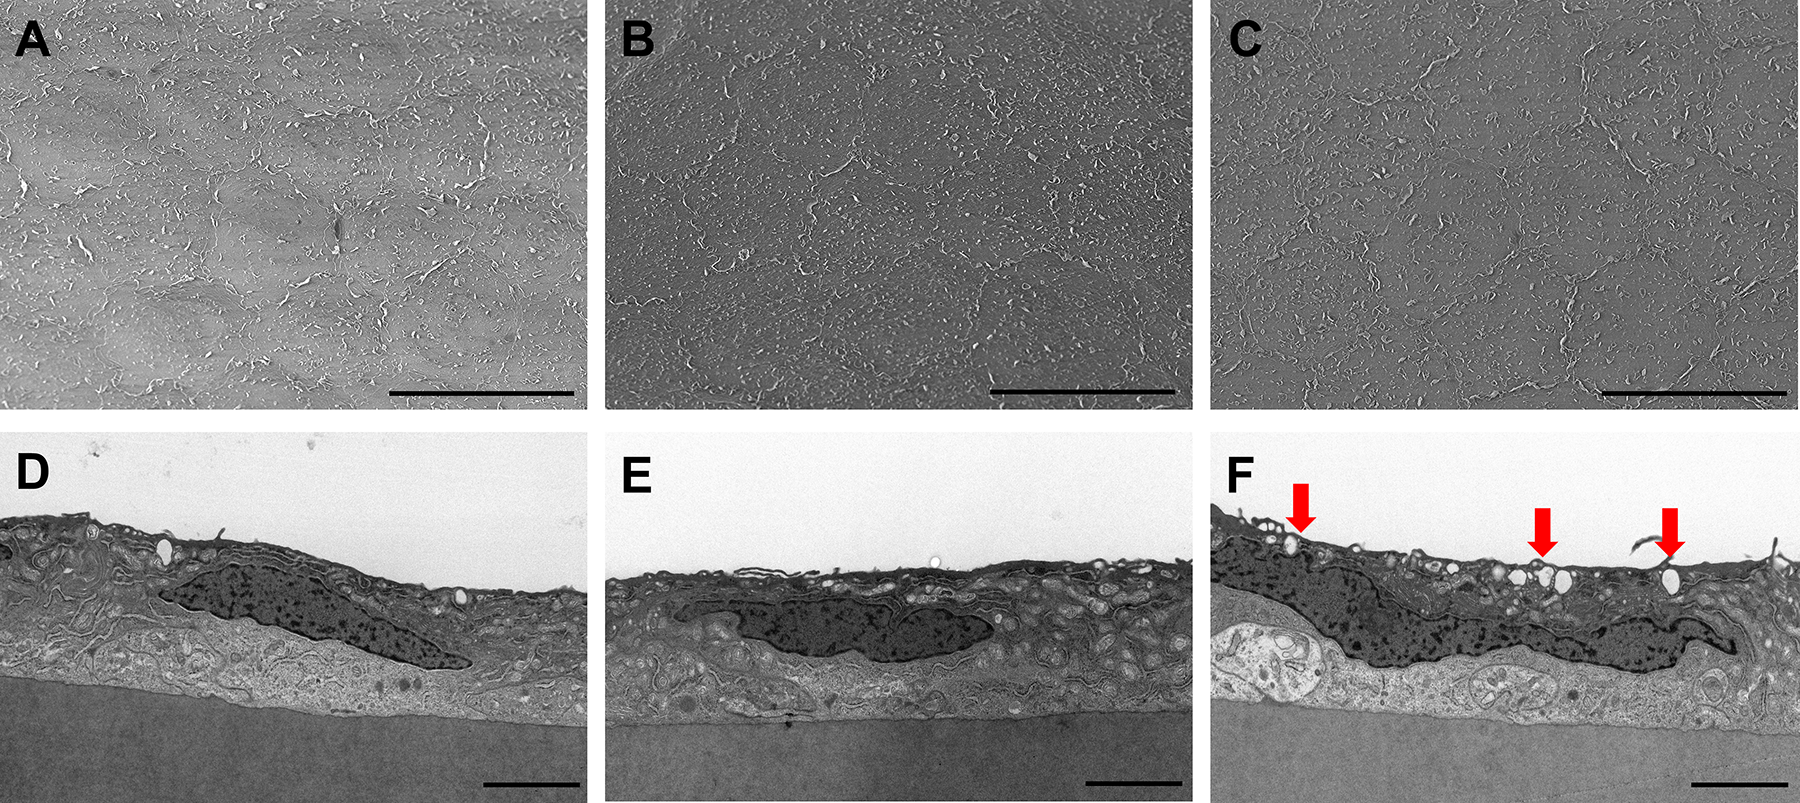
Representative scanning electron microscopy (SEM) and transmission electron microscopy (TEM) micrograph of the endothelial layer of rabbit eyes after administration of ganciclovir (GC) eyedrop. Scanning electron microscopy images of rabbit endothelial cells in control
Transmission electron microscopy
TEM examination showed preserved structure across all the corneal layers after different concentration of GC treatment. The corneal endothelial cells exhibited intact cellular morphology with well-formed intercellular junction. However, endothelial cells in the 8% GC group contained an increased number of intracellular vacuoles than those in the other groups. Representative images were shown in Figure 5 (D–F).
Intraocular pressure
There were no significant differences in IOP among all groups (Supplementary Table S2). GC treatment did not induce any notable changes in IOP.
Discussions
In the clinical management of CMV anterior uveitis, the 2% GC formulation is commonly and actively used. However, in refractory cases—characterized by frequent recurrences, progressive corneal endothelial cell loss, or uncontrolled IOP—higher concentrations may be required to achieve adequate therapeutic efficacy. Despite this clinical need, evidence supporting intraocular drug levels and safety at such concentrations has been lacking. To the best of our knowledge, this is the first in vivo study to systematically evaluate the ocular penetration and safety profile of higher-concentration topical GC formulations. In this study, we found that the aqueous humor concentrations measured after 10 days of topical GC administration demonstrated a dose-dependent relationship. Notably, the 2% group achieved approximately 7-fold higher concentrations compared to the 0.15% group (40.75 ± 18.54 ng/mL vs. 287.66 ± 114.67 ng/mL). The greater-than-dose-proportional increase in aqueous humor GC concentration may reflect nonlinear ocular surface absorption associated with increased concentration gradients and reduced relative loss from tear dilution at higher drug concentrations.18,19 The ID50 of GC for inhibiting in vitro replication of wild-type CMV strains was reported to be 250–1220 ng/mL. 20 Our study showed that the concentration of 0.15% GC group was less than ID50, which means that the commercially available 0.15% GC gel has limitations in effectively inhibiting CMV replication. Although higher concentrations of GC should be used for the treatment of CMV-associated ocular diseases, currently, there is no commercialized 2% GC formulation. Our study strongly provides the basis for establishing 2% GC eyedrops in terms of drug penetration and ocular safety, which have been used off-label,12,13 as a standardized therapeutic option.
Ocular toxicity score showed that no corneal opacity or AC reaction was observed in any group, but surface toxicity, such as conjunctival and corneal staining scores, was significantly increased as the GC concentration increased. In this study, the pH and osmolality of the prepared GC solutions were directly measured. The pH was close to neutral (Table 1), while the osmolarity was markedly low and below the measurable range of the osmometer. As shown in Figure 1, as the concentration increased, the solution became less transparent, and precipitation occurred. This suggests that hypo-osmolarity of the eye drops and drug crystals remaining in the eye may have caused ocular surface irritation. Drug formulation to reduce ocular surface irritation at higher concentrations needs to be explored in further studies.
Interestingly, there were no significant differences in endothelial cell density, pleomorphism, polymegethism, and central corneal thickness across all GC concentrations. These findings are consistent with previous reports that 2% GC for the treatment of CMV endotheliitis has a protective effect on the corneal endothelium,12,21 and suggest that high concentrations, such as 4% and 8% GC eyedrops can be used safely in terms of cornea. SEM revealed an intact hexagonal cell border, and TEM showed no differences compared to the control or 2% GC group, except for increased vacuoles in the 8% group. This finding was considered to be a mild cellular stress, 22 and further studies are needed to determine whether repeated, long-term administration of high-dose GC may exacerbate these changes.
In this study, GC solution was prepared by dissolving pure GC powder in sterile water without adding a buffer or osmotic agent. At all test concentrations, the pH was maintained at 6.9–7.2, and the osmolarity was below the measurable detection range under the experimental conditions. This differs from the results of a previous study using GC for intravenous infusion, in which the osmolarity of the 0.5% solution was 310.33 ± 0.47 mOsm/kg, and that of the 1.0% solution was 334.33 ± 0.47 mOsm/kg. 14 Despite the low osmolarity of this sterile water-based formulation, no corneal structural toxicity was observed, including the sterile water control group. This may be explained by the reduced degree and duration of osmotic stress due to rapid dilution of the solution by the tear film and short residence time on the ocular surface. Furthermore, corneal epithelial cells possess intrinsic regulatory mechanisms that allow recovery from transient osmotic imbalance. 23 Nevertheless, subtle functional changes in the ocular surface barrier cannot be completely ruled out, and future studies using drug with appropriate physicochemical properties to minimize these effects will be needed.
Clinically, achieving effective drug concentration is essential for managing patients with CMV endotheliitis or anterior uveitis with frequent recurrences, since chronic recurrences could result in corneal endothelial cell loss, glaucomatous damage and increased likelihood of requiring glaucoma surgery.9,10 In our study, we found that the concentration of 2% (287.66 ± 114.67 ng/mL), 4% (855.70 ± 408.22 ng/mL) and 8% (1916.85 ± 985.97 ng/mL) exceeded the reported ID50 range for CMV (250–1220 ng/mL). 20 Given the broad variability in the ID50 range, higher-concentration GC formulation may be considered in patients with recurrent or refractory disease, tailored to clinical severity and risk of recurrence.
GC is a nucleoside analog of guanosine that competitively inhibits the incorporation of dGTP by viral DNA polymerase. 24 Although GC inhibits herpes-virus-encoded DNA polymerase more effective than cellular DNA polymerase, it can induce cellular toxicity through inhibition of cellular DNA polymerases, DNA breakage, and induced apoptosis. 25 In vitro study reported that GC induced dose-dependent cytotoxicity in human corneal endothelial cells, leading to cell cycle delay, suppression of proliferation, and elevated apoptosis. 11 In addition, direct intracameral injection of 2% GC in rabbit eyes resulted in retinal edema and corneal endothelial cell damage. 26 On the contrary, in our in vivo study, no significant cellular toxicity to corneal endothelial cells was detected in microscopic analysis even at higher topical concentrations. Our results suggest that topical GC at concentrations between 2% and 4% may provide sufficient drug penetration for CMV suppression, while preserving ocular safety. These results demonstrate that 2% and 4% topical GC are potential alternative to 0.15% GC gel and oral valganciclovir in terms of intraocular drug delivery, systemic safety, and cost-effectiveness.
This study has several limitations. First, the sample size was small, which may limit statistical power. Second, the GC administration period was 10 days, which limits the ability to determine the long-term effects of high-dose GC on corneal toxicity. Third, the frequency of GC administration was 4 times a day, which may affect the results depending on the frequency of administration. Finally, baseline corneal endothelial cell density and IOP were not measured. Although all eyes were confirmed to be normal before treatment based on the slit-lamp microscopic examination according to a modified MacDonald-Shadduck scoring system and the SUN criteria, the absence of prestudy specular microscopy limited the ability to compare endothelial cell changes over time.
In conclusion, this study demonstrated that topical administration of GC at a concentration greater than 2% resulted in effective intraocular penetration. Ocular surface toxicity increased with increasing concentration, especially in the 8% GC group, but no structural damage to corneal endothelial cells was observed. These results suggest that topical 2% GC eye drop may be effective in the treatment of CMV-associated anterior uveitis and endotheliitis, providing a balance between efficacy and safety. Additionally, our study suggests that 4% GC eye drop can be used in recurrent or refractory patients without concerns about safety.
Authors’ Contributions
J.A.C.: Conceptualization. J.A.C.: Methodology. J.A.C. and J.L.: Investigation. J.A.C. and J.L.: Writing—original draft. J.A.C. and J.L.: Writing—review and editing. J.A.C.: Supervision.
Footnotes
Acknowledgment
LC-MS/MS quantification of GC was performed by Korean Testing & Research Institute (KTR, Hwasun, Korea) using validated analytic protocols.
Osmolarity and pH measurements of GC solution were performed by the Advanced Process Development Team (Osong Medical Innovation Foundation, Cheongju, Korea) using validated analytic protocols.
Funding Information
This research was supported by St. Vincent’s Hospital, Research Institute of Medical Science Foundation (SVHR-2025-06) and Daejon St. Mary’s Hospital, Clinical Research Institute Grant (CMCDJ-P-2025-003).
Supplemental Material
References
Supplementary Material
Please find the following supplemental material available below.
For Open Access articles published under a Creative Commons License, all supplemental material carries the same license as the article it is associated with.
For non-Open Access articles published, all supplemental material carries a non-exclusive license, and permission requests for re-use of supplemental material or any part of supplemental material shall be sent directly to the copyright owner as specified in the copyright notice associated with the article.