






Abstract
Purpose:
Glaucoma, a multifactorial ocular neuropathy, can lead to irreversible vision loss. Diagnosis involves assessing optic cupping (increased cup-to-disc ratios) and structural changes (like retinal nerve fiber layer thinning) through clinical imaging. Elevated intraocular pressure (IOP) is commonly associated with glaucoma but is not universally present. However, understanding disease progression is hindered by limited access to donor ocular tissue and consistent clinical data. We hypothesized that the proteomes of aqueous humor (AH) and plasma may be altered in disease and correlate with clinical parameters such as IOP and cup-to-disc ratios.
Methods:
AH and plasma samples were collected from 36 glaucoma patients (17 male, 19 female) and 35 nonglaucomatous control patients (16 male, 19 female) undergoing cataract surgery. Protein profiles was compared using the SOMAscan® assay system for proteome profiling. From glaucomatous donors, correlations between IOP and cup-to-disc ratios to proteome differences were determined.
Results:
Overall proteomics profiles between both AH and plasma were compared by combining all samples (glaucoma and nonglaucoma) and then performing correlation analyses. This study revealed similar protein abundance in the two biological fluids. Additionally, it identified different abundance of proteins in plasma and AH between glaucoma and nonglaucoma samples. The differential proteins identified were involved in pathways related to vascular integrity, inflammation, immune response, cell adhesion, and complement activation. Generally, glaucomatous AH showed higher protein levels. Neurofilament light chain protein correlated with elevated IOP and inflammatory markers but not with cup-to-disc ratio.
Conclusions:
Together, our data demonstrate that the proteins identified in this study from glaucomatous donors correspond to markers of neurodegeneration and those that may inhibit cell proliferation or disrupt vascular integrity.
Introduction
Primary open-angle glaucoma (POAG) is one of the leading causes of irreversible blindness and is estimated to affect 111.8 million people worldwide by 2040.1,2 Although the etiology and progression of POAG are multifactorial, the only modifiable causal risk factor for managing visual field loss is to reduce intraocular pressure (IOP), which is demonstrated to slow the progression of damage to the optic nerve and death of retinal ganglion cells. 3 IOP is largely determined by the balance between aqueous humor (AH) production and resistance to outflow.4,5 In the human eye, ∼75% of all AH flows from the anterior chamber through the trabecular meshwork (TM) and Schlemm’s canal (SC),6,7 and is thus the primary egress for aqueous humor. 8 Increased resistance to aqueous drainage due to changes in TM cells and extracellular matrix (ECM) is considered a major contributor to ocular hypertension (OHT).9,10 Differential profiles and levels of soluble factors have been identified in the AH, which have the potential to affect cells in the tissues (outflow tract) that they traverse through, and thus influence OHT.
AH is secreted into the posterior chamber by the nonpigmented epithelial cells of the ciliary processes. Although the total amount of protein in the anterior chamber is <1% (w/v) due to the functional blood–aqueous barrier, 4 AH is enriched with proteins secreted by intraocular structures from both the anterior and posterior segments. 11 It is thus reasonable to hypothesize that systemic disorders, genetic conditions, or perturbations to ocular integrity and health may adversely influence expression of proteins in the AH and other ocular tissues. 12 Disease associations of protein compositions of tear films, AH, and vitreous humors have been observed with dry eye, glaucoma, age-related macular degeneration, or other pathologies,13–18 although very few studies have correlated these findings with clinically relevant parameters.
Several studies have demonstrated differences in the metabolites and proteomes of the AH in patients with POAG and have subsequently posited that these may serve as biomarkers of dysfunction in the outflow apparatus.16,19–29 Proteomic analysis of AH reveals significant protein expression differences between cataract and POAG patients. Multiple studies report that dozens to hundreds of proteins are differentially expressed in POAG, involving pathways such as oxidative stress, inflammation, lipid metabolism, ECM regulation, and neural degeneration.30–41 Key findings from these various studies identify several proteins in the complement cascade, apolipoproteins, and antioxidant defense, suggesting immune involvement and metabolic stress in POAG.
For the aforementioned investigations, complementary approaches were used to quantify protein expression in AH samples from glaucomatous donors, including enzyme-linked immunosorbent assay, multiplexed immunoassays, liquid chromatography–mass spectrometry (LC-MS)/MS, and antibody microarrays. Limitations in quantifying proteins/metabolites include the small volume and low protein concentration of AH, alongside the need for validated antibody-based methods, which may restrict biomarker identification. Thus, more sensitive methods are needed to broadly identify AH proteins to find disease progression biomarkers when comparing pre- and posttreatment stages. Discovering new proteins in the AH of patients could indeed shed light on the molecular mechanisms behind outflow resistance in OHT and glaucoma. Overall, while these proteomic changes provide insight into POAG mechanisms and support biomarker development, limited studies 42 have performed direct comparisons between plasma and AH or with clinical parameters such as IOP or cup-to-disc ratios. Others have suggested that differences in proteome profiling within POAG populations may enable subgrouping to identify POAG severity, 43 though these studies lacked clinical correlation. We hypothesize that proteins secreted into the AH and plasma of patients with glaucoma differ from nonglaucomatous individuals and are associated with clinically relevant parameters. Here, we utilize the SOMAscan® assay, 44 a highly multiplexed, aptamer-based technology, to detect and assess relative abundance of a broad range of proteins from small volumes of human blood alongside AH from patients undergoing glaucoma surgery, as compared to controls patients subject to cataract surgery.
Methods
Study population
The study was approved by the ethics committee investigational review board (CEP 1.209.725) and adhered to the principles of the Declaration of Helsinki. Informed consent was obtained from all participants. AH and plasma samples were collected from 32 glaucoma patients (16 males, 16 females) and 35 cataract control patients (16 males, 19 females) undergoing cataract surgery (Fig. 1). The control cohort underwent clinical examinations (e.g., elevated IOP, optic nerve head changes, or uveitis) to rule out any glaucoma-related findings as part of the inclusion/exclusion criteria. Within the glaucoma patient group, one underwent trabeculectomy, two were pseudophakic, and AH samples were collected at the beginning of surgery. Clinical diagnosis of glaucoma was based on elevated IOP (IOP > 21 mm Hg) and documented progressive cupping or thinning of the neuroretinal rim. All glaucoma patients were treated with medication to control IOP. Patients with other eye diseases or systemic diseases were excluded. Our study is exploratory in nature, and the primary focus is the proteomic analysis of plasma and AH samples from the study participants. As such, data about the glaucoma patients in this study will be limited to the existing inclusion criteria and general demographic information. Additional longitudinal clinical data, including summary statistics of Humphrey Visual Field (HVF), glaucoma phenotype, number of medications, etc., were unavailable and thus not being reported here for this study. All donor metadata, including IOP, cup to disc ratios, and visual acuity, are provided in Supplementary Table S1.
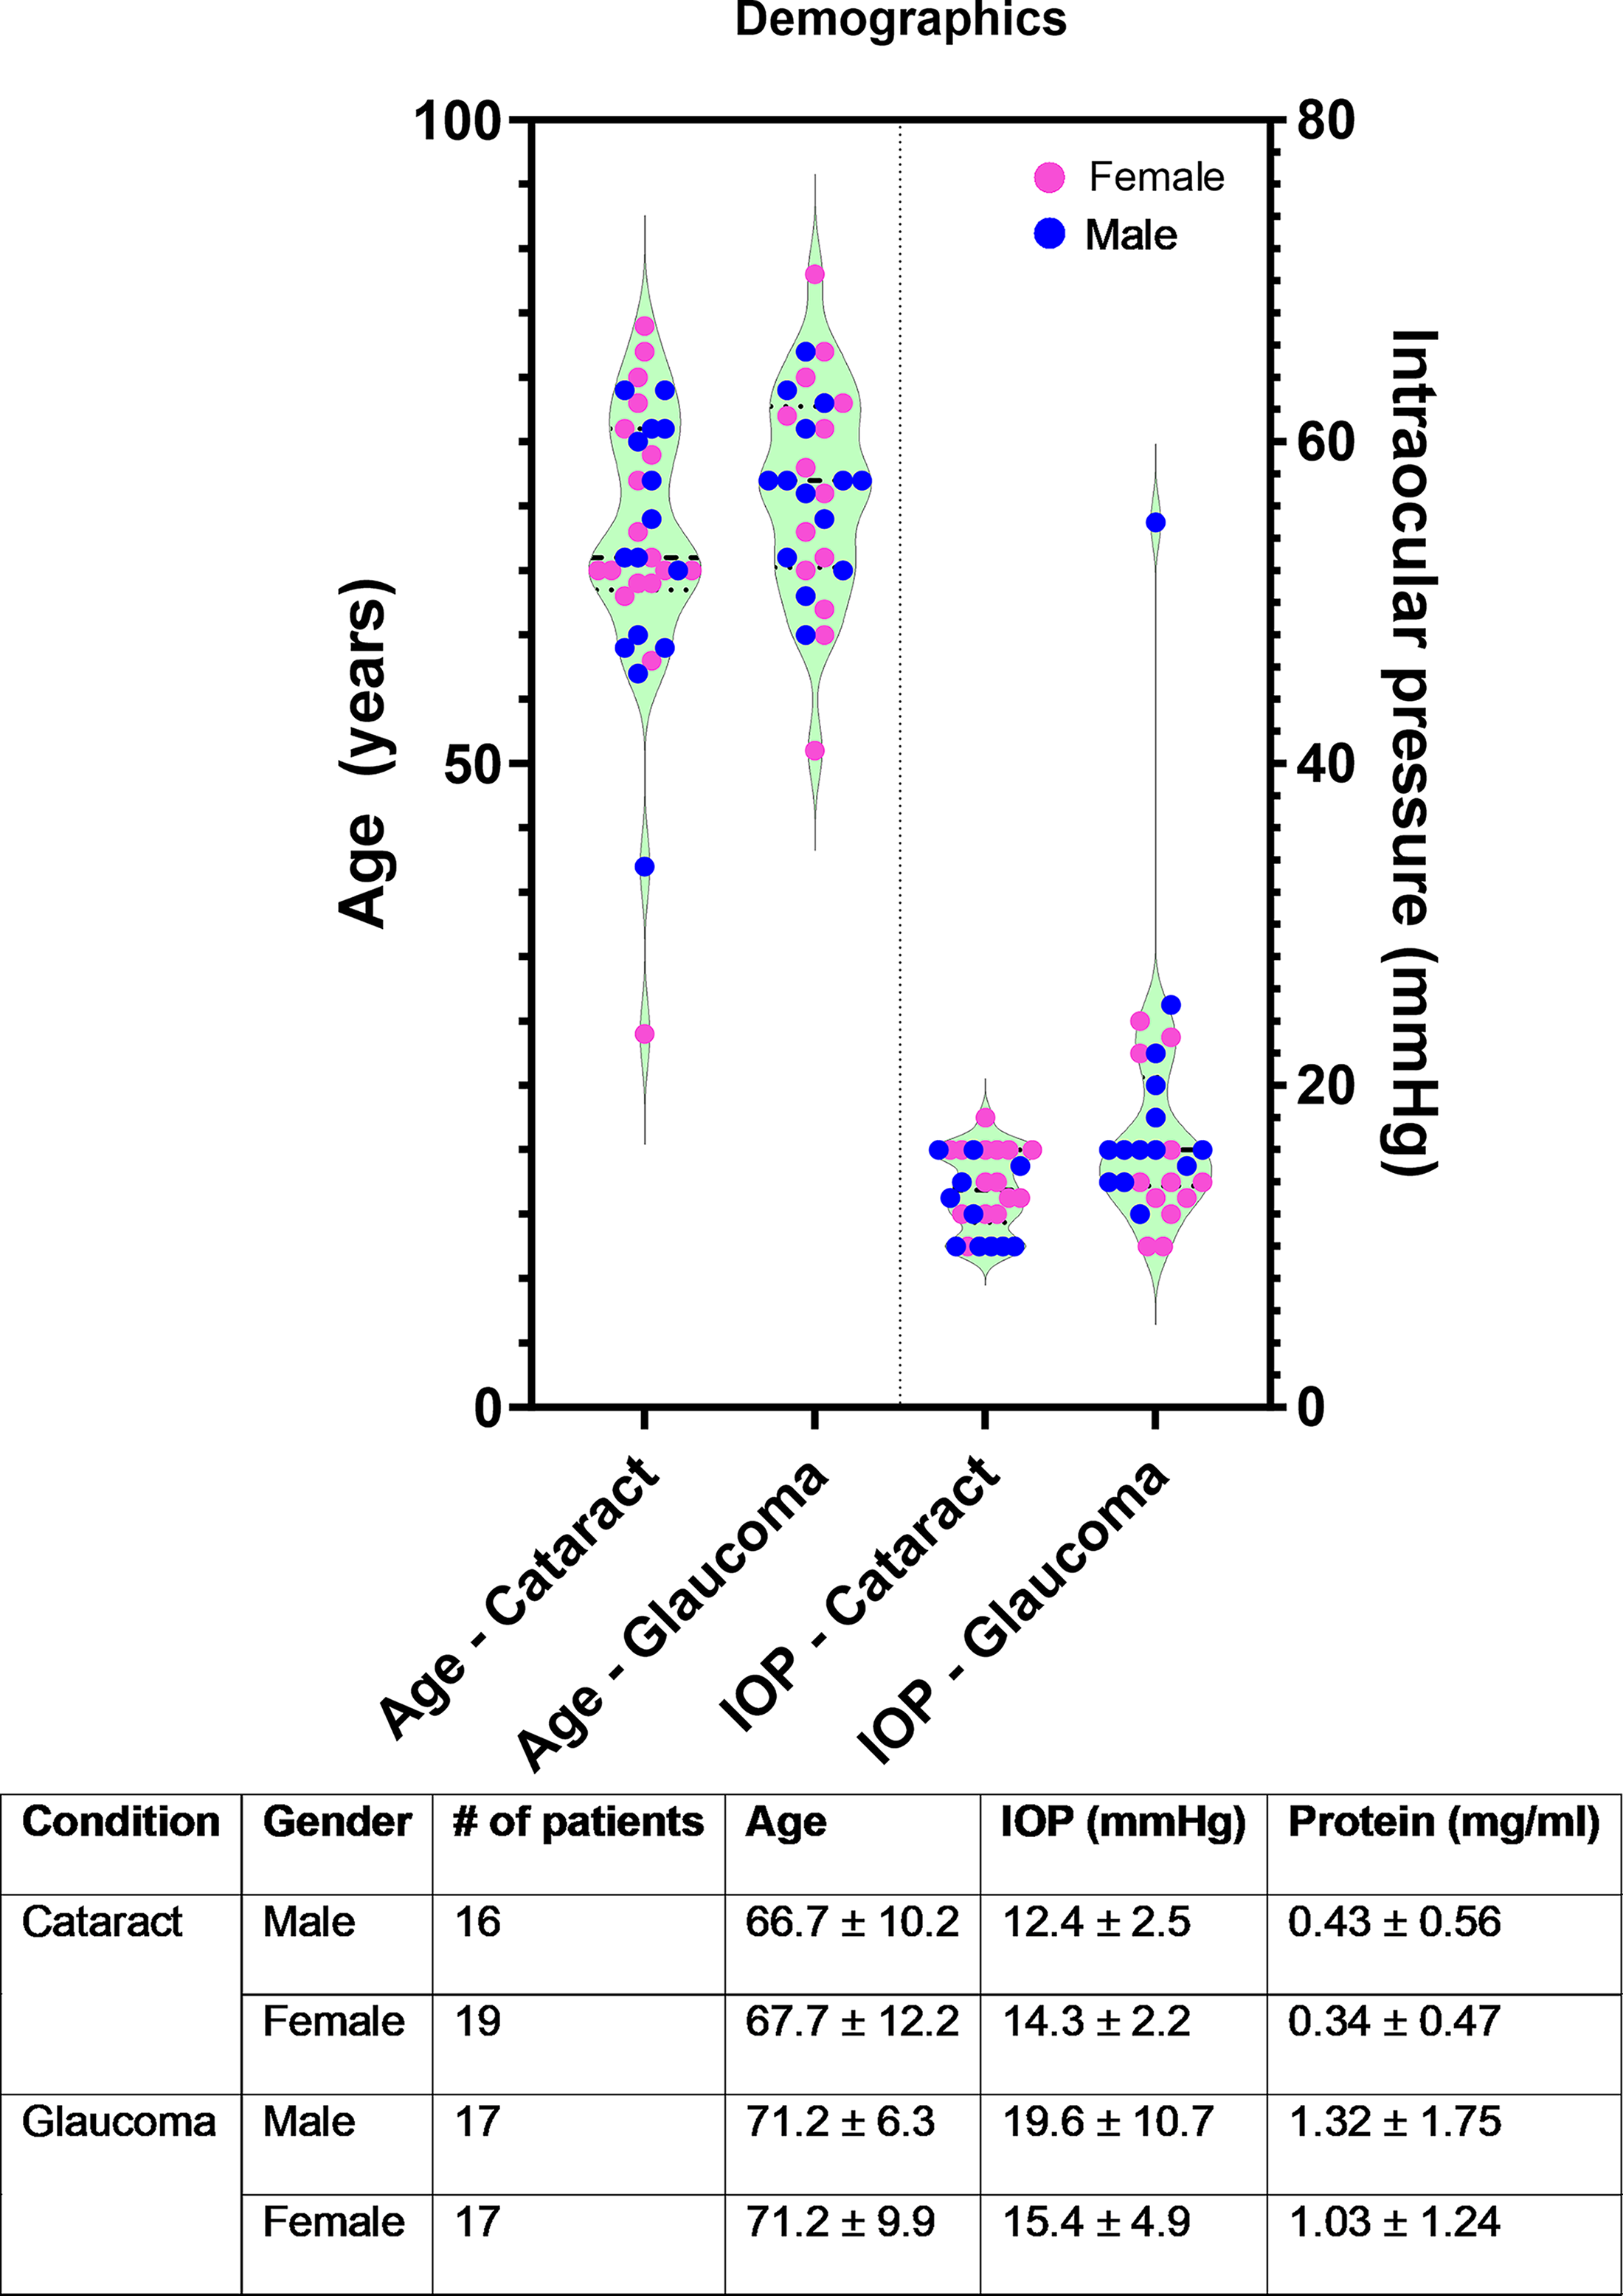
Patient demographics demonstrating that study participants were age- and sex-matched. Intraocular pressures and protein concentrations from AH are reported for both glaucomatous and nonglaucomatous donors. AH, aqueous humor.
Aqueous humor and plasma sample collection
AH samples were collected from patients following a previously validated method 45 at the beginning of the surgery. Briefly, after anesthetic and antiseptic eyedrops administration, a 1 mL tuberculin syringe (27-gauge, half inch) was used to aspirate the AH. Approximately 0.1 mL of AH was collected and transferred into two labeled Eppendorf tubes. Peripheral blood (10 mL) was collected from an arm of the patient into EDTA tubes during surgery. The tubes were centrifuged for 10 min at 1,900g, and plasma was collected. Total protein concentrations in AH samples were determined using the BCA Protein Assay Kit (Pierce, Rockford, IL).
SOMAscan analysis
All AH and plasma samples were analyzed in parallel using the SOMAscan proteome profiling platform, which provides a broad, relative abundance assessment of selected proteins in biological fluids. The SOMAscan platform, which uses affinity-based slow off-rate modified aptamers (SOMAmers), has been described extensively elsewhere.44,46,47 The custom SOMAscan version used in this study covered 5,080 SOMAmers, including 4,785 human-specific SOMAmers targeting 4,161 human proteins. Evidence supporting SOMAmer endogenous antigen annotation, including SOMAmer validation by proteogenetic evidence, mass spectrometry detection, or orthogonal assay concordance, where known, are provided in the referenced studies.48–66 The targeted proteins included transmembrane receptors, secreted proteins, kinases, transcription regulators, and signal transducers. Samples (55 µL) were aliquoted into 2D-barcoded tubes and were shipped on dry ice to SomaLogic for analysis.
Statistical analysis
The relative abundance of captured SOMAmers were quantified by microarray hybridization and reported as relative fluorescence units (RFU). The annotations for the SOMAmers and log2(RFU) for all samples analyzed are provided in Supplementary Table S2. Quality control and sample outlier detection were conducted using the arrayQualityMetrics, 67 as well as by running principal component analysis (PCA) and Spearman’s correlation analysis with custom R scripts. RFU were log2-transformed and normalized using smooth quantile normalization with the R package qsmooth. 68 In total, five samples (two nonglaucomatous and three glaucoma) were removed from the AH cohort, and two nonglaucomatous samples were removed from the plasma cohort, which left 62 samples in the AH cohort and 65 samples in the AH cohort. The exclusion of these five AH samples was based on an unbiased statistical outlier analysis (Supplementary Fig. S1) and are thus not presented in subsequent analysis. We applied the limma R package (v3.50.3) in R 4.1.0 environment to determine differentially expressed proteins between groups. 69 Pathway enrichment analysis was performed using preranked gene set enrichment analysis with R package fgsea v1.20.0 and the Gene Ontology Biological Process category from MSigDB.70–73
Correlation analysis
We conducted Elastic Net, a machine learning-based method, to identify proteins correlated with total protein concentration. For this analysis, we utilized the cv.glmnet function from the R package glmnet v4.1-3. We employed 10-fold cross-validation approach to optimize the alpha and lambda parameters.74,75 Additionally, we performed 1,000-fold bootstrapping using the optimized alpha and lambda values to determine the frequency with which each protein was selected as a top predictor for estimating the total protein concentration. To enhance the performance of our analysis, we only included proteins with an absolute Pearson’s correlation coefficient >0.4 with the total protein concentration.
Results
Donor demographics
Donor demographics for the patient samples used in this study are provided in Fig. 1. The average age of donors with cataracts was 66.9 ± 10.9 years, whereas those with glaucoma was 68.41 ± 12.84 years. No significant differences (P = 0.60, t-test; Fig. 1) were seen in donor ages between the groups in toto or when evaluated by sex. Among these donors, we note that one donor had primary angle-closure glaucoma, whereas the remaining donors had POAG. The mean IOP of glaucoma donors (IOP controlled with medication) was 17.94 ± 8.28 mm Hg, with no differences seen between male or female donors. Only one POAG donor had an IOP > 24 mm Hg. A statistically significant difference in total protein concentration in AH was observed between the cataract and glaucoma groups (cataract: 0.383 ± 0.505 mg/mL; glaucoma: 1.17 ± 1.48 mg/mL). Visual acuity and cup-to-disc ratios of POAG donors are listed in the donor metadata in Supplementary Table S1.
Differential analysis of SOMAScan® profiling data
PCA of the cataract and glaucoma samples revealed heterogeneity between samples, including outliers that were subsequently excluded from further analysis. Subsequent analyses revealed few differences in protein levels between nonglaucomatous and glaucomatous AH and plasma samples (Supplementary Fig. S1). Nevertheless, we observed that samples were clustered by tissue types with reasonable correlation (r > 0.5) between AH and plasma samples (Fig. 2a). The histogram (Fig. 2b) demonstrates that the distribution of Pearson’s correlation coefficients between AH and plasma samples from the same donor demonstrates some variability. Considering all donors, a reasonable correlation (r > 0.5) was observed comparing protein levels between AH and plasma samples.
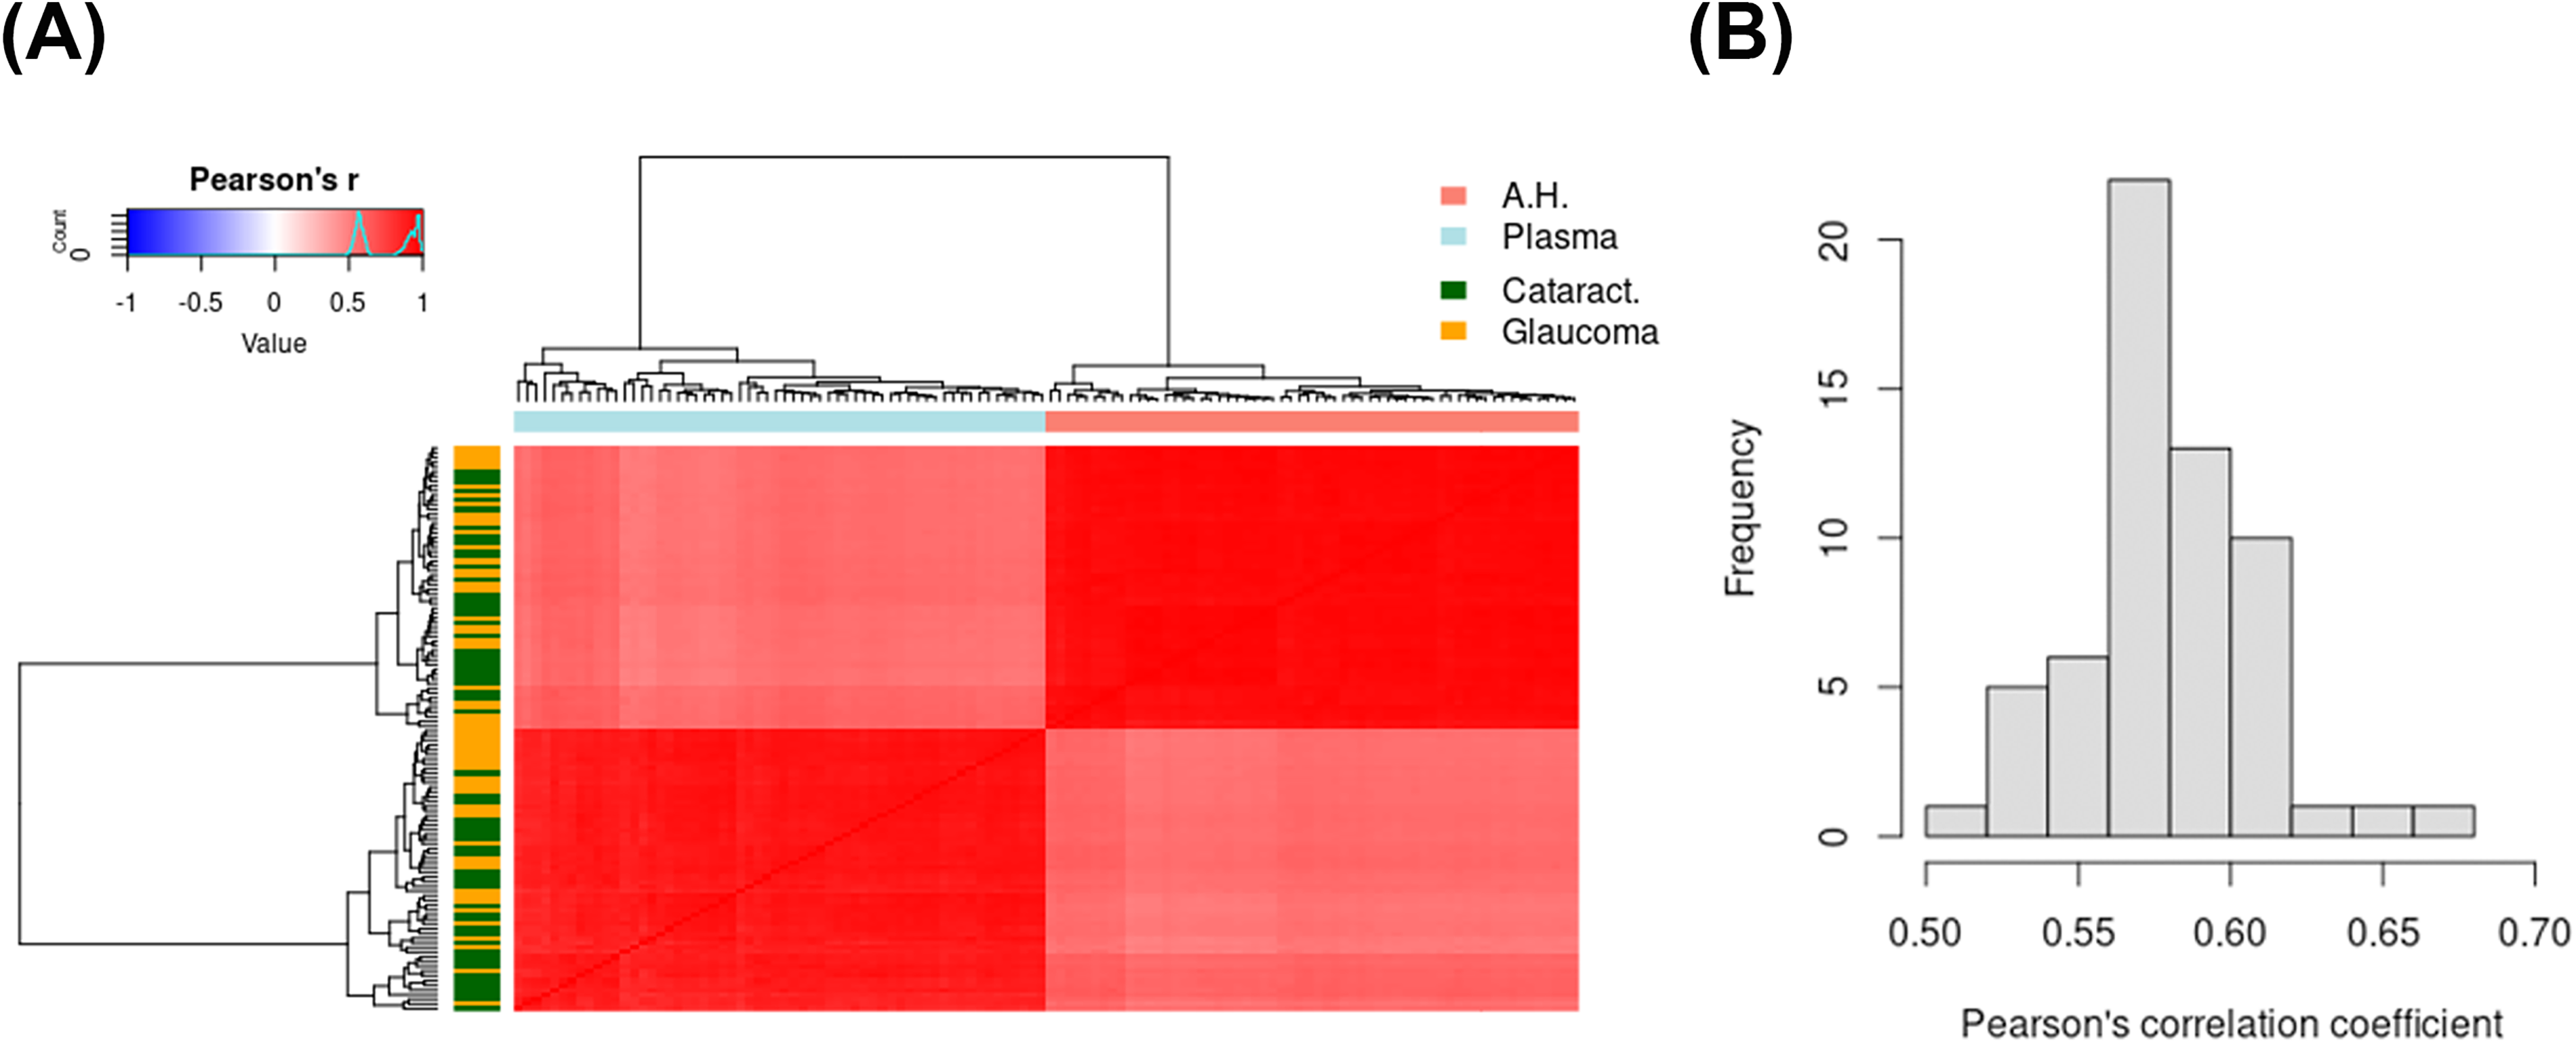
Proteins identified in AH and plasma clustered by type of biofluid, and appear to correlate reasonably well as evidenced by Spearman’s correlation.
Subsequent to multivariate analysis, we performed differential protein analysis for both plasma and aqueous samples. Expression values that were |log2(RFU)| > 0.5 and where the adjusted P value was < 0.05 are highlighted as significant (Fig. 3). Within glaucomatous AH (Fig. 3A), seven SOMAmer probes representing six target proteins were observed to be significantly down regulated, while 49 SOMAmer probes representing 49 target proteins were upregulated. Examples of top upregulated proteins include complement proteins (C3, C7, C1QTNF3), Apolipoprotein (APOE, APOF), matrix proteins (endostatin/Col18A1), macrophage associated proteins (CSF1R, CD163), whereas top downregulated proteins include growth factors such as FGF9, FGF20, and CCK. We observed that in plasma samples (Fig. 3B), the majority of the differential proteins were upregulated in glaucoma. Some of the upregulated proteins of interest include ENO1, NEK7, AKT, PRKCA, PRKCB, JAK2, and MAP kinase-activated protein kinase 2 (MAPKAPK2), whereas the top downregulated proteins include APOC3, GDF2, DCP1B, and EDIL3. A comprehensive list of proteins altered in their levels comparing glaucomatous and nonglaucomatous plasma and AH samples are provided in Supplementary Table S1. Although protein levels in AH and plasma from the same donor showed a positive correlation, we only observed SNX4 to be significantly upregulated in both AH and plasma samples from glaucomatous donors.
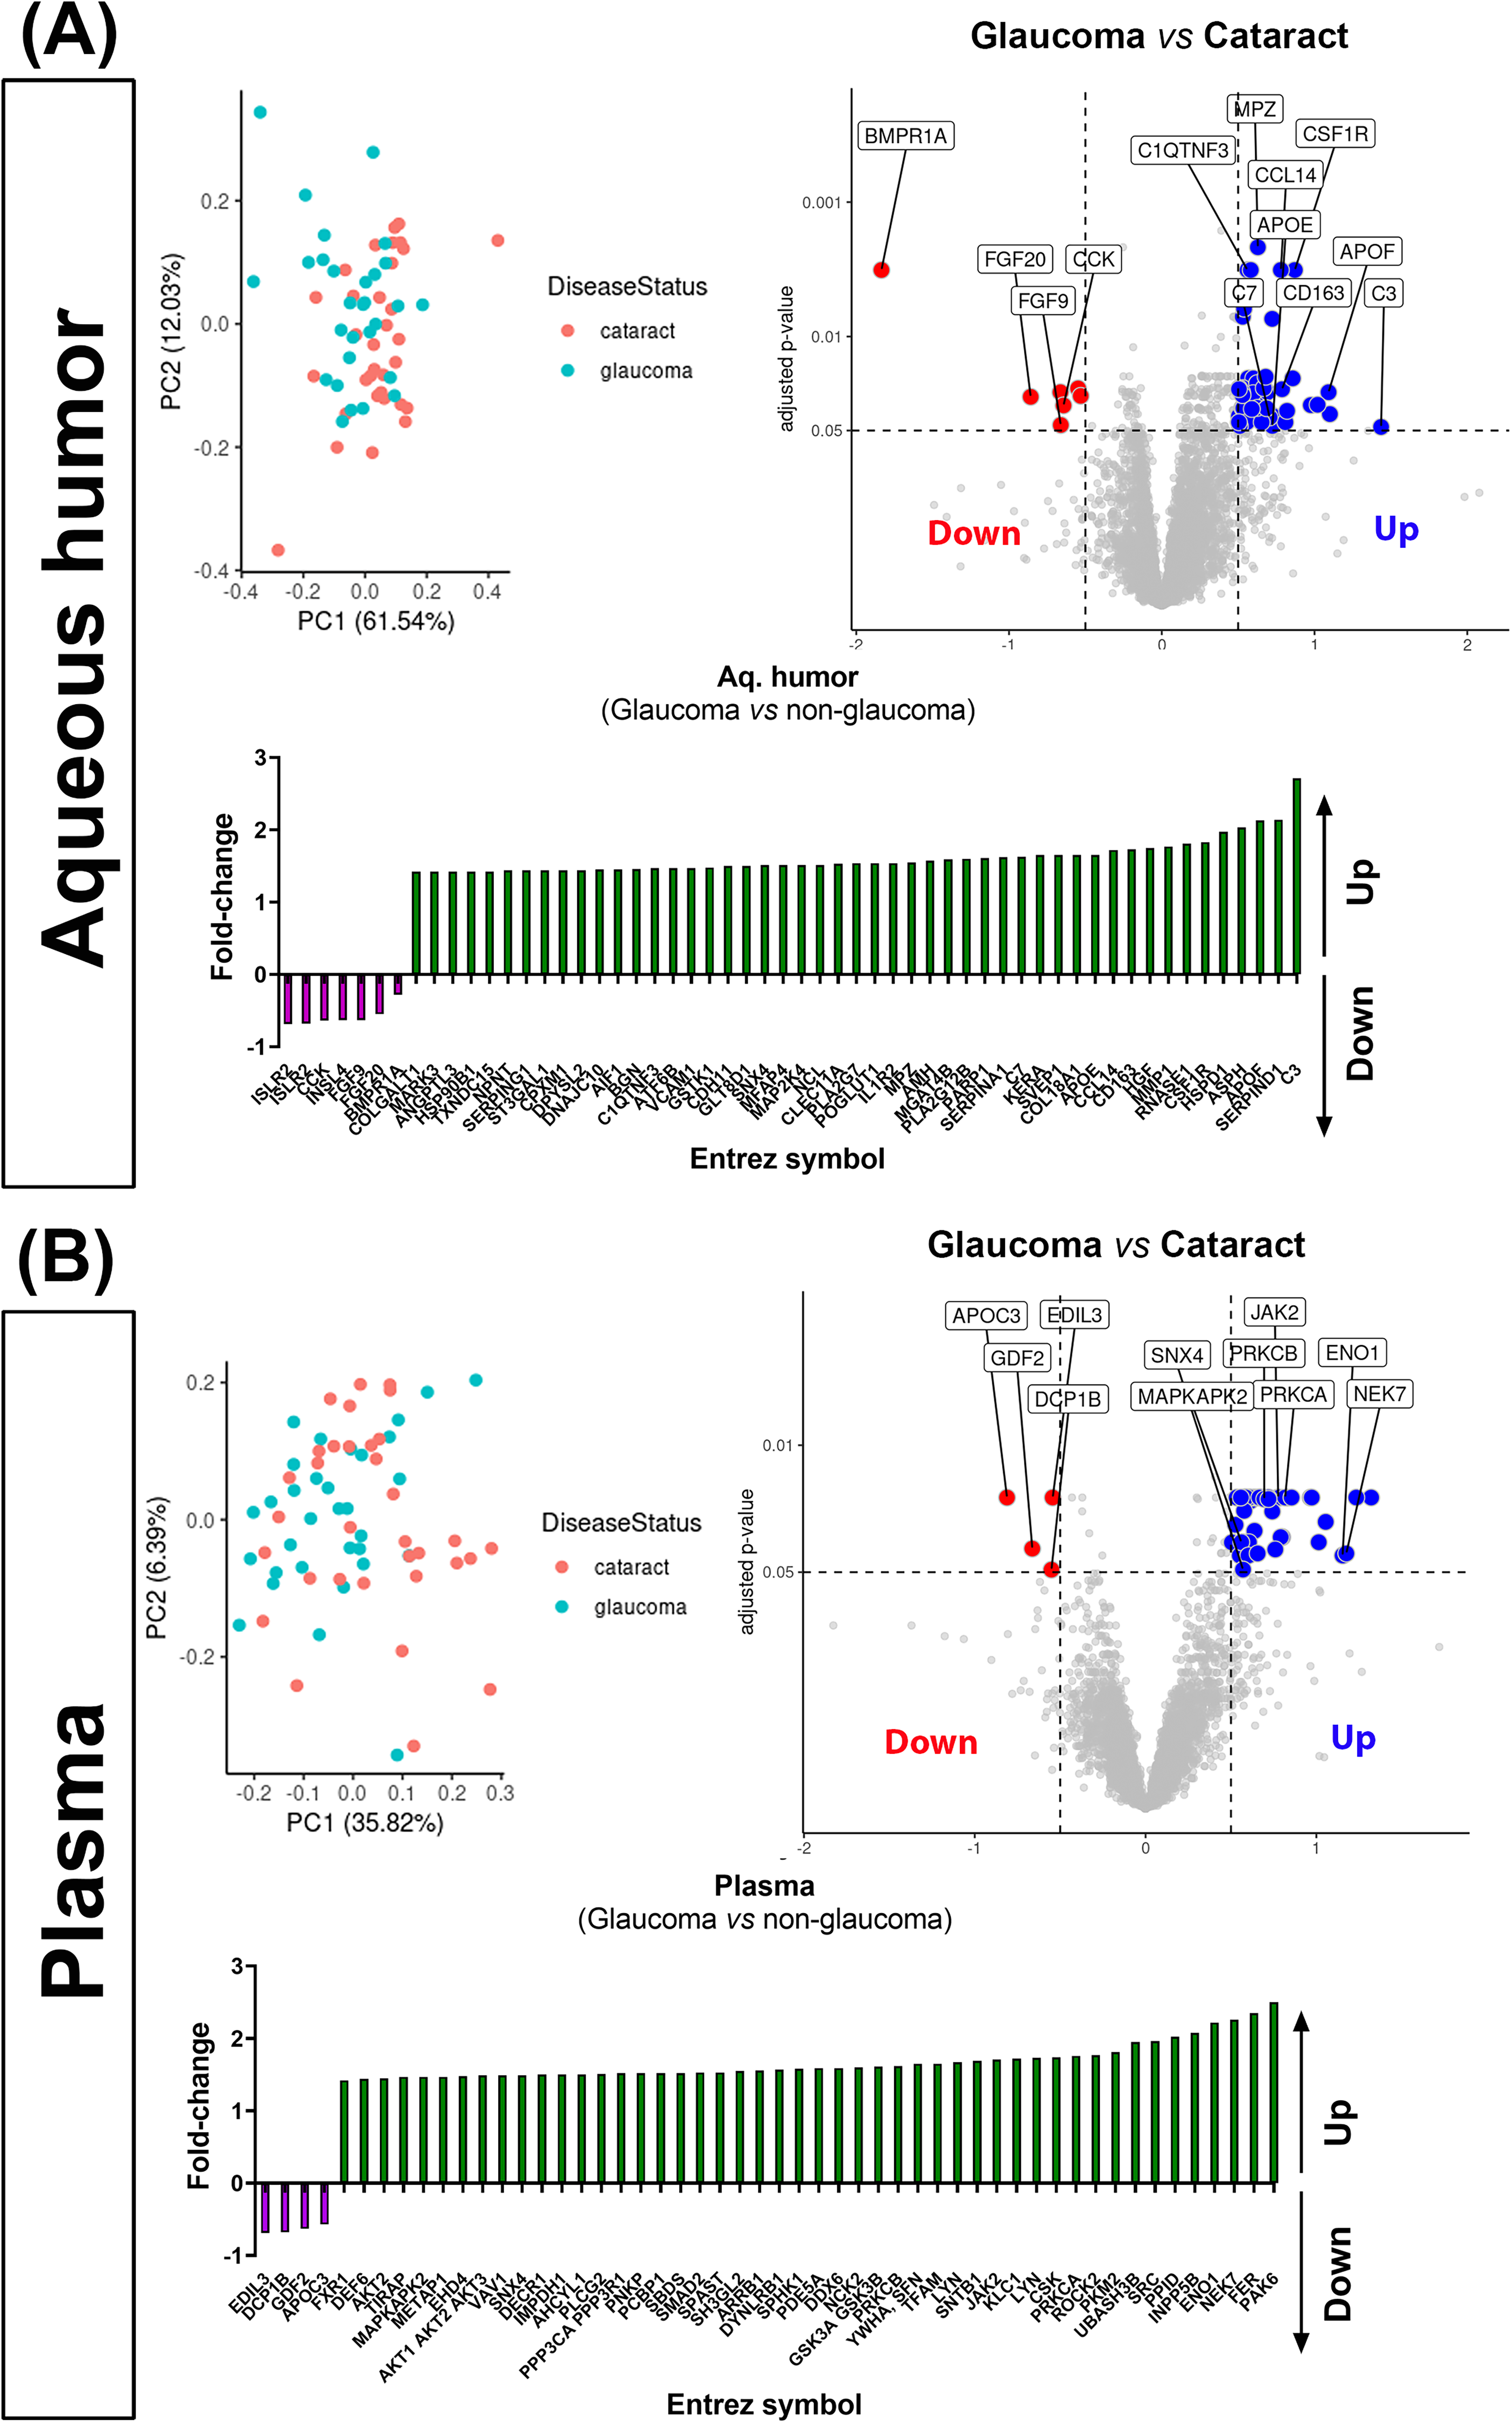
Principal component analysis (PCA) and differential expression analysis demonstrating differences in proteins identified in
Pathway enrichment analysis
Next, we investigated whether the differentially enriched proteins were associated with common biological pathways by performing pathway analysis (Supplementary Table S4). We identified 51 and 559 significantly upregulated pathways (adjusted P value < 0.05) in AH and plasma samples from glaucoma donors, respectively. Sixteen pathways were upregulated in both AH and plasma, including inflammatory response, IL6 production, and immune response-related pathways.
Correlation analysis of protein levels with total protein concentration
While individual protein changes may help identify signaling pathways perturbed in disease, the total protein concentration of the AH may help ascertain the overall health of the blood–aqueous barrier and the outcomes of IOP-lowering medications. Thus, normalizing individual proteins to total protein concentrations assists in determining if observed changes reflect pathway changes underpinning disease, or are merely a consequence of structural failure or drug treatment(s). We conducted an Elastic Net regression analysis to identify proteins that can accurately predict the total protein concentration (Fig. 4a). Our analysis specifically focused on AH proteins, as proteins from these samples may provide a better reflection of changes in glaucoma disease compared to plasma samples. Through our analysis, we successfully identified five proteins (KNG1, IGFBO6, MAP2K4, H6PD, and C3) that demonstrated the highest predictive capability for the total protein concentration collected from the patients (Fig. 4a).
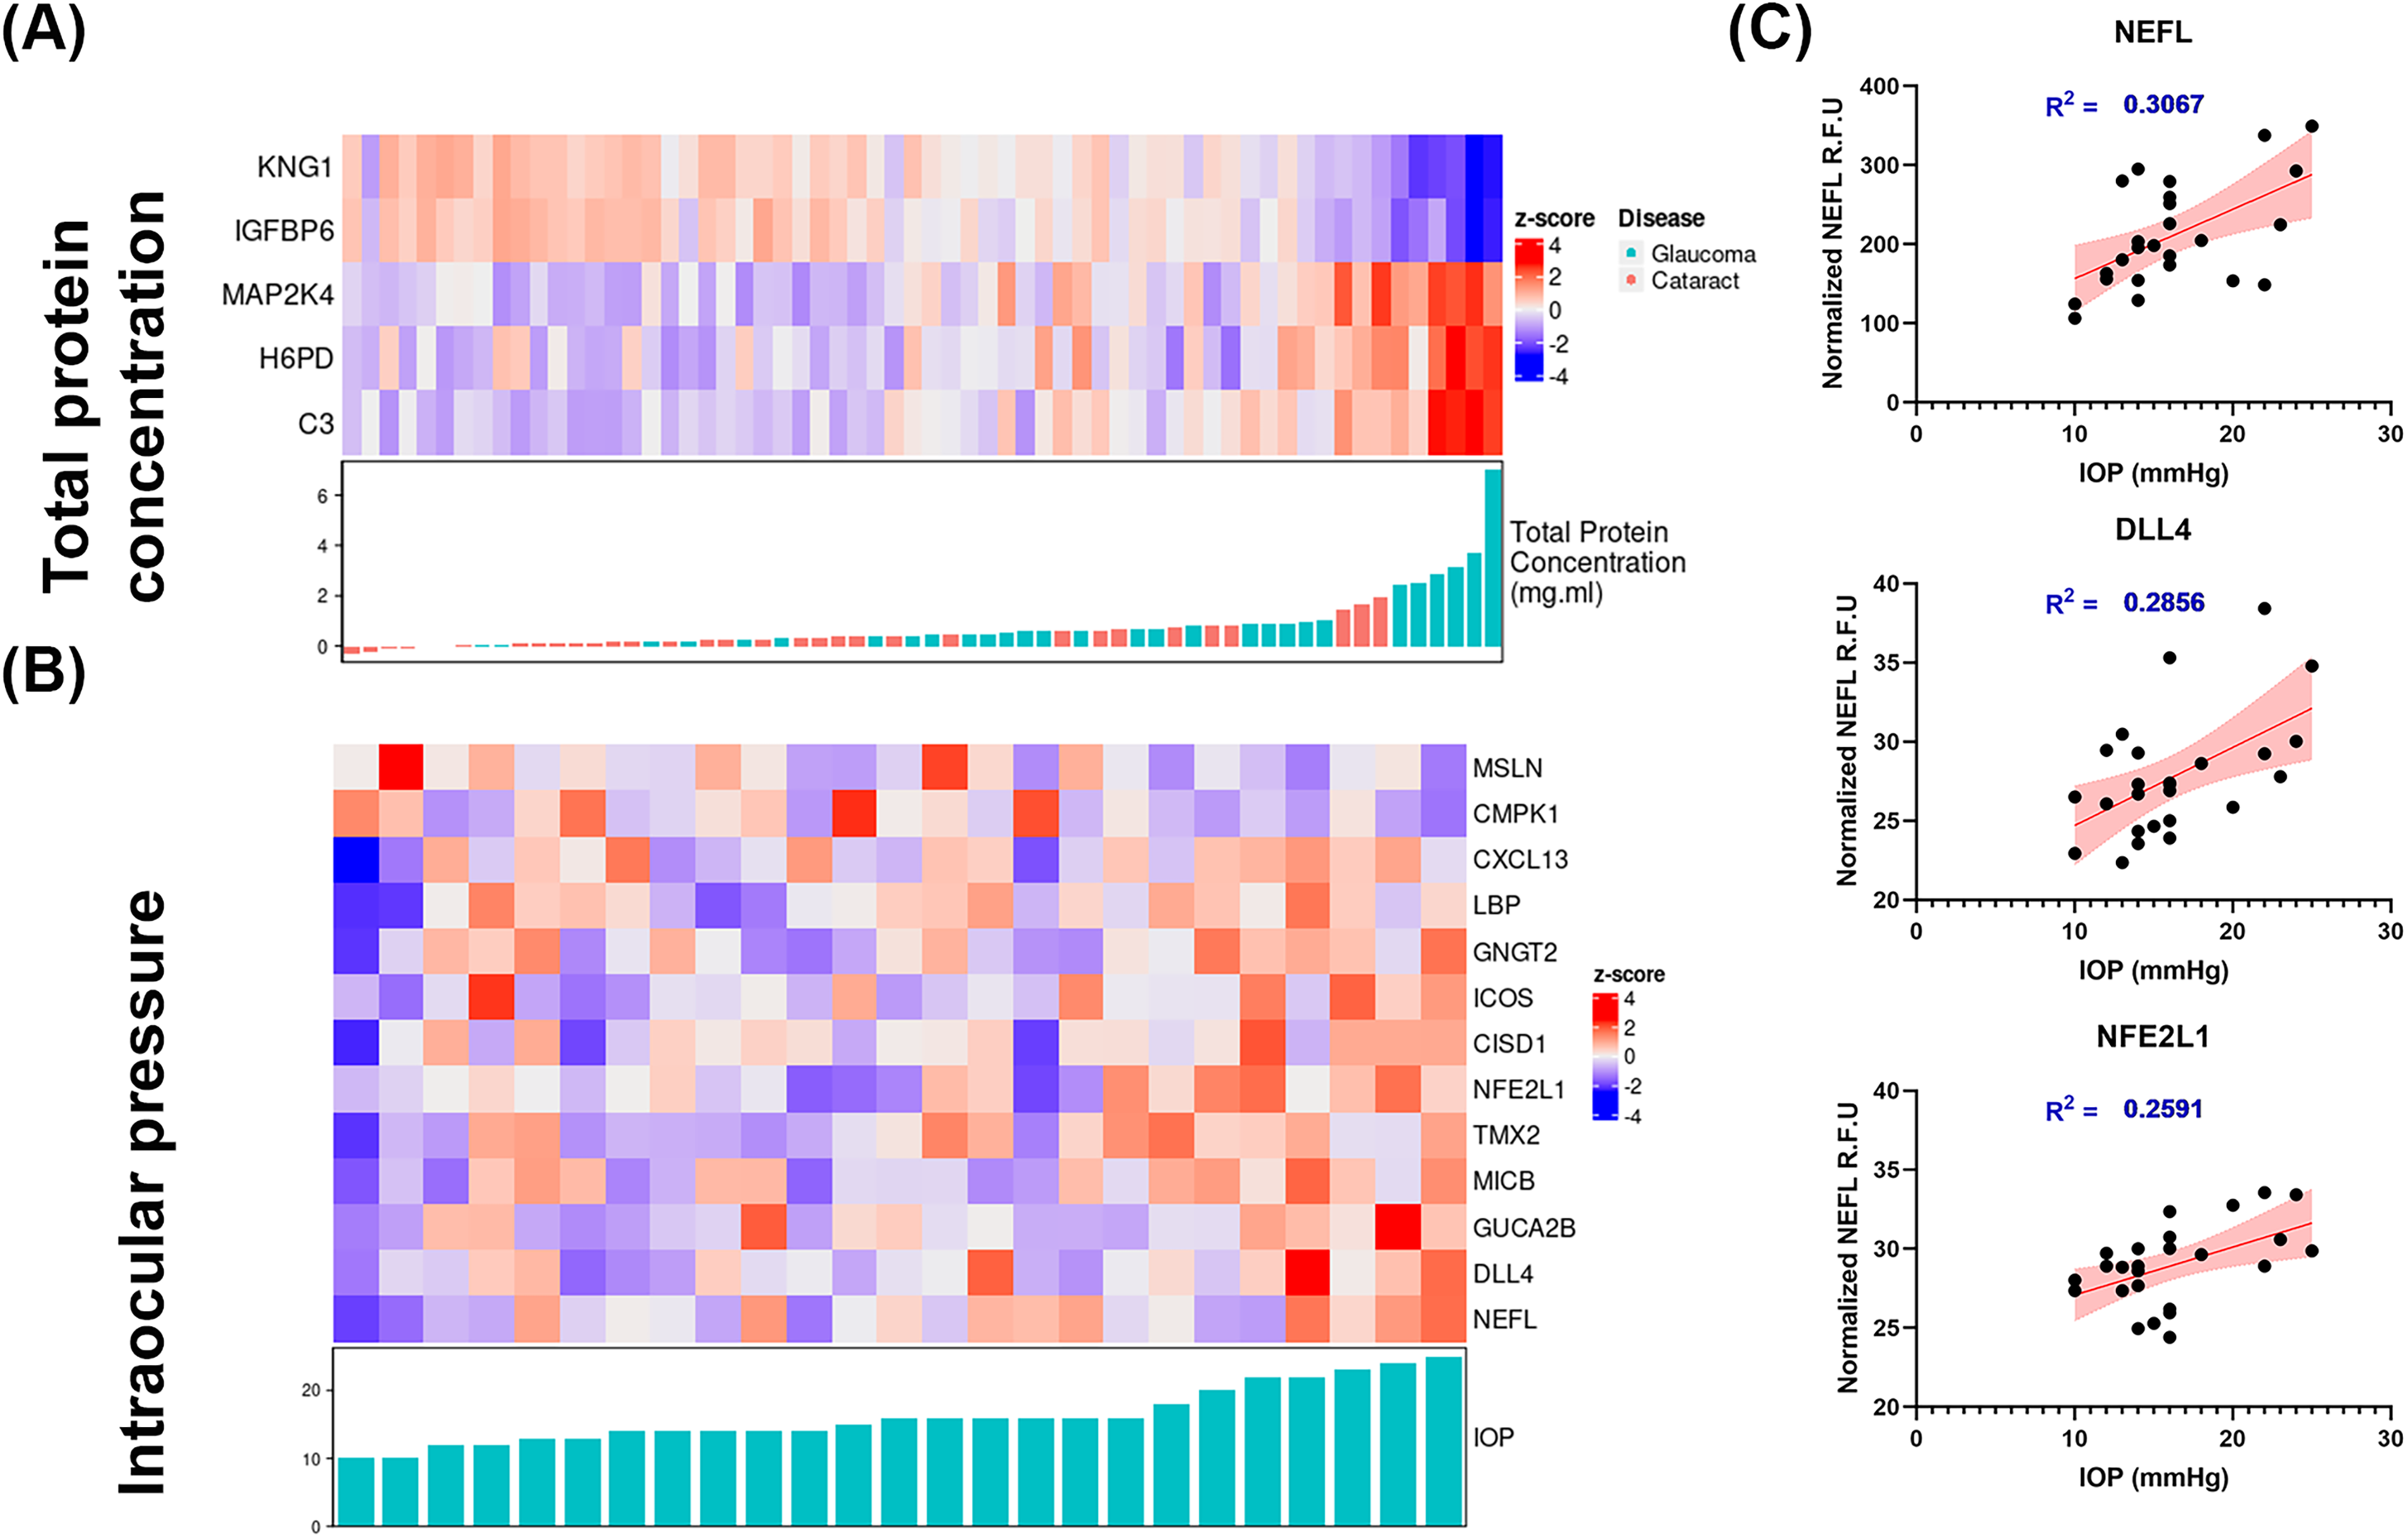
Elastic net regression analysis (AH only) demonstrated
Correlation analysis of protein levels with IOP
We conducted an Elastic Net regression analysis to identify 13 proteins to be associated with IOP values reported in glaucomatous patients (Fig. 4b). We note that a glaucoma sample with extremely high IOP measurement was excluded from the analysis. Among the proteins of interest in glaucoma, the protein with maximal correlation with IOP levels in glaucomatous patients was neurofilament light chain (NEFL; Fig. 4c, Supplementary Fig. S2). Linear regression analysis validated this finding and demonstrated a net correlation with IOP measurements (R2 = 0.3067). Since NEFL is a widely accepted marker for several neurodegenerative diseases, including glaucoma,76–85 we then decided to further investigate if levels of NEFL correlated with other SOMAmers identified in glaucomatous donors. We calculated the Pearson’s correlation coefficient of NEFL and rest of the proteins and identified 29 proteins that are positively or negatively correlated with NEFL (|r > 0.4|), including TEAD3, CNTF, C4A, C4B, and CCL27 (Fig. 5).
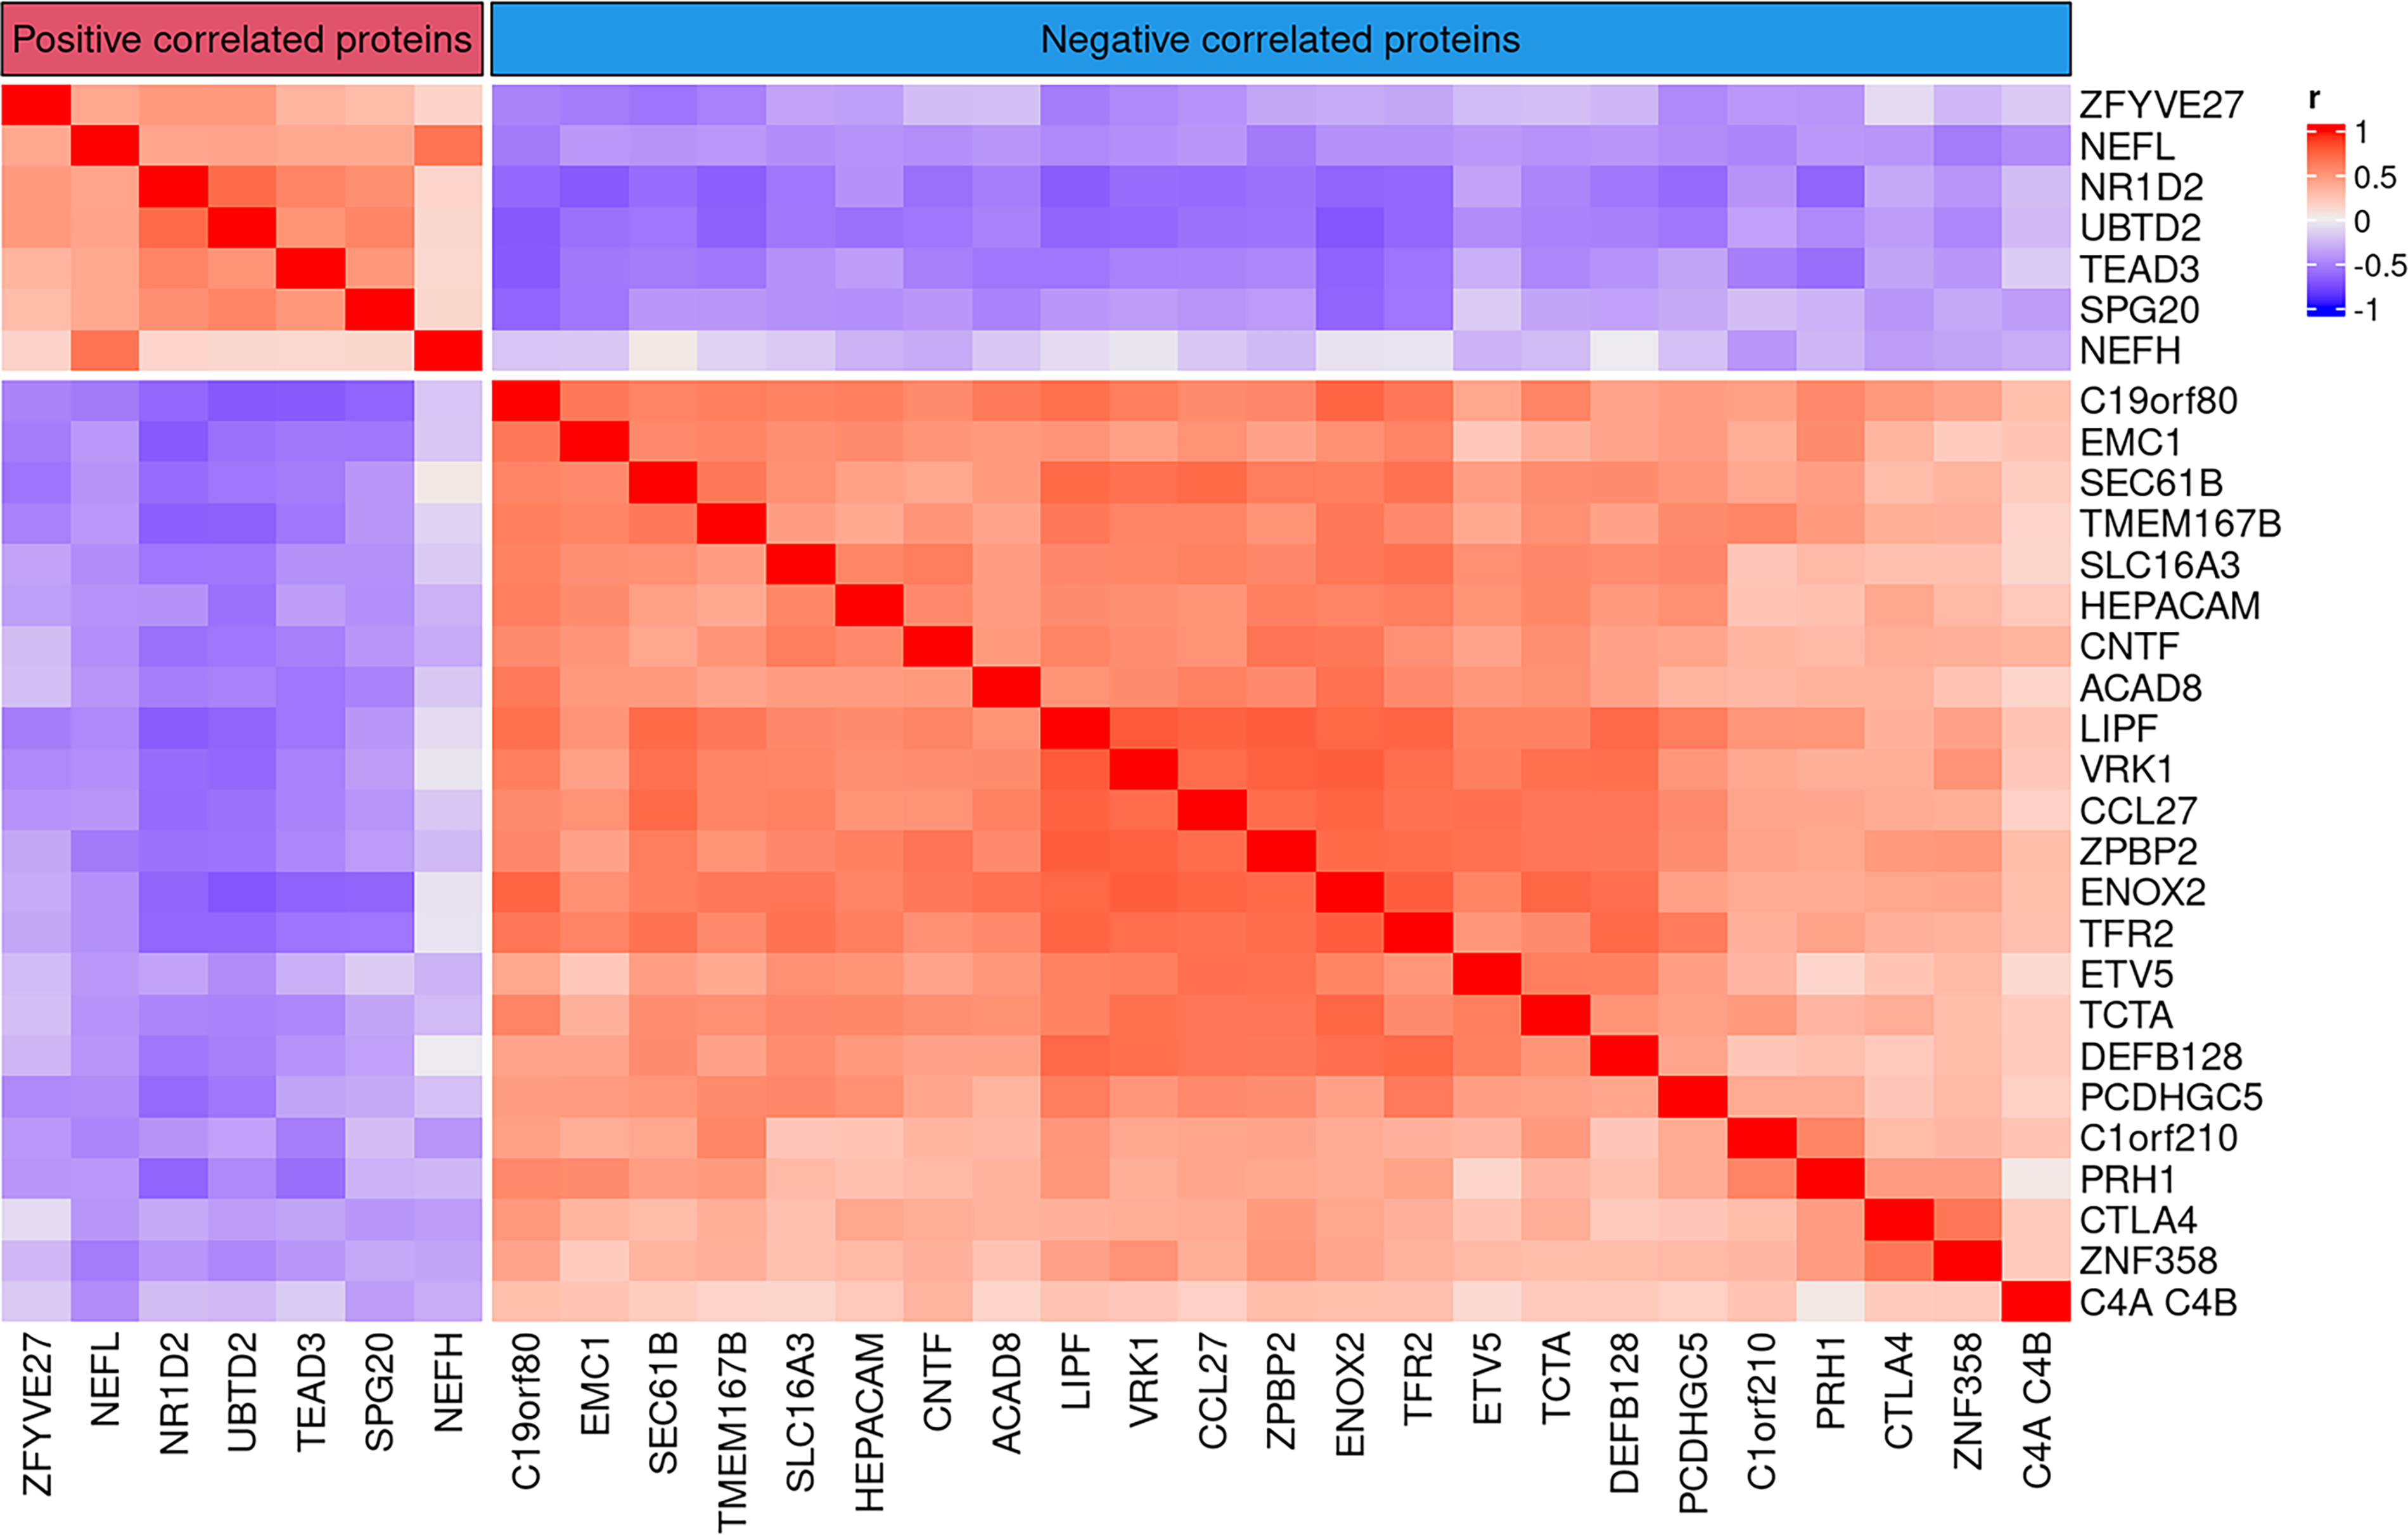
Heatmap demonstrating correlations between NEFL and the top 30 proteins identified in the AH of glaucomatous donors. Pearson’s correlation analysis comparing NEFL with rest of the proteins identified ∼30 proteins that either positively (red) or negatively (blue) correlated with NEFL (|r > 0.4|). In general, more proteins that negatively correlated with NEFL levels were identified than those that exhibited positive correlation.
Changes in protein levels as a function of cup-to-disc ratios in glaucoma
Finally, we sought to determine whether changes in the relative abundance of proteins in AH correlated with the cup-to-disc ratios of glaucomatous patients using Pearson’s correlation analysis (Fig. 6). For patients for whom cup-to-disc ratios were available for both eyes, we used the average measurements from both eyes. Among the 29 glaucomatous samples obtained, cup-to-disc ratios were available for 26 donors. Figure 6 shows the top 6 positive (KLRG2, C8G, PENK, ALB, APOA1, and KNG1) and negative (IL12A/B, LRRC3, ZAP70, CTSG, DEFB115, and NSG1) correlated proteins with cup-to-disc ratios.
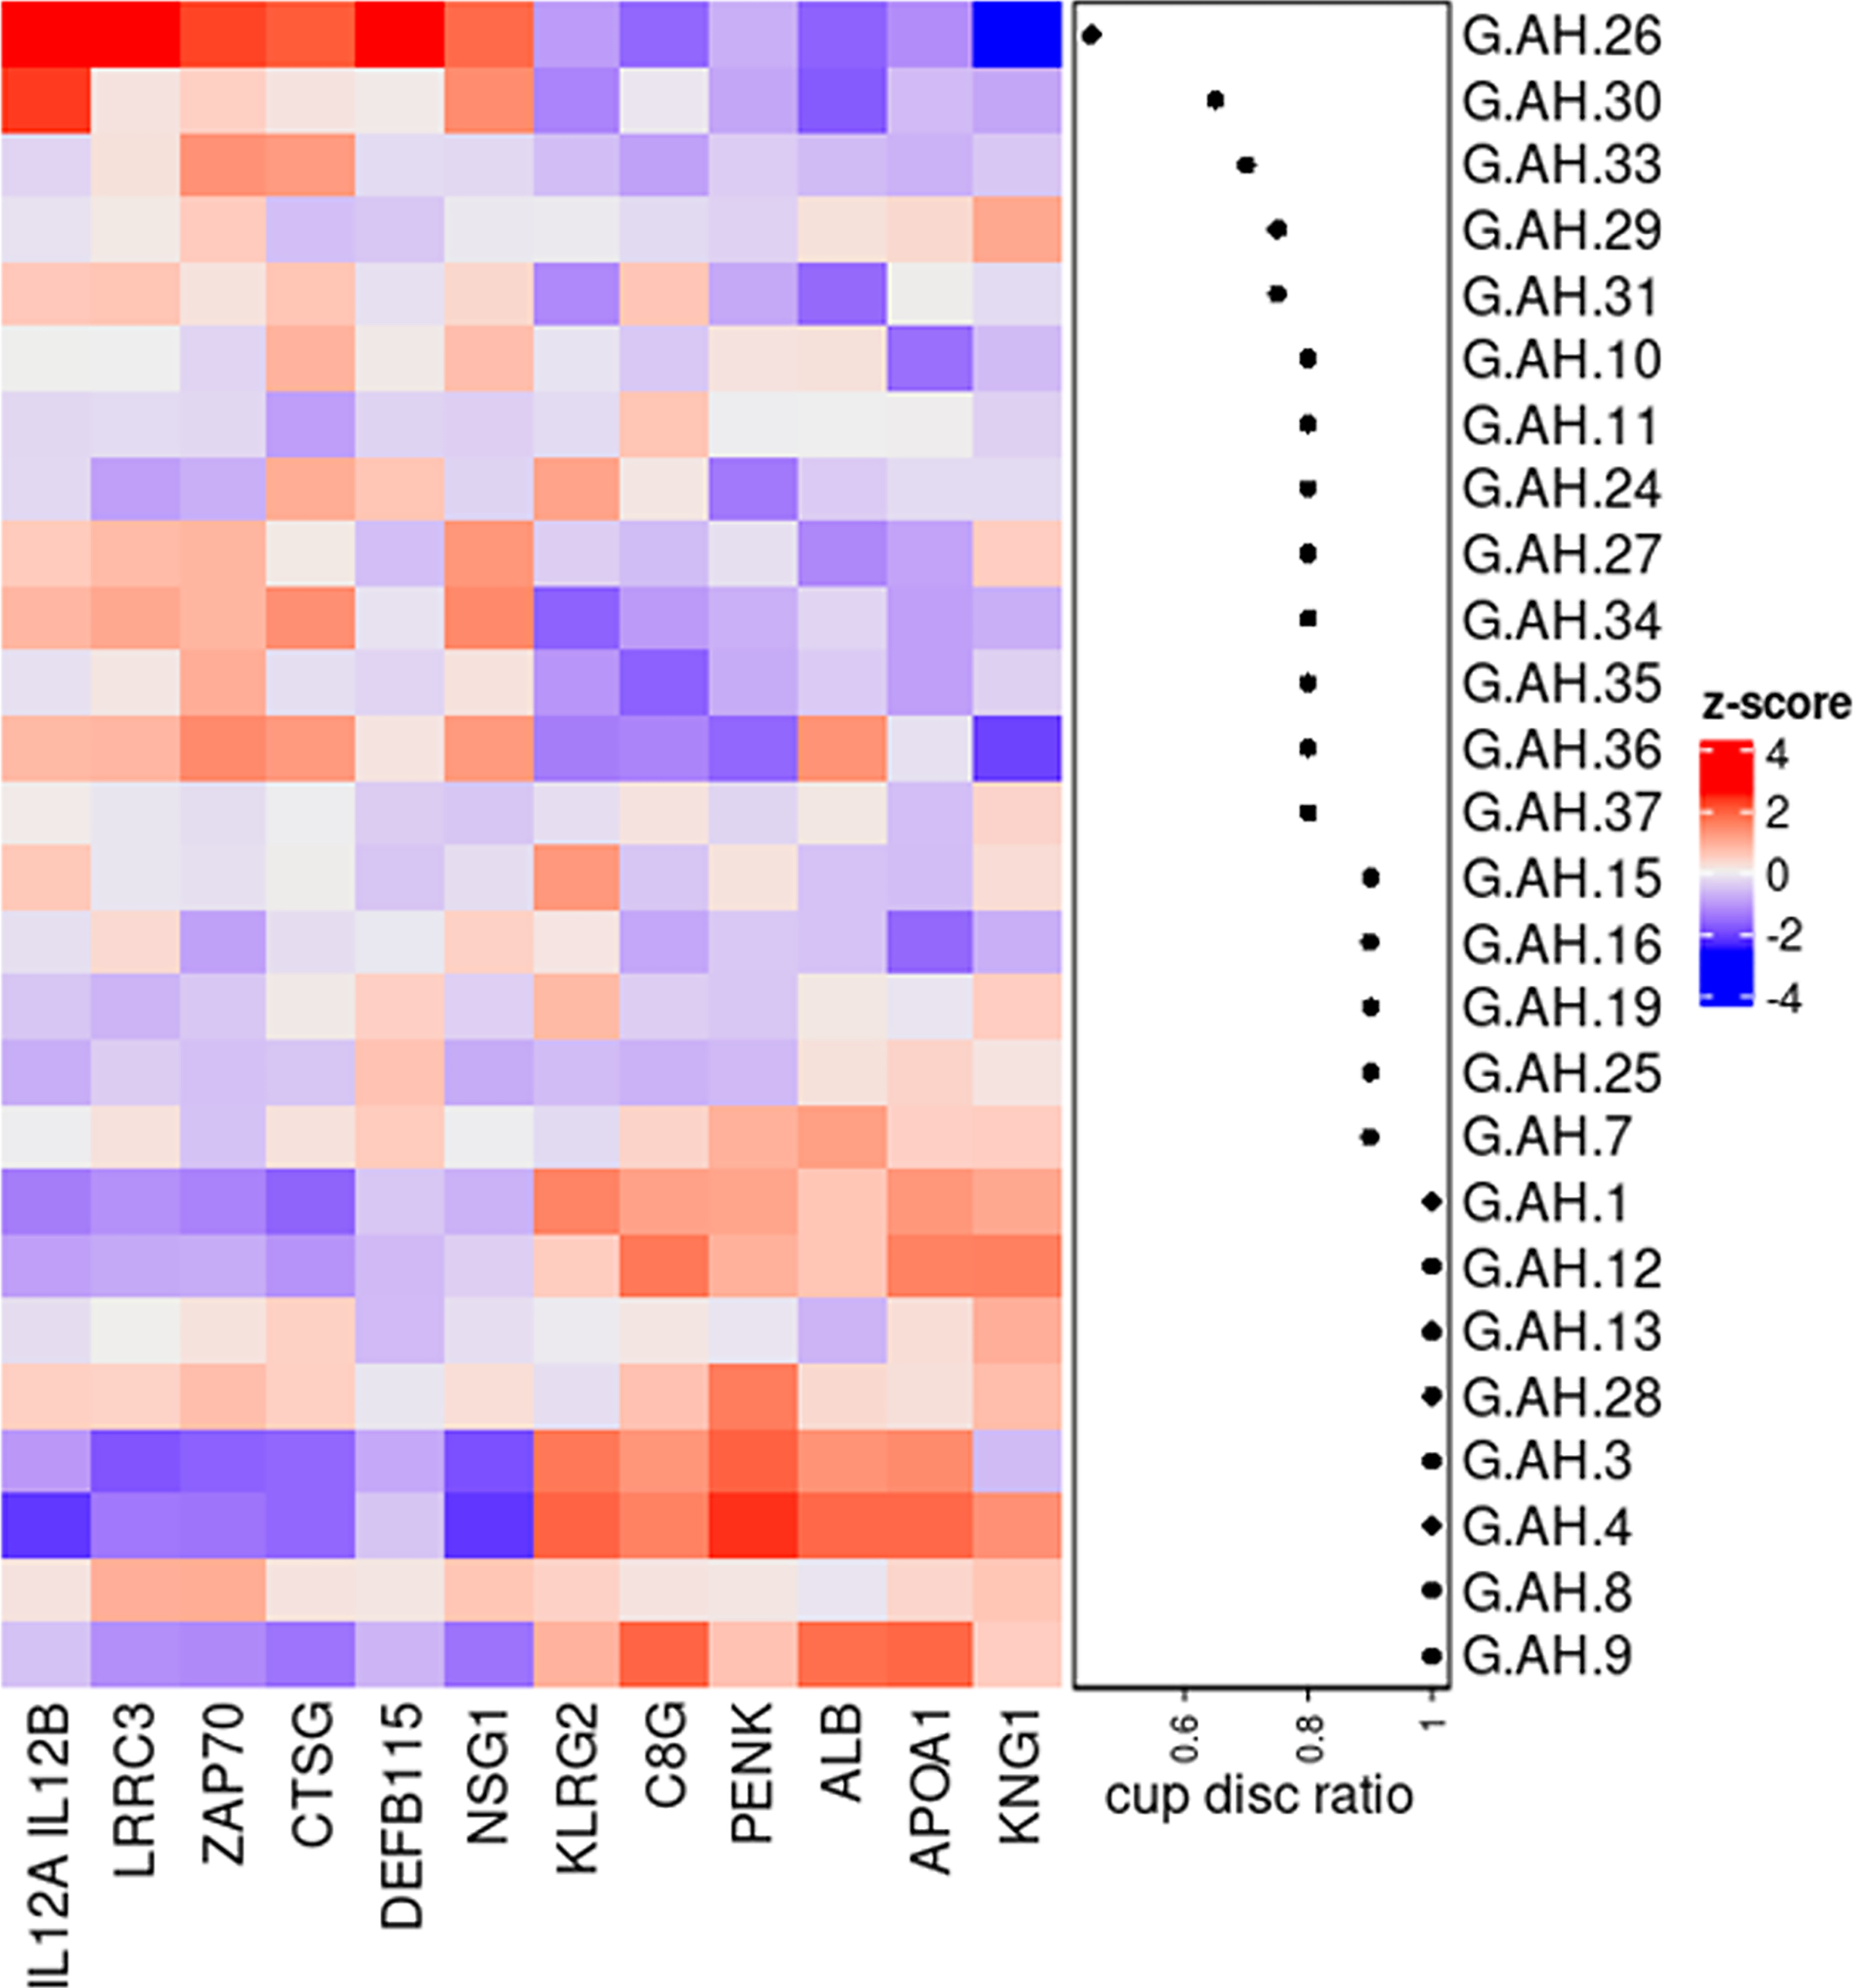
Heatmap showing the top 6 proteins that were either up- or downregulated in the AH of glaucomatous donors as a function of cup-to-disc ratio.
Discussion
Monitoring glaucoma in the clinic typically involves measuring IOP, gonioscopy, and advanced imaging of the retina/optic nerve head, which require regular visits and patient compliance. Without a detailed medical history, it is challenging to understand the molecular mechanisms of disease progression or to identify biomarkers to ascertain treatment effectiveness. Since collecting intraocular tissues from living patients is not feasible, analyzing biofluids such as AH and blood can provide critical insights into disease mechanisms. In this study, we examined protein levels in AH and plasma from patients with and without glaucoma undergoing cataract surgery using the SomaLogic platform and correlating these with IOP and cup-to-disc ratios measured immediately prior to surgery.
Comparative analysis of plasma and aqueous humor proteomes
The ages and sex of glaucomatous and nonglaucomatous donors in this dataset were comparable. We observed significant changes in the relative abundance of a subset of proteins identified both in AH and plasma. Protein levels in AH and plasma from the same donor sample showed a positive correlation (r > 0.5 for all of samples). Interestingly, when comparing protein levels and correlations across all fluids and disease states, we only observed a significant upregulation of SNX4 in glaucomatous AH and plasma when compared with those from nonglaucomatous donors. SNX4 is a synaptic and endosomal membrane trafficking protein in the secretory pathway and is also implicated as a mitochondrial recycling quality protein in aging.86–88 The lack of greater correlation between plasma and AH proteins may be due to several reasons: turnover rates of AH versus plasma, tissues and cell types involved in protein secretions, and systemic versus local transport of proteins. It is yet unclear if glaucoma is purely a disease of the eye or if systemic factors exist that regulate its etiology and progression, although co-morbidities have been reported.89–93 Furthermore, Miguel Coca-Prados et al. 94 have identified several unique proteins and peptides in the AH attributed to the neuroendocrine nature of ciliary nonpigmented epithelial cells in addition to plasma proteins. It is thus unsurprising that differences in uniquely identified proteins exists between the two biofluids. Nevertheless, in the plasma, 48 proteins were upregulated while 4 (EDIL3, DCP1B, GDF2, and APOC3) were downregulated when comparing nonglaucomatous and glaucomatous donors. Gene ontology analyses of proteins altered in the plasma of glaucomatous donors were related to multiple pathways corresponding to protein and macromolecule localization, intracellular transport, kinase activity pathways, posttranslational/posttranscriptional regulation of proteins/genes, cytoskeletal reorganization, and GPCR-related pathways. On the other hand, 7 (ISLR2, CCK, INSL4, FGF9, FGF20, BMPR1A) proteins were significantly downregulated and 49 were significantly upregulated in the AH of glaucomatous donors. Gene ontology analyses of proteins identified as altered in the AH of glaucomatous donors were related to multiple pathways corresponding to inflammatory response, humoral and adaptive immune response, cell–cell and cell–matrix adhesion, complement activation, and wound healing responses. These together suggest that though overall concordance in proteins may be observed between AH and plasma, some differences exist and thus proximity of biofluid to relevant tissue being studied (i.e., ciliary process, ciliary muscle and TM/SC) may be important to consider. As such, deeper analysis in this study was focused on the ocular specific biofluid (AH) proteins.
Effect of disease state on aqueous humor proteome
All changes in protein levels were normalized to total protein concentration; therefore, these changes were independent of mean protein concentration. Interestingly, regression modeling demonstrated that total protein concentrations trended toward being significantly greater in AH of glaucomatous donors than in that of nonglaucomatous donors. While this is suggestive of a breakdown in the blood–aqueous barrier, 4 whether this is due to the chronic nature of the disease or due to IOP lowering medications (e.g., prostaglandin analogs), other systemic medications or other co-morbidities is unclear. Nevertheless, the changes in proteins appear to be directly related to pathways with the potential for consequential effects on IOP regulation and outflow homeostasis. When comparing our overall findings with that from previous publications using other technologies, it was noteworthy that proteins related to complement and immune-related proteins (e.g., C3b, IL1, C1Q, C7, etc.), apolipoproteins (APOE, APOF, etc.), heat shock/oxidative stress (HSPD1/Hsp60), and matrix and serpin (SERPINA1, SERPING1, BGN, etc.) remained consistently differentially expressed between glaucomatous and nonglaucomatous AH.34,41,95–101 These suggest that the proteomics methodology used in our study is sensitive and robustly identifies certain proteins, in glaucoma, regardless of study design or detection method. This highlights that certain pathways and proteins may have a functional or disease-correlative role that required further studies to establish their role in disease mechanisms. Nonetheless, several unique proteins were also identified in our study.
For example, Col18A1, which was upregulated in AH of glaucomatous donors, is expressed ubiquitously in ocular tissues except in photoreceptors, and protein fragments that contain endostatin (from Col18A1 cleavage) has been observed to accumulate in ocular fluid samples. 102 Interestingly, endostatin has been reported to promote expression and release of thrombospondin-1, implicated in outflow resistance and glaucoma,103–105 in nonocular endothelial cells. 106 Conversely, endostatin has also been posited to crosstalk with Rho/ROCK, TGFβ, NF-κB, PDGF, and autophagy pathways to yield anti-fibrotic effects. 107 SVEP1, another overexpressed secreted ECM protein in AH and a disease modifier allele for congenital glaucoma, 108 is known to be a binding partner for TIE1 and can thus regulate signaling outcomes in lymphatics and vasculature. 109 Since AH predominantly drains into the SC, a unique vessel with both vasculature and lymphatic properties, 110 studying SVEP1 in the context of glaucoma warrants further investigation. Of particular interest, VCAM1, CDH11, and BGN were other proteins that were overexpressed in the AH of glaucomatous patients. SVEP1, CDH11, and VCAM1 were all identified as genes relevant to POAG pathogenesis in a genome-wide meta-analysis across ancestries. 111 CDH11 can interact reciprocally with fibronectin-binding protein syndecan-4 to facilitate cell migration and adhesion, partake in EMT, and modulate proliferation.112–115 In nonocular cells, CDH11 was shown to mediate the adhesion of macrophages to fibroblasts, promoting transdifferentiation into myofibroblasts and a self-sustaining profibrotic niche. 116 Biglycan (BGN) is an extracellular proteoglycan expressed in the TM. 117 It has been posited as a prognostic marker for cancer aggressiveness, 118 fibrosis and inflammation, 119 and is predicted to act as a circulating “messenger” that triggers inflammation and/or autophagy. 120 Whether biglycan in the AH serves as a biomarker, a signaling molecule to trigger autophagy or inflammatory phenotypes in the TM to mediate subsequent outflow regulation requires mechanistic studies. High levels of circulatory VCAM1 in the blood/plasma was found to correlate with ventricular hypertrophy and hypertension and have therefore been suggested as a predictive soluble biomarker of cardiovascular disease and inflammation.121–123 In this study, whether VCAM1 expression is a result of chronic elevated IOP, drugs to lower IOP, or due to undiagnosed/unknown underlying systemic vascular conditions is unknown. Regardless, the increased presence of these aforementioned proteins may serve as “proteins-of-interest” in mechanistic understanding of outflow regulation and as potential biomarkers for dysregulation in outflow homeostasis. Further studies using orthogonal methods are needed to validate these findings.
Protein changes identified as a function of clinical parameters in glaucoma
Since proteins associated with “hypertension” were identified, we next sought to determine whether protein changes were a function of IOP levels through additional regression modeling. Two proteins notably were found to be of importance: DLL4 and NEFL. DLL4, a Notch ligand, is a key regulator of vascular morphogenesis, vessel maturation, and function. Secreted/soluble DLL4 has previously been reported to significantly reduce hydraulic conductivity, vascular permeability, and disrupt endothelial barrier function in nonocular vasculature.124,125 Furthermore, DLL4 has been shown to play a critical role in developing retinal vasculature, increased endothelial cell proliferation, and angiogenic sprouting. 126 Interestingly, DLL4 was also shown to inhibit inflammatory choroidal neovascularization despite opposing effects seen in endothelial cells (anti-angiogenic) and macrophages (pro-angiogenic). 127 Collectively, we speculate that DLL4, found upregulated with IOP, may act to increase outflow resistance via a yet unknown mechanism. Furthermore, whether a dichotomous function for the DLL4 ligand or the Notch pathway exists in outflow regulation remains to be determined. A recent study suggested that Notch pathway protein expression may differ between segmental flow regions of healthy and glaucomatous donors, at least in vitro. 128 Thus, ligands circulating in the AH could differentially impact TM cell function, necessitating further studies.
NEFL is a well-established marker of neurodegeneration,77,79–82,129 and, similar to our findings, has previously been reported to be elevated in glaucomatous AH in both humans and animal models.76,78,130 In fact, NEFL had the highest correlation with IOP in all donors in this study, providing additional confidence that NEFL in the AH may indeed be a suitable biomarker for glaucomatous neurodegeneration and ocular hypertension. However, we advise caution that AH samples utilized in this study were from patients identified for glaucoma filtration surgery. Therefore, it is likely that the disease stage may be advanced and thus markers of axonal degeneration are expected within the AH. Whether NEFL serves as an early marker of disease remains unclear and requires comprehensive longitudinal natural history investigations. Furthermore, the source of the neurofilament protein determined in the AH is unclear (i.e., whether it is due to degeneration of the optic nerve, secretion from cells of neural crest origin [developmentally] in the anterior segment, or Schwann/nerve cells in the anterior segment remains unknown). Interestingly, although NEFL levels correlated with IOP, they did not appear to correlate with cup-to-disc ratio in glaucoma donors (Supplementary Fig. S3), although several other proteins did correlate. Likewise, cup-to-disc ratio was independent of IOP values as well (Supplementary Fig. S3). Inflammatory proteins (such as interleukins and cathepsins) corresponded with low cup-to-disc ratio, whereas apolipoprotein A1 (APOA1), albumin, kininogen-1 (KNG1), and complement C8G correlated with a higher cup-to-disc ratio, suggesting proteins altered in the AH may differ based on disease severity. KNG1 is an antiangiogenic molecule that has been suggested to be a marker of neurodegeneration 131 and can impair the proliferation of endothelial cells. 132 To the best of our knowledge, the role of KNG1 in POAG and/or OHT has not been studied, although its cleaved nonapeptide, Bradykinin (BK), has been the target for IOP-lowering investigations.133–138 A prior study reported decreased C8G levels 139 in glaucomatous AH, which conflicts with our results. However, Kim et al. 140 previously reported C8G to act as a neuroinflammation inhibitor; our result correlating C8G levels with high cup-to-disc ratios may thus reflect the advanced stage of neurodegeneration/neuroinflammation in glaucoma.
Consistent with our study, elevated levels of APOA1 were reported in AH of POAG donors. 141 It is important to note that the direct role of APOA1 in IOP homeostasis remains unknown. However, APOA1 plays a critical role in the reverse cholesterol transport pathway via direct interactions with ABCA1, a gene whose variants have been implicated in POAG. 142 Cholesterol itself is a risk factor for elevated IOP. 143 Elevation in albumin levels in glaucomatous AH is also reported in several studies, though attributed to administration of IOP-lowering drugs. 144 Finally, correlation analysis of NEFL to other proteins identified in glaucomatous AH revealed that NEFL levels may be associated with proteins regulating apoptosis, complement activation, proliferation, and cytoskeletal reorganization. Together, the proteins identified in this study correspond to both markers of neurodegeneration and those that may inhibit proliferation or vascular integrity.
Limitations
This study is not without limitations. One of the major limitation is that the biofluids analyzed were collected at the time of ocular surgery, representing a single snapshot in time. Consequently, no information was gleaned about the stage of the disease, although clinically measured IOP values and cup-to-disc ratios were available at this stage. We understand that glaucoma can be asymmetrical, and in future studies, we will consider incorporating cup-to-disc ratios from objective approaches such as OCT to validate or refine these findings. Also, while cup-to-disc ratios are a clinical parameter, and protein levels (which potentially are dynamic) are a molecular parameter, it is important to note that these variables are independent, and that the kinetics of structural changes may differ from the kinetics of molecular turnover. The independent parameters were nevertheless compared to ascertain if the clinical parameter investigated had any association with the proteome content in the AH and if this could perhaps reflect the current state of the disease in the donor. Under the current study design, it is important to note that any causal or correlational relationships are hard to conclude since there are practical limitations on frequency of AH sampling. Furthermore, comprehensive and longitudinal patient histories of systemic co-morbidities or ocular diseases, and medications that may affect systemic or OHT, including but limited to IOP, were unavailable. Since IOP in glaucoma patients was controlled with IOP lowering medication, the impact of these therapeutics on proteome changes cannot be ascertained. Further functional measurements for visual field or additional structural deficits including longitudinal and pre-surgical fundus photography or OCT measurements (nerve fiber layer thinning, rim width, ganglion cell analysis, etc.) are not known for these patients. We speculate that additional information that may be obtained from longitudinal prospective studies with disease state factored in could further enable identification of determining factors driving changes in the proteome. We did not perform any genetic linkage or association analysis to identify any polygenic risk assessment from the POAG patients enrolled. Future studies may be needed to identify correlations between genetic causes, structure–function changes, and molecular profiling approaches in a longitudinal manner if feasible. Since the entirety of the samples collected in this study were utilized for proteomics, attempts to validate the results using orthogonal or secondary methodologies were not undertaken. As such, since MS (a commonly used profiling technique for proteomics) was not part of the current study’s scope, we recommend future research from independent investigators to include such methods, and to compare SOMAscan findings with previously published AH proteomic profiles and/or methods. Thus, we anticipate that the approach and data presented here will enable the design of validation studies for future investigations within the glaucoma community.
Authors’ Contributions
C.L.P., K.S.R., D.F.C., H.N., C.M., I.M.T., A.G.C., and R.B.: Clinical design, sample collection, data interpretation, critical review, revisions, and approval of article. C.H. and A.B.: Data analysis, data interpretation, critical review, revisions, and approval of article. A.C. and G.P.: Conceptualization of study, data interpretation, critical review, revisions, and approval of article. N.V., L.J., and J.L.: Sample preparation and analysis, data analysis, data interpretation, critical review, revisions, and approval of article. C.W.W.: Data interpretation, critical review, revisions, and approval of article. V.R.: Data analysis, data interpretation, critical review, revisions, and approval of article.
Supplemental Material
sj-docx-1-opt-10.1177_10807683261460687 — Supplemental material for Proteomic Profile Analysis of Plasma and Aqueous Humor from Glaucoma and Nonglaucomatous Patients
Supplemental material, sj-docx-1-opt-10.1177_10807683261460687 for Proteomic Profile Analysis of Plasma and Aqueous Humor from Glaucoma and Nonglaucomatous Patients by Carmen L. Pessuti, Chia-Ling Huang, Angela Banks, Nhi Vo, Lori Jennings, Joseph Loureiro, Kleber S. Ribeiro, Deise Fialho Costa, Heloisa Nascimento, Cristina Muccioli, Ivan Maynart Tavares, Alessandra G. Commodaro, Rubens Belfort, Christopher W. Wilson, Amy Chen, Ganesh Prasanna, and VijayKrishna Raghunathan
Supplemental Material
sj-docx-2-opt-10.1177_10807683261460687 — Supplemental material for Proteomic Profile Analysis of Plasma and Aqueous Humor from Glaucoma and Nonglaucomatous Patients
Supplemental material, sj-docx-2-opt-10.1177_10807683261460687 for Proteomic Profile Analysis of Plasma and Aqueous Humor from Glaucoma and Nonglaucomatous Patients by Carmen L. Pessuti, Chia-Ling Huang, Angela Banks, Nhi Vo, Lori Jennings, Joseph Loureiro, Kleber S. Ribeiro, Deise Fialho Costa, Heloisa Nascimento, Cristina Muccioli, Ivan Maynart Tavares, Alessandra G. Commodaro, Rubens Belfort, Christopher W. Wilson, Amy Chen, Ganesh Prasanna, and VijayKrishna Raghunathan
Supplemental Material
sj-docx-3-opt-10.1177_10807683261460687 — Supplemental material for Proteomic Profile Analysis of Plasma and Aqueous Humor from Glaucoma and Nonglaucomatous Patients
Supplemental material, sj-docx-3-opt-10.1177_10807683261460687 for Proteomic Profile Analysis of Plasma and Aqueous Humor from Glaucoma and Nonglaucomatous Patients by Carmen L. Pessuti, Chia-Ling Huang, Angela Banks, Nhi Vo, Lori Jennings, Joseph Loureiro, Kleber S. Ribeiro, Deise Fialho Costa, Heloisa Nascimento, Cristina Muccioli, Ivan Maynart Tavares, Alessandra G. Commodaro, Rubens Belfort, Christopher W. Wilson, Amy Chen, Ganesh Prasanna, and VijayKrishna Raghunathan
Supplemental Material
sj-xlsx-4-opt-10.1177_10807683261460687 — Supplemental material for Proteomic Profile Analysis of Plasma and Aqueous Humor from Glaucoma and Nonglaucomatous Patients
Supplemental material, sj-xlsx-4-opt-10.1177_10807683261460687 for Proteomic Profile Analysis of Plasma and Aqueous Humor from Glaucoma and Nonglaucomatous Patients by Carmen L. Pessuti, Chia-Ling Huang, Angela Banks, Nhi Vo, Lori Jennings, Joseph Loureiro, Kleber S. Ribeiro, Deise Fialho Costa, Heloisa Nascimento, Cristina Muccioli, Ivan Maynart Tavares, Alessandra G. Commodaro, Rubens Belfort, Christopher W. Wilson, Amy Chen, Ganesh Prasanna, and VijayKrishna Raghunathan
Supplemental Material
sj-xlsx-5-opt-10.1177_10807683261460687 — Supplemental material for Proteomic Profile Analysis of Plasma and Aqueous Humor from Glaucoma and Nonglaucomatous Patients
Supplemental material, sj-xlsx-5-opt-10.1177_10807683261460687 for Proteomic Profile Analysis of Plasma and Aqueous Humor from Glaucoma and Nonglaucomatous Patients by Carmen L. Pessuti, Chia-Ling Huang, Angela Banks, Nhi Vo, Lori Jennings, Joseph Loureiro, Kleber S. Ribeiro, Deise Fialho Costa, Heloisa Nascimento, Cristina Muccioli, Ivan Maynart Tavares, Alessandra G. Commodaro, Rubens Belfort, Christopher W. Wilson, Amy Chen, Ganesh Prasanna, and VijayKrishna Raghunathan
Supplemental Material
sj-xlsx-6-opt-10.1177_10807683261460687 — Supplemental material for Proteomic Profile Analysis of Plasma and Aqueous Humor from Glaucoma and Nonglaucomatous Patients
Supplemental material, sj-xlsx-6-opt-10.1177_10807683261460687 for Proteomic Profile Analysis of Plasma and Aqueous Humor from Glaucoma and Nonglaucomatous Patients by Carmen L. Pessuti, Chia-Ling Huang, Angela Banks, Nhi Vo, Lori Jennings, Joseph Loureiro, Kleber S. Ribeiro, Deise Fialho Costa, Heloisa Nascimento, Cristina Muccioli, Ivan Maynart Tavares, Alessandra G. Commodaro, Rubens Belfort, Christopher W. Wilson, Amy Chen, Ganesh Prasanna, and VijayKrishna Raghunathan
Supplemental Material
sj-xlsx-7-opt-10.1177_10807683261460687 — Supplemental material for Proteomic Profile Analysis of Plasma and Aqueous Humor from Glaucoma and Nonglaucomatous Patients
Supplemental material, sj-xlsx-7-opt-10.1177_10807683261460687 for Proteomic Profile Analysis of Plasma and Aqueous Humor from Glaucoma and Nonglaucomatous Patients by Carmen L. Pessuti, Chia-Ling Huang, Angela Banks, Nhi Vo, Lori Jennings, Joseph Loureiro, Kleber S. Ribeiro, Deise Fialho Costa, Heloisa Nascimento, Cristina Muccioli, Ivan Maynart Tavares, Alessandra G. Commodaro, Rubens Belfort, Christopher W. Wilson, Amy Chen, Ganesh Prasanna, and VijayKrishna Raghunathan
Footnotes
Authors Disclosure Statement

Acknowledgment
The authors would like to thank the patient donors for the biological fluid samples without whose consent these experiments would be impossible.
Funding Information
This work was sponsored by the Novartis Biomedical Research and the CNPq (Ministry of Science, Technology, and Innovation of Brazil).
References
Supplementary Material
Please find the following supplemental material available below.
For Open Access articles published under a Creative Commons License, all supplemental material carries the same license as the article it is associated with.
For non-Open Access articles published, all supplemental material carries a non-exclusive license, and permission requests for re-use of supplemental material or any part of supplemental material shall be sent directly to the copyright owner as specified in the copyright notice associated with the article.
