
Abstract
The Sardinia Radio Telescope (SRT), located near Cagliari (Italy), is the world’s second largest fully steerable radio telescope endowed with an active-surface system. Its primary mirror has a quasi-parabolic shape with a diameter of 64 m. The configuration of the primary mirror surface can be modified by means of electro-mechanical actuators. This capability ensures, within a fixed range, the balancing of the deformation caused, for example, by loads such as self-weight, thermal effects and wind pressure. In this way, the difference between the ideal shape of the mirror (which maximizes its performances) and the actual surface can be reduced. In this paper the authors describe the characteristics of the SRT, the close-range photogrammetry (CRP) survey developed in order to set up the actuator displacements, and a finite element model capable of accurately estimating the structural deformations. Numerical results are compared with CRP measurements in order to test the accuracy of the model.
Keywords
1. Introduction
Radio telescopes are antennas devoted to the analysis and study of celestial objects, collecting the radiation emitted in the radio region of the electromagnetic spectrum (see Figure 1). The received signals are extremely weak, thus large collecting areas are required. Moreover, the larger the size of a radio telescope, the better its angular resolution is. Nevertheless, large instruments are more sensible to deformations in their structure due to gravity, temperature and wind.
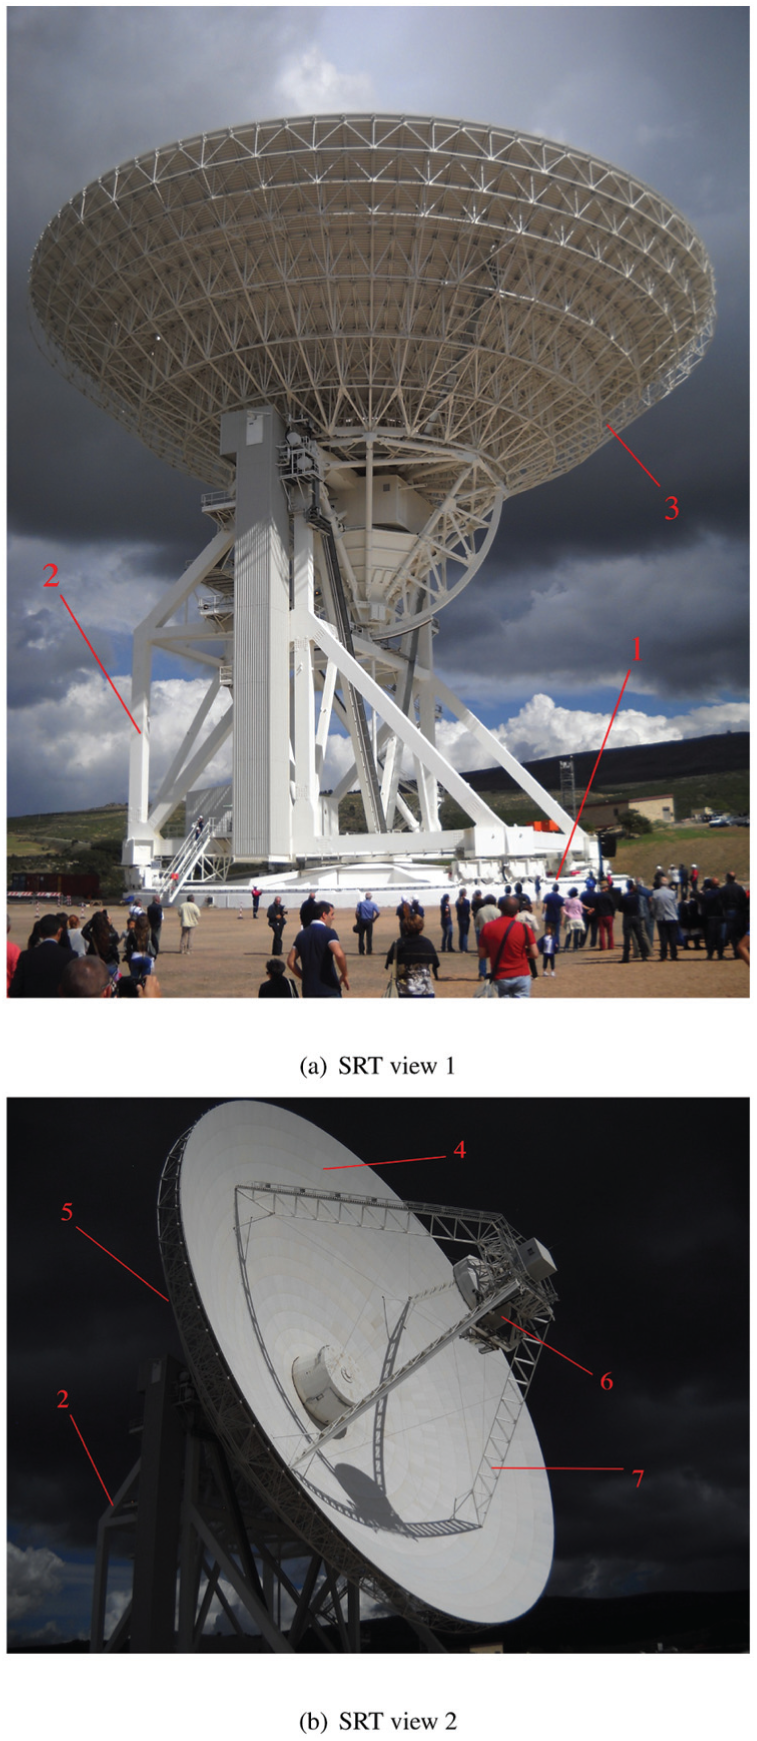
SRT parts: (1) Reinforced concrete base and foundation. (2) Alidade. (3) Backup structure. (4) Principal mirror (M1). (5) Thermal shield (this is not part of the real structure although it was expected to be present in the designed one). (6) Quadrupod structure. (7) Secondary mirror (M2).
In order to contrast gravitational effects, radio telescopes may be equipped with a so-called active-surface (AS) system, a complex device designed to modify in real time the antenna shape.
Radio telescope deformations can be divided into spatially large-scale deformations, affecting the pointing and the focus, and small-scale deformations, which can decrease the efficiency of the telescope.
The efficiency of a radio telescope is described by the aperture efficiency

where

where

where
Note that
In order to correct the deformations in real time by means of the AS system, during telescope operation, a measuring technique is needed for evaluating them. Alternatively, a sensor network gathering information for their modeling and providing data to the telescope control system has to be installed.
Close-range photogrammetry (CRP) is a non-contact measuring technique widely used in the radio astronomical field for the representation of the shape of large antennae. The first applications of this method to radio telescopes were the measurements of the 300 ft (91.44 m) and 85 ft (25.91 m) antennae at the National Radio Astronomy Observatory in Green Bank, West Virginia, in 1962 [3], with a camera hosted on a helicopter, achieving an accuracy of 1 mm over the 100 m size of the telescope. Afterwards, it was used in the setting of one of the 12 m diameter Atacama Large Millimeter/Submillimeter Array antennae [1], with a fully digital system achieving an accuracy of 0.030 mm.
Recently, photogrammetry methods have also been applied to the Sardinia Radio Telescope (SRT) antenna. In this paper, we aim to compare photogrammetric data, obtained during the alignment of its primary mirror [4], see Figure 2, to the finite element (FE) models of the whole structure [5].
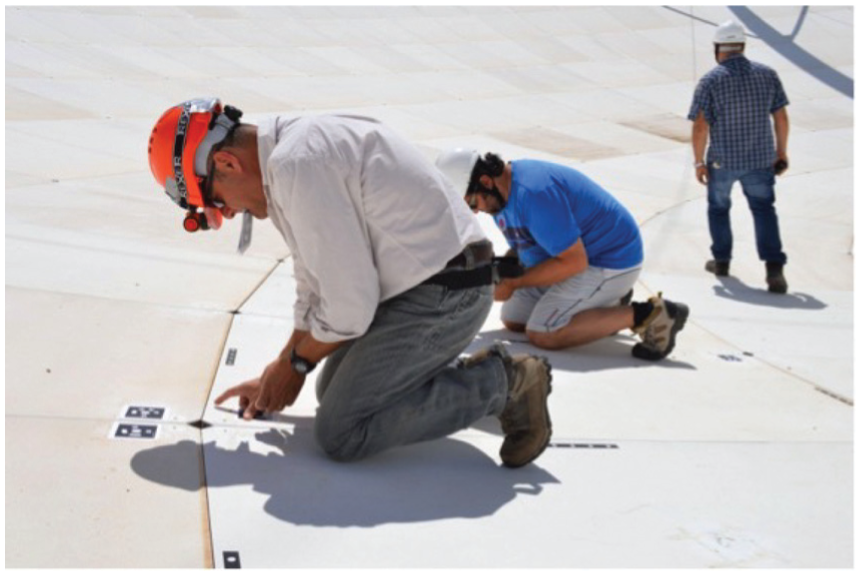
Setting up photogrammetric measurements at the SRT.
In Section 2, a description of the SRT is presented; photogrammetric measurements are described in Section 3, while the FE numerical model and its results are presented respectively in Sections 4 and 5. Finally conclusions and new research perspectives are drawn in Section 6.
2. The Sardinia Radio Telescope
The SRT is a fully steerable antenna for observing the sky at frequencies between 300 MHz and 100 GHz. It has a Gregorian configuration, with a quasi parabolic shaped primary mirror (M1) and an elliptical shaped secondary mirror (M2), see again Figure 1. Its highest operating frequency, 100 GHz, corresponds to a wavelength of 3 mm. Thus, according to Ruze’s law, a good efficiency value requires that the geometric deformations from its ideal shape must be kept below 0.185 mm for
During the construction phase, thanks to photogrammetry, panels were aligned by hand, reaching a global RMS of about 0.3 mm for the
3. Photogrammetric measurements
As stated before, CRP has been widely used throughout the whole process of SRT construction. The reason for this choice lies in its good combination of precision and survey speediness, so that CRP is preferred with respect to other survey techniques such as topographic survey with Total Station or laser tracker [4].
Indeed, CRP can reach a very high precision if a few precautions are taken. Among them:
multi-image acquisition, taken all around the object in order to simultaneously enable camera calibration by means of a bundle adjustment procedure (in any case the use of metric cameras is mandatory), over-determination of each point of measure for outlier detection, equally distributed sigmas for the three point coordinates;
specific signalization of measurement points with artificial targets providing unambiguous definition and automatic point identification;
stability of environmental conditions.
Denoting by

where
Values of
Photogrammetric measurements have been performed by the Sigma3d Company taking into account the different antenna parts:
subreflector panel alignment in which a tolerance of 0.05 mm (global RMS) was specified;
backup structure (BUS) deflection verification in which the structure deformation between elevation
main reflector panel alignment at
main reflector adjacent panels corner alignment in which a tolerance of
main reflector deflections at the 6 elevation positions
Of the above-mentioned tasks, only the last one is of interest for this paper. For each of the six elevations considered, a set of measurements covering the entire mirror was performed, in order to determine shape deviations from the ideal surface in a panel-wise way. The whole survey was performed during one night, in order to fulfill the environmental specifications regarding wind speed, dew point and temperature variation.
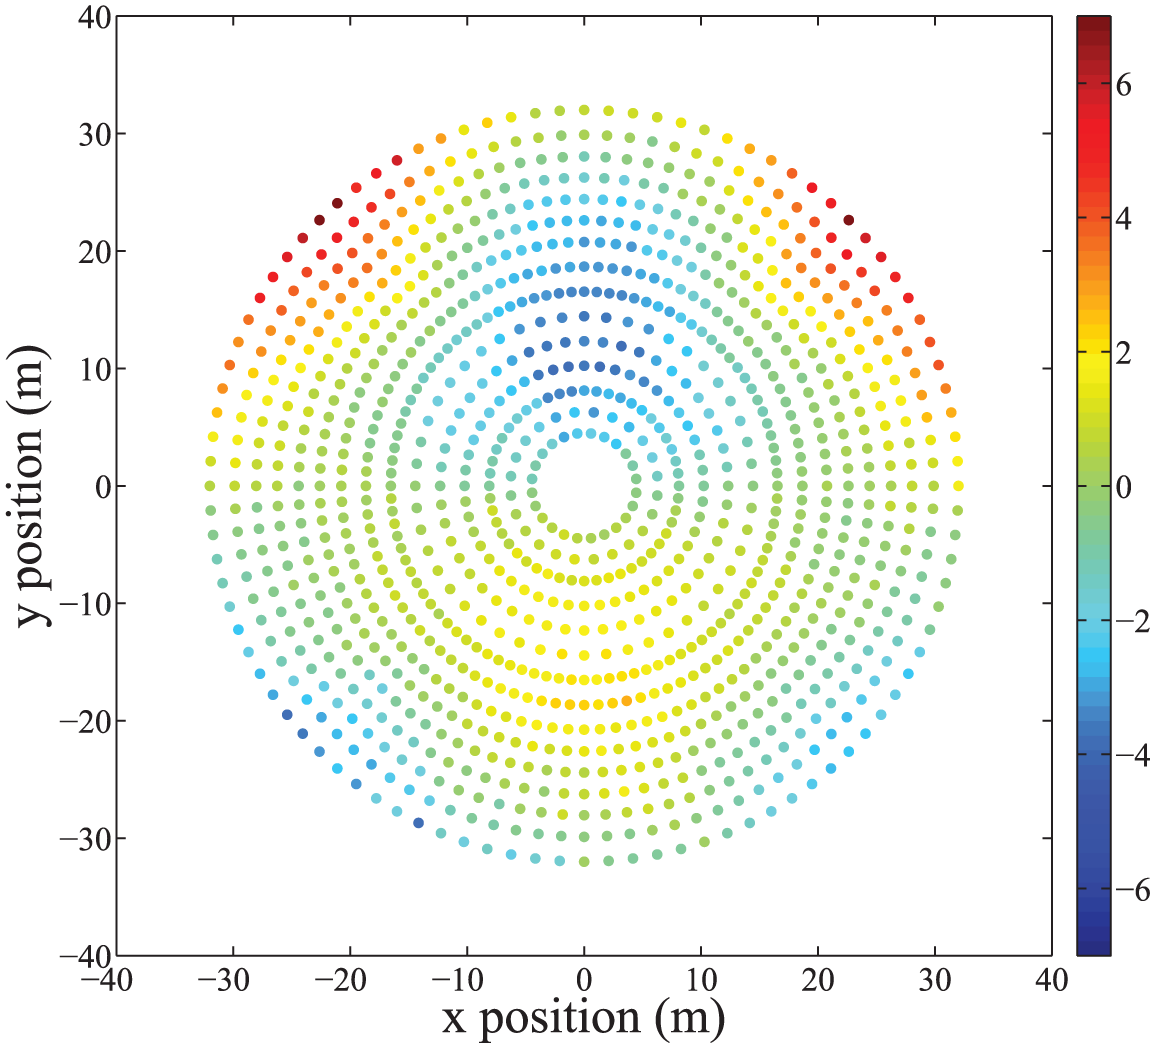
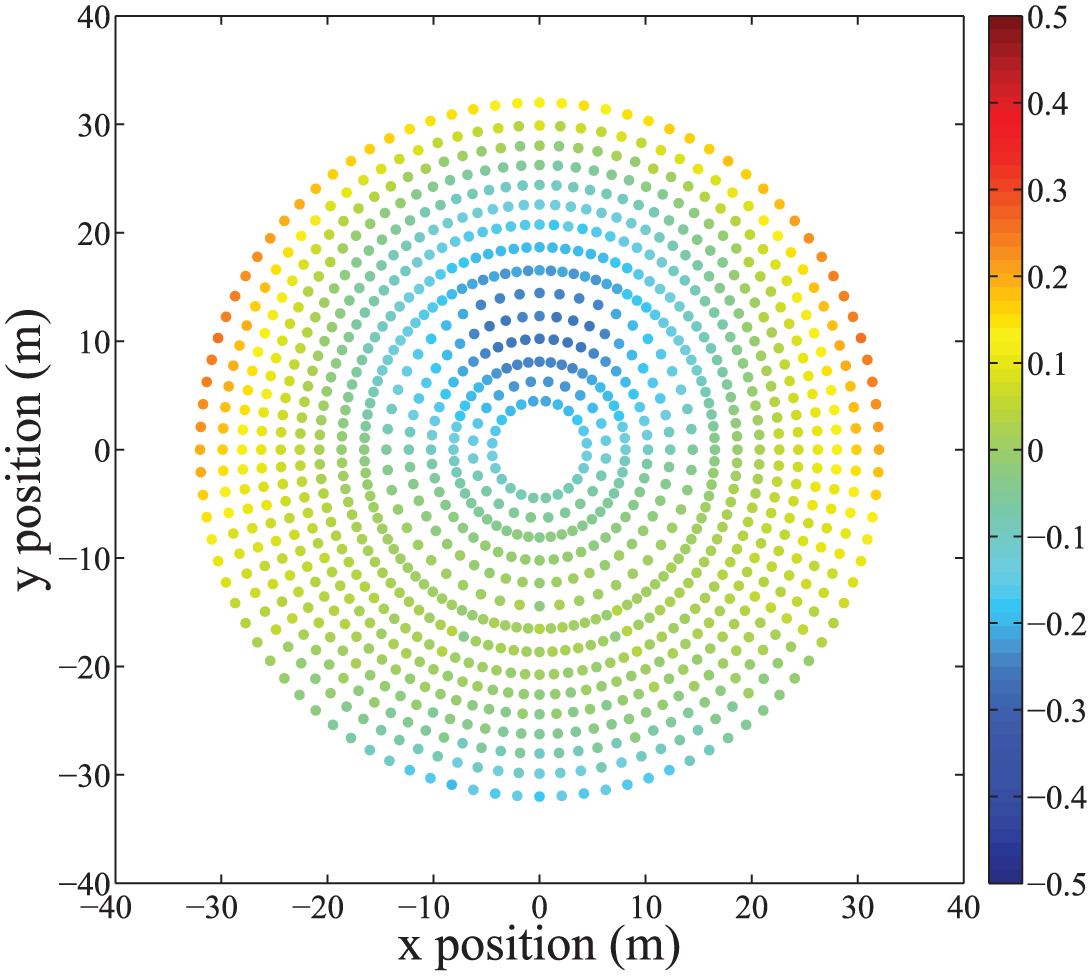
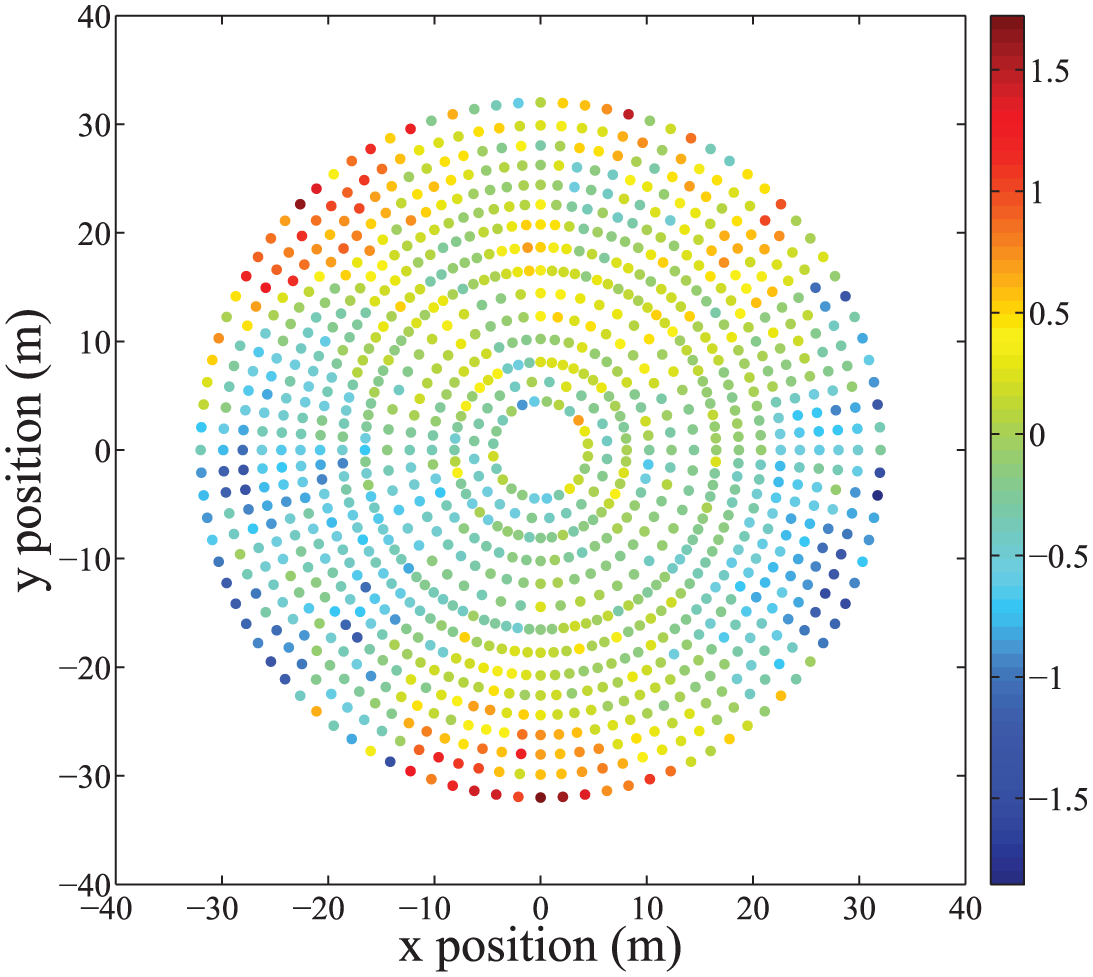
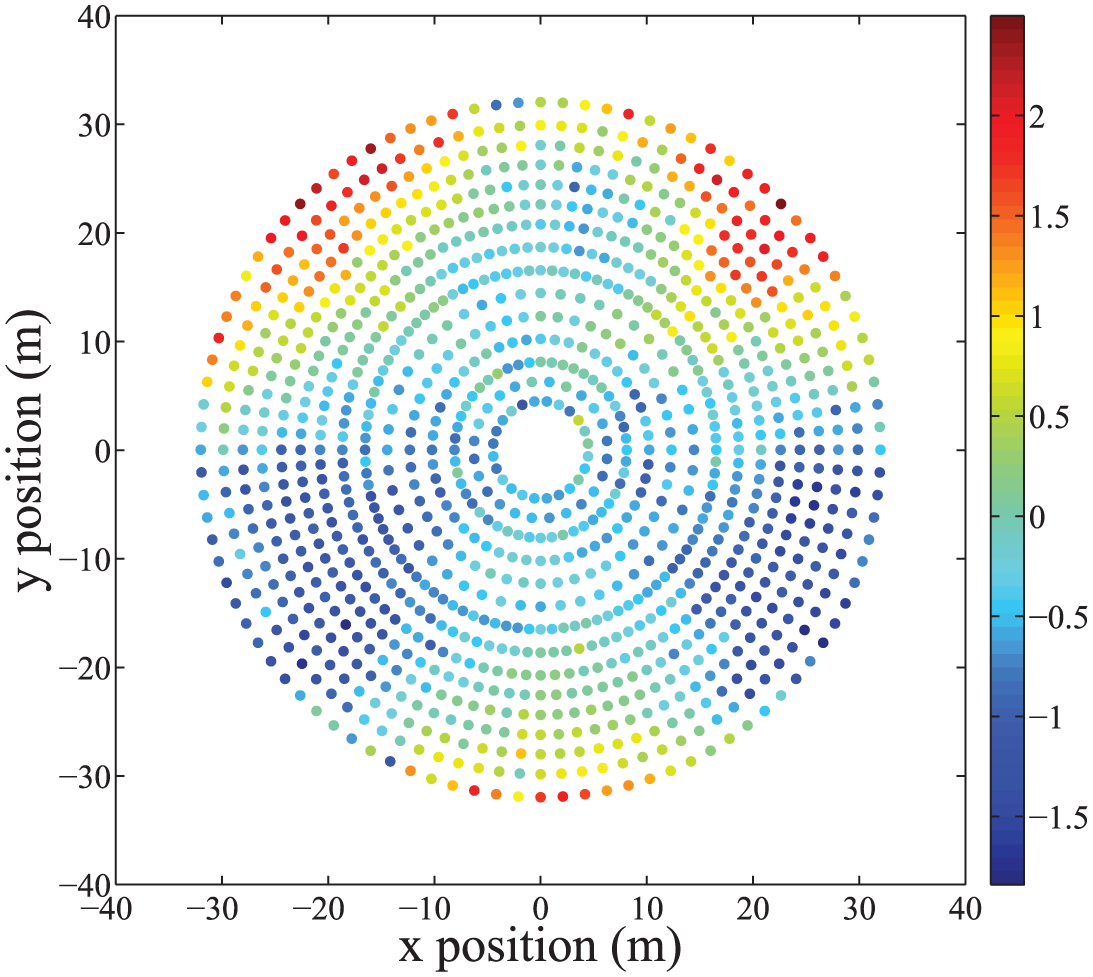
The six measurement sets were compared with the ideal surface taking into account only the small-scale displacements. To do so, a best-fitting coordinate transformation from the real to the ideal coordinates was estimated, leaving as many degrees of freedom as many real movements the telescope may do, to compensate for. The outcome of this last photogrammetric task was a look-up table containing the displacements of all the actuators, in each of the six elevation positions, computed in the normal direction to the local surface, to use them directly as movements to give in order to reach a global
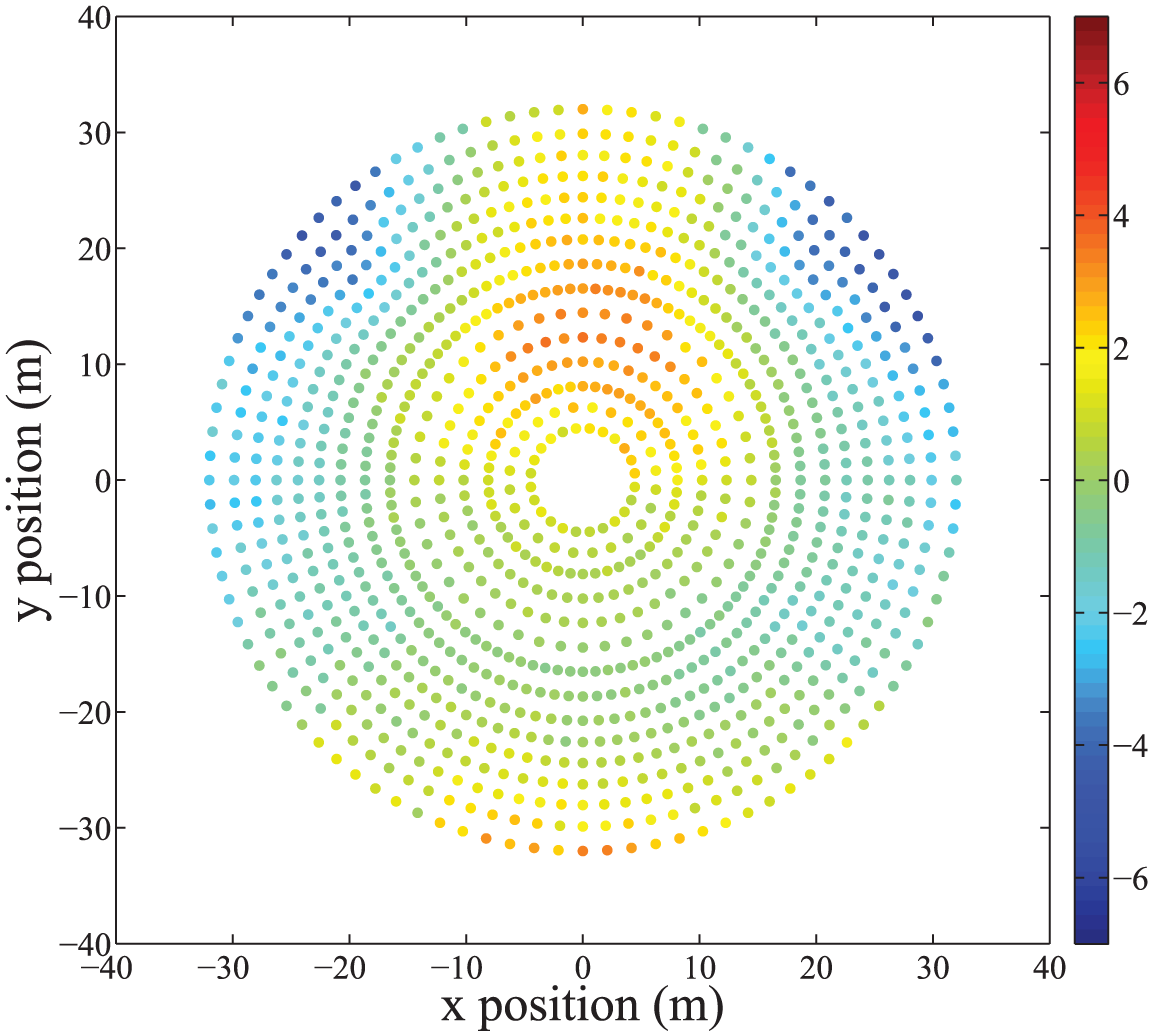
Graphical rendering of a CRP-deduced look-up table for displacement of each actuator at
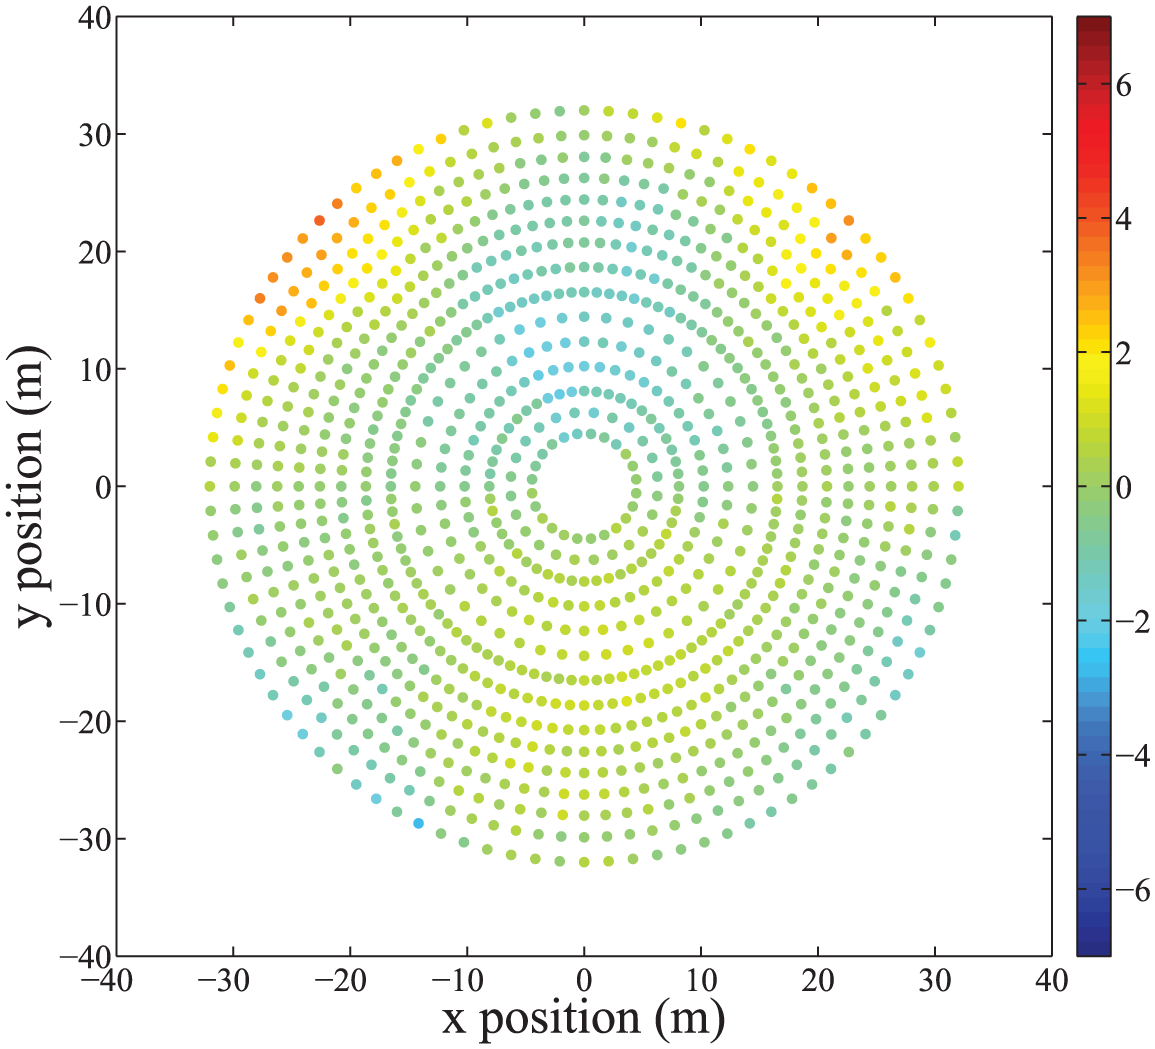
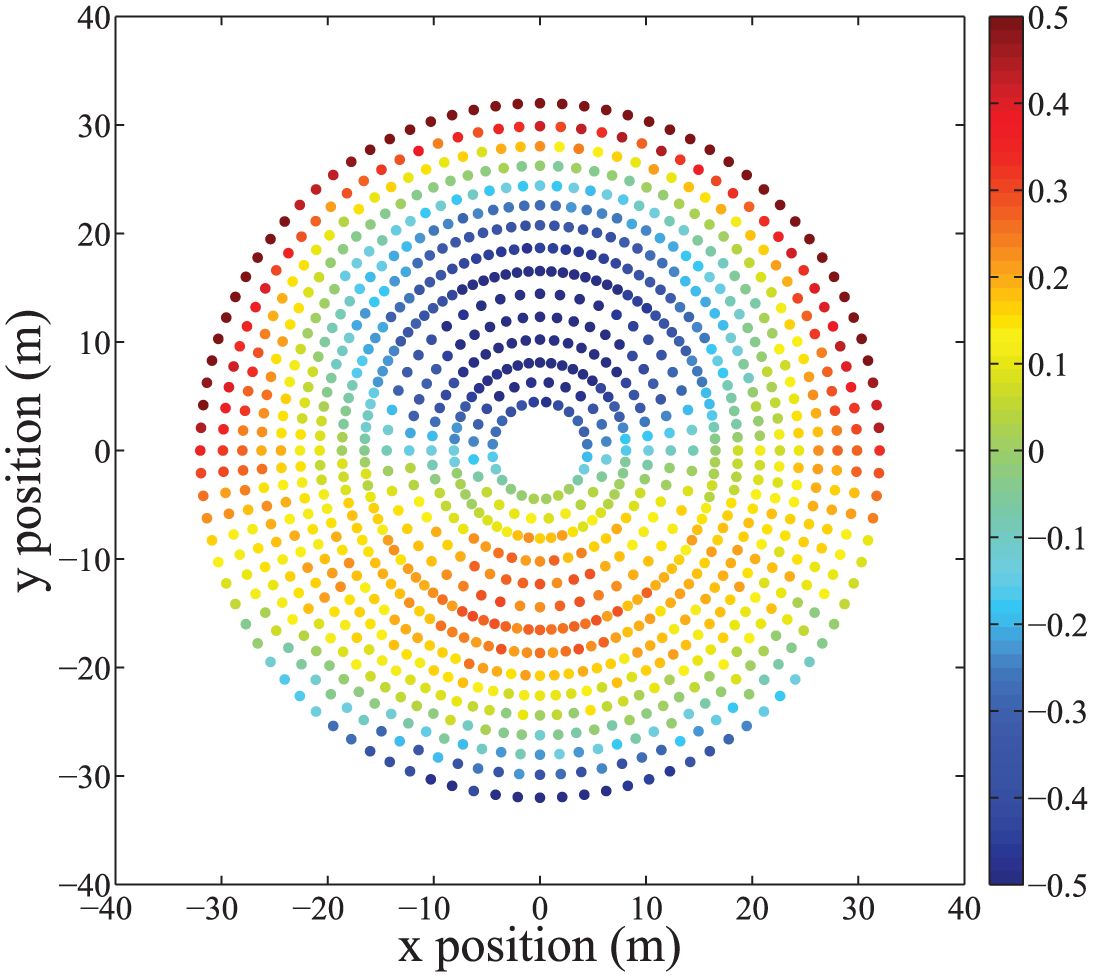
Graphical rendering of a CRP-deduced look-up table for displacement of each actuator at
Graphical rendering of a CRP-deduced look-up table for displacement of each actuator at

Graphical rendering of a CRP-deduced look-up table for displacement of each actuator at
4. Description of finite elements models of the Sardinia Radio Telescope
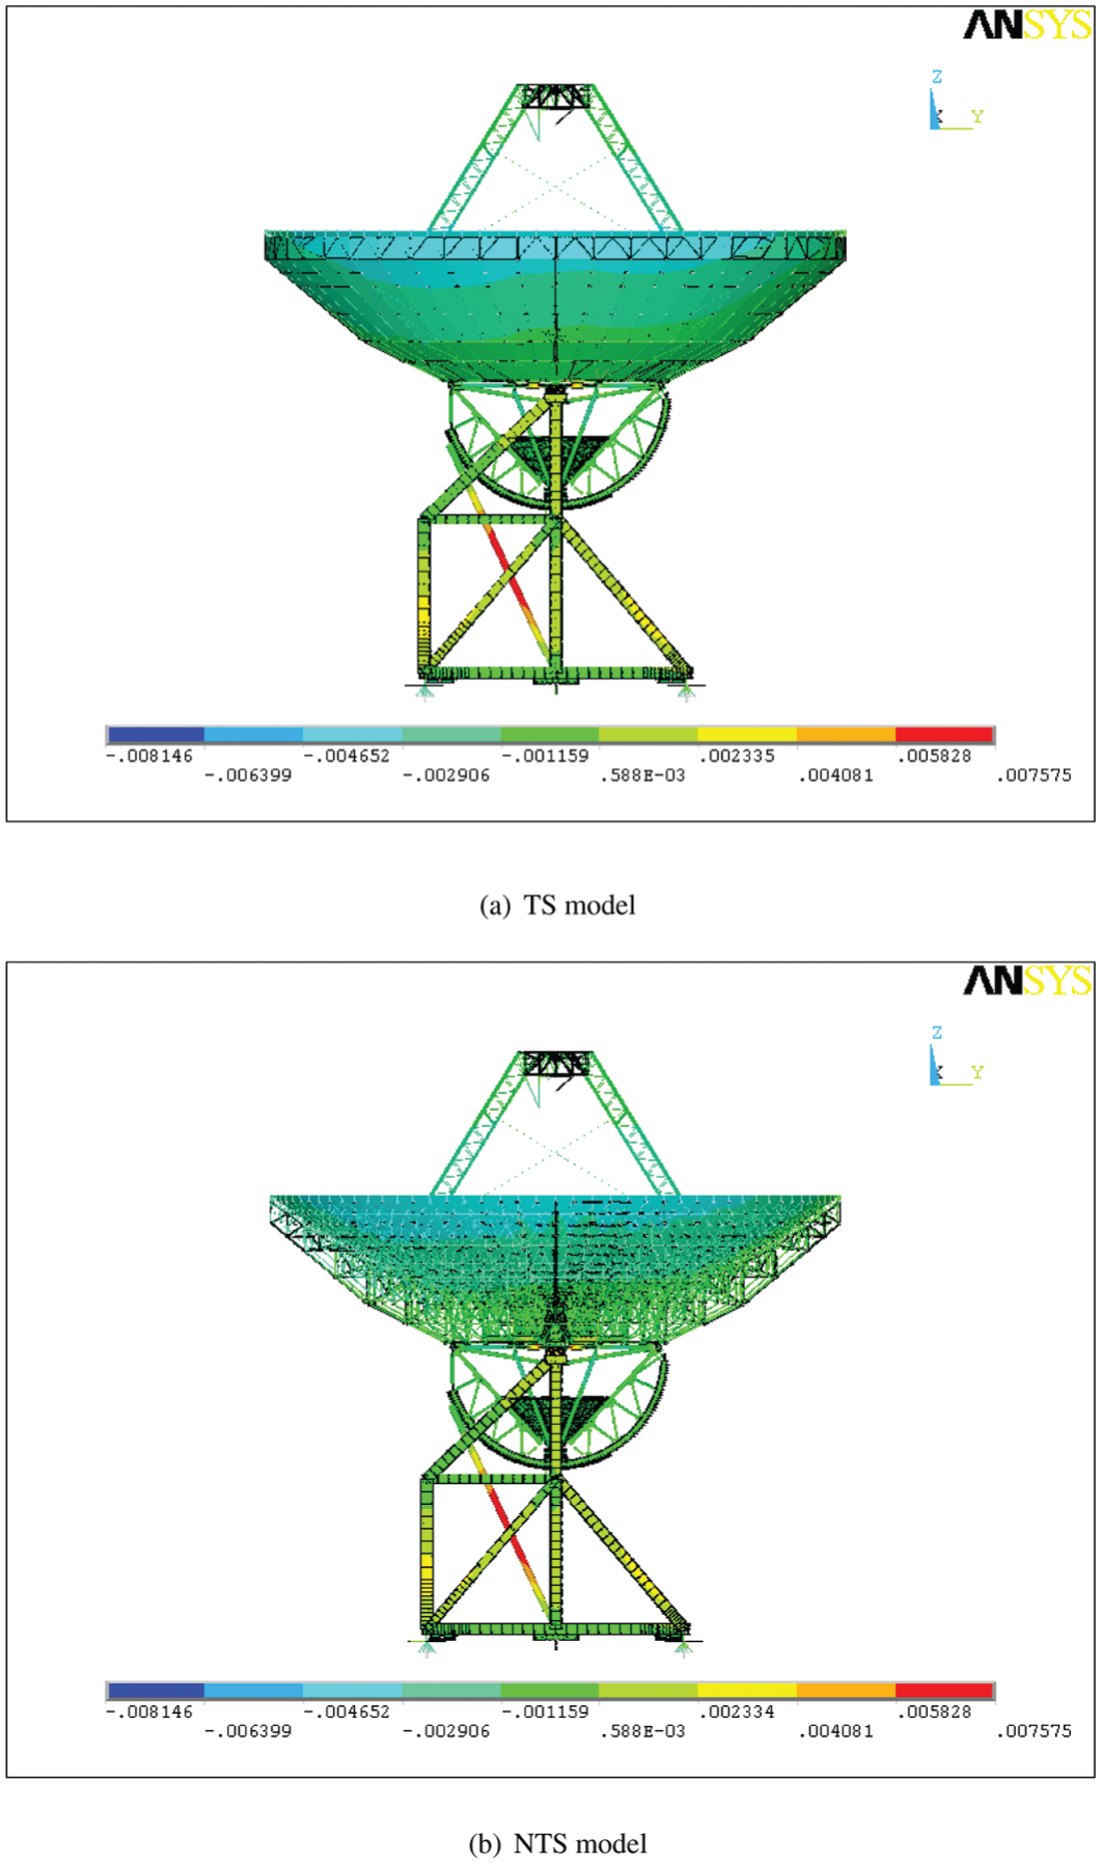
A powerful and widespread method for describing the mechanical response of a structure is the FE method [8]. It allows simulating the structural performance for a wide range of configurations/load conditions. During the design stage of the SRT several FE models were prepared. In particular, an ANSYS FE model was built by BCV Progetti. The last version of it (v. 37), to still include the thermal shield, which was originally designed to wrap the rear part of the backup structure is described here, see Figure 7.
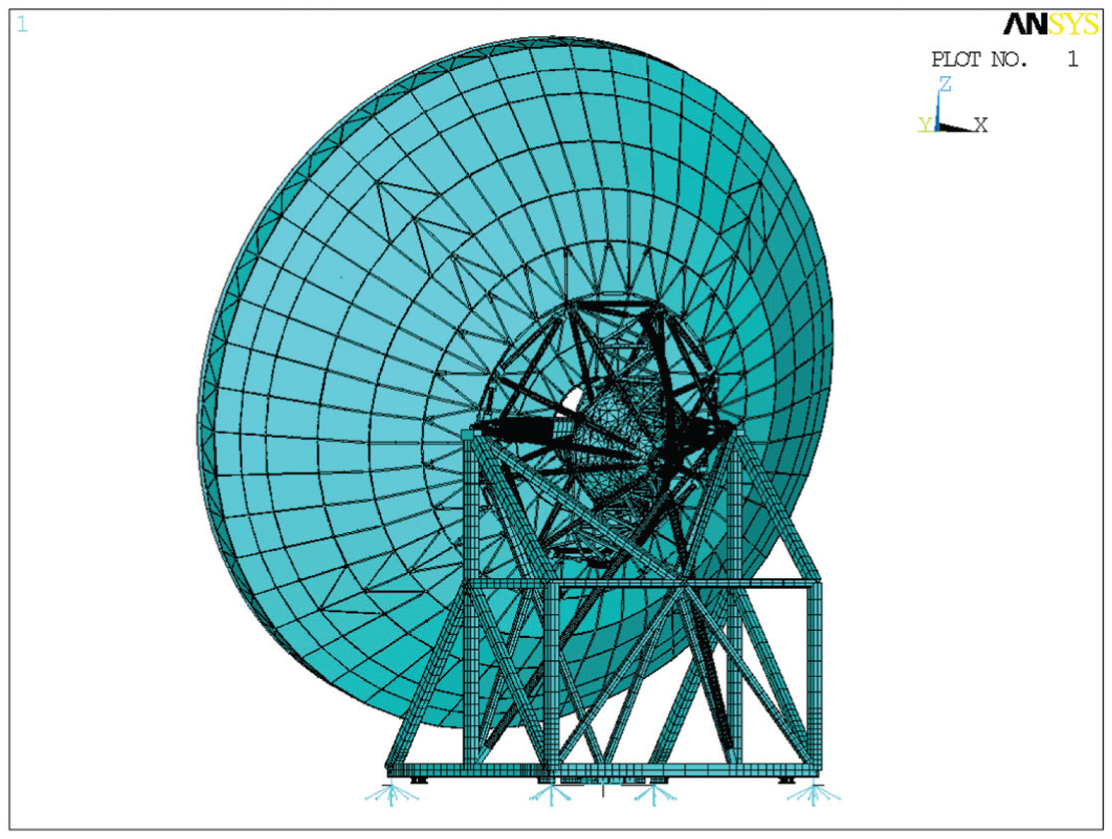
Back view of the SRT FE model (including the Thermal Shield) at elevation
It consists of 92,788 nodes, 94,140 elements and a total amount of 463,871 degrees of freedom. Even with such complexity, the computational cost of a linear elastic static run is quite limited and a popular personal computer can obtain the results in less than 1 min.
In a bottom-up sequence, the following parts might be singled out (see Figures 1 and 7–8):
Reinforced concrete base and foundation rail: they have been considered as perfectly rigid bodies and have not been modeled. Indeed they have been carefully designed to guarantee the verticality of the azimuth axis. Suitable displacement constraints have been inserted at the end of the base.
Alidade: represents the 3D truss structure which supports the portion of SRT (BUS, principal mirror, thermal shield, quadrupode, secondary mirror) which can tilt about the elevation axis. It is modeled by means of two-noded Timoshenko beam elements with seven degrees of freedom per node (taking into account warping, too), and by two-noded beam elements with six degrees of freedom per node. The latter group allows for independent end-release conditions, which are useful for correctly representing a 3D truss member.
BUS: the structure, shaped like a portion of an elliptic paraboloid which supports the antenna of the SRT. It is represented by a complex 3D truss system. Each structural member is modeled by at least four two-noded beam elements with six degrees of freedom at each node.
Main reflector (M1), i.e. the principal mirror: this is placed on the front surface of the BUS and is composed of 1008 panels, each of them linked to the BUS by means of a rigid multi-point-constraint element. Any panel is represented by a single-shell element with four nodes and six degrees of freedom at each node. Only membrane stiffness is considered.
Thermal shield: this is placed on the rear surface of the BUS and is composed of 505 panels. Each panel, which is directly attached to the nodes of the BUS, is represented by a single-shell element with three or four nodes and six degrees of freedom at each node. Only membrane stiffness is considered.
Quadrupod structure: this is made of a four-legged truss structure which supports the secondary mirror. It is modeled by a mixture of two-noded Timoshenko beam elements and four-noded shell elements with six degrees of freedom per node. In this case shell elements have both bending and membrane stiffness accounted for.
Secondary mirror (M2): only the support structure has been modeled by multi-point-constraint elements and lumped mass elements. Panels have not been explicitly modeled.

Back view of the SRT FE model (without the thermal shield) at elevation
From a mechanical point of view, the steel members (alidade, BUS, quadrupod) are represented by an isotropic material model characterized by a Young’s modulus
Considering the low-intensity loading experienced by the SRT, which for the standard calibration phase is subjected only to gravitational forces and to actuator displacements, the numerical model of the structure was formulated under the assumptions of infinitesimal strain and linear elastic behavior of all materials.
However, the thermal shield described in point 5 above, which in the design stage was expected to cover the BUS, providing thermal insulation, was not mounted on the SRT, consequently, another FE model of it, taking into account the absence of this part, has been developed by our research group, see Figure 8. For this model the number of elements decreased to 93,635 while the total number of degrees of freedom and the number of nodes remained the same. The total weight was reduced to
5. Analysis of results and comparisons
CRP measurements yield a set of actuator displacements that can be interpreted as a synthetic measure of the deformation of the SRT principal mirror, see Figures 3–6. The FE models have been compared with these CRP data. Before proceeding to this comparison it is necessary to transform the FE results (which typically provide
In order to really understand this problem it is better to depict it from a mathematical point of view: let us assume that
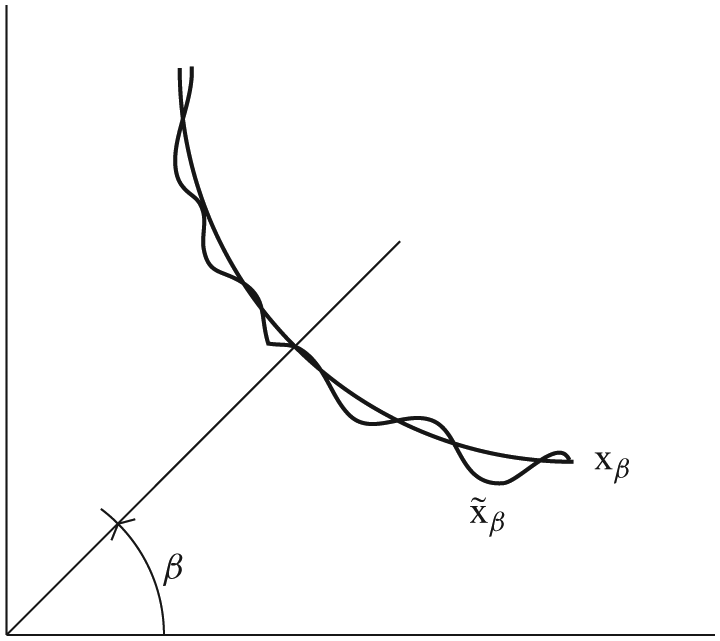
Sketch of the optimal
In fact, the SRT can reduce the difference between

where
1. First the average normal vector

where
2. Then, a unit vector

In the following sections comparison between the FE model with (denoted by ‘TS’) and without (denoted by ‘NTS’) a thermal shield and CRP data is provided in terms of such actuator elongations, evaluated point-wise and globally by means of an RMS deviation,
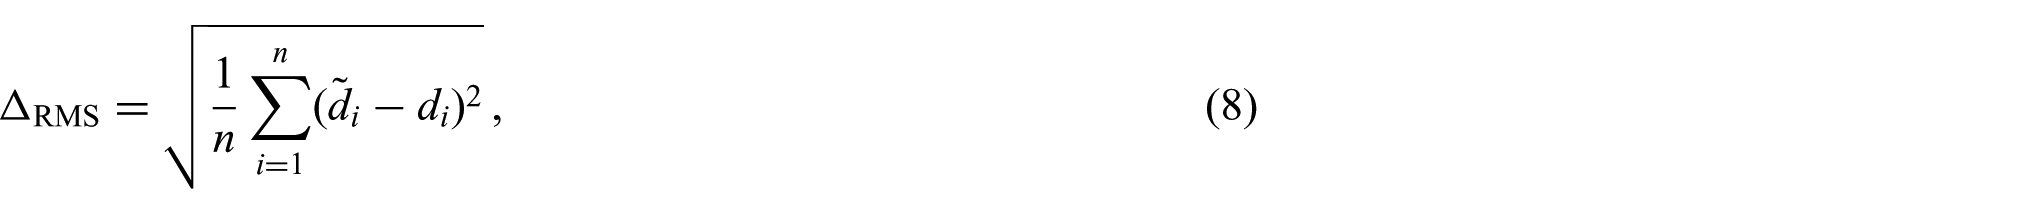
between two sets of
5.1. Comparison between TS FE and NTS FE models
In order to develop a thorough analysis of the structural influence of the thermal shield, several comparisons between the model with and without thermal shield have been performed. For the sake of conciseness the configuration characterized by
FE model displacements along the
FE model displacements along the
FE model displacements along the
FE model displacements along the
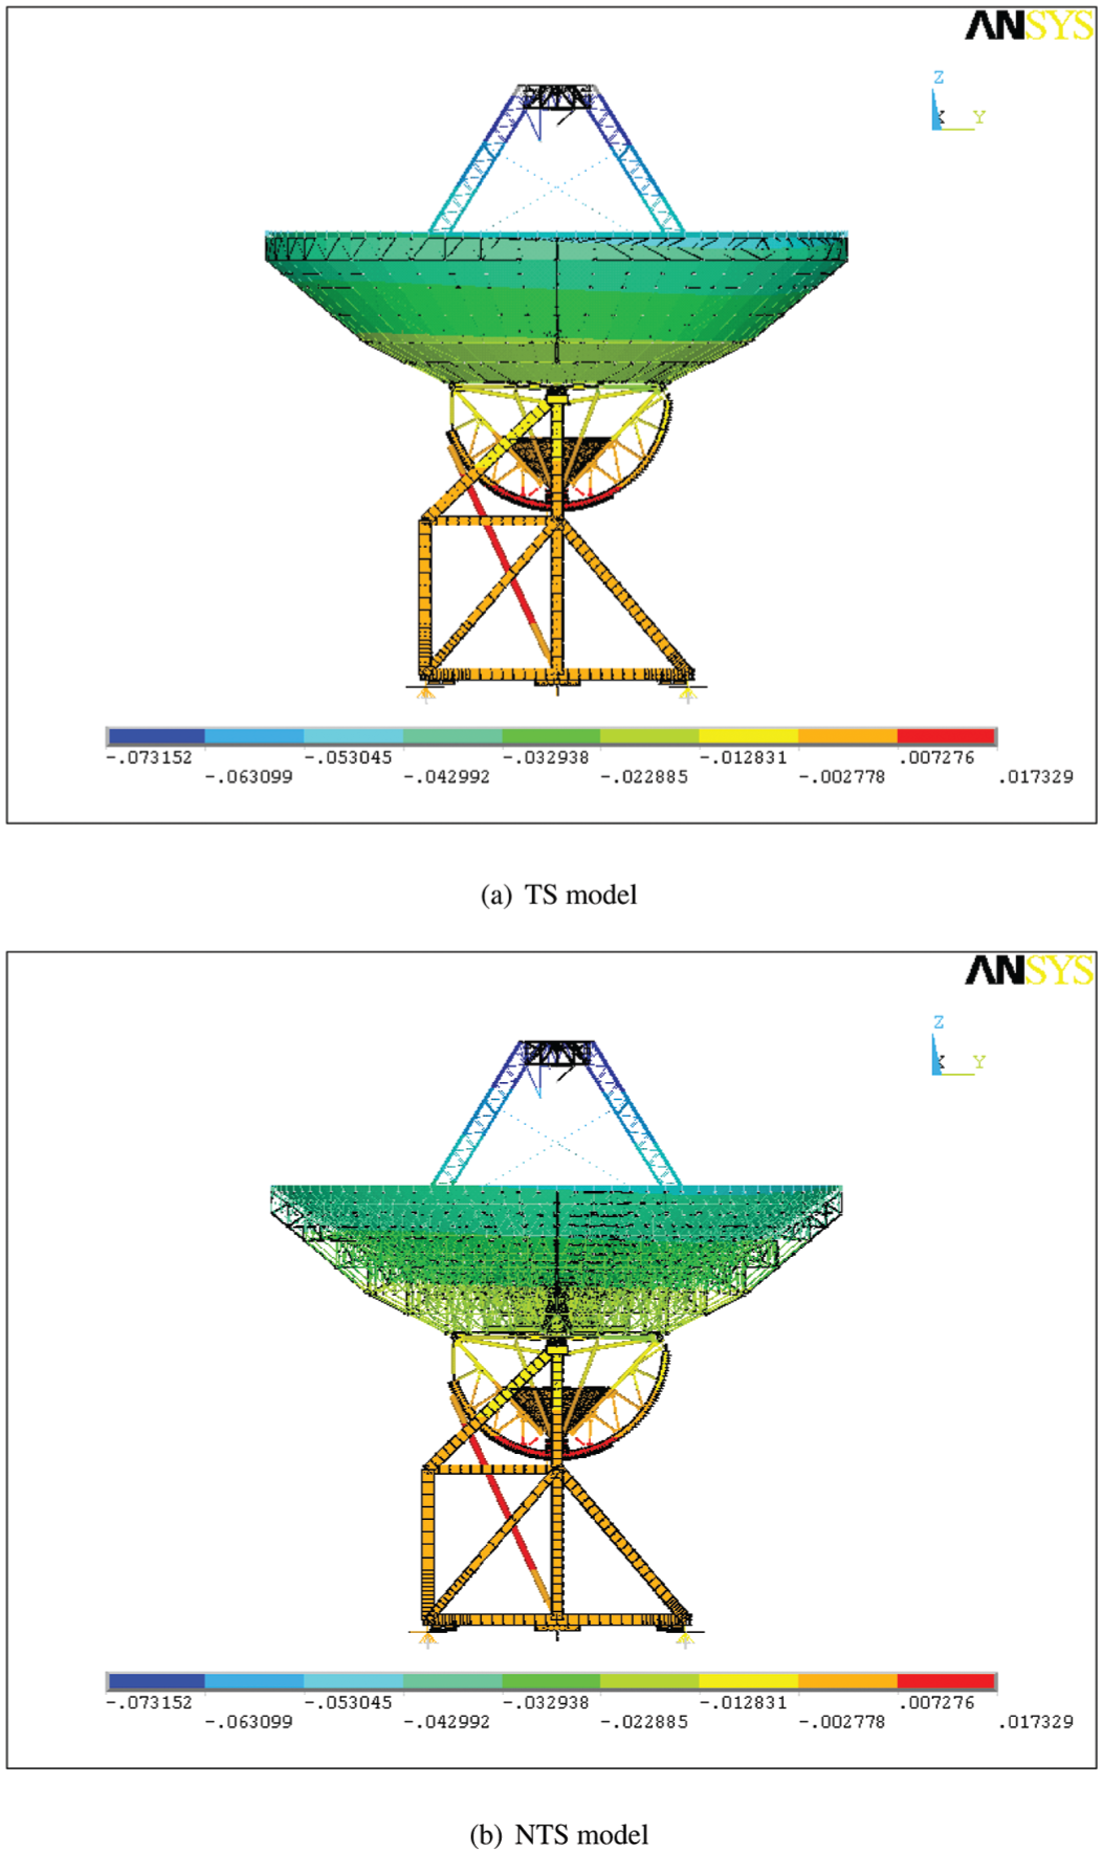
FE model displacements along the
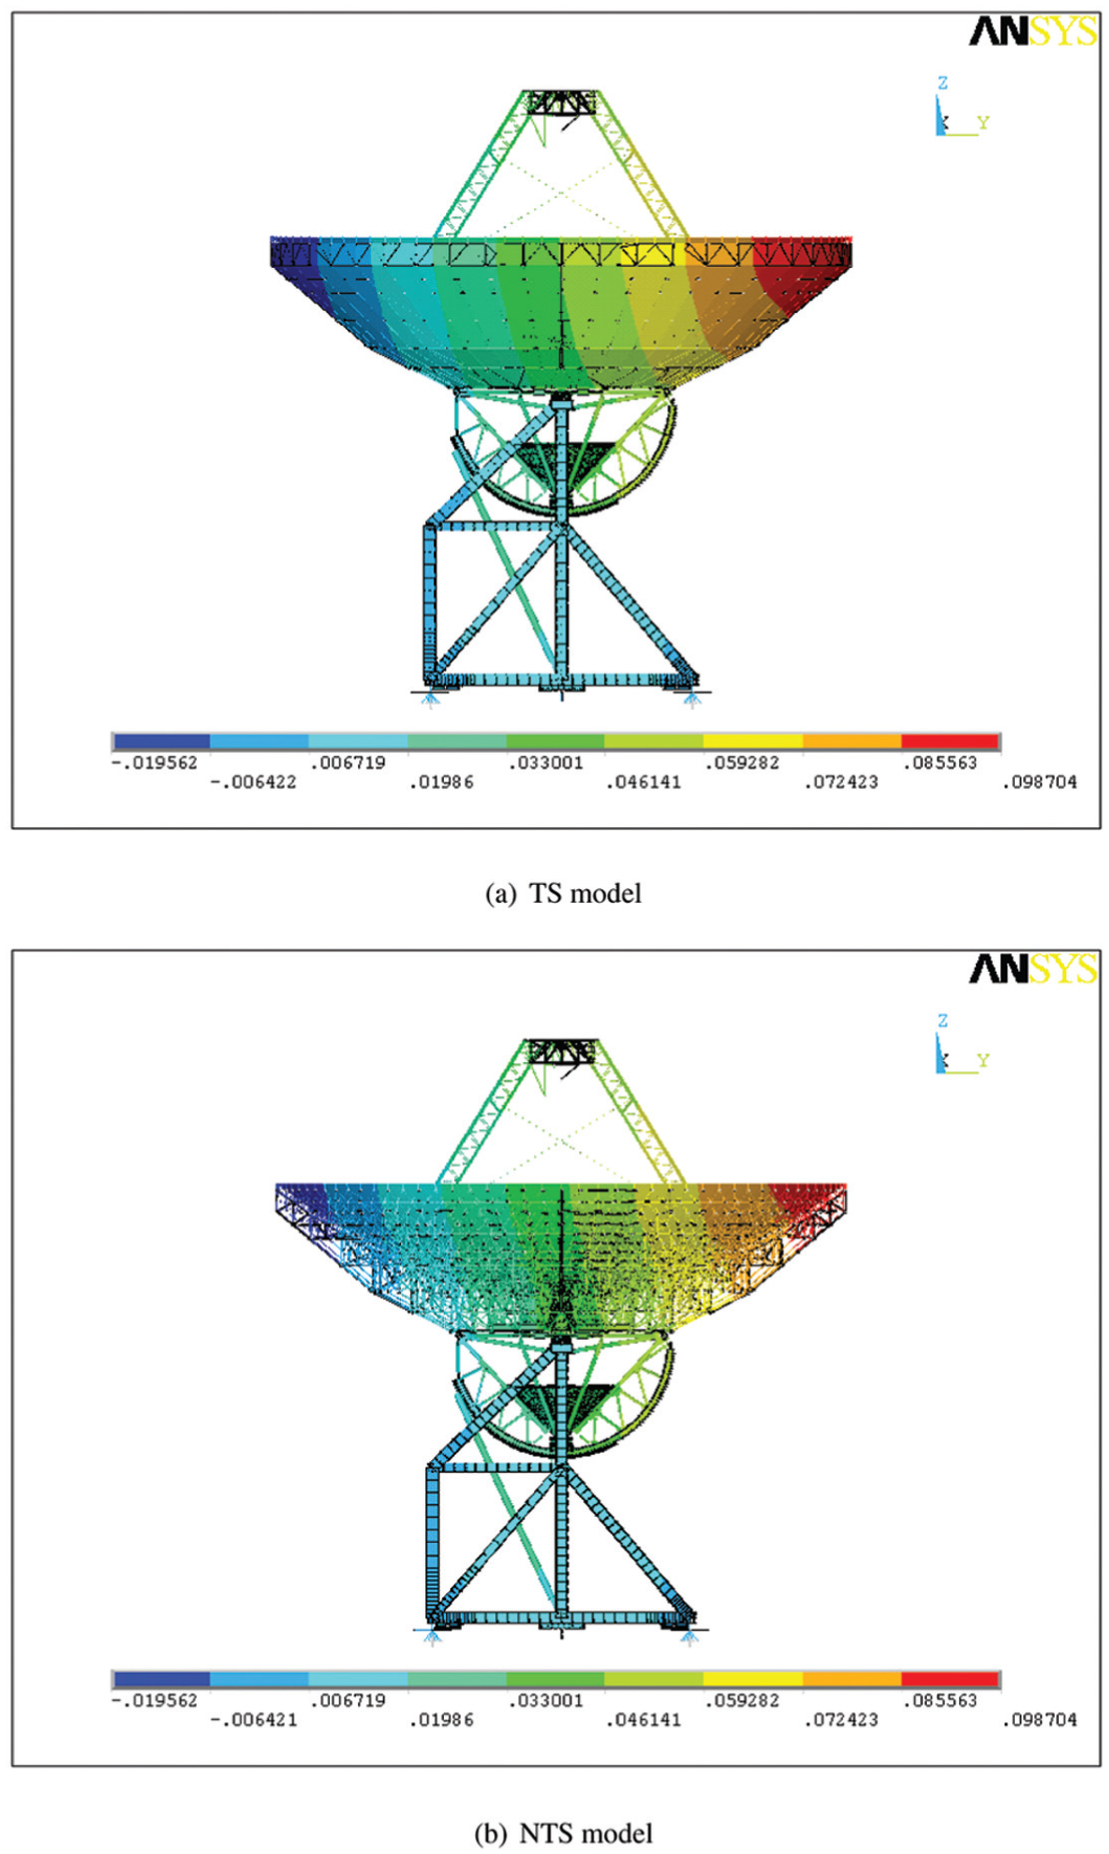
FE model displacements along the
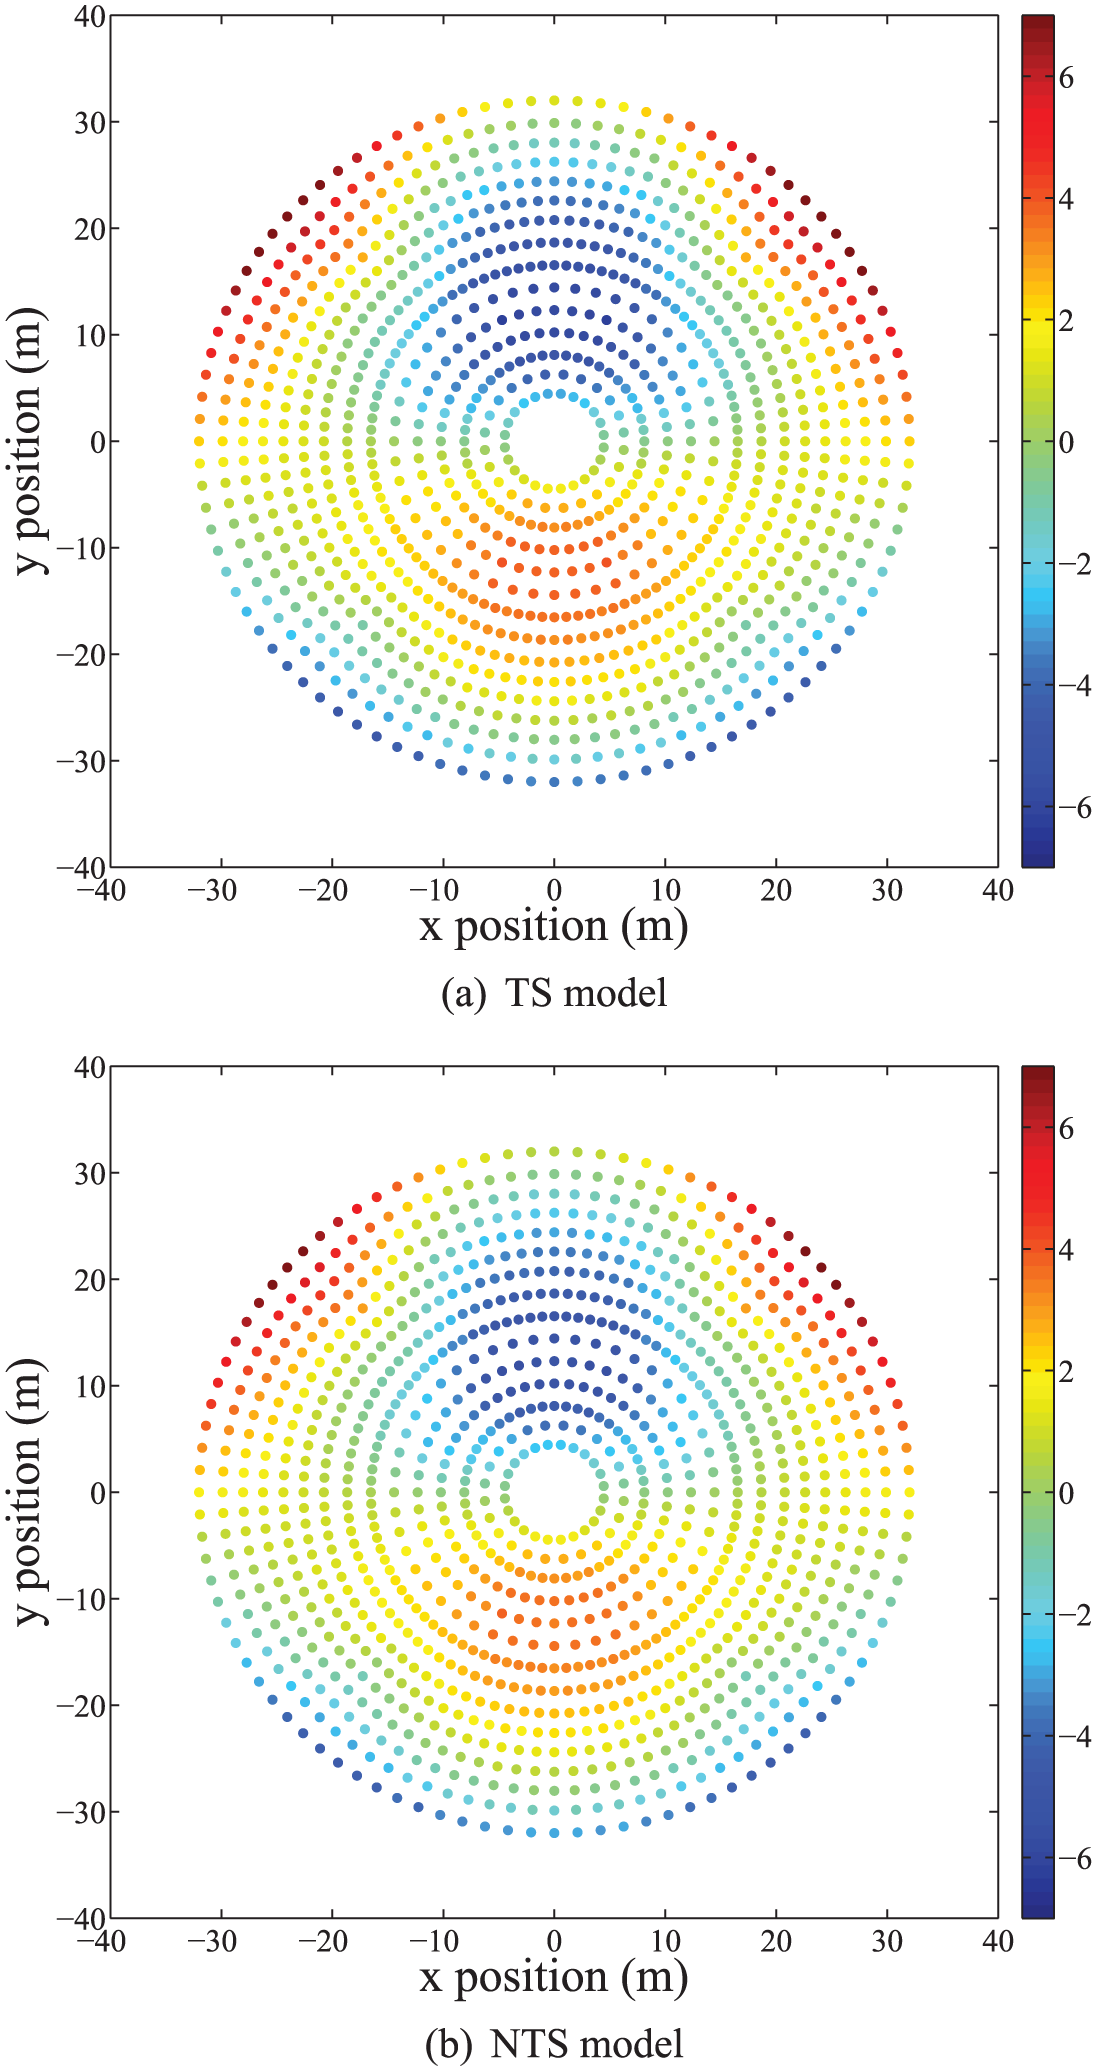
Actuator displacements estimated by means of FE models for
In order to highlight these differences, the actuator displacements have been evaluated for the other two elevation angles (
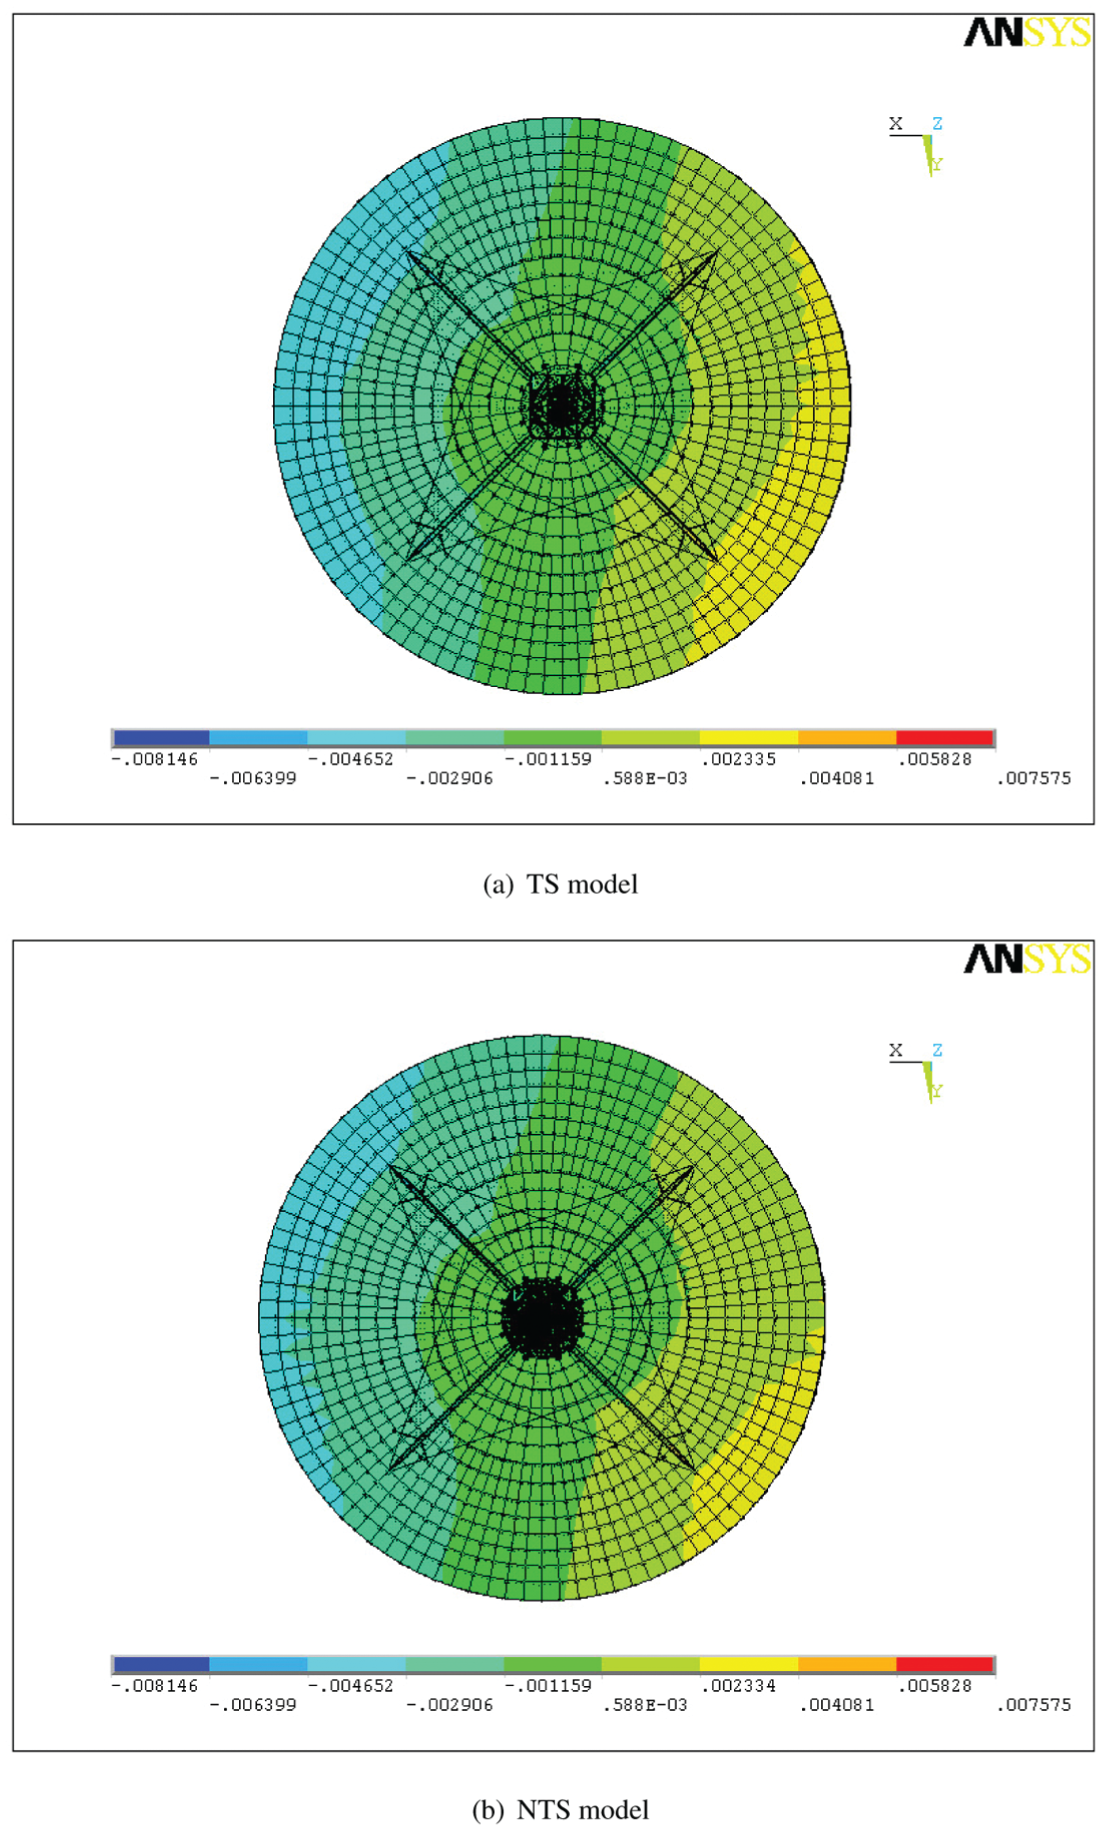
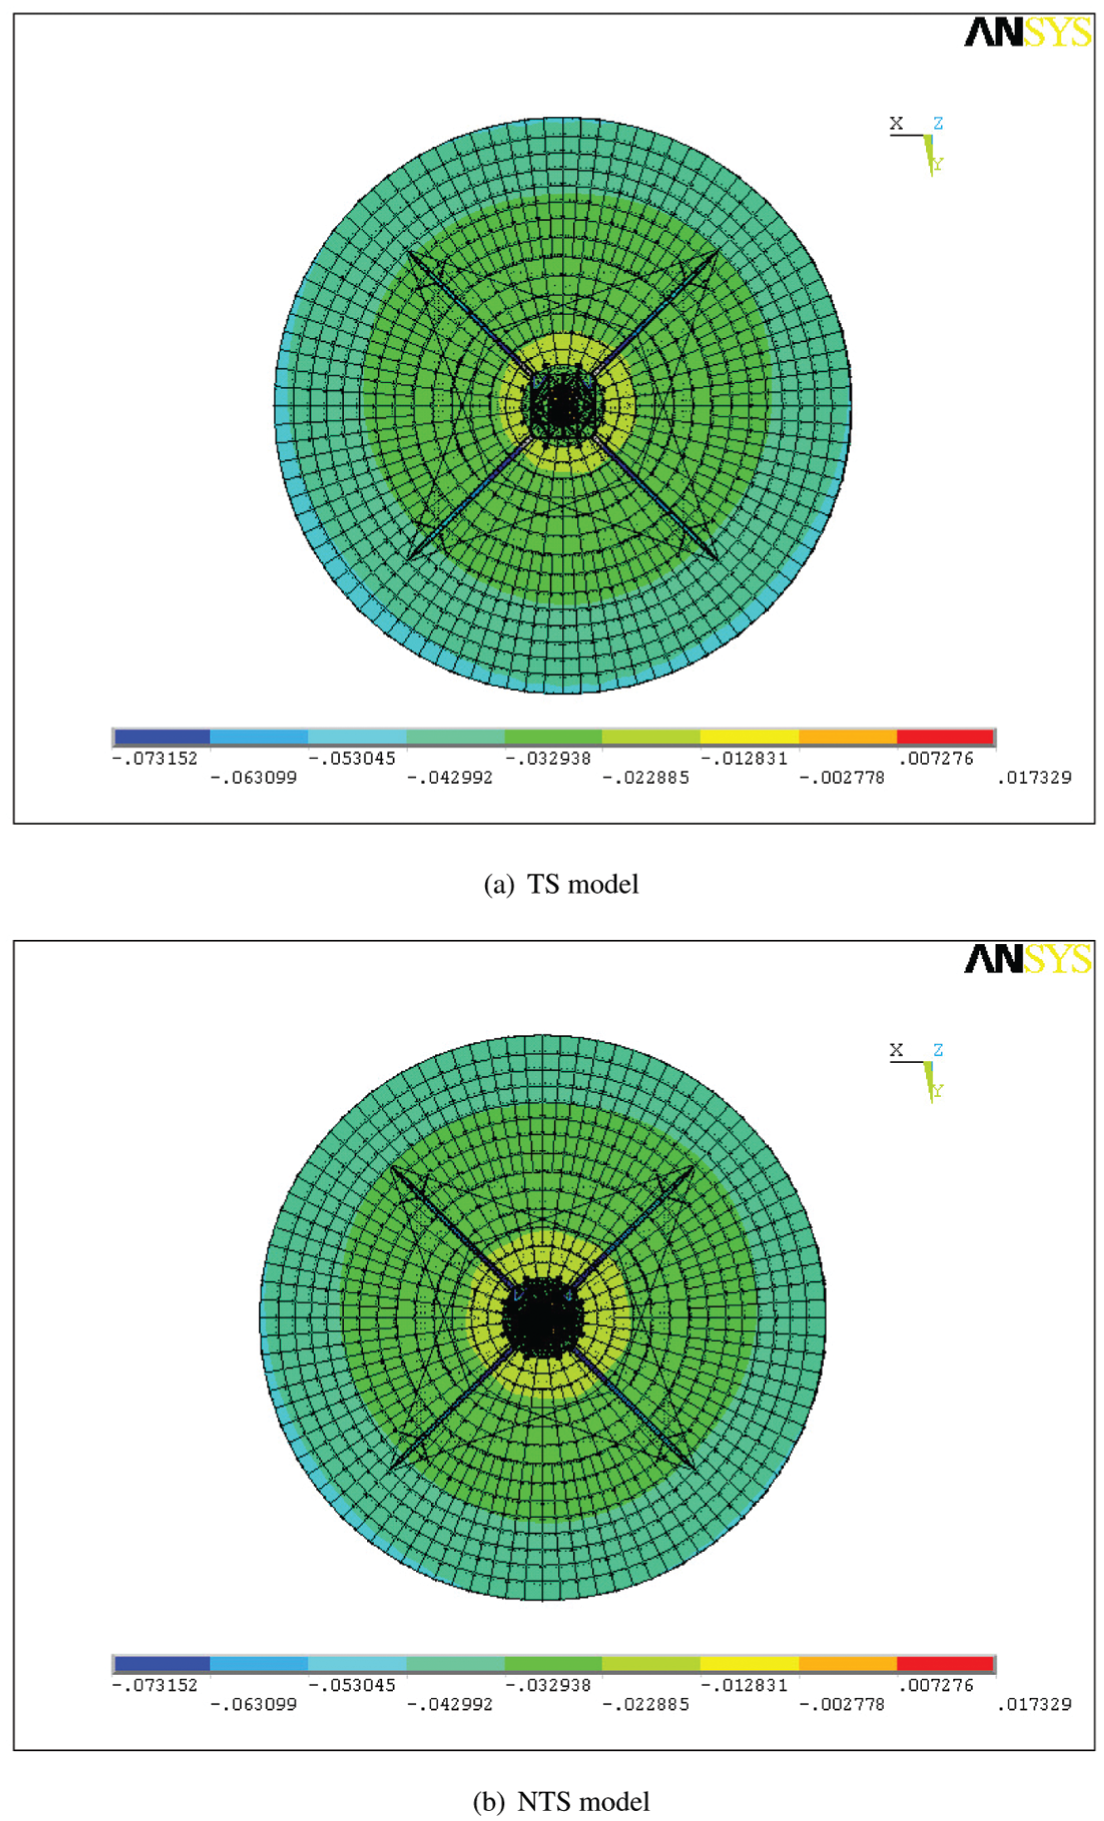
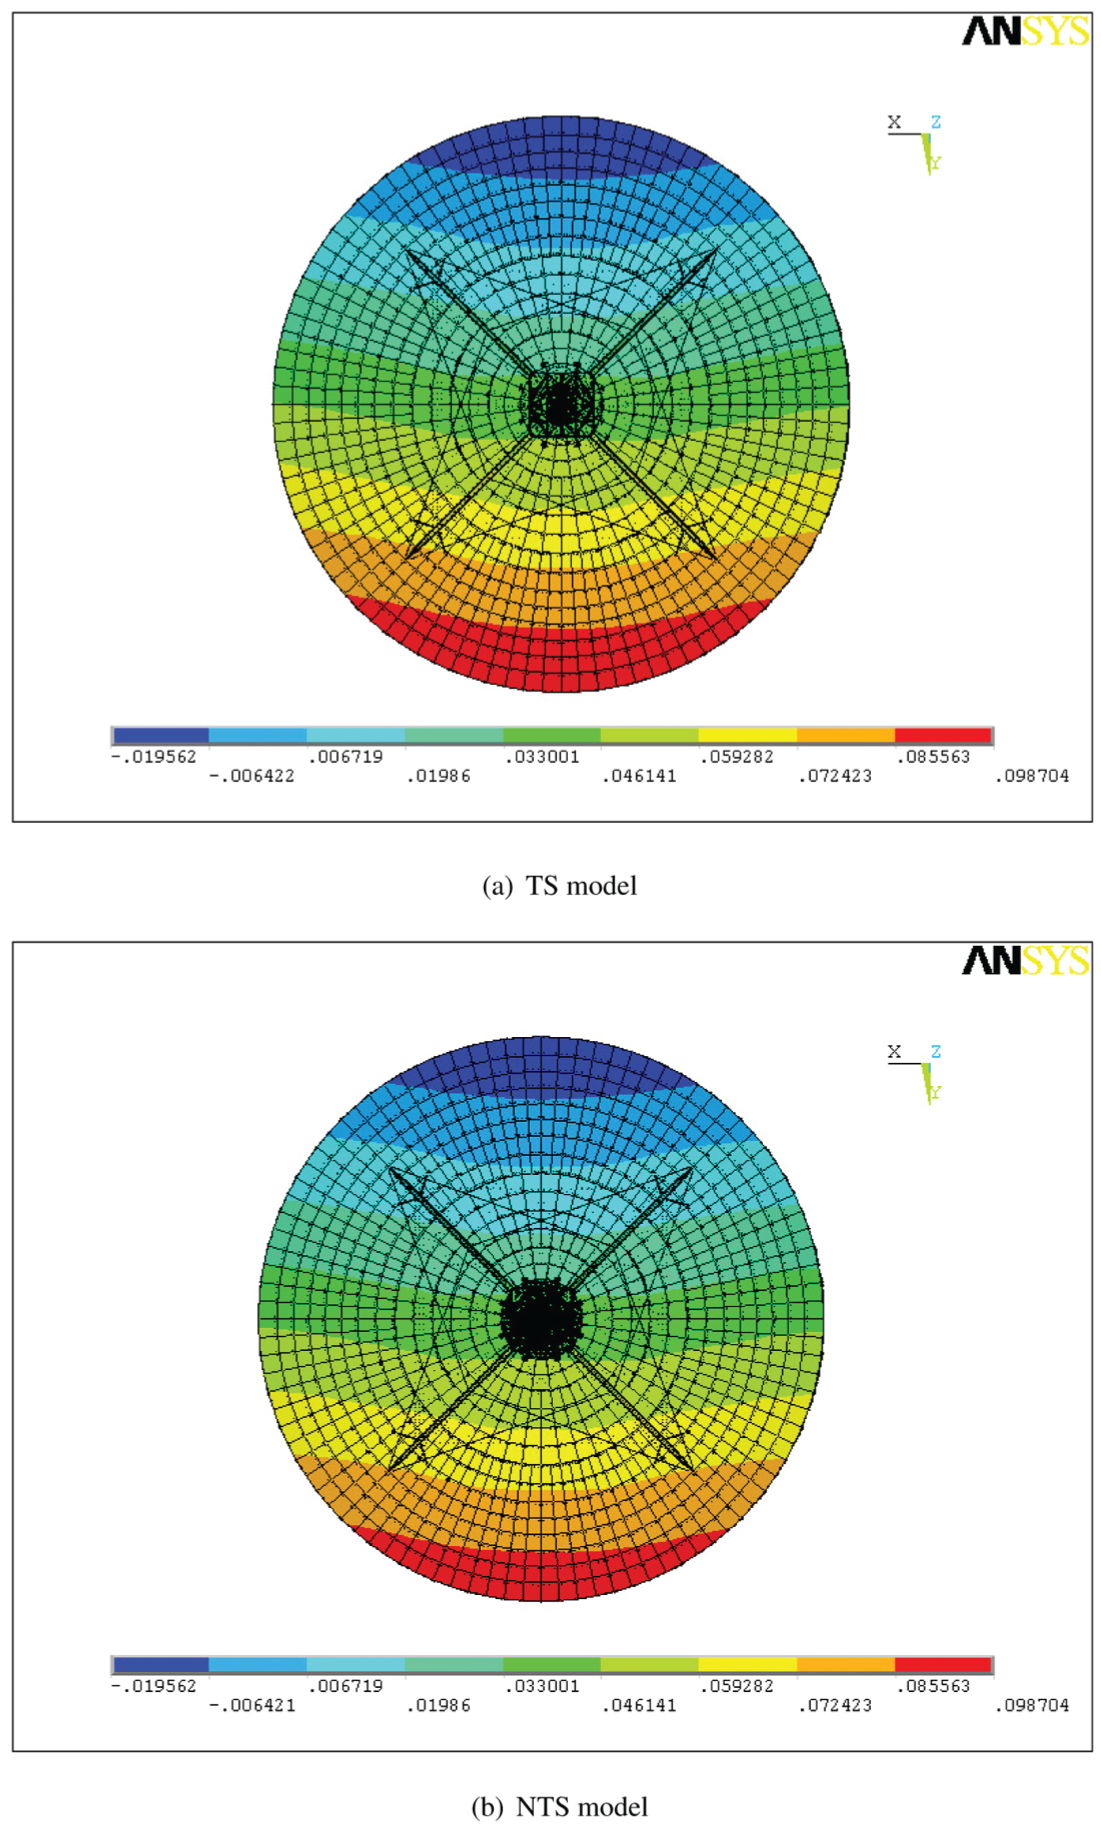
The local differences are reported in Figures 17–19. The chromatic scale limits are different with respect to the other sections, with the aim of highlighting the very small differences between the two models.
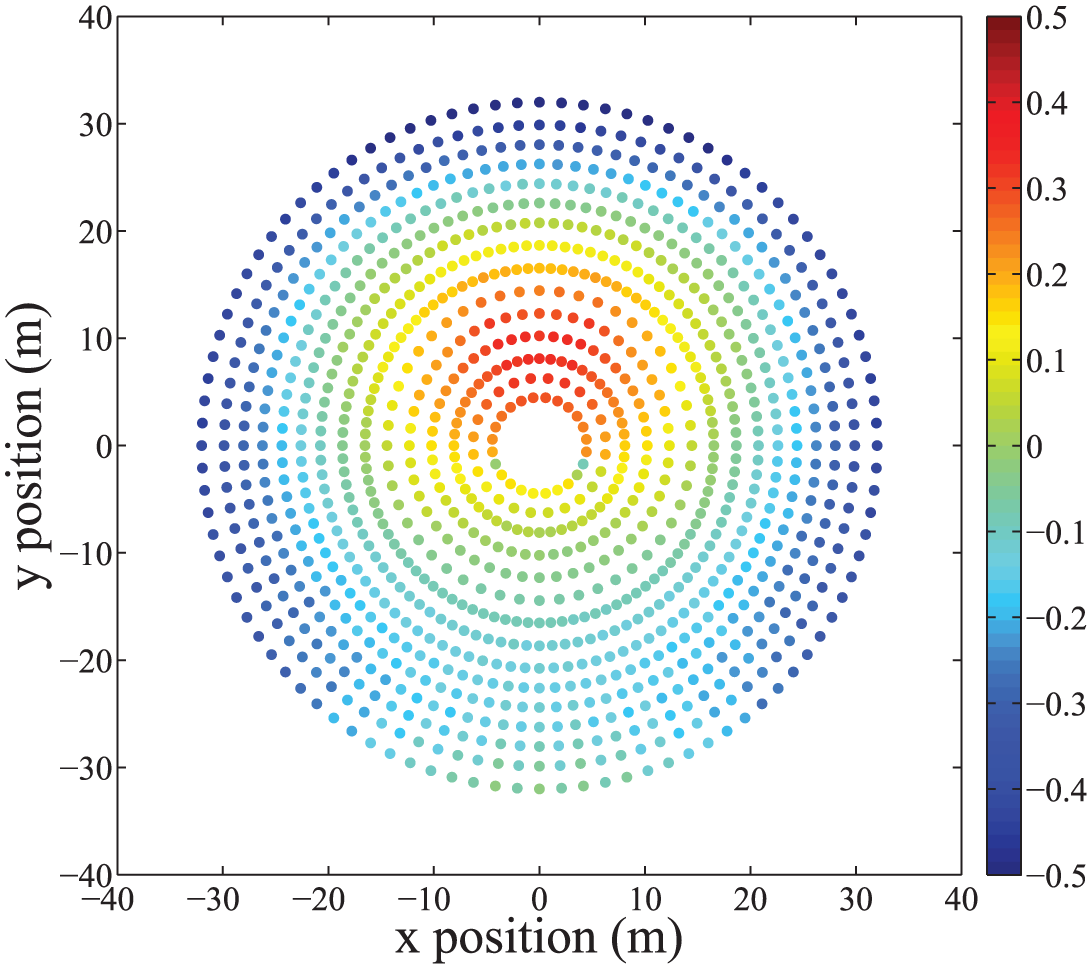
Difference of actuator displacements predicted by the TS and NTS FE models at
Difference of actuator displacements predicted by the TS and NTS FE models at
Difference of actuator displacements predicted by the TS and NTS FE models at
Figure 17 reports the situation belonging to

is
Figure 18 reports the
Finally, Figure 19 reports the
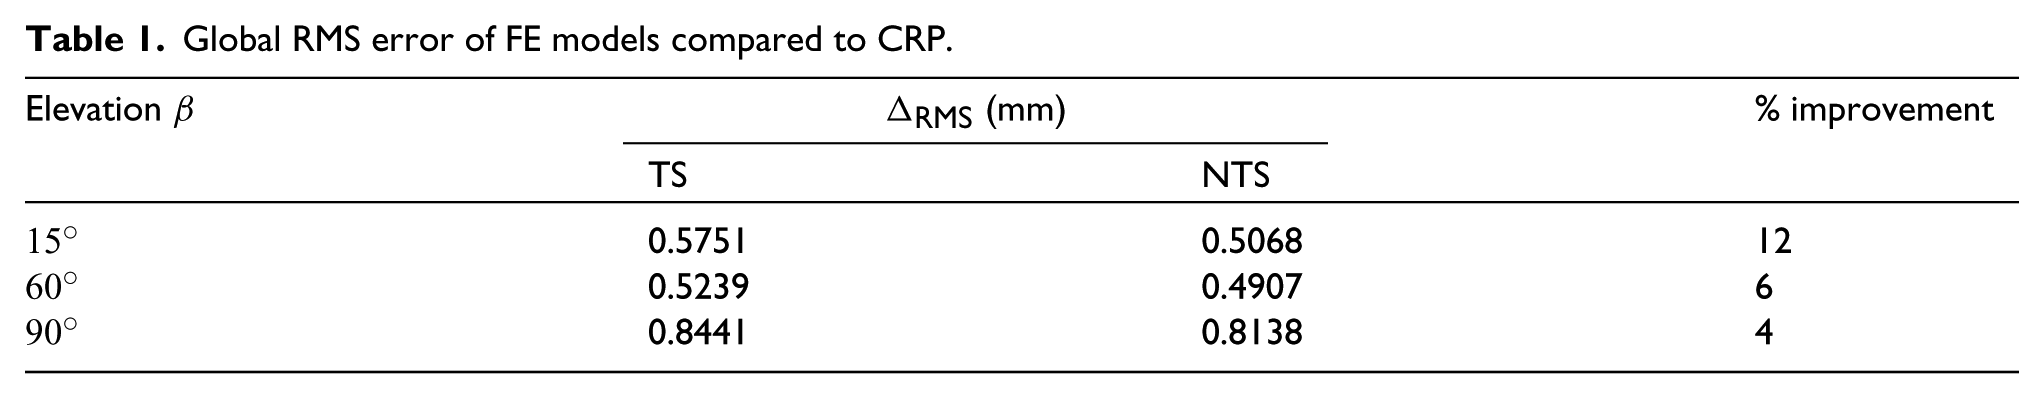
According to the aim of this paper (FE model analysis compared to field benchmark data provided by CRP) the most important comparison between the TS and NTS models is developed in Table 1, where the deviations of actuator displacements coming from FE analysis and CRP field recordings are presented. As it was expected, the NTS model produces results more similar to CRP data than those produced by the TS model. In particular, the former provides a minimum
Global RMS error of FE models compared to CRP.
5.2. Comparison between finite element models without thermal shield and photogrammetric data
As proven in the previous paragraph the FE model without the thermal shield provides the most realistic picture of the actual behavior of the SRT. Local actuator displacement errors are presented in the sequel (see Figures 20–22). Actuator elongations have been estimated by means of the NTS FE model of the SRT, see Figure 8 for different configurations. Figures 20–22, referring to the configurations corresponding to three different elevation angles (
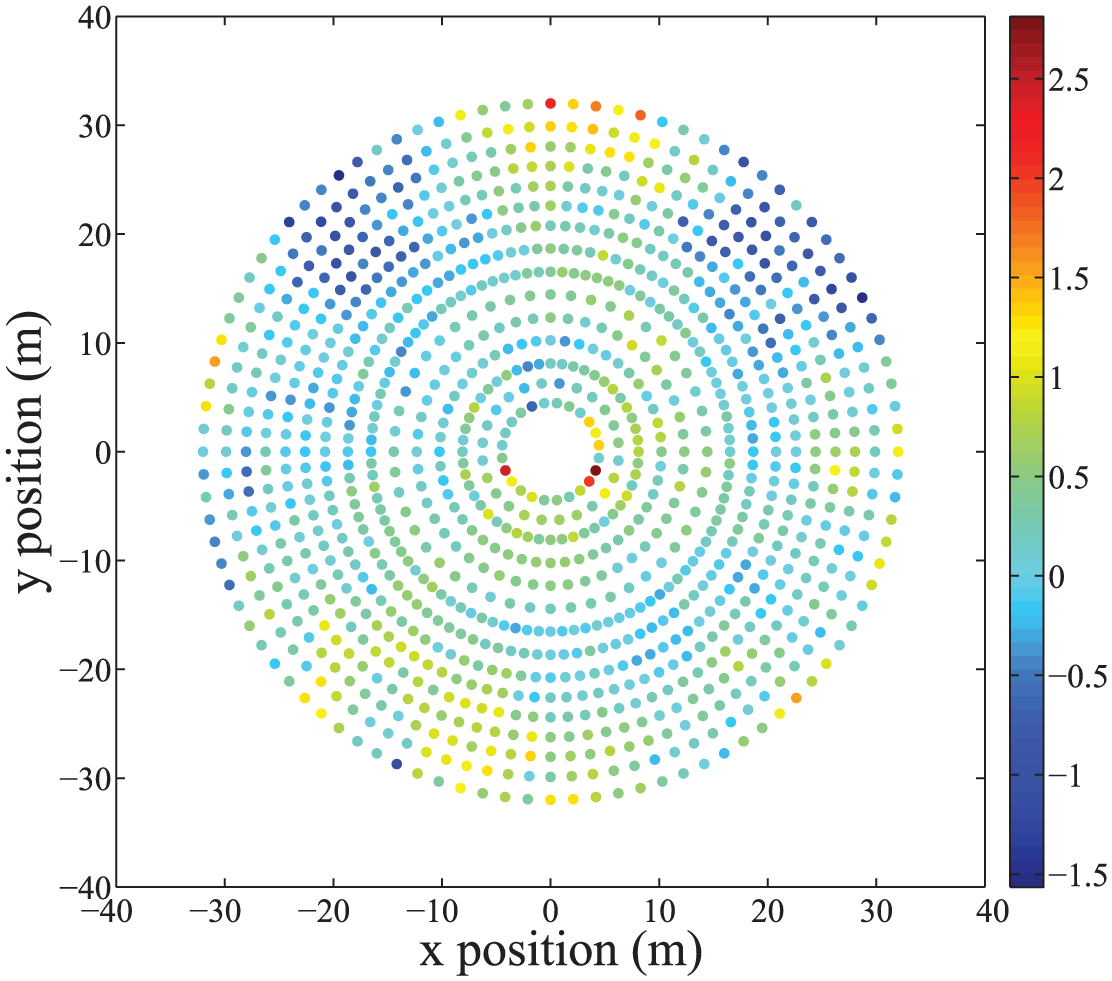
Difference of actuator displacements predicted by the NTS FE model and CRP at
Difference of actuator displacements predicted by the NTS FE model and CRP at
Difference of actuator displacements predicted by the NTS FE model and CRP at
6. Conclusions and new research perspectives
Numerical simulations have made it evident that the FE model has to be updated in order to adequately match photogrammetric measurements. These can be considered as a kind of experimental test on the actual SRT structure. Among the extended bibliography on model updating we recall the contributions, and references contained therein, of Friswell and Mottershead [11], Aktan et al. [12], De Sortis et al. [13] and Wang and Zhang [14] since they give the main guidelines on updating methodology and Dilena et al. [15, 16], Morassi and Polentarutti [17, 18], Bennati et al. [19], Moaveni and Behmanesh [20], Richard et al. [21], Zárate and Caicedo [22] and Schlune et al. [23] as technical applications of updating.
In Stochino et al. [24] there is a complete strategy to update the SRT FE model. Here we sketch only the main guidelines and main papers which can be profitably consulted. Updating strategies try to reduce differences between predicted data, by the FE model, and measured data, in this case by photogrammetric measurements, by a suitable procedure which has to contain an effective filter for data errors. We follow the way used by Turco [25–28] which is based on the so-called Tikhonov approach [29], and uses numerical tools such as singular value decomposition [30, 32, 33], and the generalized cross-validation criterion to filter the data errors, proposed in Golub et al. [34] and extensively tested by Bilotta and Turco [35, 36].
Finally, we remark that the results of this research line could also be useful to enrich refined numerical models such as those reported in Cazzani et al. [37, 38] for beams, those based on mixed and hybrid FEs [39–41], which provide more accurate stress descriptions, also in the case of layered structures [42] and those based on the so-called isogeometric approach [37, 38, 43, 44].
In addition, the authors report below a series of fields where an improved numerical model can be profitably used:
Buckling problems, such as those described by Pignataro and Luongo [45–47], Pignataro et al. [49] and Bersani et al. [48] and the papers cited therein. These problems are very sensitive to the stress level achieved and therefore could benefit from its accurate description.
New materials require refined mathematical models to describe them; some authors use suitable parameters [50–53], paying particular attention to cases which leads to non-unique and non-stable solutions [54–56]; alternatively, there is the way followed in dell’Isola and Romano [57] and D’Annibale and Luongo [58] where a concentrated damage model for an interfacial zone is developed; in addition, the application of higher continuum models can be attractive [59–63].
Damage detection is an emerging and important field which deserves particular attention, see for example the works by Roveri and Carcaterra [64] and Ferretti and Piccardo [65] which consider traveling loads as signals or in identification problems [66–71].
Plasticity problems regarding the evaluation of the collapse load [72–77] and the variational techniques presented in dell’Isola et al. [78] for dissipative phenomena.
Smart and piezoelectric materials might be advantageously used for effective structural control, see Maurini et al. [79], Batra et al. [81], Giorgio et al. [80] and Giorgio et al. [31] for a recent review of relevant results.
Footnotes
Declaration of Conflicting Interests
The author(s) declared no potential conflicts of interest with respect to the research, authorship, and/or publication of this article.
Funding
The author(s) disclosed receipt of the following financial support for the research, authorship, and/or publication of this article: The financial support of RAS, the Autonomous Region of Sardinia (grant number CRP-26658, L. R. 7/2007, year 2011 call, Project: Deformation estimates of the Sardinia Radio Telescope) is gratefully acknowledged.
Dedicated to Dr RA Toupin in recognition of his outstanding contribution to Mechanics.