
Abstract
The equilibrium forms of pantographic blocks in a three-point bending test are investigated via both experiments and numerical simulations. In the computational part, the corresponding minimization problem is solved with a deformation energy derived by homogenization within a class of admissible solutions. To evaluate the numerical simulations, series of measurements have been carried out with a suitable experimental setup guided by the acquired theoretical knowledge. The observed experimental issues have been resolved to give a robust comparison between the numerical and experimental results. Promising agreement between theoretical predictions and experimental results is demonstrated for the planar deformation of pantographic blocks.
Keywords
1. Introduction
In the last decade, with the impressive progress in advanced manufacturing techniques (e.g. 3D printing), the concept of mechanical metamaterials has become a popular topic, owing to their promising features in different engineering applications (for example, see Kadic et al. [1], Lee et al. [2], Turco et al. [3], Vangelatos et al. [4–6], Eugster et al. [7], and Nejadsadeghi et al. [8]). Mechanical metamaterials are multiscale structures whose overall mechanical response is determined by the interactions between structural constituents at different length scales. By controlling structural patterns at different scales, one can design and fabricate metamaterials with exotic and unnatural properties, such as high stiffness-to-weight ratio, high toughness, and negative Poisson ratio. We refer the reader to the extensive review papers of Barchiesi et al. [9] and Yu et al. [10] for the state of the art in the study of mechanical metamaterials.
In this study, we particularly focus on a type of mechanical metamaterial, namely, pantographic blocks. This kind of mechanical metamaterial consists of layered pantographic sheets that contain two families of intersecting fibers connected with pivots (see Figure 1). Pantographic sheets have been extensively investigated recently (for example, see dell’Isola et al. [11, 12]). Actually, pantographic sheets are one of the different versions of pantographic microstructures that have been introduced as an example of second gradient continuum, i.e. a continuum whose deformation energy depends on the second gradient of displacement (see Alibert et al. [13]). The central theme of this type of continuum was first introduced by Gabrio Piola in the period 1845–1850 (see dell’Isola et al. [14–16], Auffray et al. [17] and Rahali et al. [18]) as a result of his forerunning micro-to-macro identification procedure based on the postulation of the validity of a discrete Lagrangian model at microscale and a continuous model whose kinematics is given by a displacement field at macroscale. The existence of a continuum whose deformation energy depends on the second gradient of displacement has been investigated in many studies. For example, see Pideri and Seppecher [19], Abdoul-Anziz and Seppecher [20], and Abdoul-Anziz et al. [21].
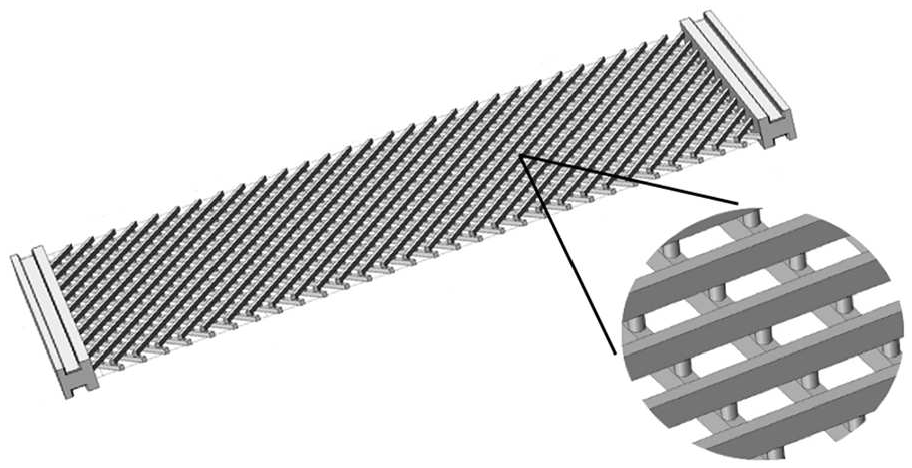
Topology of pantographic sheets.
In the studies presented up to now, most of the investigations are limited to planar deformations of 2D continuum models for pantographic sheets. Dell’Isola et al. [22] presented a second gradient model for the planar deformation of pantographic sheets. Cuomo et al. [23] and dell’Isola et al. [24] analyzed the behavior of pantographic sheets under bias-extension test. Placidi et al. [25] demonstrated a 2D second gradient model for pantographic sheets formed with inextensible fibers. Spagnuolo et al. [26] investigated pivot damage issues occurring in aluminum pantographic sheets. Andreaus et al. [27] presented a finite-element method framework for the static analysis of pantographic structures modeled using non-linear Euler–Bernoulli beams. De Angelo et al. [28] investigated the behavior of metallic pantographic sheets. In a number of papers, researchers have worked on the identification of constitutive parameters for second gradient materials (see Giorgio [29], Placidi et al. [30], Yang et al. [31], De Angelo et al. [32], Nejadsadeghi et al. [33], Solyaev et al. [34], and Turco [35]). In a few studies, the 3D deformation of pantographic structures has been investigated in the context of second gradient modeling, for example in the studies presented by Steigmann and dell’Isola [36], Giorgio et al. [37, 38], and Scerrato et al. [39]. Additionally, “higher grade” (see Niiranen and Niemi [40] for plates, and Khakalo et al. [41], Khakalo and Niiranen [42], and Barchiesi and Khakalo [43] for lattice structures) and “higher order” (see Eremeyev [44], Eremeyev et al. [45], Eremeyev and Altenbach [46], Altenbach and Eremeyev [47–49], and Altenbach et al. [50]) models have been popularly proposed to predict the behavior of micro-architectured metamaterials. The importance of such models has been discovered for different applications and phenomena. For interested readers, we refer to the recently published works of Misra and Poorsolhjouy [51], Placidi et al. [52], Turco et al. [53–56], Battista et al. [57], Greco et al. [58] Franciosi et al. [59], Chiaia et al. [60], Barchiesi et al. [61], and Spagnuolo and Andreaus [62] for further details.
The interest in pantographic microstructures has been motivated to prove that second and higher gradient models are indeed conceivable and realizable, thus not being meaningless mathematical abstractions, and, therefore, the ideas inspired by Piola [14], Green [63], Mindlin [64], Sedov [65], Toupin [66], and Germain [67] can be fruitfully exploited for applications of non-classical continuum modeling. It is also worth remarking that an interesting set of exotic effects and phenomena [68–71], which may lead to promising technological applications, has been observed (see dell’Isola et al. [72] and della Corte et al. [73]).
In regard to previously considered research efforts and the latest advancements in additive manufacturing technologies, it seems natural to try to conceive, design, fabricate, and test some truly 3D mechanical metamaterials involving pantographic microstructures. Therefore, in this study, pantographic blocks under three-point bending tests are studied. According to the authors’ best knowledge, this is the first study to investigate three-point bending tests of pantographic blocks, both numerically and experimentally. For this purpose, the first step is to form a design that has superimposed pantographic layers with elastic pivots, as given in Figure 2. Then, the standard three-point bending test is performed for fabricated pantographic blocks, and a comparison between numerical and experimental results is made to show the validity of the mathematical model. In this study, the designed specimens have been fabricated with a 3D printing technology, namely, selective laser sintering. Here, we are aware of the limits of our modeling and numerical analysis: we assume that the planar model can be used by modifying some constitutive parameters accordingly. This courageous assumption has been proven to have some ground, rather than satisfactory coincidence obtained with the experimental evidence, as will be discussed in the next sections.
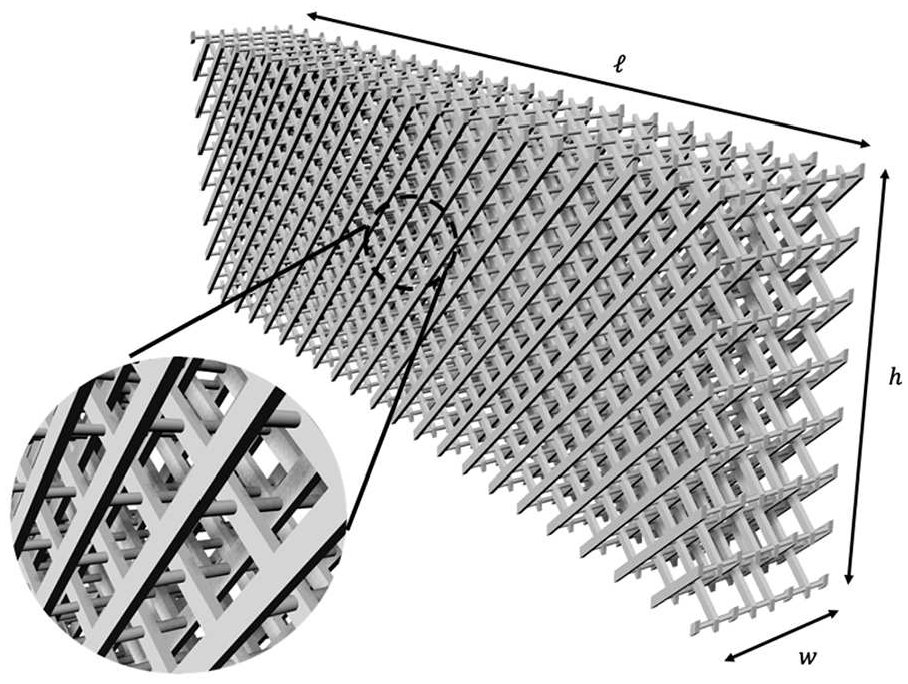
Design of a pantographic block.
The organization of the rest of the paper is as follows. In Section 2, the mathematical model adopted for the numerical simulations is briefly summarized. Next, the experimental setup and related issues are explained in Section 3. In Section 4, the numerical results are presented for the pantographic block under study, and the agreement with experimental results is shown. Finally, in Section 5, we highlight our conclusions and try to provide some insights for future studies based on our observations.
2. Mathematical model: macro-level second gradient model for planar pantographicstructures
In this section, the mathematical model adopted for the analysis of pantographic block under study is presented. As mentioned earlier, it is assumed that the considered pantographic block has planar deformation; therefore, the mathematical model given by dell’Isola et al. [22] for pantographic sheets is adopted in the simulations. In the framework presented by dell’Isola et al. [22], the macro-level model was formulated with a heuristic micro–macro identification procedure which was first pioneered by Gabrio Piola [14]. In this context, to model pantographic sheets, a discrete model is introduced for the microstructured 2D continuum consisting of two families of orthogonal fibers in the reference configuration. The discrete model contains a set of particles connected to each other by appropriate extensional and rotational springs in a 2D space. As can be seen from Figure 3, particles are located at the intersections of fibers and are connected to each other by extensional springs. An additional three rotational springs are introduced to model the behavior of the structure due to pivots at intersections.
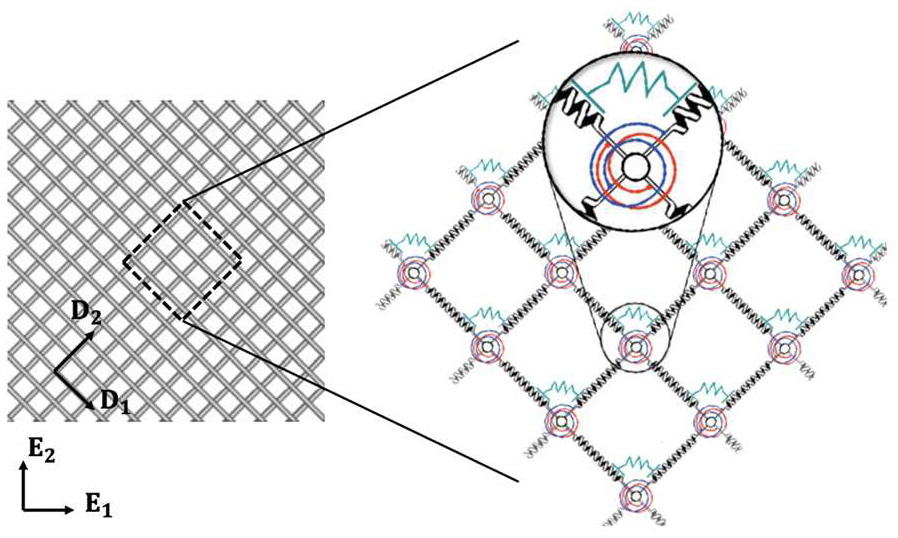
Discrete model for pantographic sheets.
By following the heuristic homogenization procedure, the deformation energies at macroscale are identified by using the postulated deformation energies for the discrete model at the microscale. Therefore, the macroscopic deformation energies (i.e. the macroscopic Lagrangian density functionals) are defined by means of microscopic constitutive parameters.
To introduce the kinematics, the current position of a material point

where
Here, the current configuration is defined by the following map:

where

where

where


and

Here,

where
Finally, the governing equations are obtained with the variational statement

where
We are aware of the fact that such a numerical code can be optimized for lower computational burdens, for instance, by using an isogeometric approach (as those presented in Fischer et al. [74], Cuomo et al. [75], Cazzani et al. [76–79], Niiranen et al. [80–82], Balobanov and Niiranen [83], Khakalo and Niiranen [84, 85], Yaghoubi et al. [86], Yildizdag et al. [87, 88], Capobianco et al.[89], Greco et al. [90], and Balobanov et al. [91]).
3. Experimental apparatus and measurements
In this section, we detail our designed experimental setup and conducted measurements. Pantographic blocks of length
To get reliable experimental results, owing to the unique structural pattern of the specimen under study, some simple modifications need to be made to conduct three-point bending tests of pantographic blocks. The standard blades used in three-point bending tests have a small radius of curvature. This situation leads to an important issue in the three-point bending test of pantographic blocks. The experiments conducted with different pantographic blocks show that specimens may get “trapped” in blades during the test, and, therefore, cells trapped in blades may have excessive deformation, as shown in Figure 4. In this case, it is clear that the continuum model used for numerical simulations is not appropriate to describe the target physical situation.
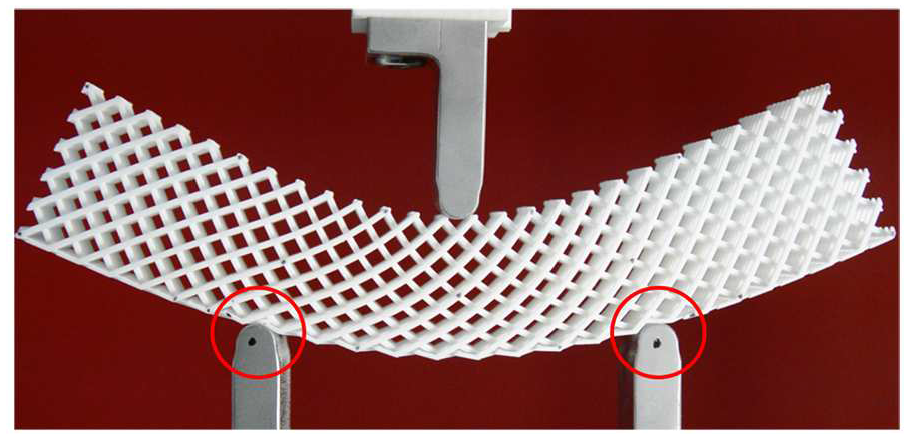
Cell trapping during three-point bending test of a pantographic block.
To resolve this issue, blades with relatively larger radius of curvature have been designed for experiments (see Figure 5). However, even with larger blades, it is observed that sliding of specimens is not uniform, and some pantographic cells in contact with blades have local deformation patterns, as can be seen from Figure 5. As a result, a “jumping” pattern in the experimental plot (imposed displacement as a function of exerted total reactive force) is obtained (see Figure 6(b)).
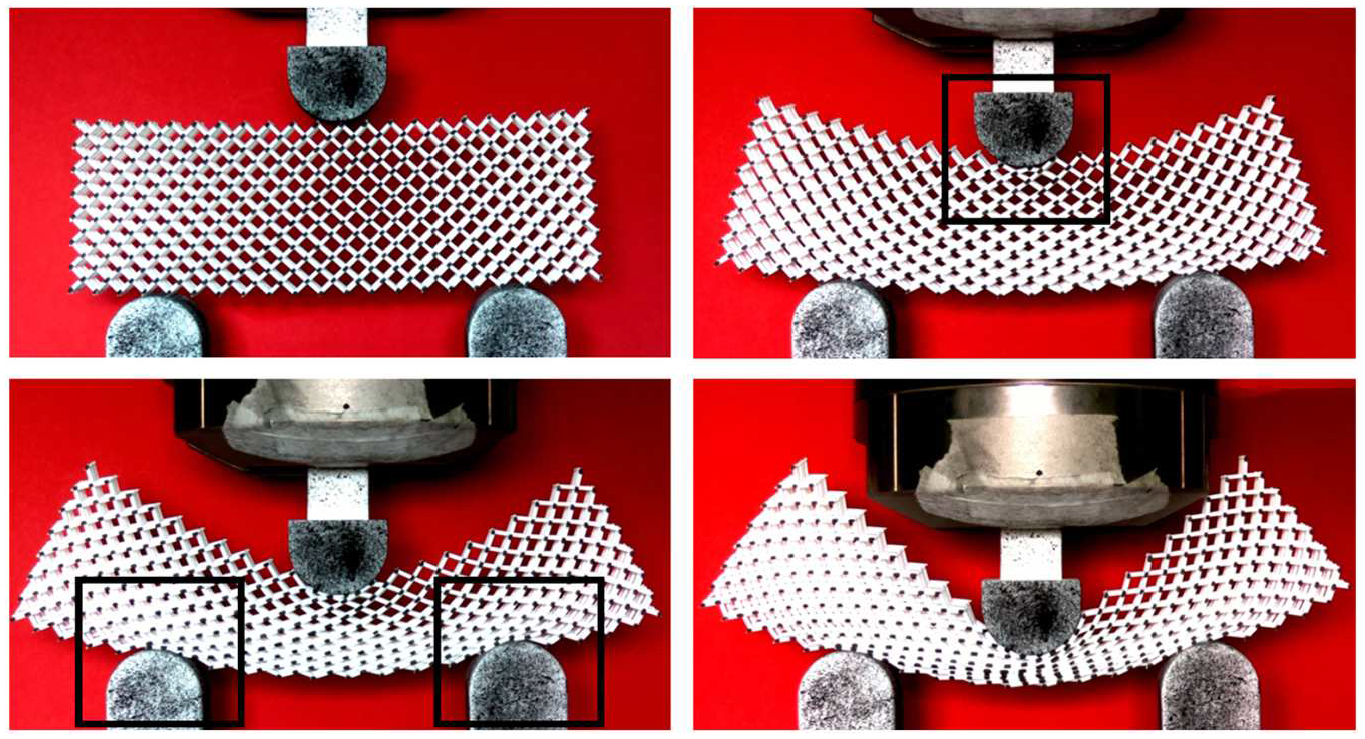
Excessive deformation of cells in contact with larger blades during three-point bending test.
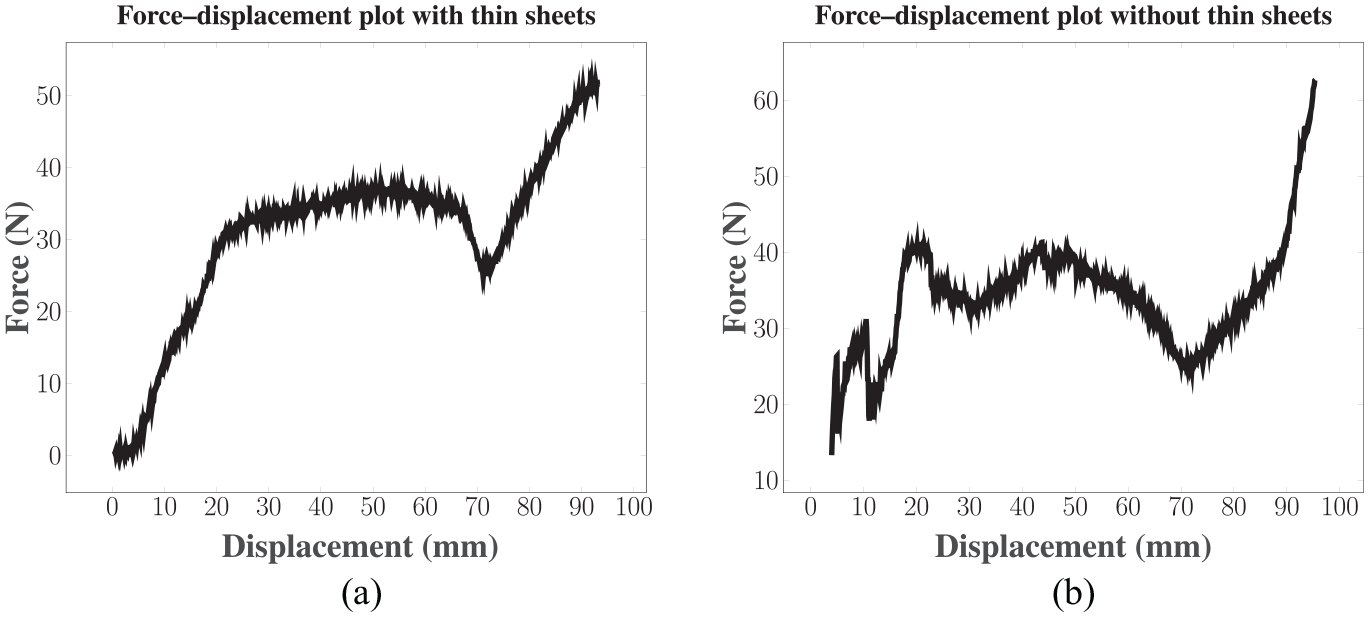
Force–displacement plots with and without thin sheets between pantographic block and blades.
The experimental solution used in this study is simple and effective. As can be seen from Figure 7, at the beginning of the process, very light and flexible thin sheets are placed between pantographic blocks and the blades. The thin layer is chosen in such a way that it adheres perfectly to the lower pivots of the pantographic block and slides perfectly on the blades. This solution has been proven to be much more efficient compared to other solutions which were tried earlier. In Figure 8, the behavior of a pantographic block under three-point bending test is presented. In this case, it is clear that the thin layers prevent having undesired behavior around the blades. Furthermore, In Figure 6, the force–displacement plots obtained by conducted experiments with and without thin sheets are compared to show the validity of our practical experimental solution. As can be seen from Figure 6(b), in case the three-point bending test is conducted without thin sheets, the force–displacement plot have some certain jumps because of excessive deformation of the cells in contact with blades, and it is also observed that the pantographic block slides instantly during the experiment. On the other hand, as seen from Figure 6(a), due to the thin sheets placed between the pantographic block and blades, a reliable force–displacement relation is obtained in the experiment. Therefore, this practical approach allows us to provide a better comparison between the numerical and experimental results in the following section.
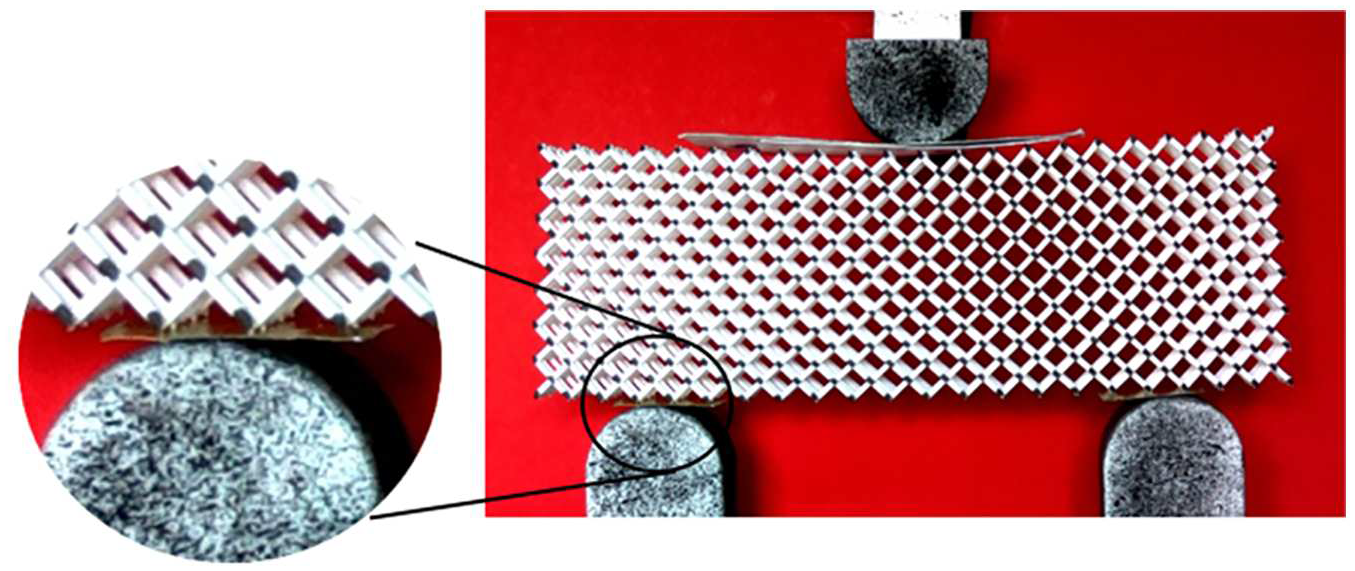
Thin sheets placed between pantographic block and blades.
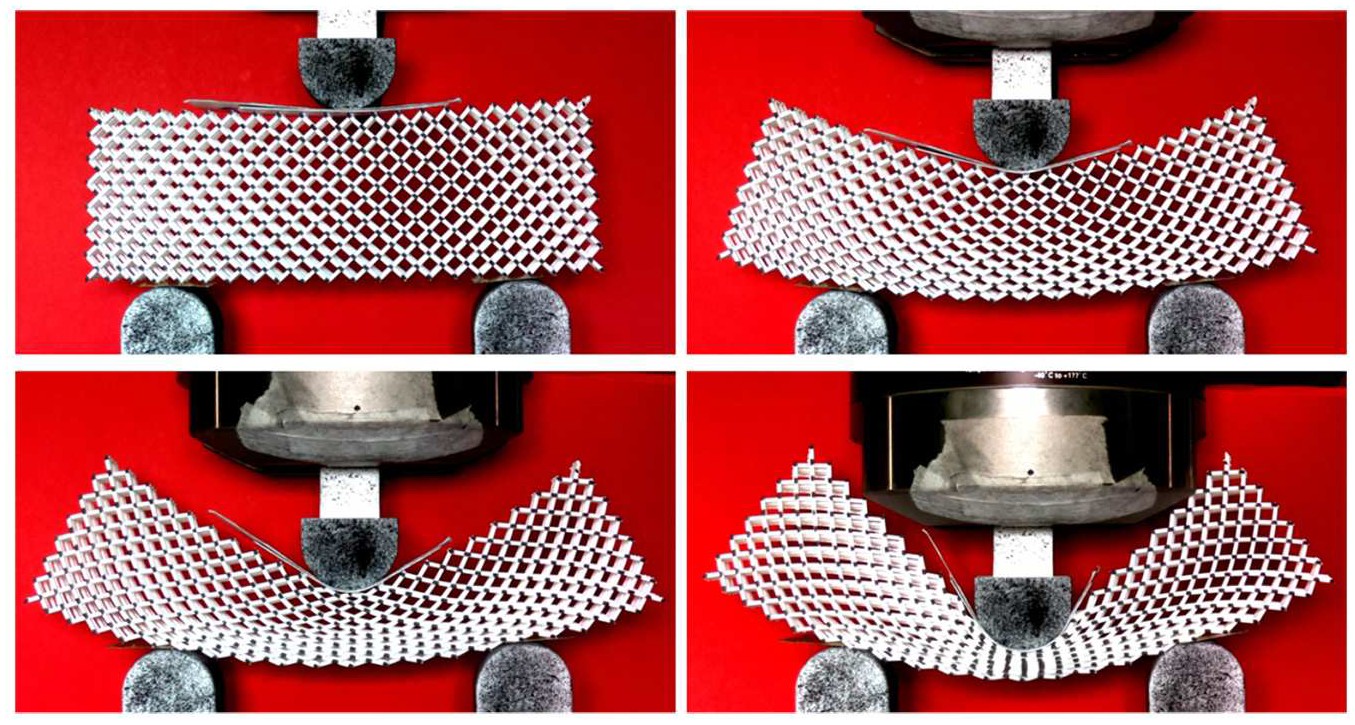
Three-point bending test with thin sheets placed between pantographic block and blades.
In three-point bending tests, the device imposes the given displacements, and the reactive forces are measured for each corresponding imposed displacement. Here, the displacement of central blade is applied slow enough that the observed deformation pattern can be regarded as quasistatic, and therefore, it is assumed that the mathematical model presented in the previous section can be used in this study to explain the observed planar deformation phenomena.
4. Comparison of numerical simulations with experimental evidence
In this section, numerical results are presented for the pantographic block under study, and the simulations are compared with the experimental observations. We focus on the observed planar deformation patterns in this paper. Therefore, we try to get a prediction by making two simple assumptions: (i) the in-plane displacement induces an out-of-plane displacement, at equilibrium, which is unique; (ii) the planar model has enough constitutive parameters to account for the deformation energy needed to impose out-of-plane deformation. In other words, we assume that, by suitably fitting the available constitutive parameters, one can carefully describe the observed planar shapes. Here, the hypothesis is essential to assure this possibility: the existence of a number of out-of-plane deformation patterns corresponding to the same in-plane deformation pattern may render the conjectured simplification impossible. Indeed, it is clear that different out-of-plane deformation patterns imply different deformation energies and, possibly, the existence of buckling phenomena. We do not have, yet, measurements involving out-of-plane displacements. To measure out-of-plane deformations, one needs a dynamic itemset counting (DIC) based experimental setup consisting of a number of cameras and a sophisticated DIC algorithm. We will postpone these investigations for future studies.
A pantographic block with length
In Figure 9, the experimental and numerical results are compared when the displacement of top blade (u0) is equal to 0, 20, and 40 mm, respectively. In the numerical results given in Figure 9(b), (d), and (f), the total energy (W) of the structure is plotted using COMSOL Multiphysics®.
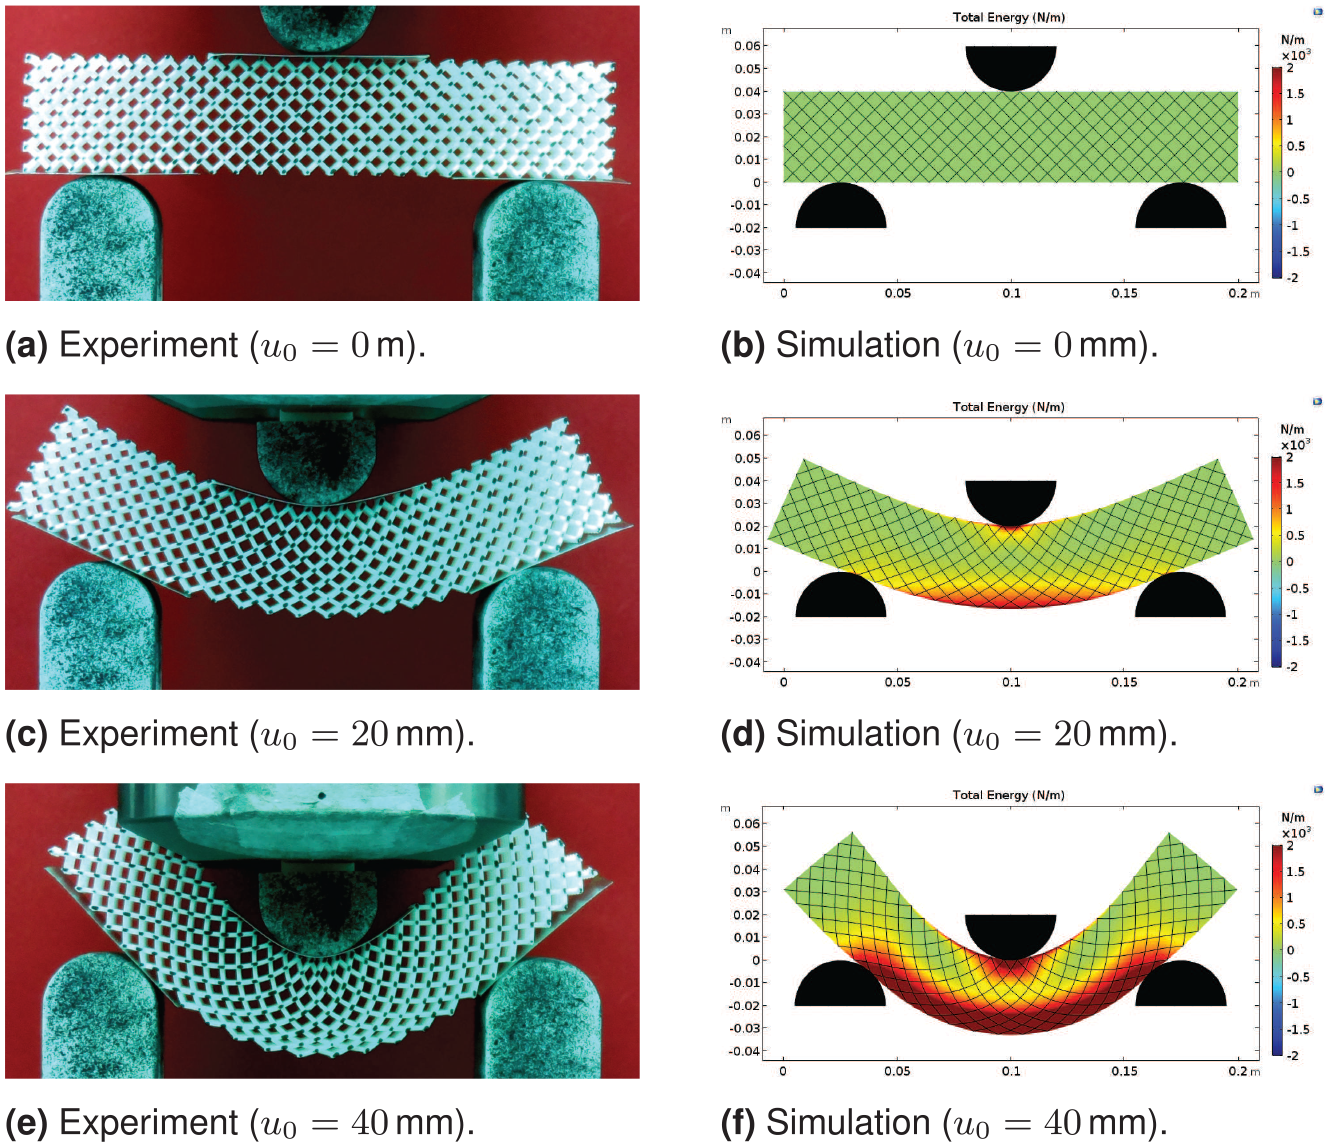
Comparison of experimental and numerical results.
As can be seen from Figure 9, the presented numerical results compare very well with those obtained by experiments. The behavior of the pantographic block is quite similar in both the numerical simulation and experiment: it is clear that similar equilibrium shapes are observed in both numerical and experimental results. To have a better comparison, material lines oriented as fibers are assigned in the second gradient continua to compare their behavior with the deformation of fibers in the experiment. In Figure 10, deformed shapes of fibers and material lines are compared when the displacement of the top blade is equal to 40 mm. It is clear that the deformed configurations of both fibers and material lines look very similar. Importantly, it is also observed that the tips of the pantographic block expand in the direction of height with increasing values of imposed displacement. This behavior is observed because of the contraction in the center of the pantographic block during the experiment.
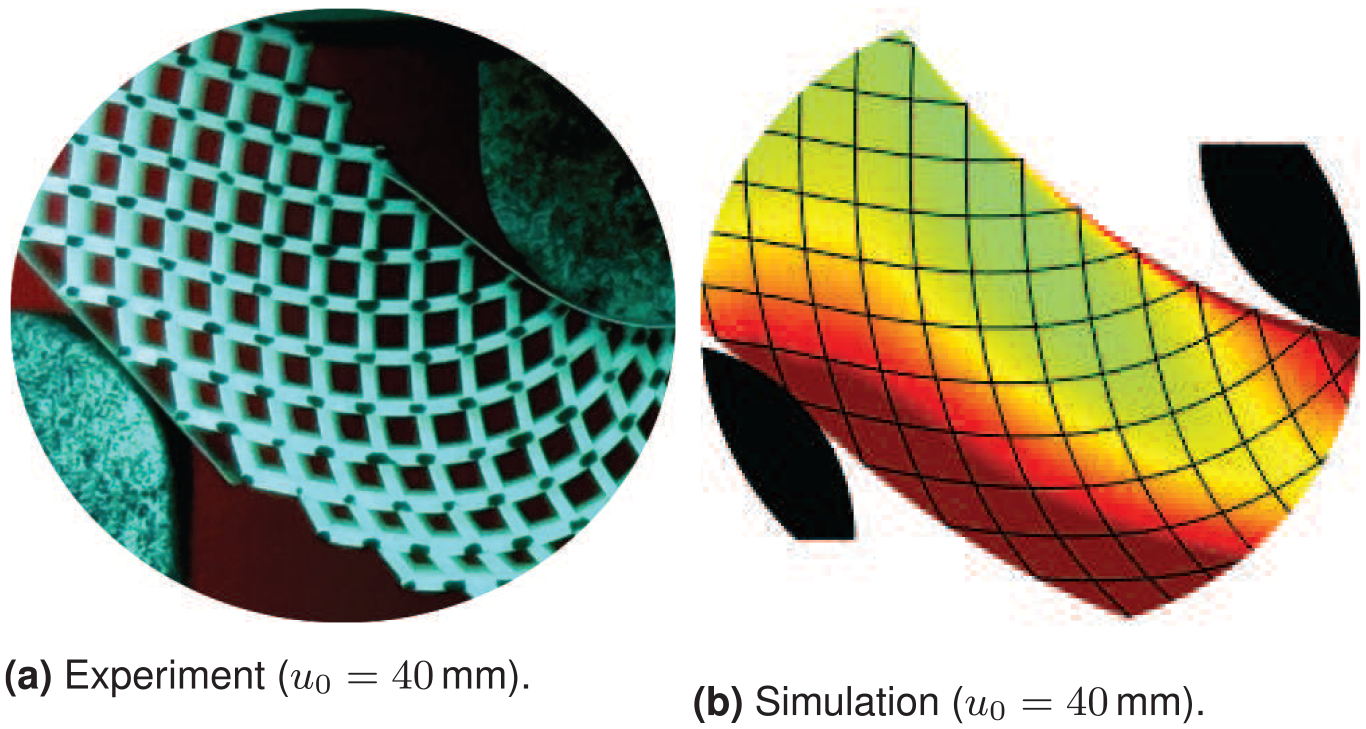
Behavior of fibers in experiment compared with material lines in the simulation.
Moreover, we investigated the contribution of each term appearing in the deformation energy given in equation (4). In the mathematical model, the total energy has three main parts,

where
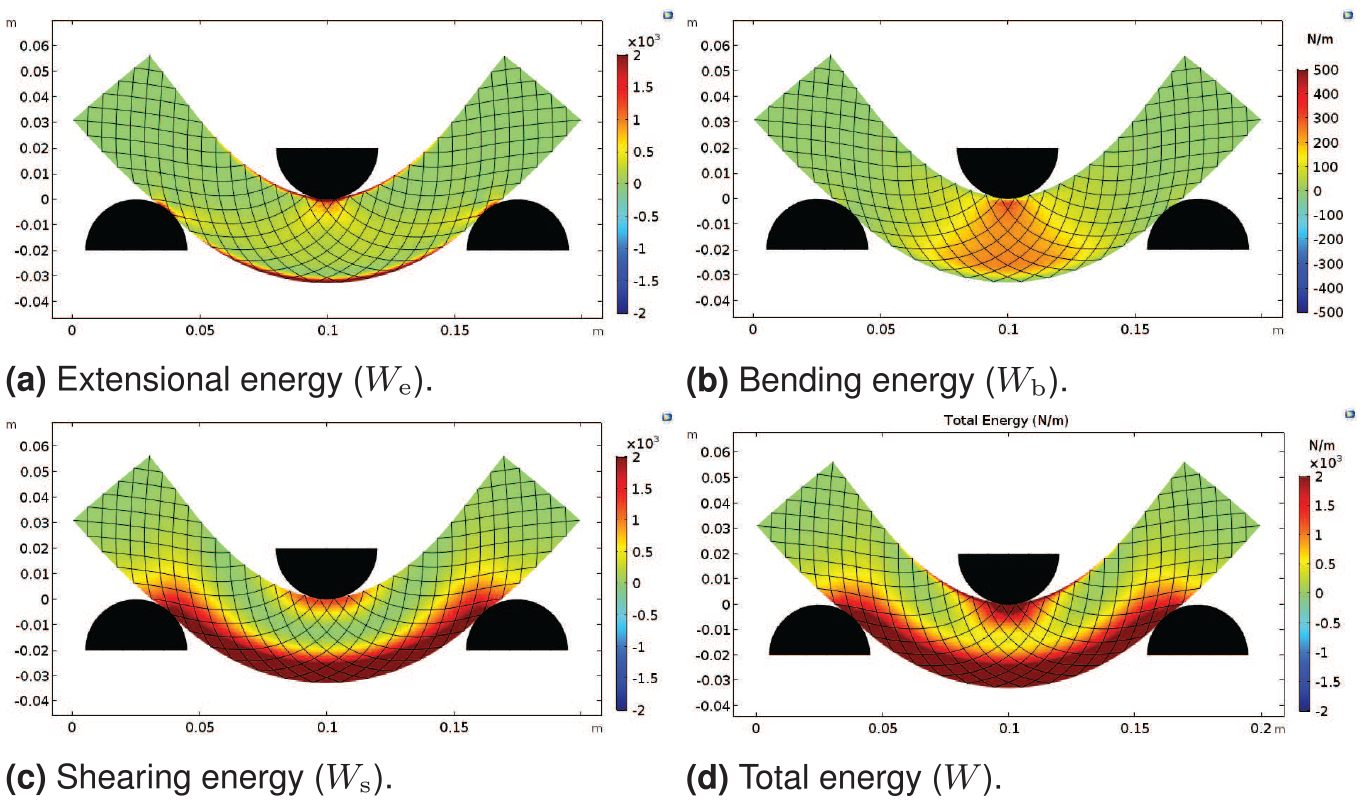
Contribution of each energy term.
Additionally, the same problem is solved in the context of classical first gradient theory (i.e. Cauchy continuum) and the results are compared with those obtained using the proposed second gradient model. In Figure 12, numerical results with the first and second gradient models are presented when the displacement of the top blade (u0) is equal to 0, 20, and 40 mm, respectively. In each case given in Figure 12, the total energy (W) of the system is plotted using COMSOL Multiphysics®. As can be seen from Figures 12(e) and (f), a significant difference between the first and second gradient models is observed. In the first gradient model, the total energy is significantly concentrated in the upper and lower parts of the structure (Figure 12(e)). However, in the second gradient model, the total energy spreads out, especially along the lower part of the pantographic block (Figure 12(f)). In addition, the final equilibrium shape of the structure obtained with the first gradient model is considerably different in comparison with the equilibrium shapes obtained by experiments. Therefore, it can be concluded that the classical first gradient model produces an inadequate result. For those who want to use the first gradient model, the best way is to model the system with appropriate beam elements (or maybe solid elements), and then conduct the finite-element modeling analysis by applying suitable conditions at each pivot!
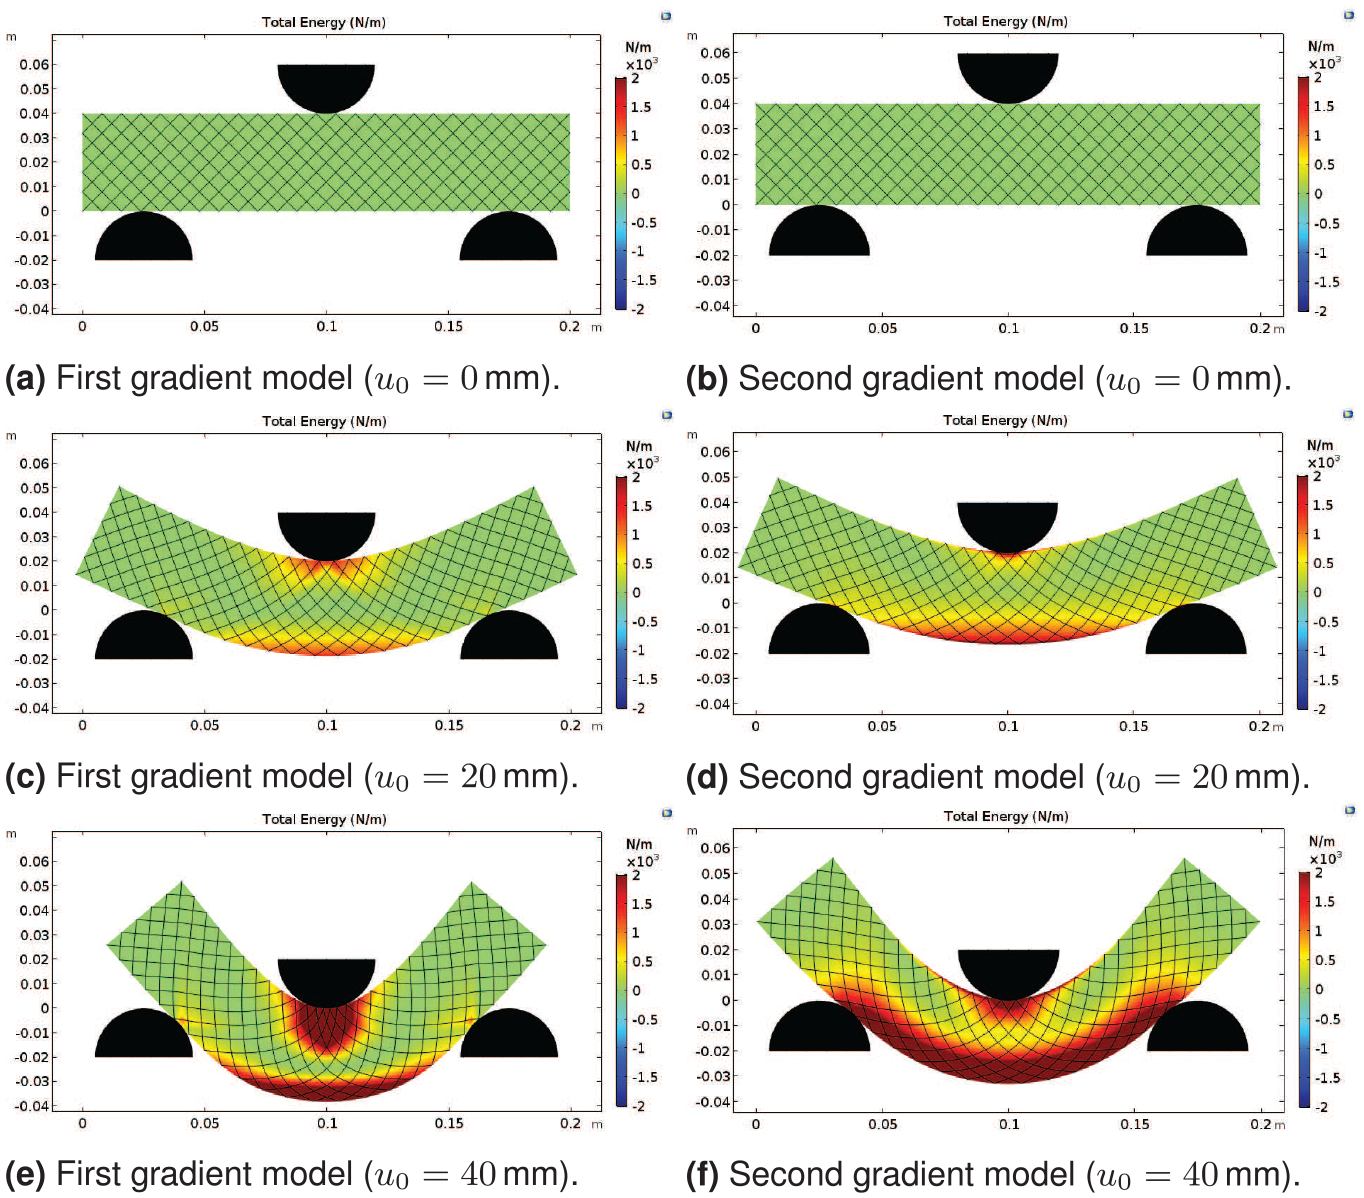
Comparison between the first gradient and second gradient models.
Finally, the force–displacement curves obtained via both the experiment and simulations (both second gradient and first gradient) are compared in Figure 13. Here, in the numerical simulation, the force plotted in Figure 13 is the computed reaction force at the top blade. The comparison clearly shows that the simulation result obtained by the second gradient model compare perfectly well those measured by experiments. Also, it must be noticed that the fitted stiffness parameters provide an accurate result in the simulations.
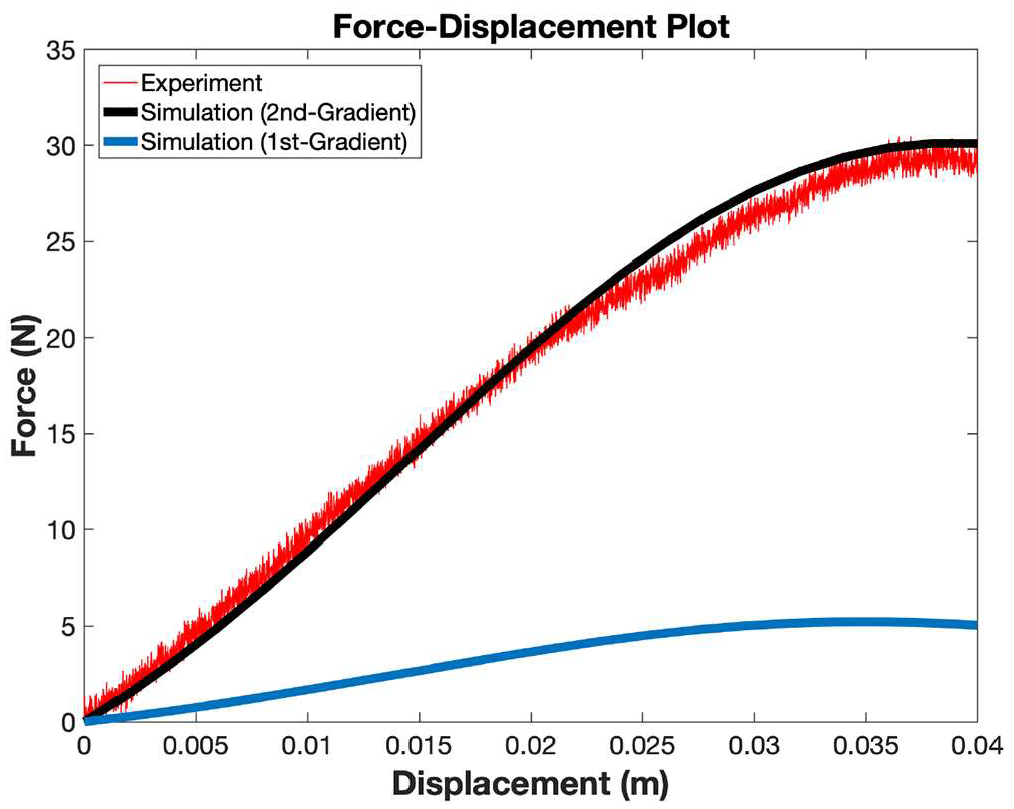
Force–displacement curves (experiment compared with simulation).
5. Conclusions and future research perspectives
In this study, planar deformation of pantographic blocks under a three-point bending test is investigated via a numerical model and experiments. The out-of-plane displacements of pantographic blocks under study are ignored, both in the formulation of the mathematical model and in the measurements performed. However, we obtained a substantial agreement between theoretical predictions and experimental evidence, which is really promising. The applicability of the proposed numerical model is shown in the comparisons presented in Figures 9, 10, and 13. Moreover, the contribution of each term in the deformation energy (i.e. stretching, bending, and shearing energies) has been investigated, with the plots provided in Figure 11, and force–displacement plots of both the numerical simulation and the experiment are compared in Figure 13.
It is clear that this circumstance seems to indicate that the formulation of the mathematical model and the implementation of the numerical code are to be taken into account for 3D displacements in future studies. This generalization may present some difficulties, such as well-posedness (see Eremeyev et al. [92]) and postulating a suitable deformation energy for 3D pantographic blocks. Indeed, we have observed that the pantographic block has deformation in the direction orthogonal to the plane of bending, which has some features of anticlastic curvature observed in standard elasticity (e.g. see Love [93]). To investigate these unique behaviors, more complicated experimental setup and apparatus are to be designed, to give an accurate measurement for the deformations of pantographic metamaterials. It would also be quite interesting to conduct the three-point bending test with a longer beam-like block to investigate which kind of dimension reduction beam model would correspond to the present second gradient plane elasticity model.
New theoretical and experimental advancements are needed to confront the 3D deformation patterns that have been observed and involve, at least, some novel Poisson effects. Obviously, a simple superposition of pantographic sheets is not the only way to form 3D blocks with pantographic microstructures. Other design solutions showing very interesting features may also be possible. The mathematical modeling challenges involved in 3D deformation seem rather complex but we are confident that they may be confronted.