
Abstract
As a critical element of time-varying mesh stiffness (TVMS), contact stiffness of a gear drive has been defined based on simplified Hertzian contact stiffness or semi-empirical nonlinear Hertzian contact stiffness in previous works. This study proposes a general contact stiffness model for elastic bodies through piecewise linear interpolation of contact pressure. The TVMS of a spur gear drive is determined through potential energy method and proposed contact stiffness model verified by Hertzian contact theory and finite-element method. Then, the influence of applied load on contact stiffness is studied, and the differences among proposed contact stiffness, simplified Hertzian contact stiffness, and nonlinear Hertzian contact stiffness are analyzed. Results show that contact stiffness increases with the applied load, and the TVMS based on the proposed contact stiffness model is the smallest among the three contact stiffness models. Effects of tooth width and input torque on the TVMS are further discussed. The TVMS becomes bigger with increased tooth width and input torque, but the increase rate decreases as tooth width or input torque increases. These findings indicate that reasonable matching of design parameters is beneficial for increasing load capacity and optimizing the dynamic performance of gear systems.
Keywords
1. Introduction
As a periodic and time-varying internal excitation of a gear system, time-varying mesh stiffness (TVMS) significantly affects vibration and noise [1–6]. The TVMS of the gear system consists of the following types of stiffness: contact, bending, axial compression, fillet foundation, and shear stiffness [7]. However, in previous studies, the contact stiffness of the gear drive was defined on the basis of simplified or semi-empirical contact stiffness formulas due to complex contact mechanical characteristics between two elastic bodies. In addition, the contact status is also the key factor affecting the gear transmission performance and dynamic characteristics [8]. To calculate the TVMS accurately and establish a more reliable dynamic model, we have to investigate the general contact stiffness model for the gear system.
Experimental [9–11], finite element (FE) [1,12–22], and analytical methods [5,12,15–34] have been used in calculating the TVMS. As the experimental method is the most direct and accurate approach, techniques such as photoelasticity [9], strain gauge [10], and digital image correlation [11] have been widely applied. However, these experimental methods are costly and cannot be widely applied. In contrast to the experimental methods, the TVMS of the gear system has drawn increasing attention with the advent of efficient numerical methods. Furthermore, two-dimensional (2D) FE [1,12,13,15–17,22] and three-dimensional (3D) FE methods [14,18–21] have been developed to verify the TVMS. The FE method has lower cost than the experimental method and can be applied to determine the TVMS with tooth profile modification [17,20] or crack [14–16,18,19]. Although the FE method is widely used in calculating the TVMS, the FE method is time-consuming and complex because it needs extremely high mesh refinement to ensure its computational accuracy.
The analytical method is simpler and more effective than the experimental and FE methods, and many researchers have focused on developing a highly accurate analytical method to calculate the TVMS. Yang and Lin [23] first calculated the TVMS by considering simplified Hertzian contact stiffness (SHCS), bending stiffness, and axial stiffness using potential energy method. Subsequently, the potential energy method was improved by considering shear stiffness [35] and fillet foundation stiffness [12]. However, in the aforementioned studies, the nonuniform cantilever beam model of gear tooth is based on the base circle and the calculation error appears when the tooth number is larger or smaller. To eliminate this error, Ma et al. [16] presented a TVMS model that established a nonuniform cantilever beam of gear tooth based on the root circle and demonstrated that the model is more accurate than cantilever beam model of gear tooth based on the base circle. With the development of the potential energy method, researchers have investigated the TVMS of cracked [5,15,16,18,19,25–28,30], spalling defect [29], tooth-profile modified [17,20], and helical gears [30–33].
From the aforementioned studies, significant efforts have been exerted to accurately determine the TVMS for the gear system. However, as an indispensable component of the TVMS, the contact stiffness has rarely been mentioned. Since Yang and Sun [36] first derived the simplified formula of Hertzian contact stiffness in 1985, this contact stiffness model has been popularly applied to the TVMS modeling of gear pairs [26,27,37–39]. Considering the nonlinear characteristics of the contacting tooth surfaces, Cornell [40] adopted an accurate formula in which the Hertzian contact stiffness is nonlinear. This contact stiffness model has also been applied in many research works, such as [20,22,41]. However, the nonlinear Hertzian contact stiffness (NHCS) is a semi-empirical formula, and its engineering application faces considerable limitations. Recently, Sainsot and Velex [42] presented a thorough review and analysis of the classic contact deflection formulae in gear simulations and proposed a general formula for contact stiffness in gear teeth. Based on contact mechanics and gear engagement principle, the analytical formula of local contact stiffness is determined [43]. The above research work is very representative, but their work builds on the Hertz contact model and also introduces some empirical formulas, which may bring some errors.
With the widespread application of high-performance gears, neither the simplified nor the semi-empirical contact stiffness formulas can meet the calculation requirements of high-precision TVMS. The contact stiffness significantly affects the TVMS, which is the key factor that influences the load capacity of the contacting tooth surfaces and the dynamic performance of the gear pair. Therefore, a general contact stiffness model for the gear system and practical design solutions to improve the load capacity and dynamic performance of gear system have to be investigated. This study focuses on the calculation method of contact stiffness for elastic bodies and its application to the TVMS modeling of the gear system. The influence of design parameters on gear TVMS is also examined. A numerical contact stiffness model with high computational accuracy for elastic bodies is proposed by piecewise linear interpolating the contact pressure. The TVMS of spur gears is determined in accordance with the stiffness models of axial compression, bending, fillet foundation, and shear, which are derived by the potential energy method and proposed contact stiffness model. The proposed contact model is verified by Hertzian contact theory and FE method, and the differences among proposed contact stiffness, SHCS and NHCS are analyzed. Then, the TVMS of a spur gear drive with three contact stiffness models are studied. The effects of the main design parameters on the TVMS of the gear drive are subsequently discussed.
2. General contact stiffness model
2.1. Contact model
As described in Figure 1, according to elastic theory, when an elastic body is subjected to a load Q at the point (τ, 0), the normal displacement at point (x, 0) is as follows [44]:

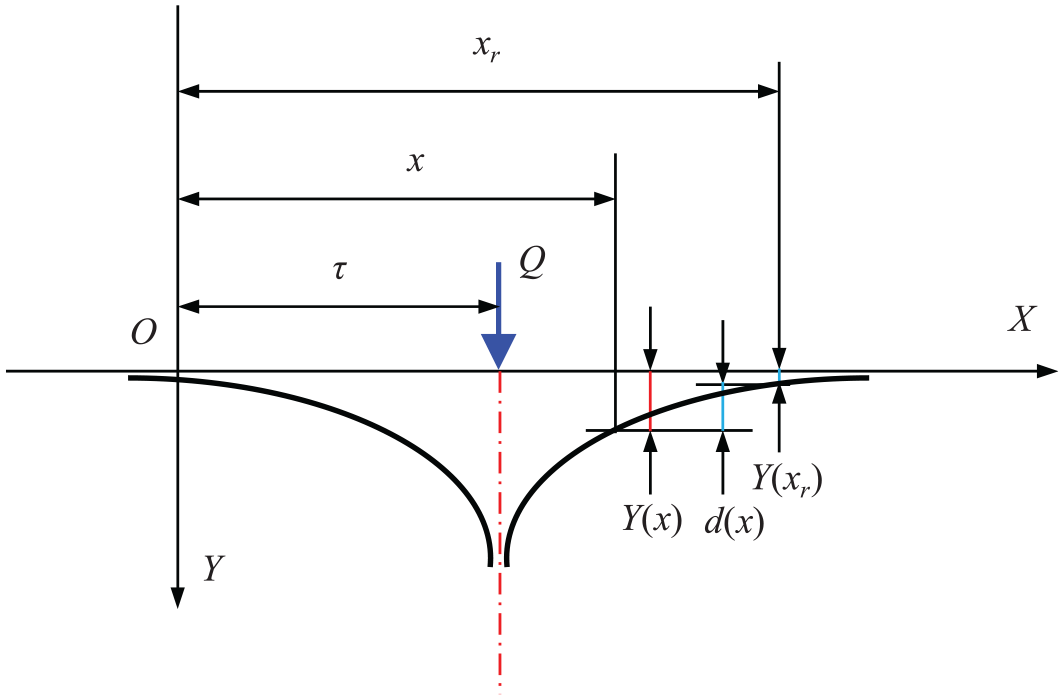
Normal displacement under load Q.
where E is Young’s modulus, υ is Poisson’s ratio, and d0 is a constant depth, where the normal displacement of each point is zero.
To eliminate the influence of d0, a certain point (xr, 0) is selected as the basic point. Then, the relative normal displacement between points (x, 0) and (xr, 0) is given as follows:

For the contact of two elastic bodies, the contact pressure is continuously distributed. Figure 2 describes the contact pressure distribution in the contact area [τ a , τ b ], where the contact pressure is continuously distributed, τa and τb are the edges of the contact area. Therefore, for the contact of two elastic bodies, the influence of distributed loads should be considered.
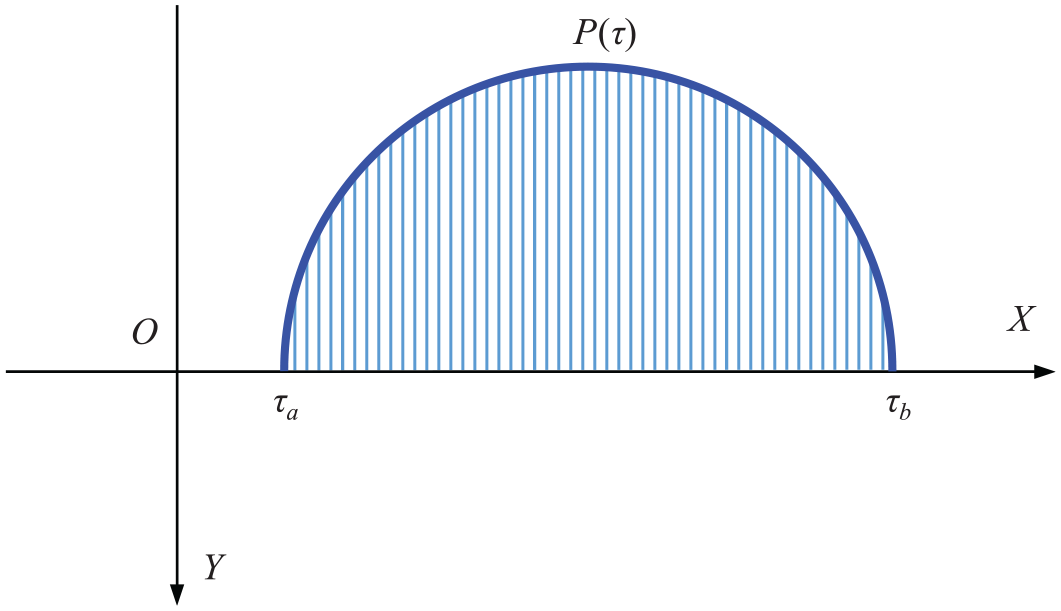
Pressure distribution between τ = τa and τ = τb.
Equation (2) can be rewritten as follows:
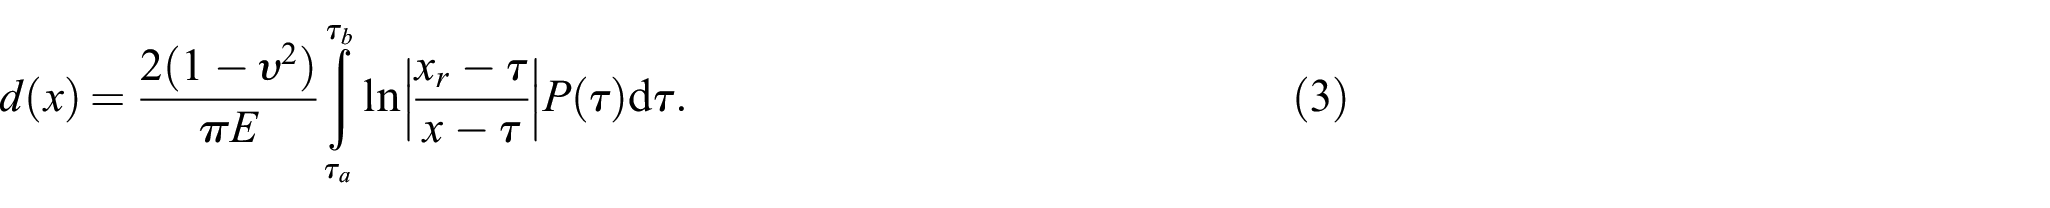
As shown in Figure 3, when two elastic bodies contact at point O, the initial gap between points a1(x, y1) and a2(x, y2) is h(x), and the contact zone is Ωc under load Q.
Contact model of two elastic bodies.
The contact equation is expressed as follows:

where δ is the elastic approach. Taking the displacement relative to point (xr, 0), we obtain

Introducing a variable W(x) = h(xr) – h(x), we obtain

where
The contact pressure P needs to satisfy the following equation:

Then, the contact stiffness is written as follows [45]:

where L is the contact length.
2.2. Numerical solution
As depicted in Figure 4, divided the contact zone into M interval, and there are M + 1 nodes, where every node is τj (j = 1, 2,…, M + 1). Based on linear interpolation method, the contact pressure P(τ) at interval [τ j , τj+1] is written as follows:

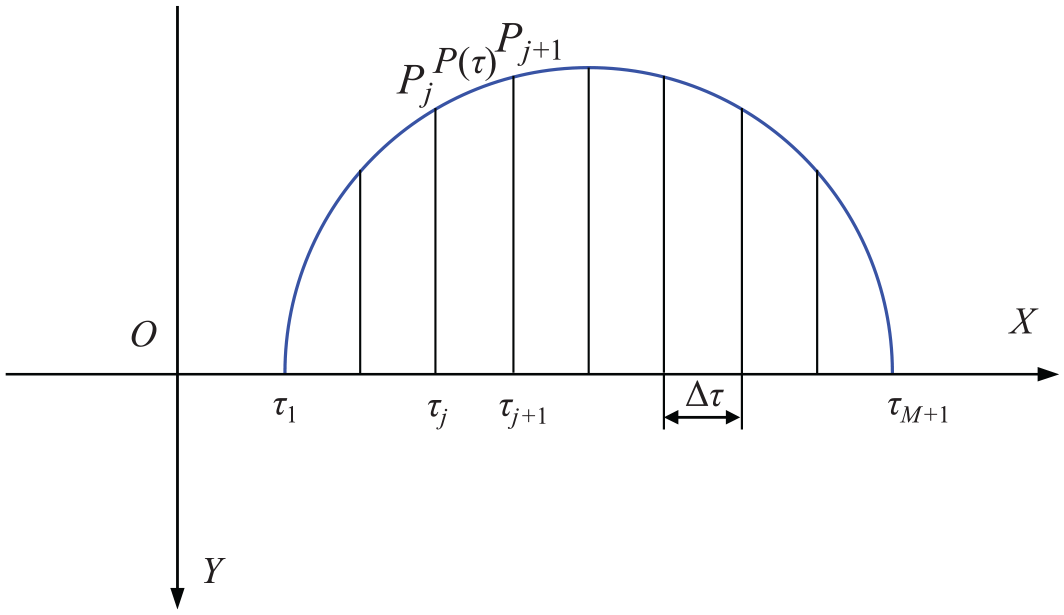
Interpolation of contact pressure.
Substituting equation (9) into equations (6) and (7), the following equations are obtained:
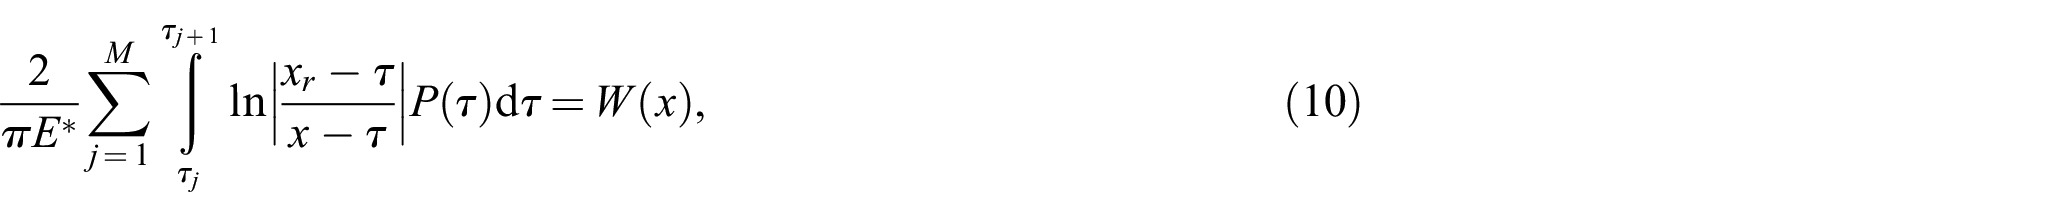

Amount of elastic deformation of any node due to contact pressure Pj can be expressed as follows:

where Fij is the influence coefficient. To obtain the influence coefficient, we need to integrate the following equation:
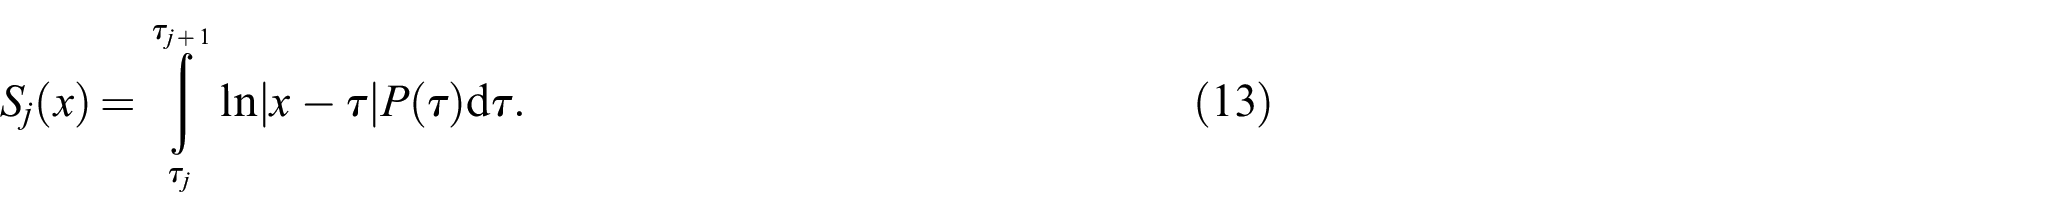
Substituting equations (9) and (13) into equation (10), we obtain

According to equations (12) and (14), the influence coefficients Fij are written as follows:

When the influence coefficients Fij are determined, equations (11) and (12) show that the contact pressure can be addressed. The solution flow chart is presented in Figure 5, where a sufficiently large contact zone containing the actual contact zone is given and divided into M equal parts (M + 1 nodes). By calculating the influence coefficients Fij and solving equations (11) and (12), we can obtain the contact pressure Pj (j = 1, 2,3,…, M + 1). It should be noted that the nodes whose contact pressure is less than 0 are removed from the contact zone and the contact pressure at these nodes is set to 0. Then, the process is repeated by updating the elastic approach δ until each Pj is no less than 0 and the relative difference between the total load and the given load is less than ε0 (an extremely small value and can be set to 10–6). Then, δ is obtained. The contact stiffness is determined by equation (8).
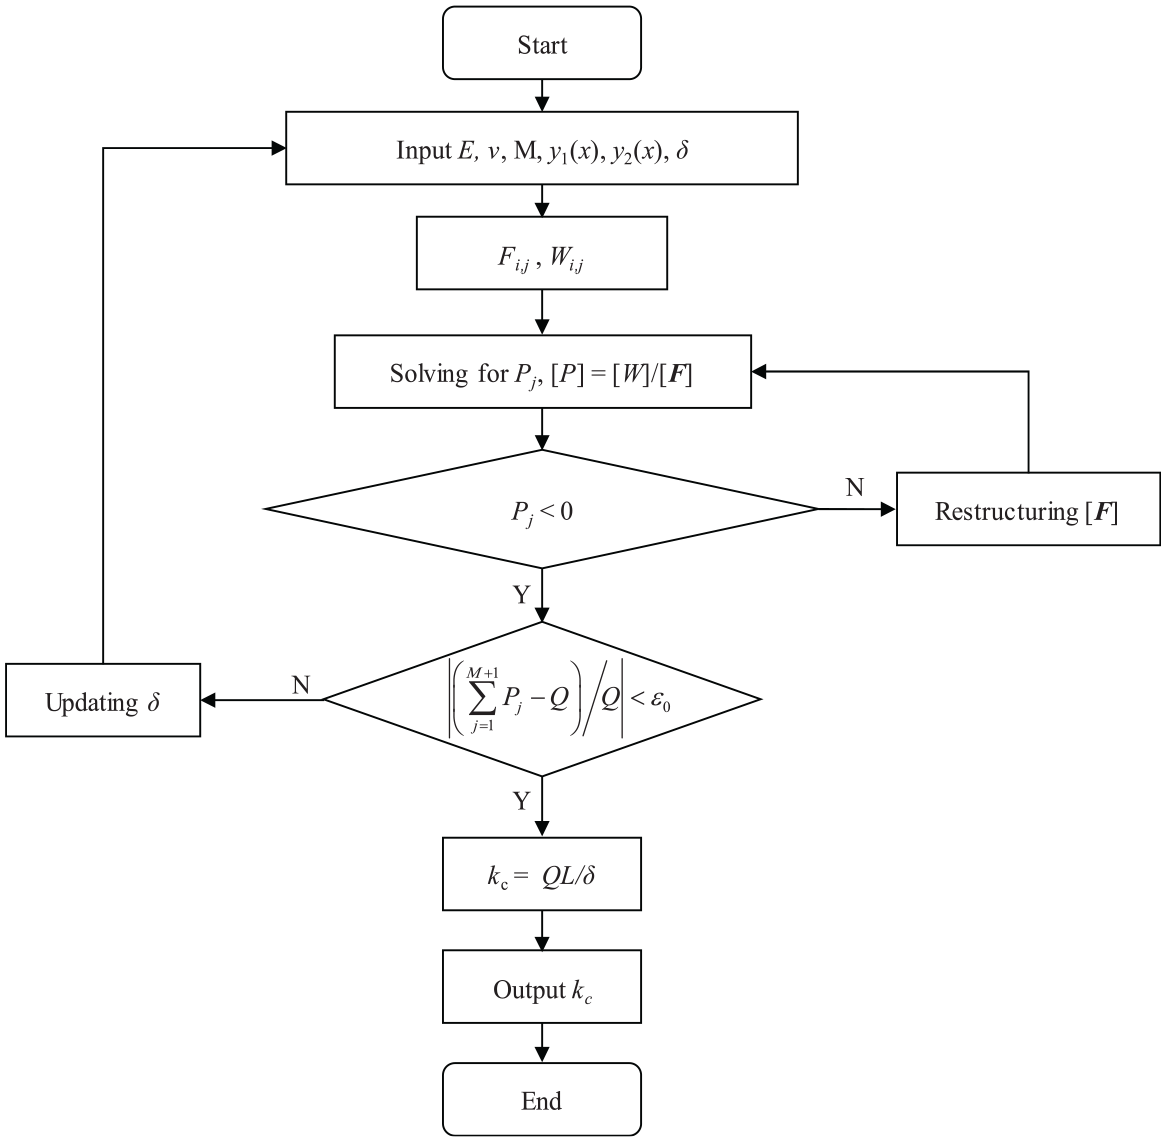
Solution flow chart of elastic bodies contact.
3. TVMS modeling of spur gears
In the gear system, the deformations of axial compression, bending, fillet foundation, shear, and contact coexist. For a gear tooth under applied load Q, the deformation potential energy Ui (i = a, b, f, s) can be described as follows:

where k refers to the stiffness. Subscript i (i = a, b, f, s) denotes the axial compression, bending, fillet foundation, and shear.
The contact deformation potential energy Uc between two elastic bodies is expressed as follows:

where kc is the contact stiffness.
For a contacting tooth pair, the total potential energy Ut can be obtained by Chen and Shao [46].

where subscripts 1 and 2 represent pinion and gear, respectively.
Substituting equations (16) and (17) into equation (18), we obtain

Solving equations (16)–(19) simultaneously, we can express the meshing stiffness of contacting tooth pair i (i = 1, 2) as

The TVMS of spur gears is given as follows:

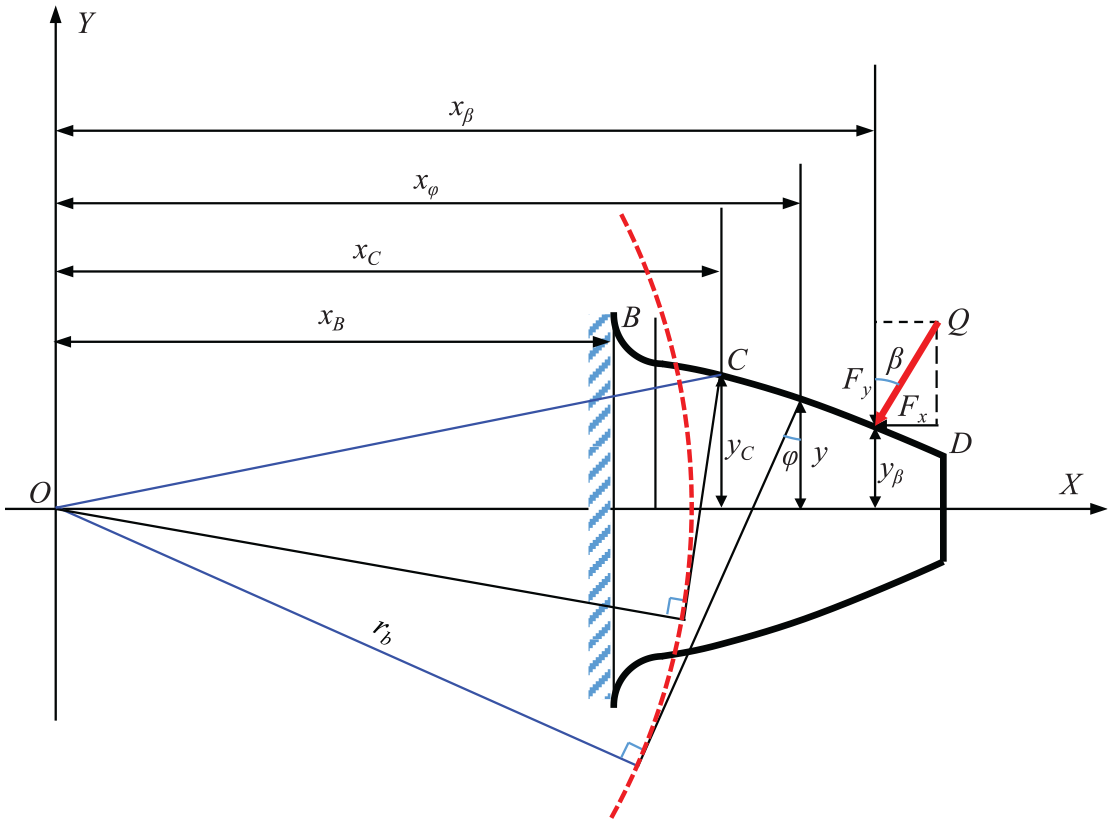
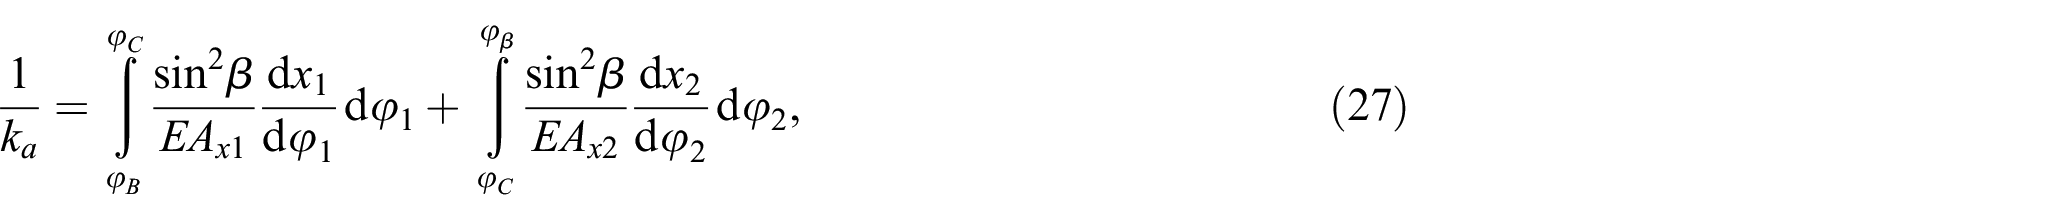
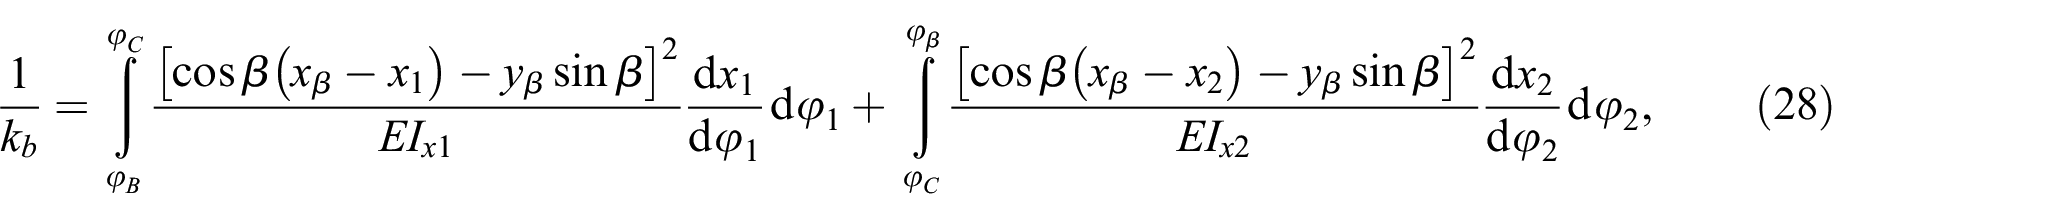
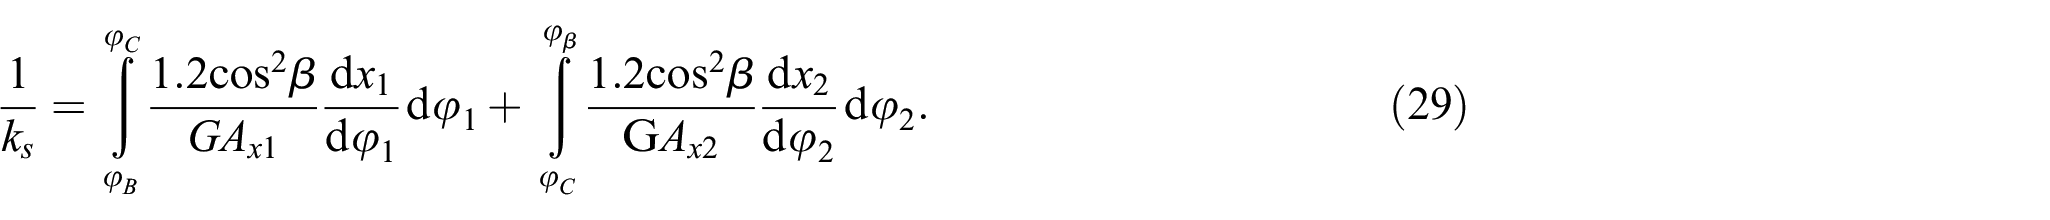
The cantilever beam model of the gear tooth is established in Figure 6. Point B represents the intersection of root circle and transition curve, and point C is the intersection of the transition and involute curves. The expressions of Ua, Ub, and Us are written as follows [16]:
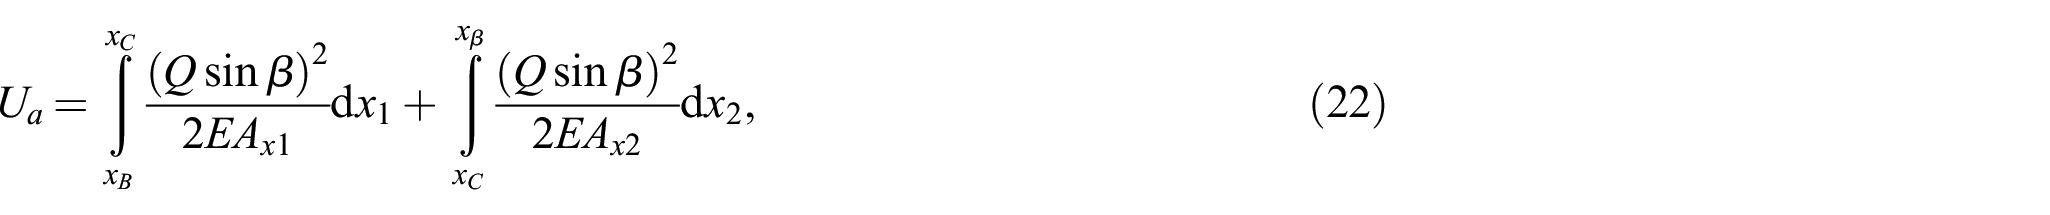
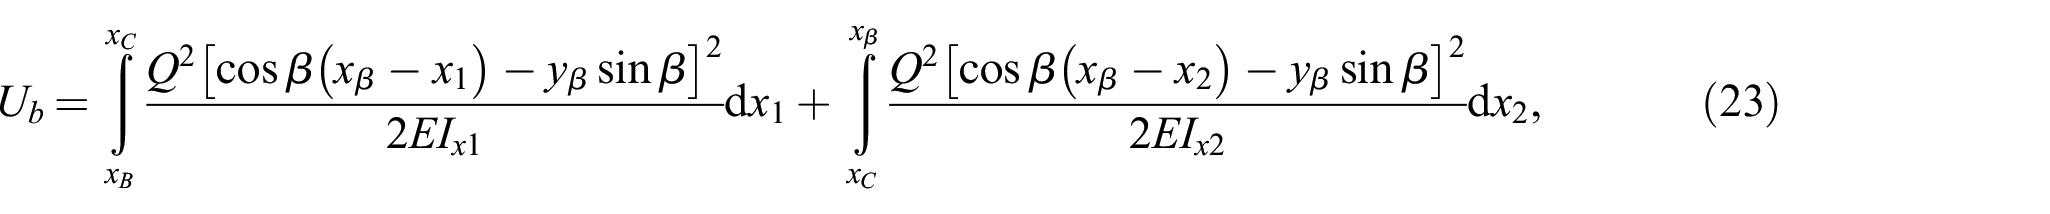
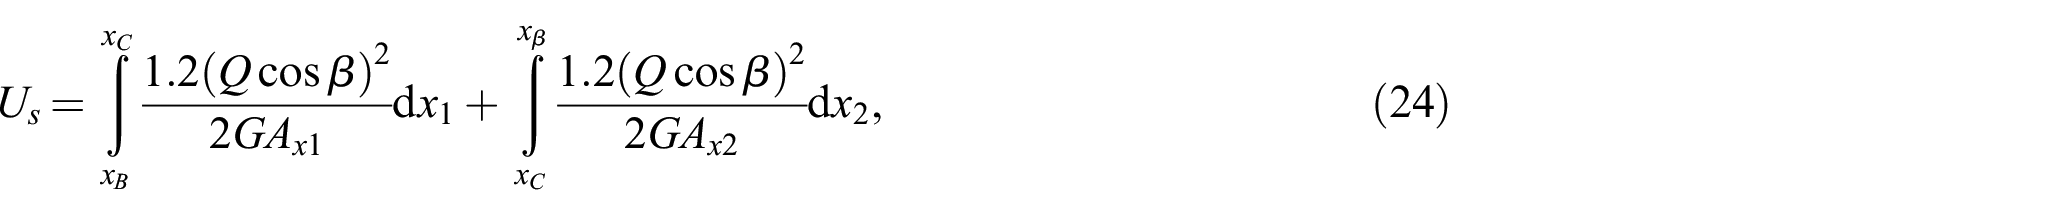
where xi (i = B, C) is the X-coordinate of point i. yβ represents the Y-coordinate of arbitrary points on the involute curve. x1 and x2 are the X-coordinates of arbitrary points on the transition and involute curves, respectively. Ii, Ai (i = x1, x2) are the moment of inertia and cross-sectional area at coordinate x = i, respectively. G is the shear modulus.
Cantilever beam model of gear tooth.
The transition curve coordinates (x1, y1) and involute tooth profile coordinates (x2, y2) are determined by Zhou and Wang [47]:


where the relevant parameters are listed in the work of Zhou and Wang [47].
According to equations (16) and (22)–(24), the following equations can be obtained by adopting the roll angle of the hob φ1 and φ2.
where φB and φC are the hob roll angle of the points B and C, respectively.
The fillet foundation stiffness of the gear [12] is written as follows:

where the parameters of uf, Sf, L*, M*, and Q* are presented by Sainsot et al. [12].
4. Results and discussion
4.1. Validation of proposed contact stiffness model
Hertzian contact theory is the most classical method used to solve the contact problem of elastic bodies. As shown in Figure 3, two elastic cylinders come into contact at point O under load Q. The half contact width aH and maximum contact pressure Pmax of the Hertzian contact model are given as follows:
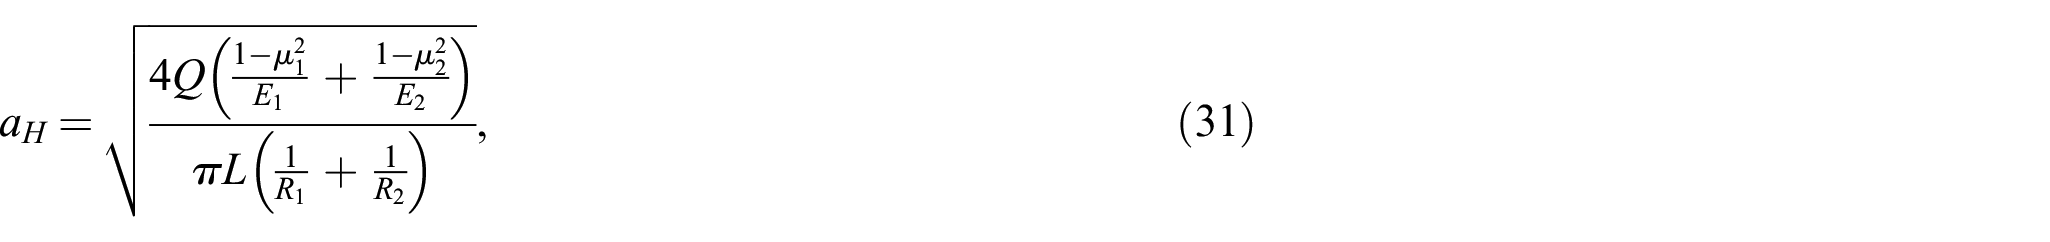
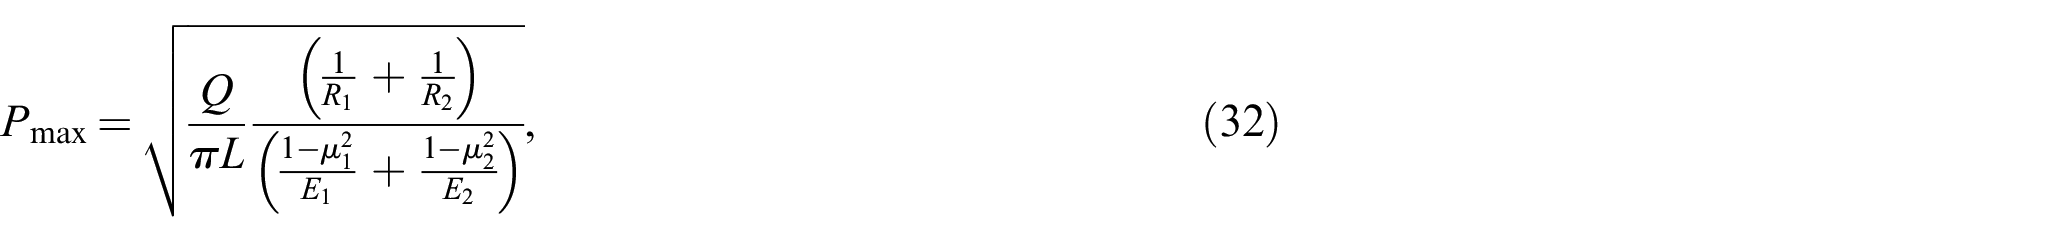
where Ri (i = 1, 2) is the radius of elastic body i, respectively.
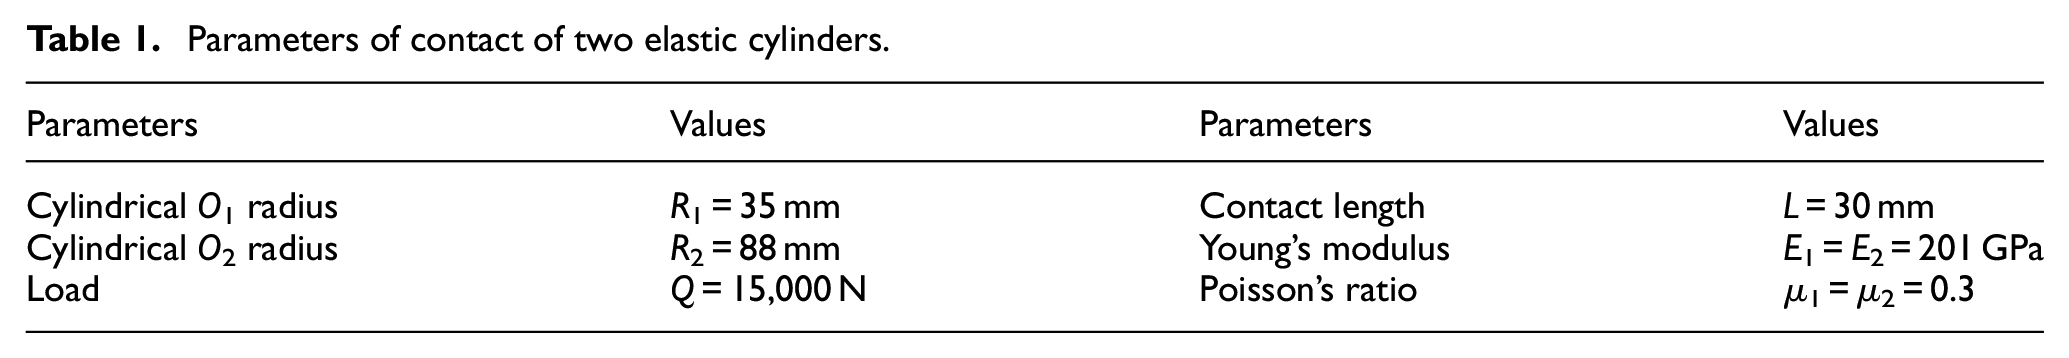
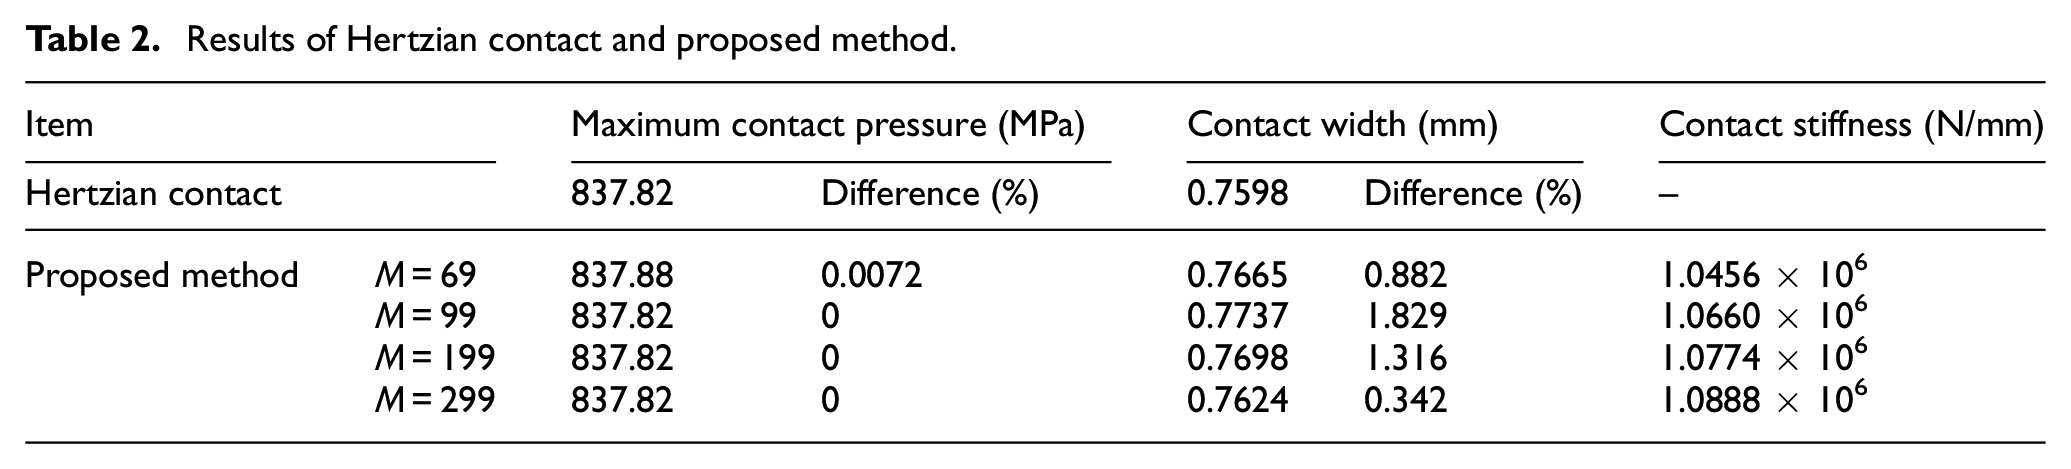
The geometric and material parameters of two elastic cylinders are presented in Table 1. As shown in Figure 7(a), two elastic cylinders come into contact at the origin point O. According to the solving method for elastic body contact proposed in Section 2.2, taking 1.2 times the Hertzian contact width as the preset contact zone. Along the OX direction, discretized the preset contact zone into M (M = 69) points. The contact pressure distribution of the proposed model and Hertzian contact model are illustrated in Figure 7(b). Obviously the contact pressure distribution is almost the same in both models. In order to further study the effectiveness of the proposed model, the number of discrete points M into which the preset contact zone is divided is increased, and the results of maximum contact pressure and contact width are shown in Table 2. According to Hertzian contact theory, the maximum contact pressure and contact width are calculated as 837.82 MPa and 0.7598 mm, respectively. According to the proposed model, except for the maximum contact pressure is calculated as 837.88 MPa for M = 69, the relative differences with Hertzian contact is 0.0072%. The maximum contact pressures are all calculated as 837.82 MPa for M = 99, 199, and 299, and the relative differences with Hertzian contact are both almost zero. Furthermore, the contact width is calculated as 0.7665 mm for M = 69, 0.7737 mm for M = 99, 0.7698 mm for M = 199, and 0.7624 mm for M = 299. The differences relative to Hertzian contact are 0.882%, 1.829%, 1.316%, and 0.342%, respectively. The maximum contact pressure of the proposed model is almost the same as that of the Hertzian contact model, whereas a small deviation is observed between the results of the proposed contact width and the Hertzian contact width due to the limited discrete point. Nonetheless, the maximum relative difference is less than 0.4% for M = 299. Further extrapolation shows that the difference between the contact width of the proposed model and that of the Hertzian contact model will decrease continuously as M increases.
Parameters of contact of two elastic cylinders.
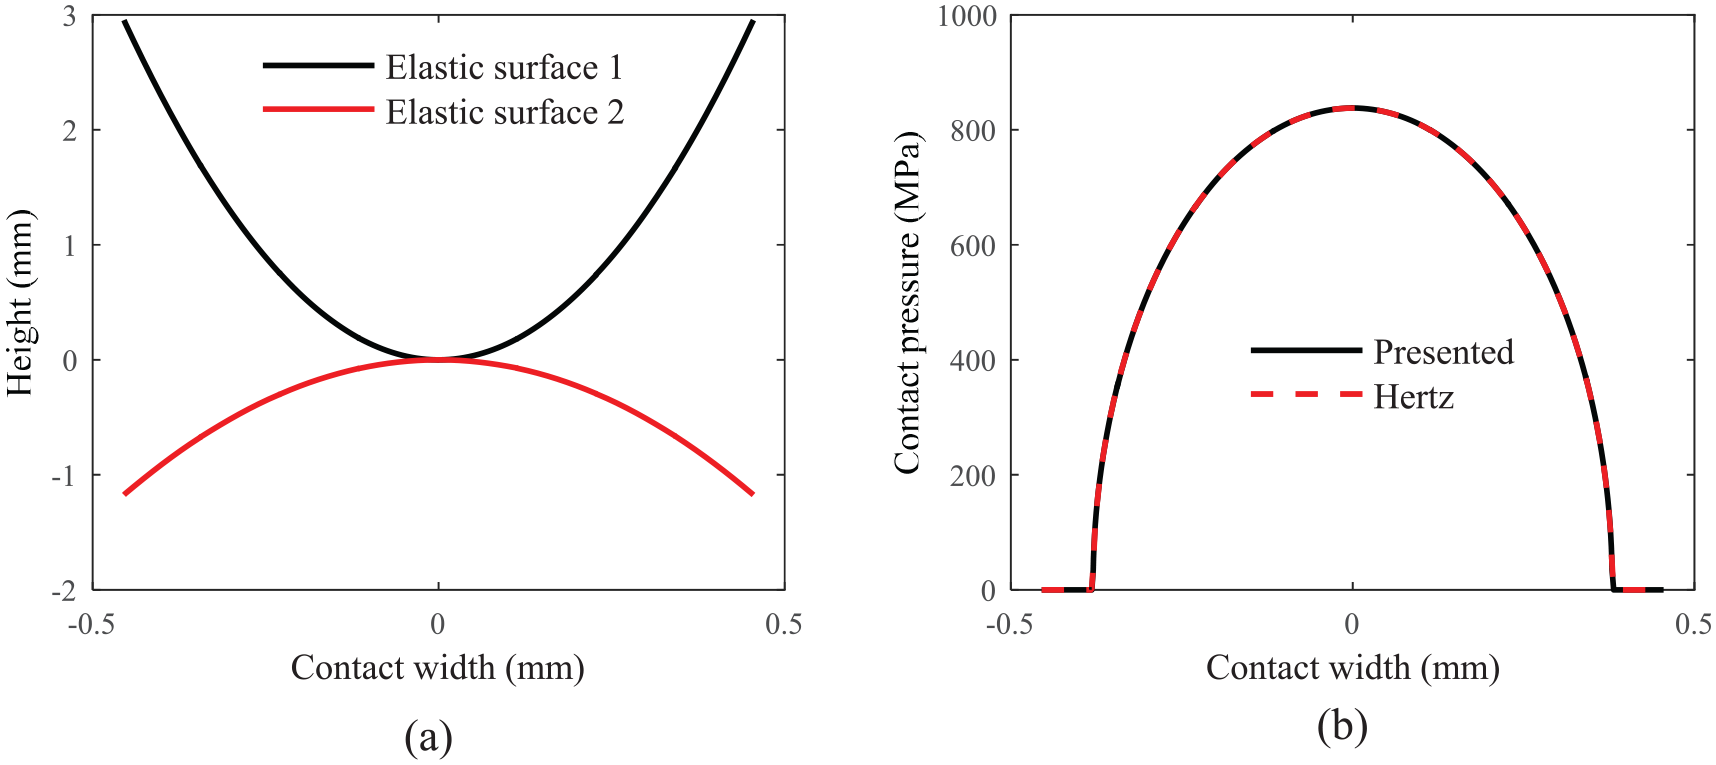
Contact of two elastic cylinder: (a) initial contact position and (b) contact pressure.
Results of Hertzian contact and proposed method.
The FE method is further used to verify the proposed contact model. See Figure 8(a), a 2D FE model with plane strain elements (CPE4R) is presented in ABAQUS. The contact pressure distribution of the FE and proposed models is plotted in Figure 8(b). The number of mesh grids at the actual contact zone is approximately 50 in this FE model. The contact pressure distribution of the proposed model and FE contact model are almost the same. Owing to the limited number of mesh grids, the maximum contact pressure is calculated as 837.12 MPa in the FE model, and the relative difference between the proposed contact model and FE model is 0.0836%. Moreover, the contact width is calculated as 0.7879 mm in the FE model, and the relative difference is −3.2%.
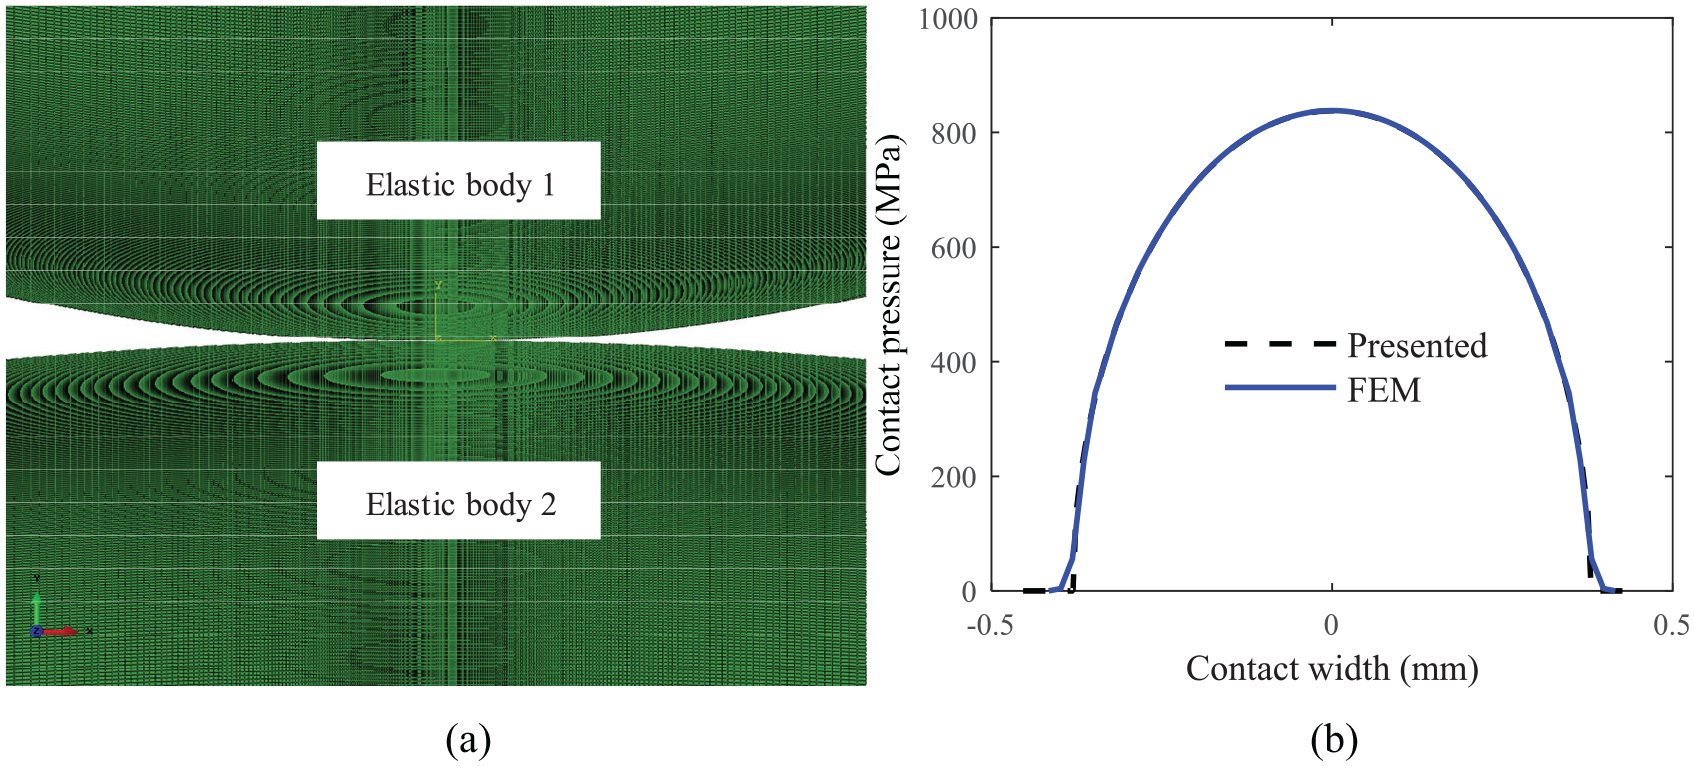
FE contact model of two elastic cylinders: (a) mesh grid model and (b) contact pressure between FE and proposed models.
The proposed contact model is verified through the preceding analysis, and the contact stiffness is listed in Table 2. Along with an increase in M, the contact stiffness increases slightly and is calculated as 1.0888 × 10⁶ N/mm for M = 299. When M increases from 69 to 299, the contact stiffness increases by only 4.1%. Moreover, as illustrated in Figure 9, the sum of the maximum deformation of the two elastic bodies in the FE model is 1.335 × 10⁻² mm, and the contact stiffness is calculated as 1.1236 × 10⁶ N/mm. The relative difference between the proposed and FE model is −3.1%, which further demonstrates the correctness of the proposed model.
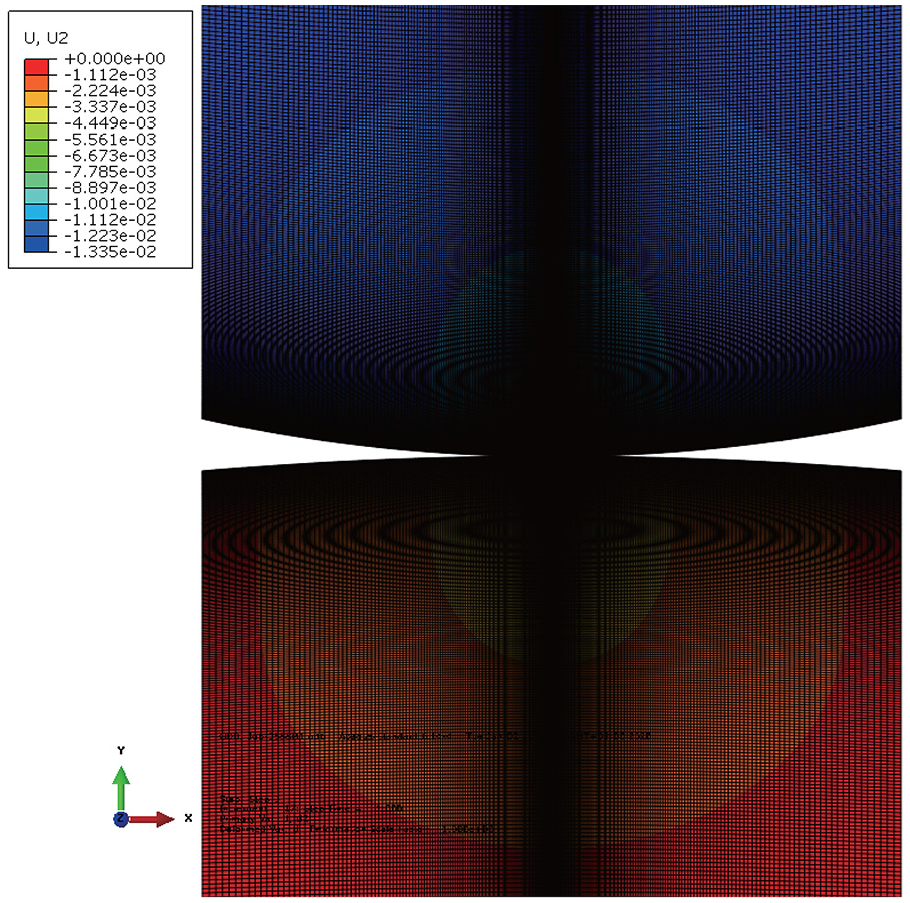
Results of contact displacement by FE model.
The contact stiffness of the proposed model and FE model across different applied load are illustrated in Figure 10. In both models, the contact stiffness increase with an increasing applied load. However, with the increase of load, the increasing rate of the contact stiffness decreases gradually. Further analysis of Figure 10 shows that even if the contact stiffness increases with the increase of the load, the increase value of the contact stiffness is not large. During the change of the load from 3000 to 240,000 N, the contact stiffness only increases from 9.4159 × 10⁵ N/mm to 1.5662 × 10⁶ N/mm. This means that the load is increased by a factor of 80, while the value of the contact stiffness is only increased by a factor of 1.6634. Moreover, the minimum relative difference of proposed contact stiffness and the FE contact stiffness model is −1.64% and the maximum relative difference is −3.81%. Therefore, the validity of the proposed contact stiffness model is further verified.
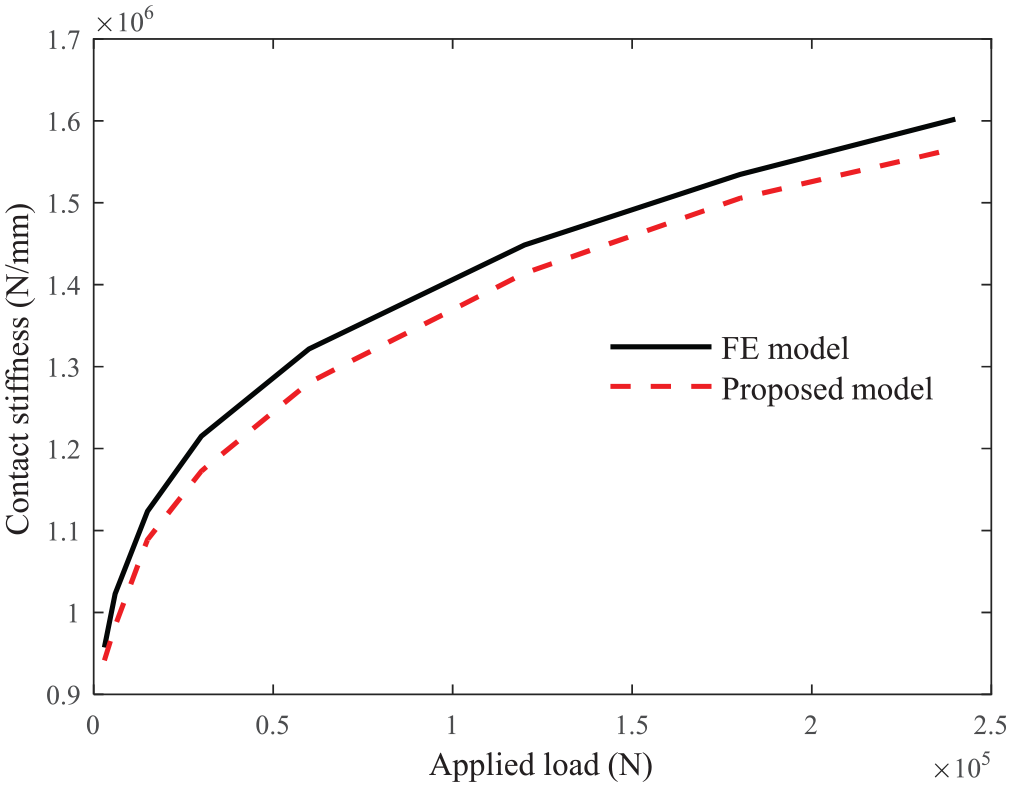
Contact stiffness across different applied load.
4.2. Comparison of different contact stiffness models
In the previous studies, contact stiffness is defined by SHCS [36] or NHCS [40]. The expression of SHCS is

The NHCS is written as follows:

where 1/Eeq = (1/E1 + 1/E2)/2.
In accordance with equations (33)–(34) and the parameters in Table 1, the SHCS and NHCS are obtained as 5.2043 × 10⁶ and 1.8479 × 10⁶ N/mm, respectively. This condition indicates that the contact stiffness derived from the proposed model is approximately 0.21 times that of SHCS and 0.59 times that of NHCS. Proposed contact stiffness, SHCS, NHCS, and FE contact stiffness across different applied load are plotted in Figure 11. Since the influence of load is not considered in SHCS, SHCS does not change with the change of load. Proposed contact stiffness, NHCS, and FE contact stiffness increase with the increase of load, and they almost have the same variation trend. While NHCS is greater than proposed contact stiffness at the same load. As the load increased from 3000 to 240,000 N, SHCS increases by a minimum of 232.29% and a maximum of 452.72% over proposed contact stiffness, and NHCS increases by a minimum of 55.68% and a maximum of 71.41% over proposed contact stiffness. Therefore, in engineering application, the use of SHCS and NHCS will make the value of contact stiffness larger. The minimum relative difference between SHCS and FE model is 224.84% and the maximum relative difference between SHCS and FE model is 443.68%. The minimum relative difference of NHCS and the FE model is 52.19% and the maximum relative difference is 64.34%. According to the analysis in Section 4.1, the minimum relative difference of the proposed contact stiffness and the FE model is −1.64%, and the maximum relative difference is −3.81%. Therefore, it can be concluded that the stiffness model proposed in this work is more accurate.
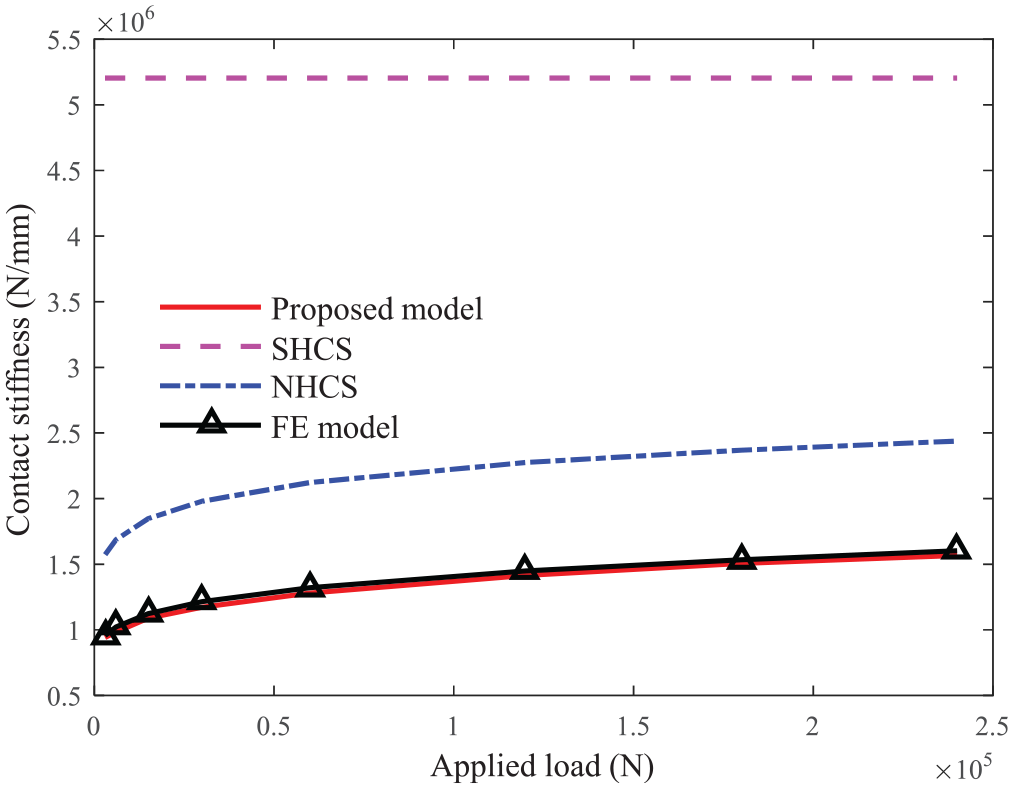
Three typical contact stiffness across different applied load.
4.3. TVMS of spur gear drive
Since the contact stiffness is related to the applied load, an iterative method is needed to calculate the TVMS of spur gear pair. The calculation flow chart of TVMS of spur gear pair is shown in Figure 12. A meshing process of a gear pair is divided into Nd nodes. The axial compression stiffness (ka1, ka2), bending stiffness (kb1, kb2), fillet foundation (kf1, kf2), and shear stiffness (ks1, ks2) can be determined by the gear design parameters because they are independent of the load. Then, the initial TVMS is obtained by adopting SHCS, and the initial load sharing factor (lsf1) of one meshing gear pair is written as follows:

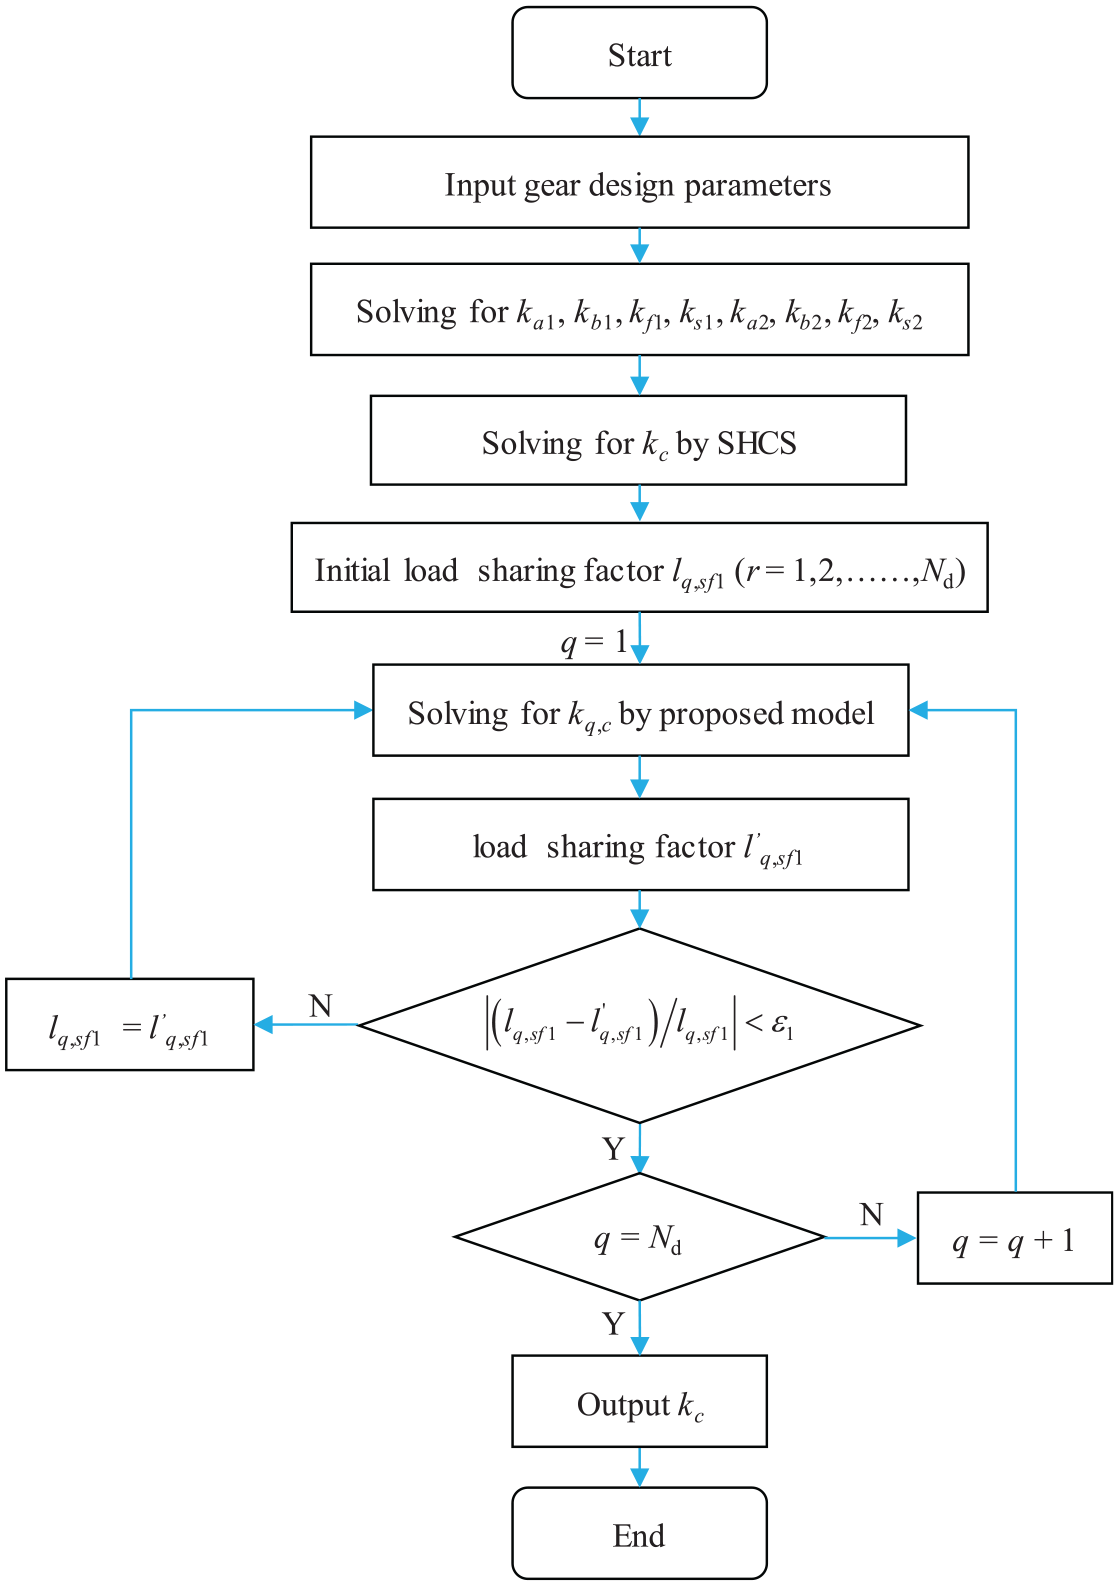
Solution flow chart of TVMS of spur gear drive.
One meshing cycle is averagely divided into Nd parts, the initial load sharing factor (lq, sf1) of the gear pair at q position can be obtained, and the contact load will be determined. According to the proposed contact stiffness model and the energy method stiffness model, TVMS of the gear pair at q position can be obtained, and the load sharing factor l’q, sf1 can be obtained according to equation (35). TVMS of the gear pair at q position can be output if lq, sf1 and l’q, sf1 satisfy the following equation:

where ε1 is a small value that can be set to 10–6.
If lq, sf1 and l’q, sf1 do not satisfy equation (36), set lq, sf1 = l’q, sf1, and repeat the above process until lq, sf1 and l’q, sf1 satisfy equation (36). Then, the TVMS at the next meshing position is calculated according to the above process until q = Nd.
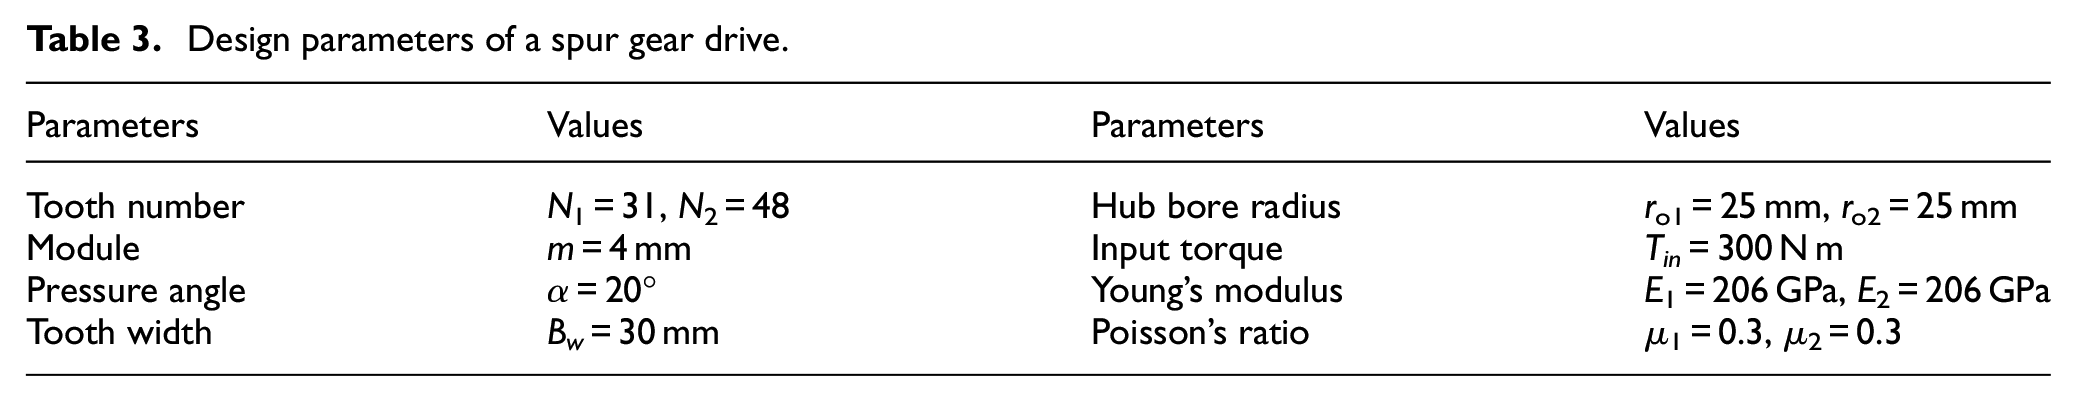
The design parameters of a spur gear drive are presented in Table 3, and the mesh stiffness of single-tooth pair and the TVMS values of the gear pair with SHCS, NHCS, and proposed contact stiffness are depicted in Figure 13. Since TVMS of gear pair obtained by NHCS is also related to load, and the load of gear pair in the meshing process is time-varying. Therefore, the determination of TVMS of gear pair obtained by NHCS should be carried out in accordance with the calculation flow chart of TVMS obtained by the proposed contact stiffness in Figure 12, just need to change the kc by knh.
Design parameters of a spur gear drive.
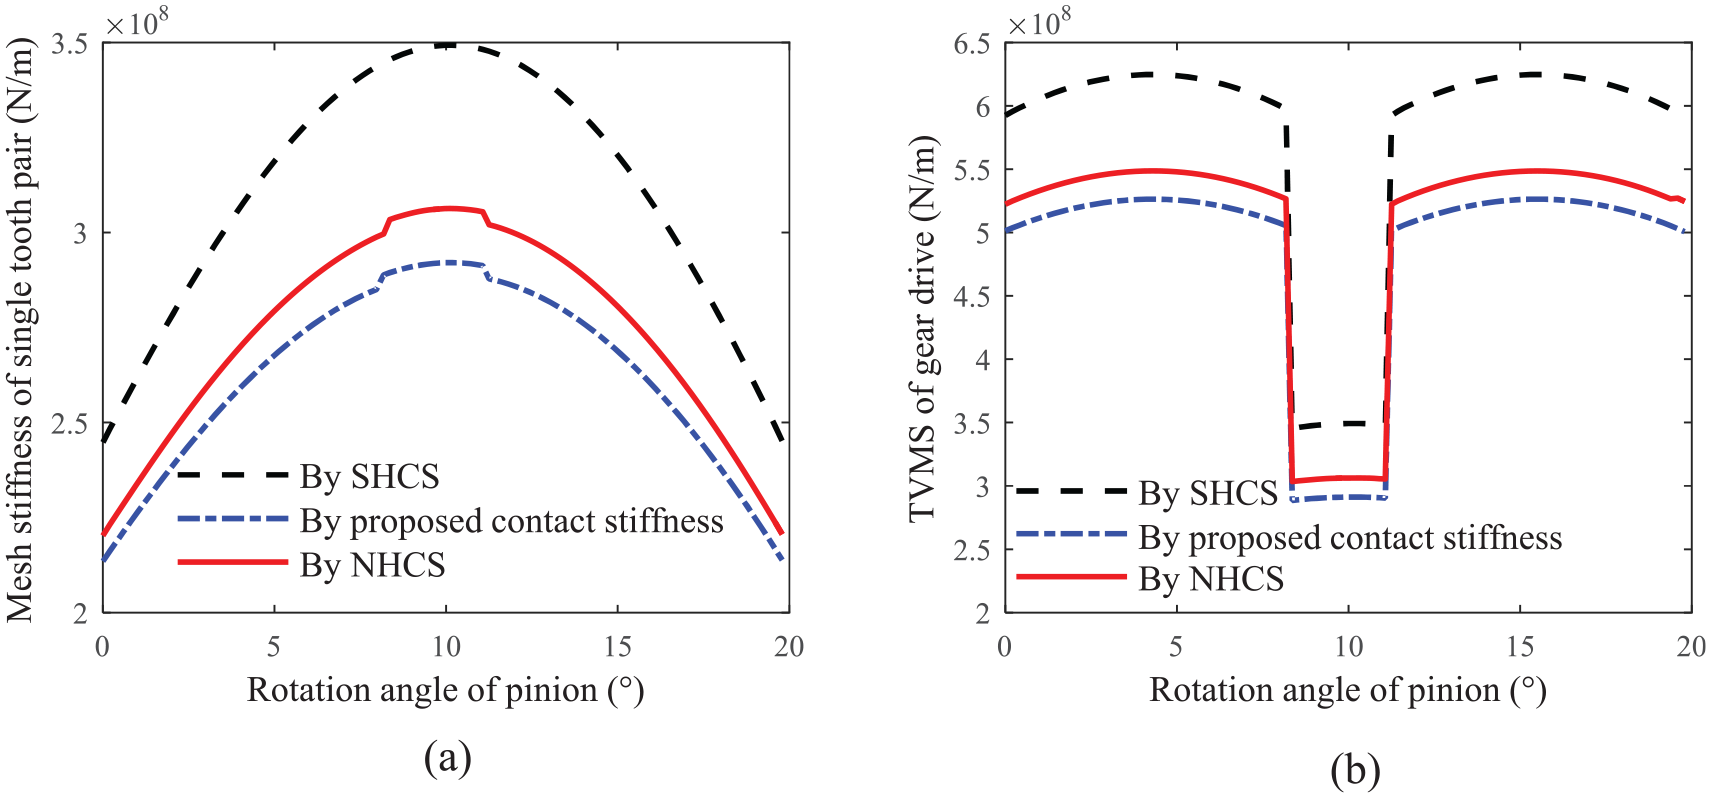
Mesh stiffness: (a) mesh stiffness of single tooth pair and (b) TVMS of gear drive.
As shown in Figure 13(a), the mesh stiffness of the single-tooth pair obtained by SHCS is the largest while that of the single tooth pair obtained by proposed contact stiffness is the smallest. Proposed contact stiffness and NHCS are affected by the load, and the load of spur gears mutates at the inflection point of the single-tooth and double-tooth contact. Therefore, the mesh stiffness obtained by the proposed contact stiffness and NHCS show a small mutation at these two meshing positions. The variation trends of the TVMS obtained by the three methods are the same (Figure 13(b)) because only the calculation method of the contact stiffness is changed. Based on the parameters given in Table 3, the TVMS calculated by the proposed contact stiffness model is the smallest and that by SHCS is the largest. At double-tooth contact, the difference between the maximum TVMS calculated by SHCS and proposed contact stiffness is 9.8382 × 10⁷ N/m, the relative difference is 18.69%, the difference between the maximum TVMS calculated by NHCS and proposed contact stiffness is 2.2318 × 10⁷ N/m, and the relative difference is 4.24%. At single-tooth contact, the difference between the maximum TVMS calculated by SHCS and proposed contact stiffness is 5.8072 × 10⁷ N/m, and the relative difference is 19.94%; the difference between the maximum TVMS calculated by NHCS and by the proposed contact stiffness is 1.5108 × 10⁷ N/m, and the relative difference is 5.19%. These results mean that the differences of TVMS by SHCS or NHCS are relatively large.
The TVMS of the gear drive is generally influenced by the contact stiffness, which is significantly determined by tooth width and input torque. To aid gear designers in maximizing load capacity and optimizing dynamic performance, we discuss the effects of these parameters on the TVMS of the spur gear drive in the following section.
4.4. Effects of tooth width
The mesh stiffness of the single tooth pair and TVMS of the gear drive across different tooth widths are depicted in Figure 14. Along with an increase in tooth width, the mesh stiffness of the single-tooth pair increases. As illustrated in Figure 14(a), the maximum mesh stiffness of the single tooth pair is calculated as 1.9828 × 10⁸ N/m for Bw = 20 mm, 2.9120 × 10⁸ N/m for Bw = 30 mm, and 4.7524 × 10⁸ N/m for Bw = 50 mm. Even though the influence of the tooth width on axial compression stiffness, bending stiffness, fillet foundation stiffness, and shear mesh stiffness is linear, the mesh stiffness of the single-tooth pair non-linearly increases with the tooth width because the contact stiffness is related to the load. The TVMS of gear drive becomes larger with increasing tooth width is illustrated in Figure 14(b). The maximum mesh stiffness of the gear drive at the double-tooth contact is calculated as 3.5769 × 10⁸ N/m for Bw = 20 mm, 5.2632 × 10⁸ N/m for Bw = 30 mm, and 8.6054 × 10⁸ N/m for Bw = 50 mm. This means that although TVMS increases with the increase of load, the rate of increase is less and less.
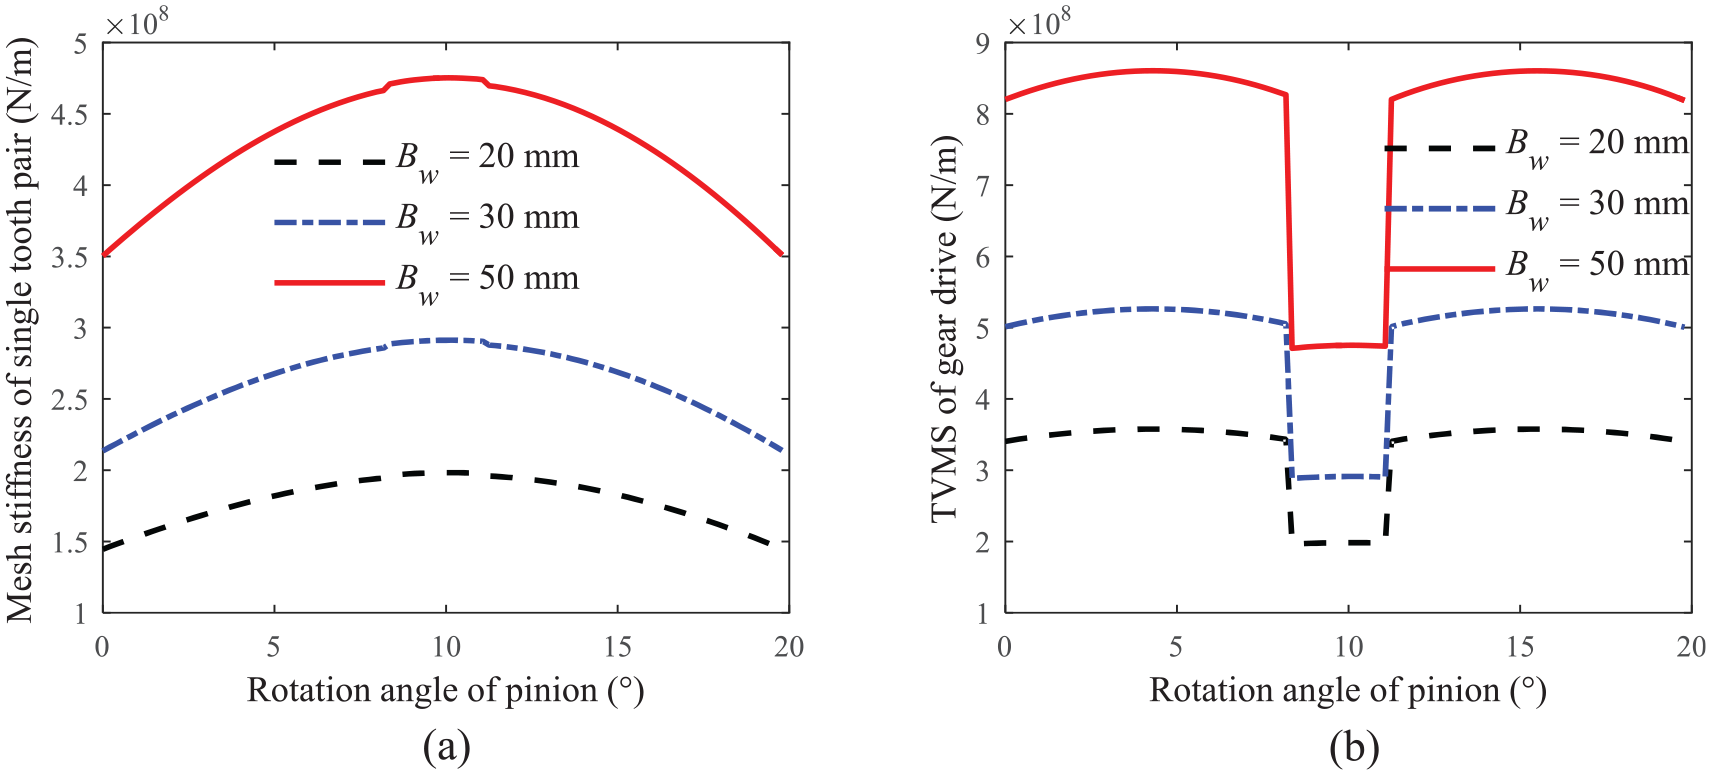
Mesh stiffness across different tooth widths: (a) mesh stiffness of single tooth pair and (b) TVMS of gear drive.
4.5. Effects of input torque
Figure 15 illustrates the mesh stiffness of the single tooth pair and the TVMS of the gear drive across different input torques. The mesh stiffness of the single tooth pair increases with an increasing input torque. As shown in Figure 15(a), the maximum mesh stiffness of the single tooth pair is calculated as 2.8570 × 10⁸ N/m for Tin = 200 N m, 2.9120 × 10⁸ N/m for Tin = 300 N m, and 2.9979 × 10⁸ N/m for Tin = 500 N m. Since the axial compression stiffness, bending stiffness,0 fillet foundation stiffness, and shear mesh stiffness are independent of the load and the contact stiffness depends on the load, TVMS vary with the load. The TVMS of gear drive becomes larger with increasing input torque is illustrated in Figure 15(b). The maximum mesh stiffness of the gear drive at the double-tooth contact is calculated as 5.1772 × 10⁸ N/m for Tin = 200 N m, 5.2632 × 10⁸ N/m for Tin = 300 N m, and 5.3994 × 10⁸ N/m for Tin = 500 N m. These results indicate that the TVMS of the gear drive increases by 1.66% as the input torque increases from 200 to 300 N m, and 2.59% as the input torque increases from 300 to 500 N m. It indicates that the increase rate of TVMS with the increase of torque becomes smaller and smaller.
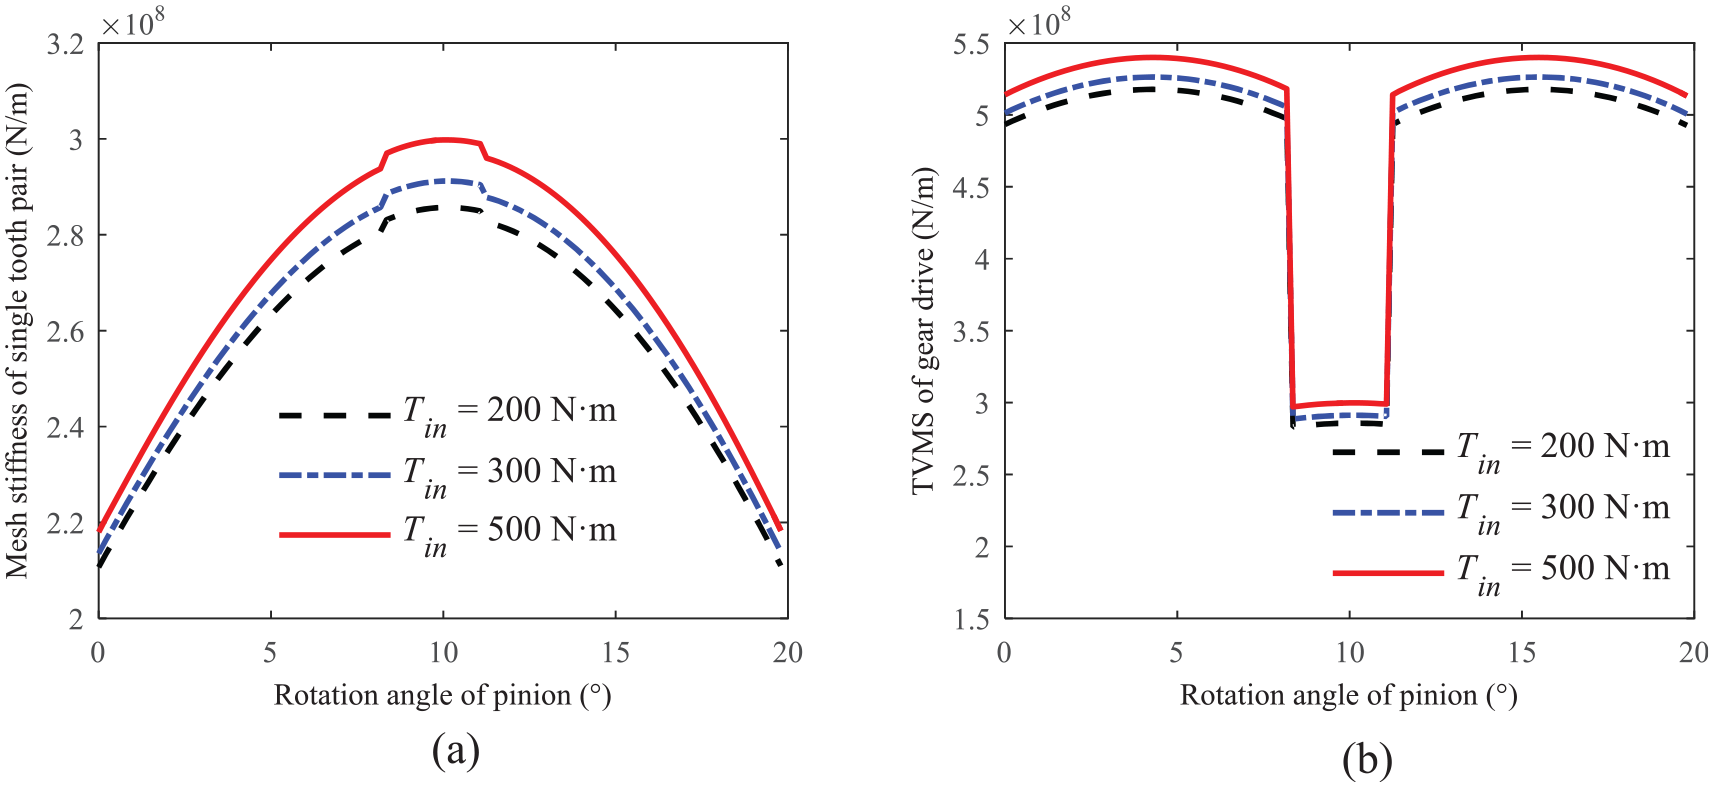
Mesh stiffness across different input torques: (a) mesh stiffness of single tooth pair and (b) TVMS of gear drive.
5. Conclusion
In this study, a numerical contact stiffness model for elastic bodies is developed and applied to the TVMS modeling of the spur gear drive. According to the theory of elasticity, the contact stiffness model of elastic bodies is obtained by a numerical model that employs a piecewise linear interpolation method. The TVMS of the spur gears is determined in accordance with the stiffness models of axial compression, bending, fillet foundation, and shear which are derived by the potential energy method and proposed contact stiffness model. The proposed contact model is verified by Hertzian contact theory and FE method, and the differences among proposed contact stiffness, SHCS, and NHCS are analyzed. Then, the TVMS values of a spur gear drive with three contact stiffness models are further investigated. The effects of tooth width and input torque on the TVMS of the gear drive are discussed. The main conclusions of this study are as follows:
The proposed contact stiffness model of elastic bodies is verified by the Hertzian contact and FE models. Even though the contact stiffness increases with the load, the increasing rate decreases gradually.
Compared with the SHCS model and NHCS model, the proposed contact stiffness is the minimum, which means that the TVMS of the gear pair by the Hertzian simplified contact stiffness or NHCS are larger.
The TVMS of the gear pair increases with the increased tooth width and input torque, but the increase rate decreases as the tooth width or input torque increases. These findings indicate that reasonable matching of design parameters is beneficial for increasing gear load capacity and optimizing dynamic performance.
The proposed contact stiffness model for elastic bodies can be well extended to cylindrical roller bearing, cam, and friction wheel, which have line contact.
Footnotes
Appendix 1
Declaration of conflicting interests
The author(s) declared no potential conflicts of interest with respect to the research, authorship, and/or publication of this article.
Funding
The author(s) disclosed receipt of the following financial support for the research, authorship, and/or publication of this article: This study was funded by the National Natural Science Foundation of China (grant nos: 52075153 and 52005051), the Key Research and Development Program of Hunan Province (grant no: 2020WK2032), and the Natural Science Foundation of Hunan Province (grant no: 2021JJ40580).