
Abstract
This work concerns mechanical systems known as “pantographic structures”, which are considered a family of beams connected by pivots. We propose a computationally efficient and predictive model capable of providing a plausible description of deformation, using a discrete two-dimensional (2D) “kinematic” model. This model assigns the displacements of certain points, called leaders, while the other points, called followers, are left free to rearrange themselves according to the lattice structure and assigned flocking rules. The advantages of the kinematic model include savings in calculation time and easier handling of complicated structures and fracture phenomena. Moreover, extending the model to encompass non-local interactions, as exemplified by second-gradient materials, is a more straightforward process than solving partial differential equations. The model has previously been employed to elucidate the behaviour of simple materials. The principal innovation of this paper is the essential delineation of the constraint between the pantograph beams, which is contingent upon the presence of the pivot. This was accomplished by imposing an ”average” displacement on the component points of the pivot belonging to two separate beams, thereby introducing an additional parameter into the model. This also necessitated a significant alteration to the calculation algorithm. The model is still constrained by several limitations, including the absence of a physical interpretation for its parameters and the necessity of connecting it to the CUDA (Compute Unified Device Architecture, by NVIDIA) architecture for the calculation of the developed algorithm. The principal limitation of the present approach, however, is the absence of a correlation between the parameters of the ’kinematic’ model and the constitutive parameters of the material. This aspect will be the subject of future research.
Keywords
1. Introduction
In recent years, there has been a growing interest in metamaterials and structured materials, which are capable of exhibiting special mechanical properties, across a diverse range of fields. This is due to the potential offered by the proliferation of three-dimensional (3D) printing technology. The increasing power of computing has facilitated the design and printing of micro-structured materials, which can then be tested for their characteristics and capabilities. The creation of models capable of simulating and predicting the deformation up to fracture of a micro-structured material represents a significant challenge in numerous application fields. In this context, we have recently introduced a two-dimensional (2D) kinetic model that is capable of simulating the behaviour of various 2D continuous systems, even in the presence of deformations that exceed the fracture limit. This model has been developed to facilitate the simulation of the behaviour of these systems, even in situations that are not amenable to analysis using traditional methods.
In previous works [1,2] and [3], the materials simulated were simple discretised continua. We now turn our attention to a pantograph. This system can be considered as a family of beams connected by pivots. Consequently, in this work, it is necessary to model the pivot as a constraining element between the beams. The model, which is still under development, appears to be capable of describing material behaviour, facilitating the simulation of fracture phenomena, and describing crack formation, patterns, and bubbles. It may also be more computationally efficient than other methods, such as finite-element model (FEM). The low computational cost of this method is due to its algebraic nature, which involves a small number of points and does not require the solution of differential equations. Furthermore, this method is compatible with GPU parallelization, as it is written in the CUDA® language.
Pantographic structures consist of an interconnected network of thin beams, often arranged in a periodic or lattice configuration. An example of this structure is shown in Figure 1.
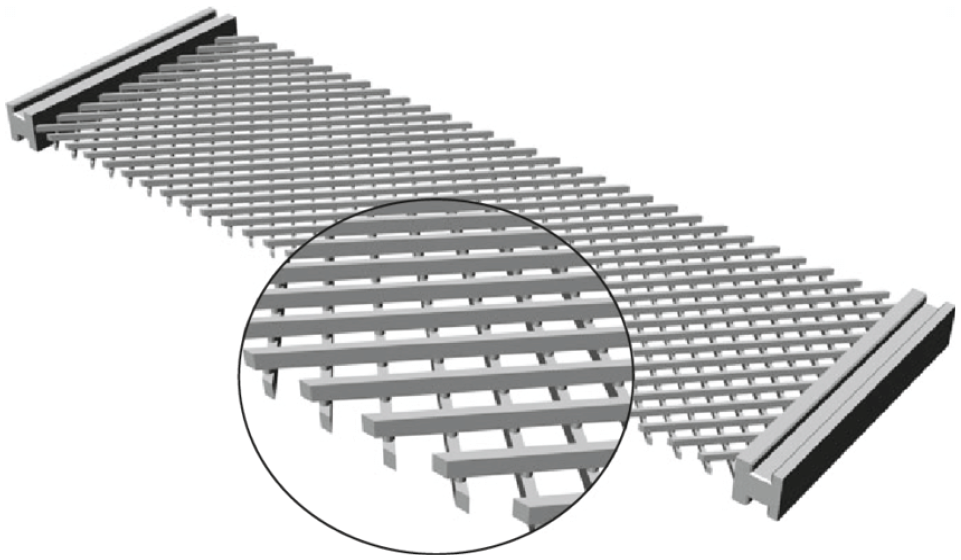
A sample of pantographic sheet with detail.
The careful design of the geometry and mechanical properties of the beams results in a peculiar mechanical behaviour not typically observed in traditional materials or structures. The distinctive geometry enables the pantograph structure to extend and retract in a manner reminiscent of an accordion. The pantograph structure, which is often inspired by biological systems such as muscles and tendons, exhibits a unique combination of non-linear elasticity, large deformation capacity, and distributed compliance. This inherent complexity enables pantographs to emulate the behaviour of biological tissues, rendering them optimal for the development of bio-inspired robots.
The advantages of pantograph materials over simple materials are related to the possibility of modulating the mechanical properties of the material according to the geometry and arrangement of the microstructural elements. One of the principal characteristics of pantographic structures is their capacity to undergo significant deformations while retaining structural integrity. The interconnected nature of the beams enables distributed load transfer, thereby enhancing flexibility and resilience to local damage [4]. Moreover, pantographic materials can leverage long-range interactions between elements to achieve nonlinear dynamic effects, such as elastic wave propagation [5–10]. This is a consequence of the complex interplay between the geometry, kinematics, and mechanical properties of individual beams. Their mechanical performance is advantageous for numerous applications in various fields. To name just a few of the advantages, these materials can exhibit an advantageous weight-to-strength ratio, large deformations in the elastic range, toughness, and reliability, a “hierarchy of strengths”, and their damage response can be easily quantified [11].
This characteristic is of particular value in applications where structural elements must be capable of withstanding significant deformations or external forces. Such applications include soft robotics, morphing structures, and compliant mechanisms. The mechanical response of these structures frequently displays nonlinear and non-local characteristics, such as an anomalous inversion of the Poynting effect [12,13], or other effects when multiple pantograph sheets are stacked in blocks [14]. The focus of this paper is on 2D structures; therefore, effects related to higher dimensions will not be addressed.
A further distinctive feature of pantographic materials is that the configuration and disposition of the beams in pantographic structures can be tailored to attain specific mechanical properties, thereby conferring considerable versatility and adaptability. By meticulous design of joint patterns and beam orientation, engineers can create pantographs with anisotropic properties that vary in accordance with the direction of deformation or loading. This capability offers the opportunity to develop materials with desired stiffness, damping, and vibration control properties, as evidenced by Barchiesi and Placidi [6] and Ciallella et al. [7]. Furthermore, pantographic structures can be employed in the field of metamaterial design, offering the potential for the manipulation of wave propagation. The significance of pantographic structures in continuum mechanics extends beyond their mechanical properties. They serve as a nexus between traditional materials science, mechanics, and the nascent field of metamaterials. Pantographic metamaterials facilitate the manipulation of mechanical wave propagation and the control of structural response, paving the way for the development of novel acoustic and vibration control devices, waveguides, and energy absorption systems.
It is likewise feasible to devise diverse pantograph varieties with varying structural configurations and layouts [15–20]. However, this paper will concentrate on the aforementioned type, as illustrated in Figure 1. It is more straightforward to replicate in our model and is accompanied by a plethora of studies on its beams [21,22] and FEM simulations that we can contrast with our own findings [23].
The analysis and modeling of pantographic structures represents a significant challenge and an invaluable opportunity for the field of continuum mechanics. The field of continuum mechanics offers a robust framework for investigating the mechanical behaviour of these structures, enabling the examination of their nonlinear elastic properties, stability, and failure mechanisms. It is of the utmost importance to gain an understanding of and to develop a model for this nonlinear behaviour in order to accurately predict the structural response of pantographs. In this context, the study of pantographs has resulted in the development of sophisticated calculation tools and analytical models. Researchers have derived constitutive equations and finite element formulations that are specifically adapted to pantograph structures. These models facilitate the simulation and analysis of the mechanical behaviour of pantographs under different loading conditions and help to optimize and design these structures for specific applications. Furthermore, as has already been noted, advances in manufacturing techniques, such as 3D printing and additive manufacturing, have made it possible to realize intricate pantograph structures with high precision and complex geometries.
In recent years, improvements in computational tools have enabled the development of various models to describe the deformations of a continuum as an alternative to the finite-element method. Examples of such models include position base dynamics (PBD) and swarm dynamics [24,25]. Our model can also be situated within the same theoretical framework, for instance, that of PBD [26] or the work of Dell’Erba [24,25,27–29]. In D’Avanzo et al.’s study [1], we demonstrated the similarities and key difference between our model and others in the literature, highlighting the ongoing evolution and improvement of our model. Another model that proved invaluable during the study phase is that presented in the paper by Corte et al. [30].
Nevertheless, there are notable discrepancies in the methodology employed for the construction of the swarm, the formulation of the adjacency matrix, and the manner in which the evolution of the points is conducted. To provide further detail, the aforementioned article permitted the construction of only rectangular swarms; in contrast, our model allows for the creation of any shape, whether convex or concave, with or without holes or slots. The adjacency matrix was constructed using the Chebyshev distance, which has been identified as a source of inaccuracy in tensile tests [31]. In contrast, our algorithm identifies neighbouring points based on their expected positions. For instance, if a point is expected to be located in the top left-hand corner at a distance of √2 from its neighbour, the algorithm searches for a point in a small neighbourhood of that position in the comparison configuration. This process is only executed once at the construction of the swarm. The algorithm described in the aforementioned paper also employed a sequential approach, whereby the leaders were moved first, followed by the points in a single, ordered step. This contrasts with our parallel approach, where each point is moved independently. Consequently, the order in which points are moved affects subsequent points, necessitating careful consideration of the sequence in which they are moved. Moreover, in the case of “fast” displacements, the algorithm suffered from the penetrability of bodies. Our algorithm solves this problem by generating intermediate displacement configurations that are sufficiently “slow” to avoid the problem. Another important difference is the existence of frame points, as by Dell’Erba [24,25,27–29], to complete the number of neighbours belonging to the points on the edge. The existence of the frame brings problems, but our model, by modifying the evolution equation, does not need it. Previous work (of the court) employed the barycenter rule to move points, resulting in the Poisson effect at the cost of introducing a special rule to move points of the frame. In contrast, our approach naturally modifies the interaction rule. Furthermore, the aforementioned model does not describe fracture or simulate exotic behaviour.
In this paper, we simulate pantograph beams as different swarms that do not interact with each other except through pivots. Consequently, a model of the pivots, the point of interaction between different swarms, is necessary.
In comparison to our previous work, we have developed a methodology for enabling the interaction between multiple swarms, paving the way for the introduction of interactions between non-neighbouring points. This allows us to create a swarm-global with microstructures. This implies that the number of points per swarm is a variable that can be manipulated, allowing for further investigation (in the case of thicker beams), thereby introducing a new degree of freedom into the system, enhancing its adaptability.
The model is thus extended to microstructured materials that had not been directly considered in the past. Consequently, the study is no longer limited to the global deformation of a single swarm but encompasses a system of several interacting swarms.
However, the limitations and weaknesses of our kinematic model remain numerous and significant; the following section outlines the most significant of these. First, a physical interpretation is lacking due to the absence of temporal and spatial scales. The concepts of force and energy have yet to be defined; instead, the model only considers the concept of points and their displacement in the succession of steps of the algorithm. The most significant limitation of the model is the lack of a clear understanding of the relationship between its parameters and the underlying physical phenomena. These parameters have been inferred through analogy and association, without a direct and explicit connection to the physical world. The algorithm is still in its infancy, having been developed in Python and linked to the CUDA architecture. This could result in slowdowns when ported to other platforms. Furthermore, it is essential to achieve an equilibrium between the number of points in the swarm, the GPU core, the duration of the simulation, and the level of detail incorporated into the simulation. Consequently, the maximum number of components that can be included in the swarm is constrained by the capabilities of the available hardware.
In essence, a sequence of images is constructed in which the position of points is updated at each step in accordance with rules selected by the researcher. These points move in a manner consistent with the movement of points described by other algorithms known to model the deformation of a material (FEM), and the distribution of local deformations is also compatible (through a process of analogy) with the distribution of deformation energy. It is our hope that, once calibrated, completed, and linked with physics, this will prove capable of describing deformation phenomena.
The following is a description of the structure of the paper. In section 2, we provide a brief overview of the model used for simple materials, as developed in previous research. In order to extend the tool to pantographic structures, it is necessary to describe the interaction between the swarms and to model the pivot that constrains the beams. This is discussed in section 3. Subsequently, it was necessary to ascertain the impact of the model parameters on the deformation of the swarm, as elucidated in section 4 and illustrated in the simulations in section 5. Subsequently, in section 6, we conducted a comparative analysis between our model and the finite-element method simulations presented by dell’isola et al. [23].
2. The tool
The utilisation of robotics in the form of swarms is becoming increasingly common in scientific within the domain of scientific research. In order to achieve this, the concept of flocking rules was employed in order to ascertain the displacement of each robot, with the objective of obtaining the final configuration that was assigned to the entire swarm. Subsequently, the new position of the robot is determined by the position of its neighbours. This same concept was employed to describe the deformation of a lattice of particles comprising a material continuum. This is therefore a purely kinematic approach to the problem, which does not make use of the concepts of mass or force.
The model was first introduced by D’Avanzo et al. [1, 2] and Dell’Erba et al. [3], and its approach draws inspiration from swarm robotics and agent-based modeling, as evidenced by Dell’Erba [24,25,27–29]. In this model, the set of points is referred to as a ”swarm,” with each point acting as an agent that updates its position based on the positions of its neighbors.
In our model, we define a swarm of points in a reference configuration
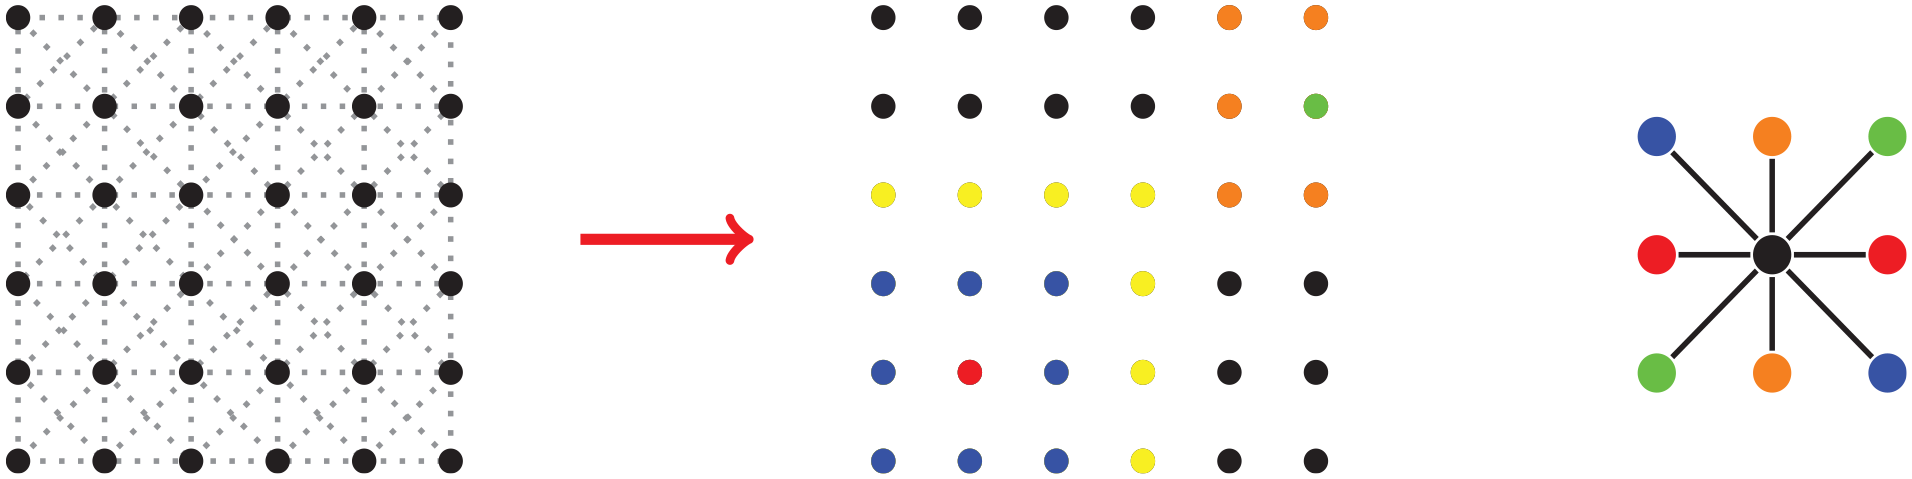
On the left we highlighted the centered squared lattice used to construct the swarm sample in the reference configuration, in the middle we show two example neighborhood, for the red point and the green point. For the red point, in blue are the first neighbors and in yellow the second neighbors. In the case of the green point, it has fewer first neighbors respect to the coordination number of the lattice because it is near the edge of the swarm. Note that in the neighborhood is possible to identify opposite couples of points respect to the considered point, for example, there are four opposite couples in the first neighborhood of the red point and only one for the green one. An example of the possible opposite couples in a neighborhood is shown on the right.
Therefore, with the sequence of iterations of the algorithm

In this context,
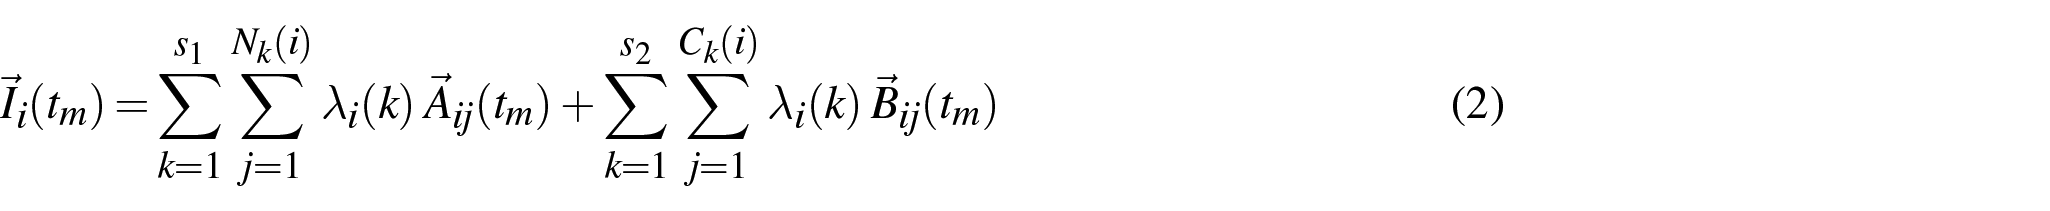
where the interaction


where
Subsequently, a swarm is positioned within the nodes of a crystal lattice, with the leaders subsequently relocated to a pre-assigned position. The positions of the follower are then calculated using the previously derived equations.
The term
The term
It should be noted that the model does not include concepts such as time, energy, force, or velocity. However, work is underway to address this issue, as demonstrated by Dell’Erba et al. [3]. Consequently, in this paper, certain terms are employed in an analogous manner to those used in physics (for example, the term “motion” is used to describe a change in position occurring in one or more iterations of the algorithm). Moreover, the colors employed in the simulations merely represent a local variation of the cell areas with respect to the cell areas in the reference configuration. In this study, we have elected to use solely the centered square structure and its constituent cells and elementary area units (EAUs) as defined by D’Avanzo et al. [1,2] and shown in Figure 3. And the color of each elementary unit is determined by the value obtained from the following formula and a color bar
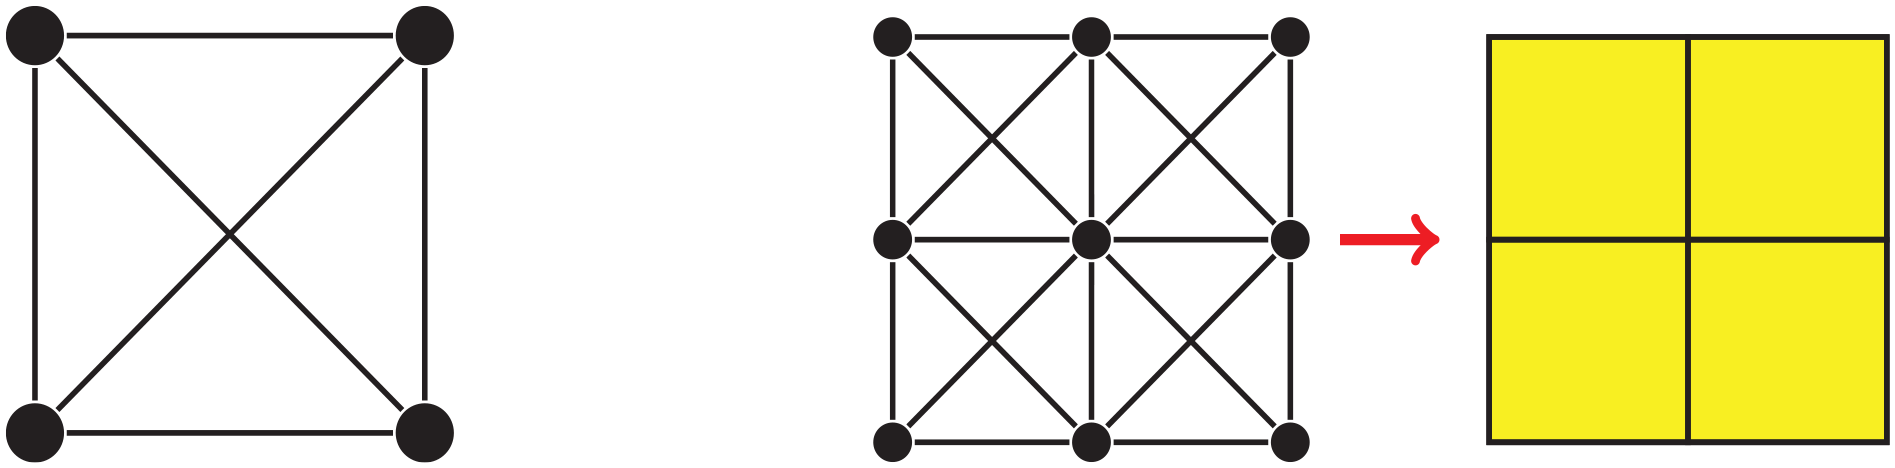
On the left, a complete cell of a swarm with the centered square structure as can be noted in Figure 2, on the right the assignation of an elementary area unit for every complete cell, note that this assignation is done also in the deformed configurations of the swarm where those shapes will be quadrilateral in general with different areas respect the ones in the reference configuration. Those yellow shapes are colored according to formula equation 6 and a color bar.
And the color of each elementary unit is determined by the value obtained from the following formula and a color bar

where
In D’Avanzo et al. [2], the introduction of
In In D’Avanzo et al. [2], the concept of swarm fracture was introduced through the introduction of a break threshold on the distance between points. However, this approach will not be utilized in this work. Consequently, if the distance between points
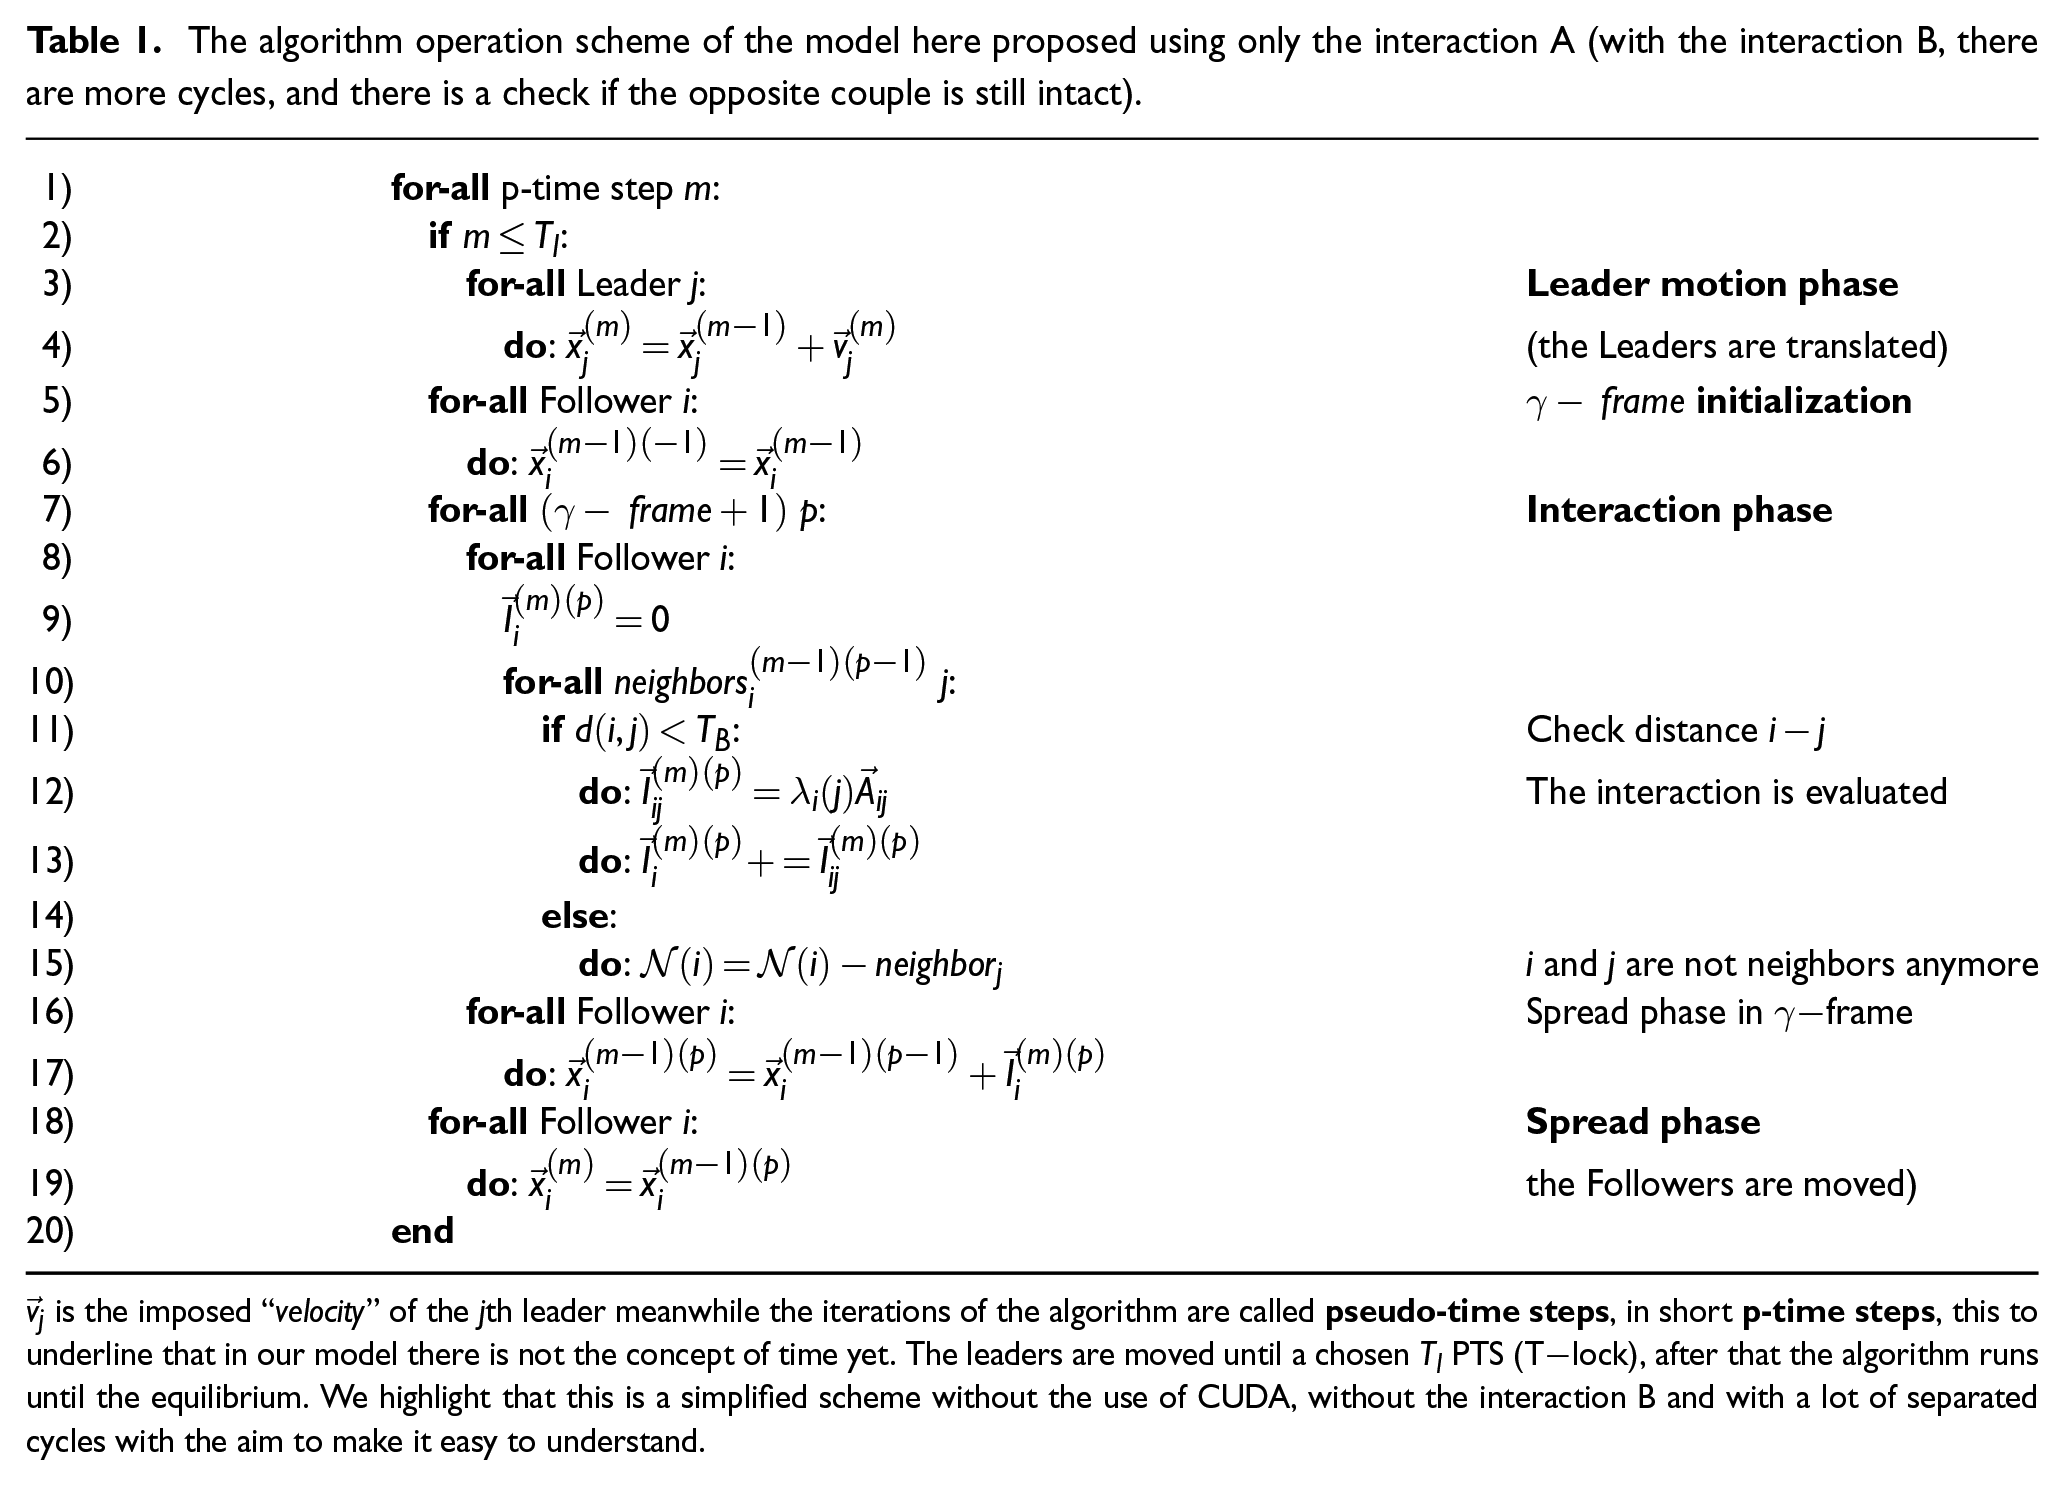
The operational framework of our model algorithm is presented in Table 1.
The algorithm operation scheme of the model here proposed using only the interaction A (with the interaction B, there are more cycles, and there is a check if the opposite couple is still intact).
3. Pantograph construction
To build the pantographic sheet in our model, we exploited the auto-interpenetration of the swarm, that is the fact that points beyond the considered neighborhood in the interactions do not interact with each other, see for example Figure 4.
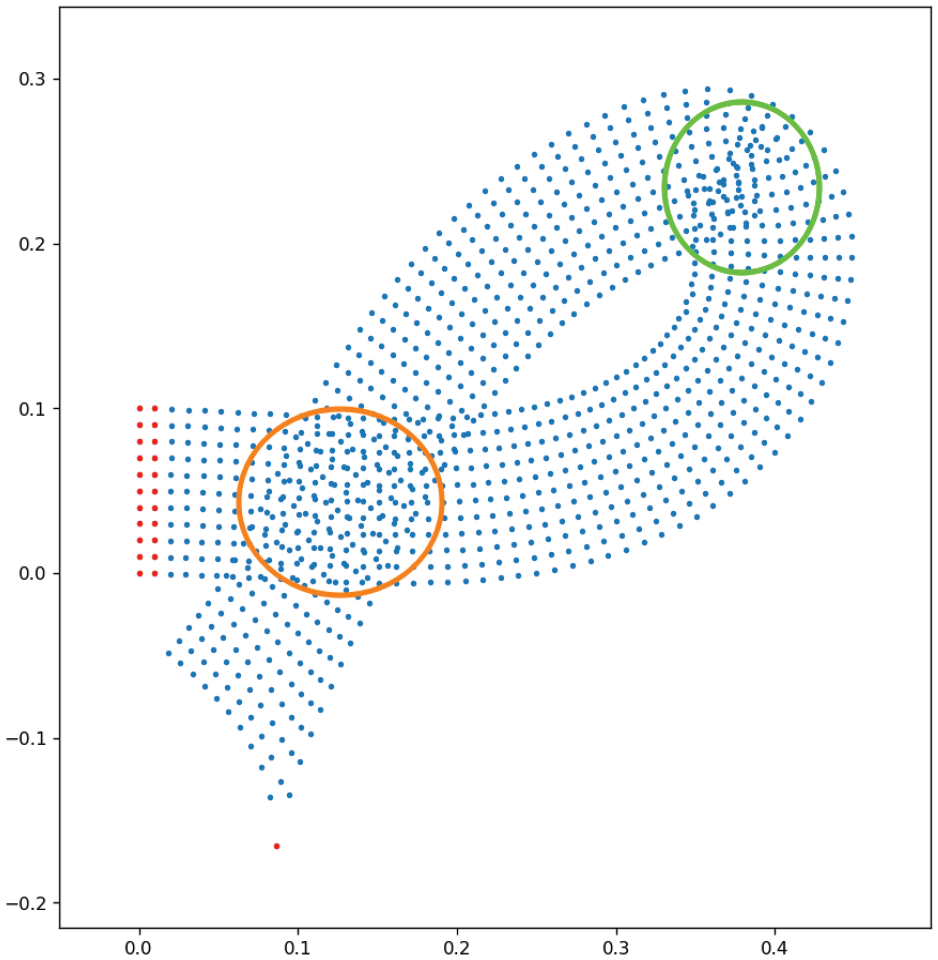
In this image, we have a beam-shaped swarm whose left leaders are fixed, meanwhile the right leader is made to turn counterclockwise. The orange circle highlights the auto-interpenetration problem (non-interacting points’ regions that overlap), while the green circle highlights the superposition problem (interacting points in a region that overlap).
Accordingly, a number of beam-shaped swarms have been defined, each representing a specific beam of the pantograph sheet. It should be noted that the aforementioned beam-shaped swarms do not interact with one another. In order to facilitate interaction between the aforementioned entities, we have defined a concept termed "pivots." Pivots are defined as pairs of points from disparate swarms that engage in interaction. The interaction law between points is constant; therefore, the observed behaviour is a consequence of the structure itself, rather than the interaction law. The interaction between swarm is limited to the interaction between the pivot points. Please refer to Figure 5 for details.
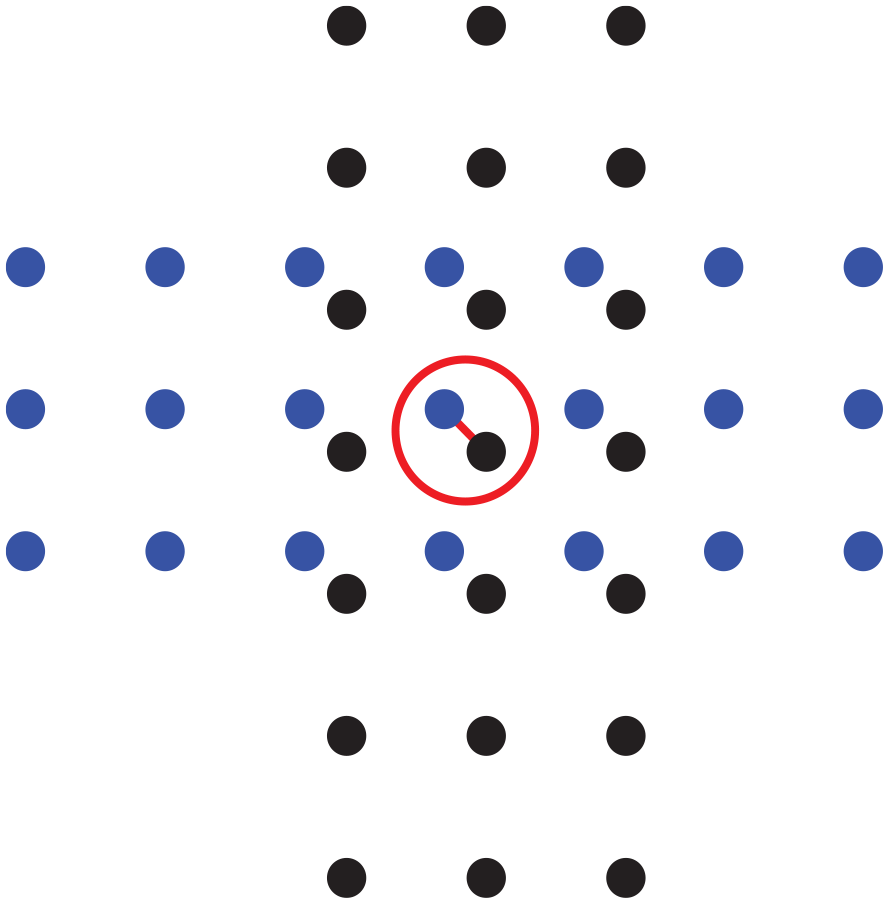
In this figure, we show two beam-shaped swarms (in blue and in black), note that they are slightly staggered just to make the picture more clear, and in the red circumference, we highlighted the two points of the different swarms that interact forming the pivot of these two swarms, so they are linked. If we do not consider the pivot, black and blue points do not interact with each other.
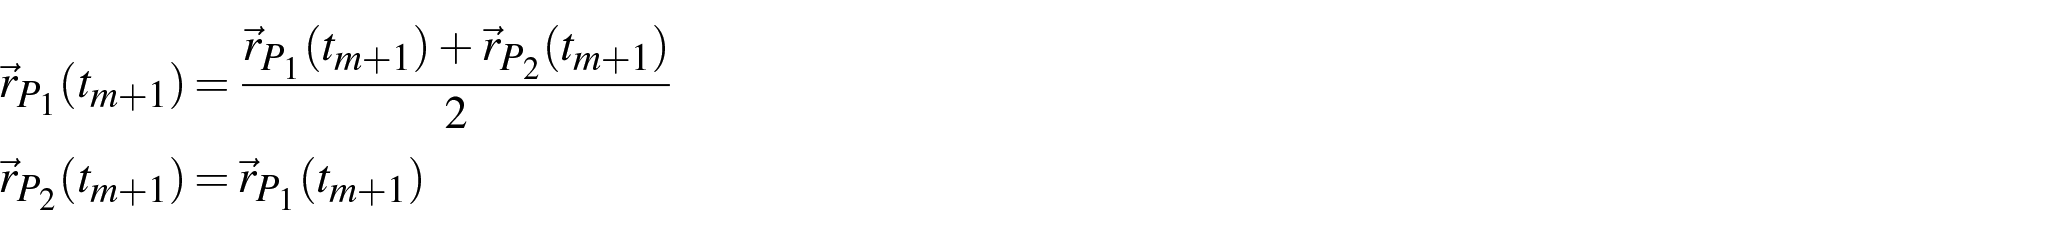
The interaction of the two points that constitute the pivots is just to put them in their middle point after the evaluation of their updated positions, so if we have a pivot composed of the couple

and then, in a programmer’s way,
This methodology has yielded a macro-swarm comprising interacting swarms via pivots.
It is important to note that the pivots we have defined do not offer any resistance to rotation. Consequently, the interaction between the pivot points does not involve any information on the orientation of the swarms. However, we are currently investigating this interaction and will present our findings in future articles. This implies that in contrast to the models proposed by dell’isola et al. [23,32,33], the pivots do not act as torsion springs in this instance. A preliminary approximation of a pantographic plate is being simulated in order to obtain qualitative results, with a view to determining whether the model is able to reproduce the main material characteristics and to introducing new model features. Nevertheless, we will demonstrate that our model is capable of simulating this type of material. It is important to note that near-perfect pivots (i.e., pivots without stiffness) in pantographic structures represent a significant aspect of pantographic studies and a challenge for research [34–38]. To simulate a real pantographic structure and conduct a quantitative comparison with laboratory tests, it is essential to implement this aspect.
As told, this pivot definition can be easily generalized by considering not just two points but two sets of points belonging to the two beam-shaped swarm or different kinds of interaction. The argument can then be enriched with many other properties and the pivot contribution can be more complex.
Also, it is possible to change the number of points per section of each beam. In this way, it is possible to obtain beams with different resistance to bending, breaking, and on the weight that the pivots have, which remain single points along the beam. It is also possible to change the number of pivots at will, as we will see in the following sections.
The beam-shaped swarms do not have any mechanism that makes them inextensible beyond the defined interactions between points.
An example of pantograph-swarm that we use in this paper is shown in Figure 6. This swarm is composed of 22 beam-shaped swarms with section of 3 points and 67 pivots.
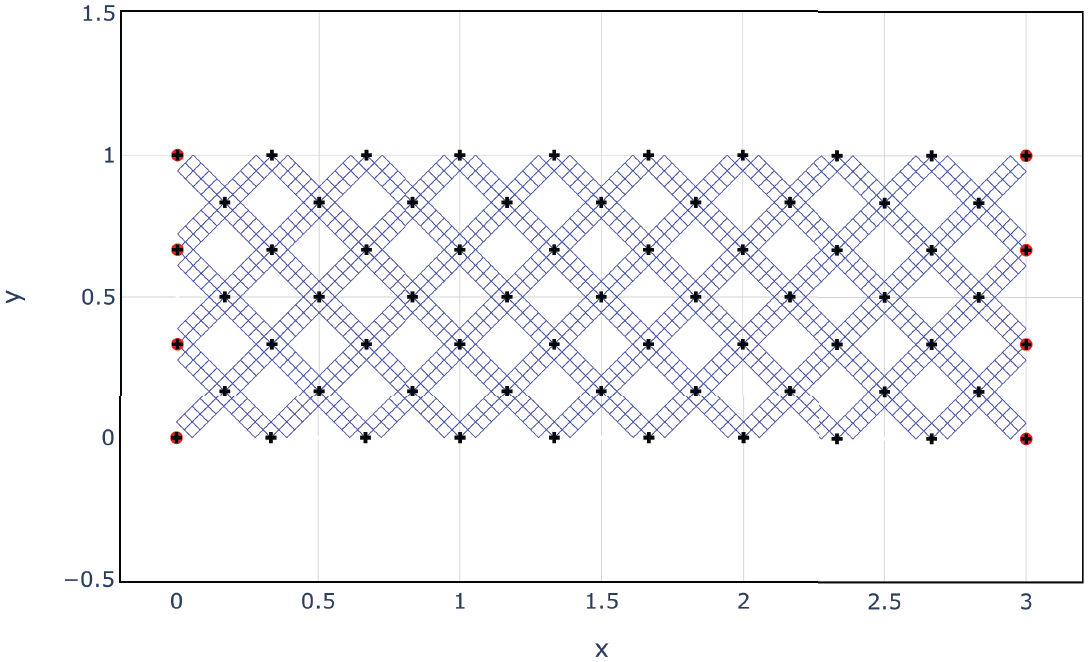
Image of the pantograph-swarm in the reference configuration
4. Method used and parameters exploration
Because we still have to fully understand the link between our model’s parameters and the physical parameters, in order to simulate the pantographic sheet, in addition to recreate the pantograph’s structure, we have to get the parameters
We remark that the choice between interaction A and interaction B and the number of involved neighborhoods is driven by the concept of first- and second-gradient deformation implemented in our model. This is because the second-gradient deformation is a really important topic linked with microstuctured materials and generalized continua as seen by [39], Abdoul-Anziz and Seppecher [40], Berezovski et al. [41], Eremeyev et al. [42], Shekarchizadeh et al. [4], Carcaterra et al. [43], Muehlich et al. [44], De Angelo et al. [45], and Shekarchizadeh et al. [46], furthermore it agrees with the idea to use a higher displacement gradients to describe a pantograph structure as expressed by Alibert et al. [47], Shekarchizadeh et al. [4], De Angelo et al. [45], and dell’isola et al. [23]. In particular, we use interaction A on the first neighbors to simulate a first-gradient deformations and interaction A on first and second neighbors and/or interaction B on first neighbors to simulate second-gradient deformations: we can add other interactions if needed; as indicated in brief in the following scheme:
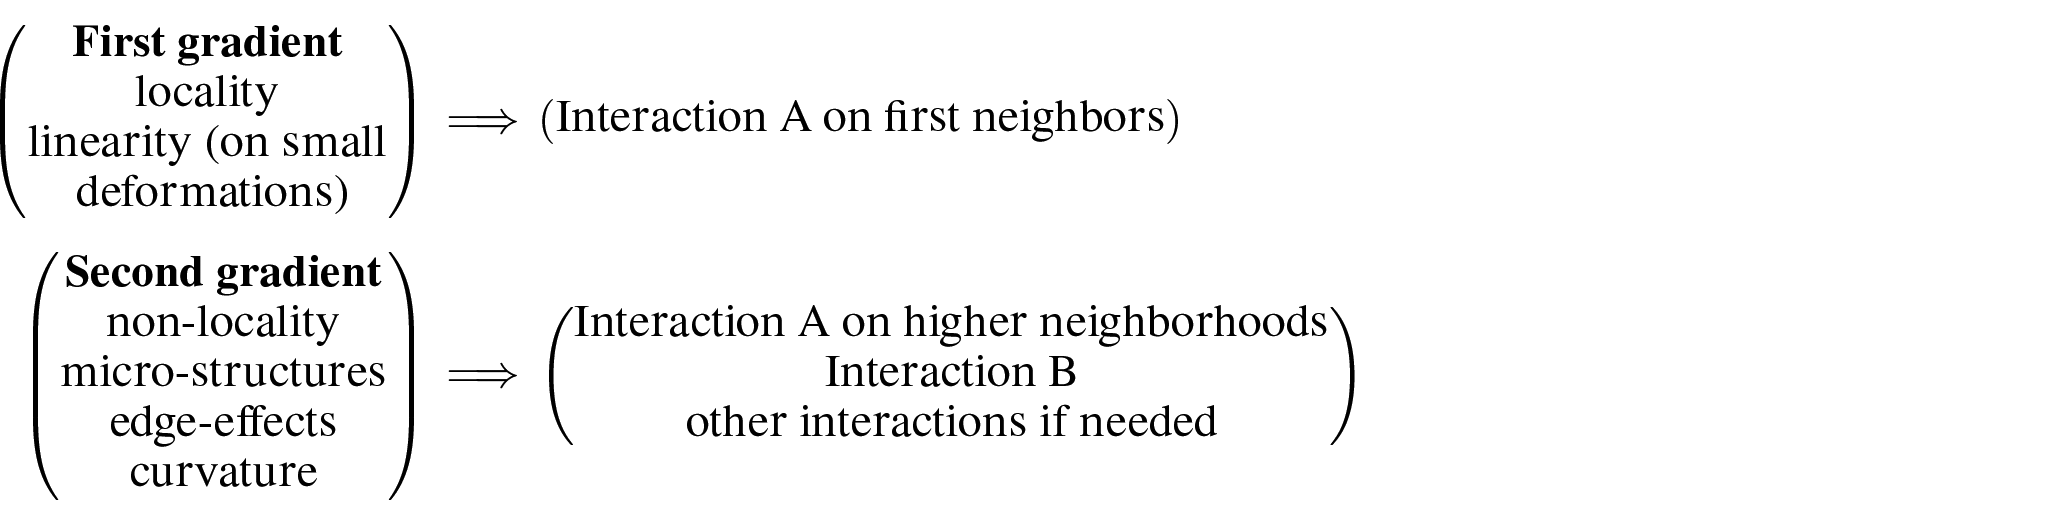
Note that because the swarms we use have a large density of points even in large deformations the variation of the distance between first neighbors is usually small, so we consider only a linear interaction in this work for first-gradient deformations. Furthermore, it is the gathering of interactions that on a macro-scale leads to what we can recognize as first- or second-gradient deformations and because the link between our parameters, and the physics parameters is not well understood yet as mentioned before, we are trying to keep it simple.
In Dell’Erba et al.’s study [3], we tried to use interaction A and interaction B both only on first neighbors to simulate a second-gradient deformation, we noted that the interaction B has a contribution to the curvature and the Poisson effect of the swarm, but it alone is insufficient to describe a secondgradient deformation for some kind of deformations. We are working on other interactions useful to get second-gradient deformations and will present soon in further research. For the sake of simplicity, in this paper, we do not distinguish among vertical, horizontal, and diagonal links as done by Dell’Erba et al. [3], so the parameters to explore are only
as done in D’Avanzo et al. D’Avanzo et al. [1,2].
So in the next section, we explore the parameters’ effects on the equilibrium configuration of the pantograph-swarm. Beyond the parameters
5. Results
In this section, we show all the simulations done in order to explore the behavior of the pantograph-swarm per different parameters. All these simulations done are summarized in Table 2.
In this table are listed the simulations done in order to explore the parameters’ influence on the final configurations.
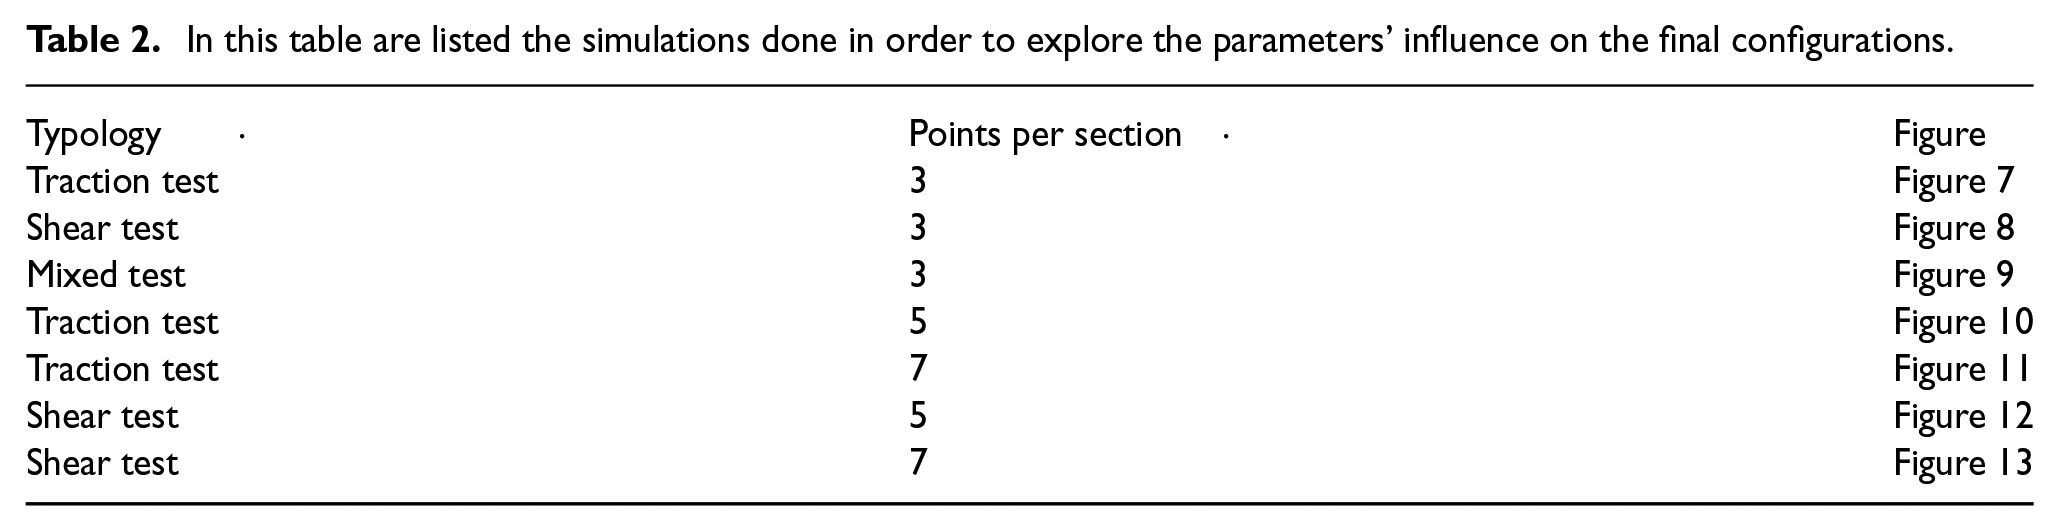
The pantograph-swarm used in simulation with 3 points per section is shown in Figure 6, instead for simulations with 5 or 7 points per section is used a swarm with the same structure (i.e. the same number of beams and pivots) but different number of points per section.
5.1. Traction test
We performed a traction test with an elongation of about
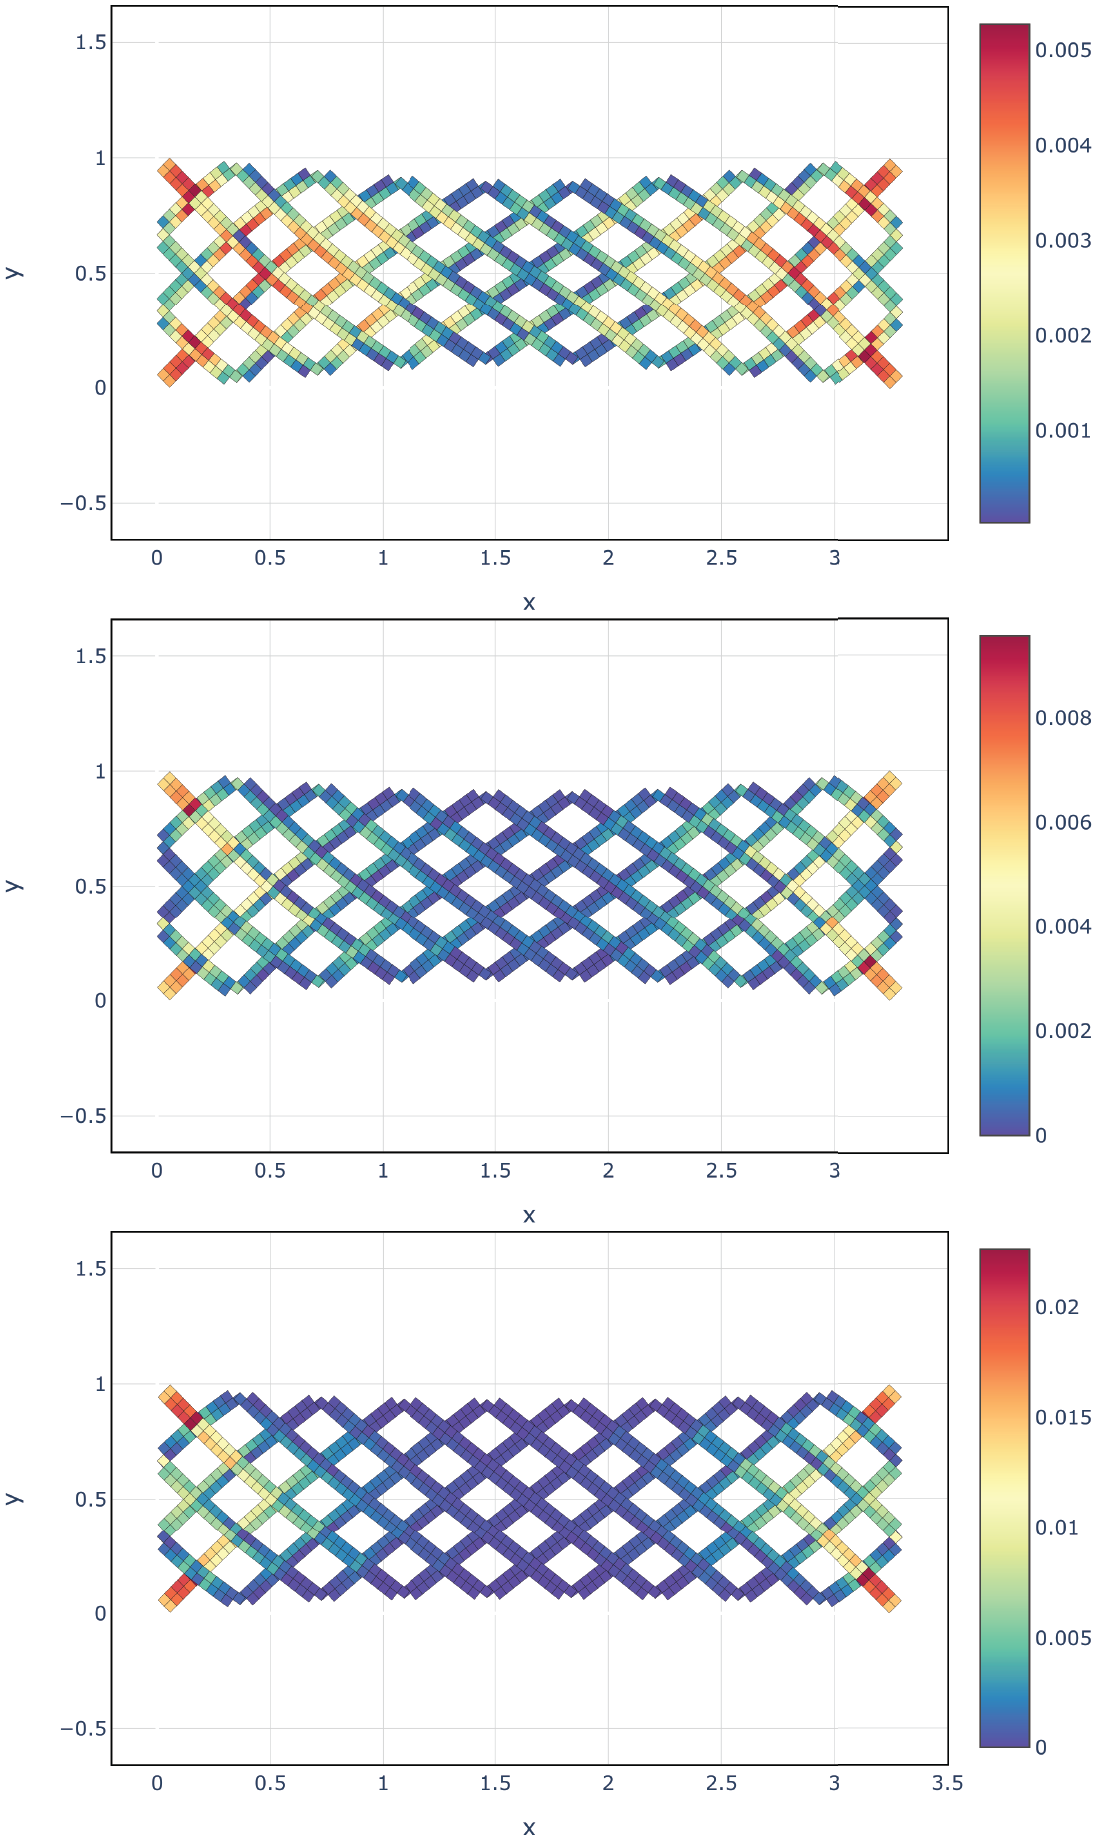
Image of the pantograph-swarm in traction test. On top with only interaction A on first neighbors, in the middle interaction A on first and second neighbors, on the bottom interaction A and interaction B on first neighbors. The values are obtained with equation 6.
5.2. Shear test
We performed a shear test where the leaders of the right side are translated upwards by an amount equal to the height of the swarm. The results are in Figure 8. We noted that there is also here a strong change in color distribution between the simulation considered in the first and second gradient. In this case, similar considerations can be made with respect to tensile test, but the differences in the individual beams are significant, especially for the second gradient with the interaction B, where the beam-shaped swarms are straighter (i.e. the effect of the interaction B is precisely to modulate the curvature of the swarm as shown in Dell’Erba et al. [3]). Depending on the shear direction, the deformation of the two-beam families is very different. In this case, since the shear is upwards, the right-angled family of beams is hardly affected, it simply shifts.
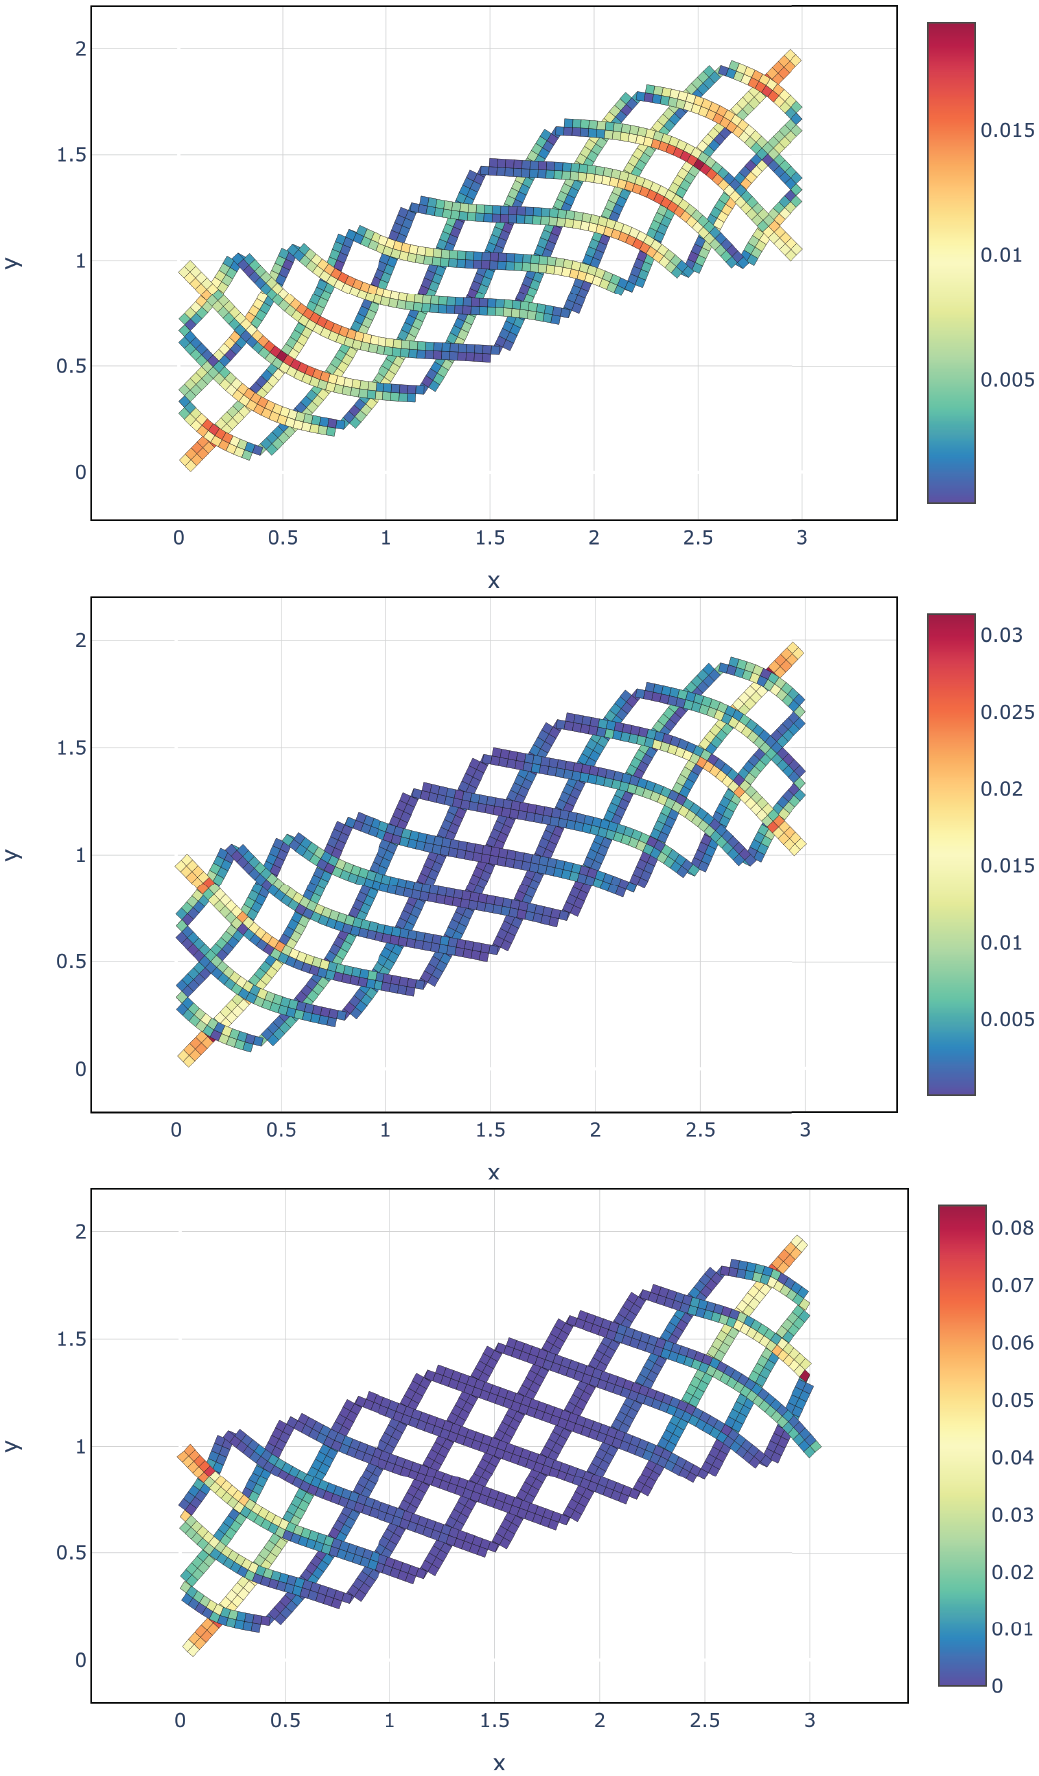
Image of the pantograph-swarm in shear test. On top with only interaction A on first neighbors, in the middle interaction A on first and second neighbors, on the bottom interaction A and interaction B on first neighbors. The values are obtained with equation 6.
5.3. Mixed test
We also performed mixed tests, where we combined the two precedent tests. The results are in Figure 9. The specimen subjected to both tension and shear shows mixed behavior, as if the effects overlap. It shows both characteristics of the previous ones, but more pronounced (i.e. the effect of the interaction B is also well visible).
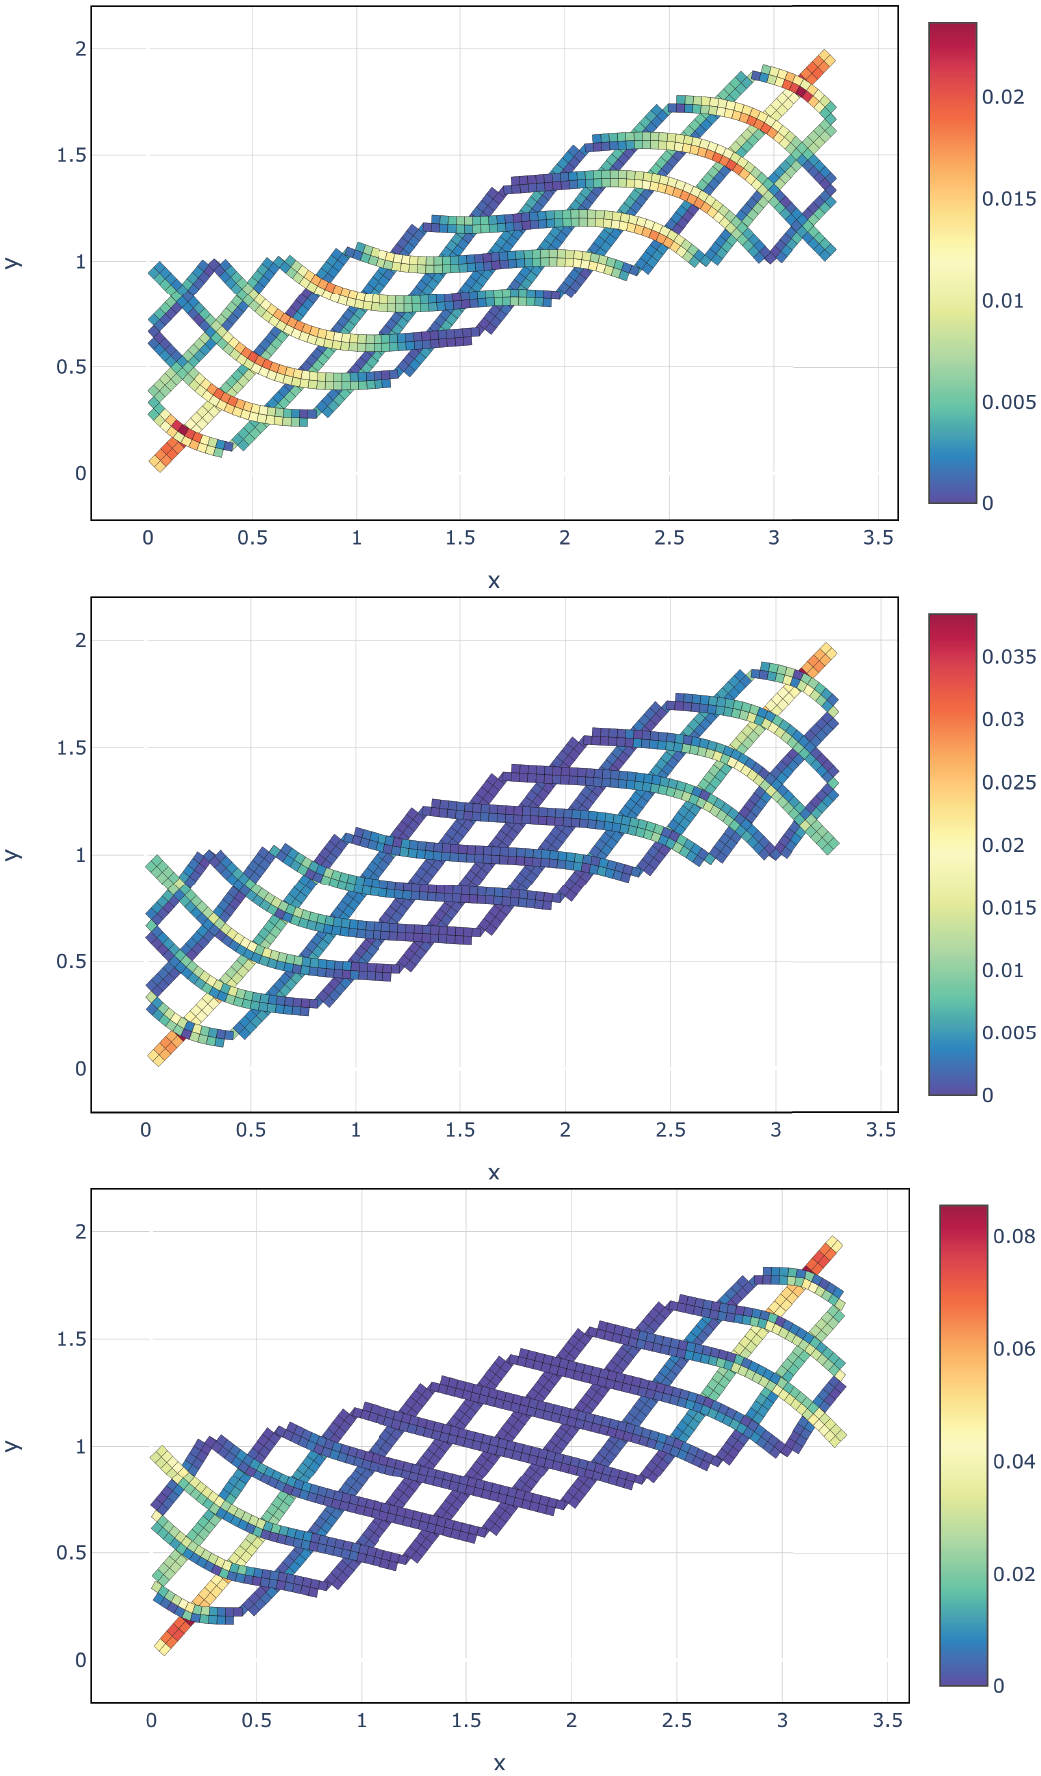
Image of the pantograph-swarm in mixed test. On top with only interaction A on first neighbors, in the middle interaction A on first and second neighbors, on the bottom interaction A and interaction B on first neighbors. The values are obtained with equation 6.
5.4. The number of points
If we consider the number of points in the section of the beam-shaped swarm as a parameter, it effectively influences the final configuration of the global swarm. So in this section, we show some of the simulations done in the previous subsections with a different number of points in the section. In Figures 10 and 11, we show the traction tests with respectively 5 and 7 points per section. Instead, in Figures 12 and 13, we show the shear tests with respectively 5 and 7 points per section.
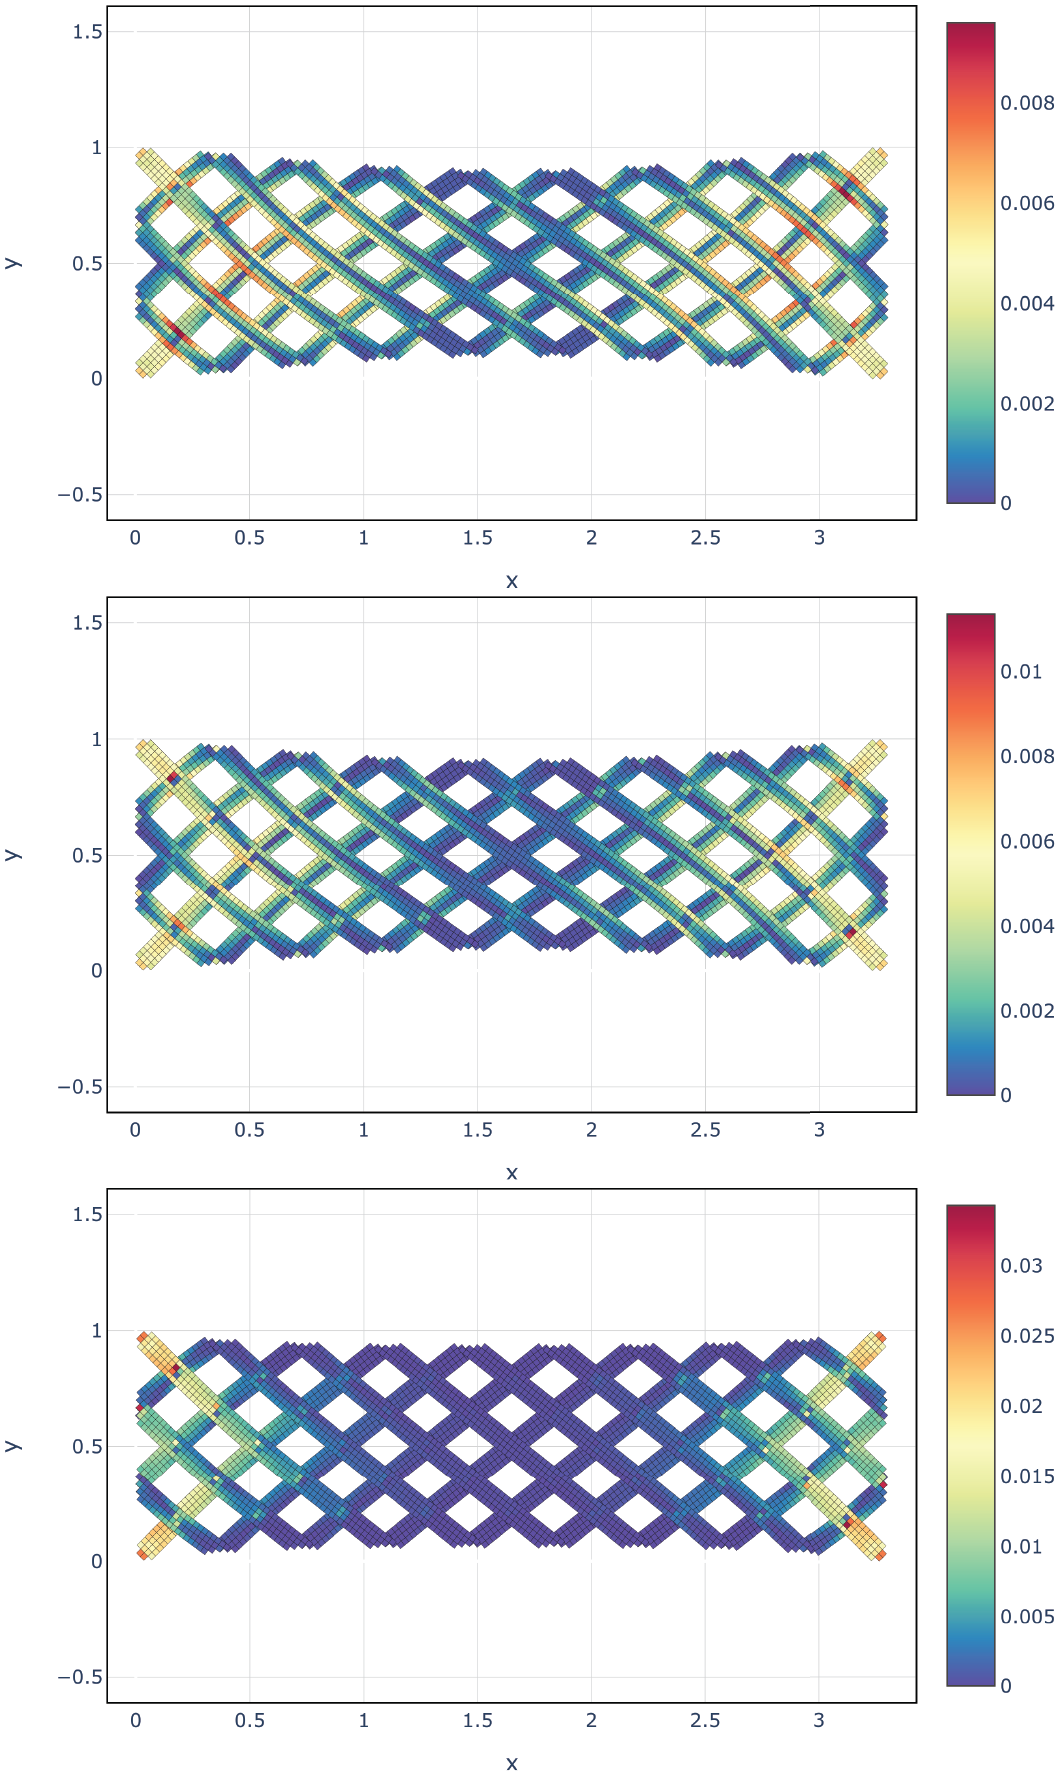
Image of the pantograph-swarm with 5 points in the section of the beam-shaped swarms in traction test. On top with only interaction A on first neighbors, in the middle interaction A on first and second neighbors, on the bottom interaction A and interaction B on first neighbors. The values are obtained with equation 6.
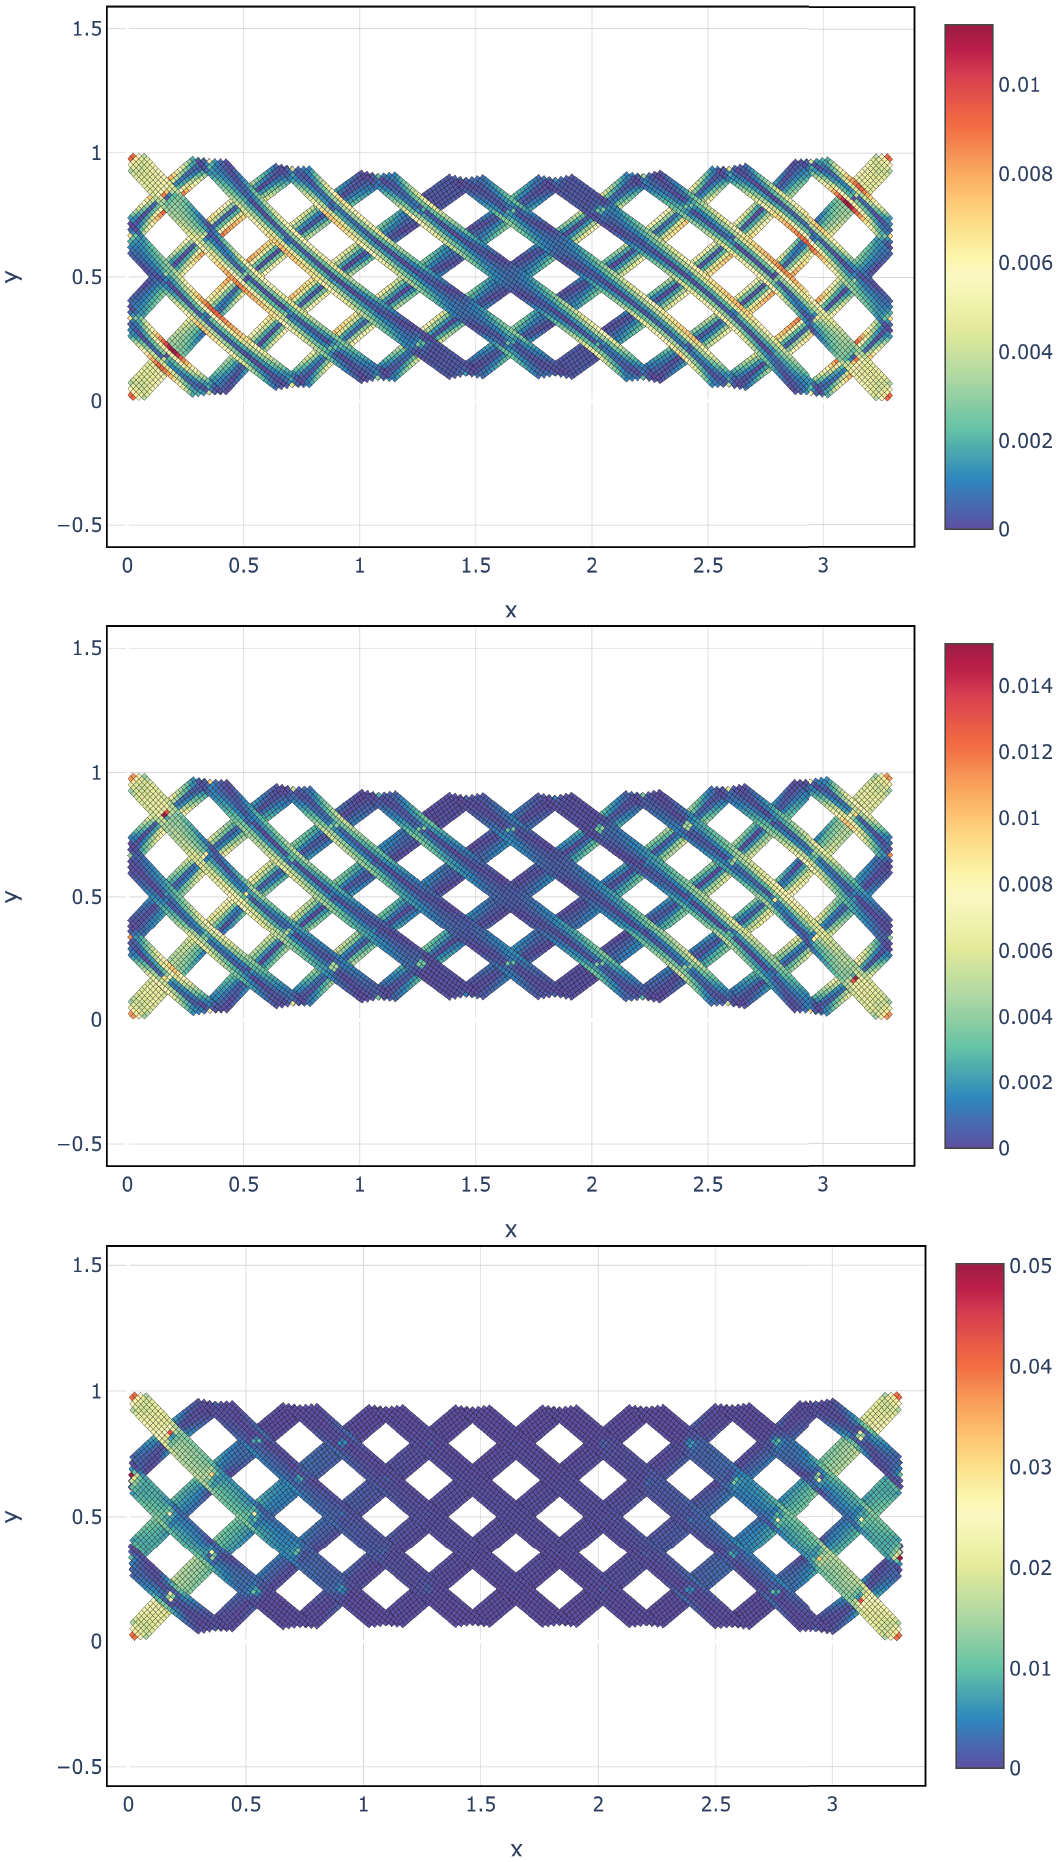
Image of the pantograph-swarm with 7 points in the section of the beam-shaped swarms in traction test. On top with only interaction A on first neighbors, in the middle interaction A on first and second neighbors, on the bottom interaction A and interaction B on first neighbors. The values are obtained with equation 6.
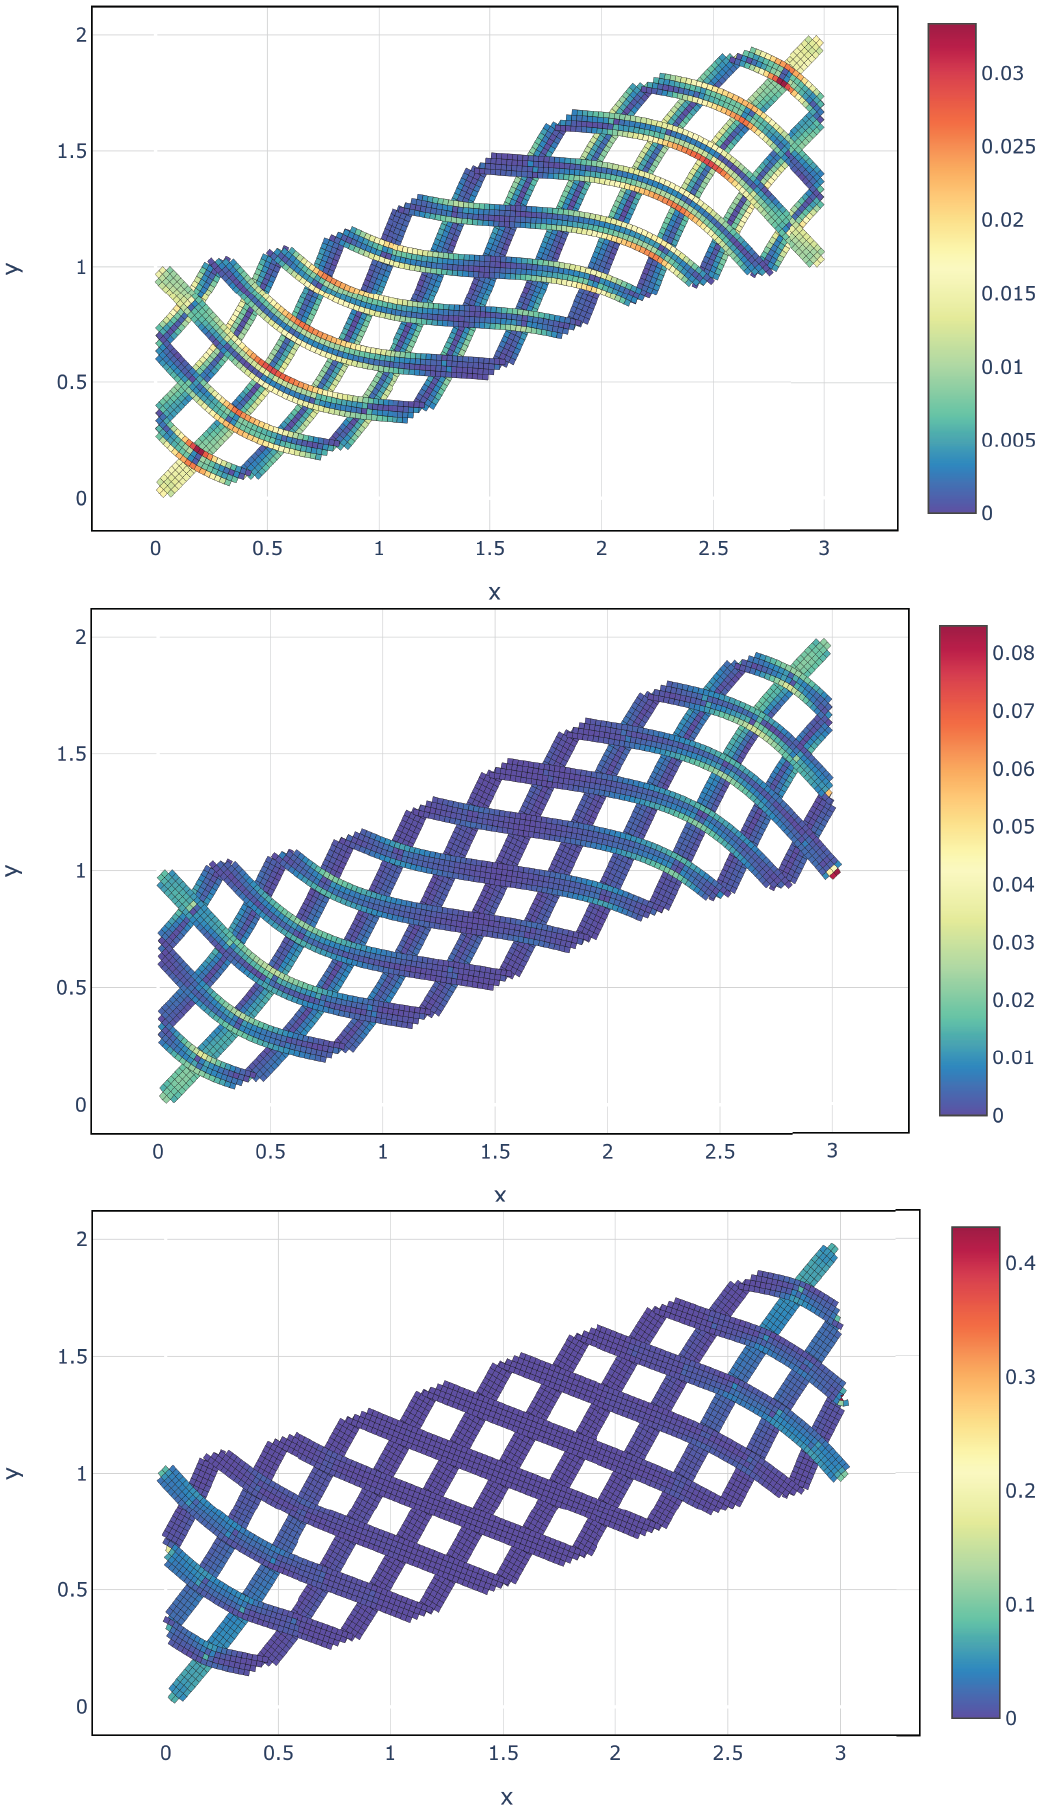
Image of the pantograph-swarm with 5 points in the section of the beam-shaped swarms in shear test. On top with only interaction A on first neighbors, in the middle interaction A on first and second neighbors, on the bottom interaction A and interaction B on first neighbors. The values are obtained with equation 6.
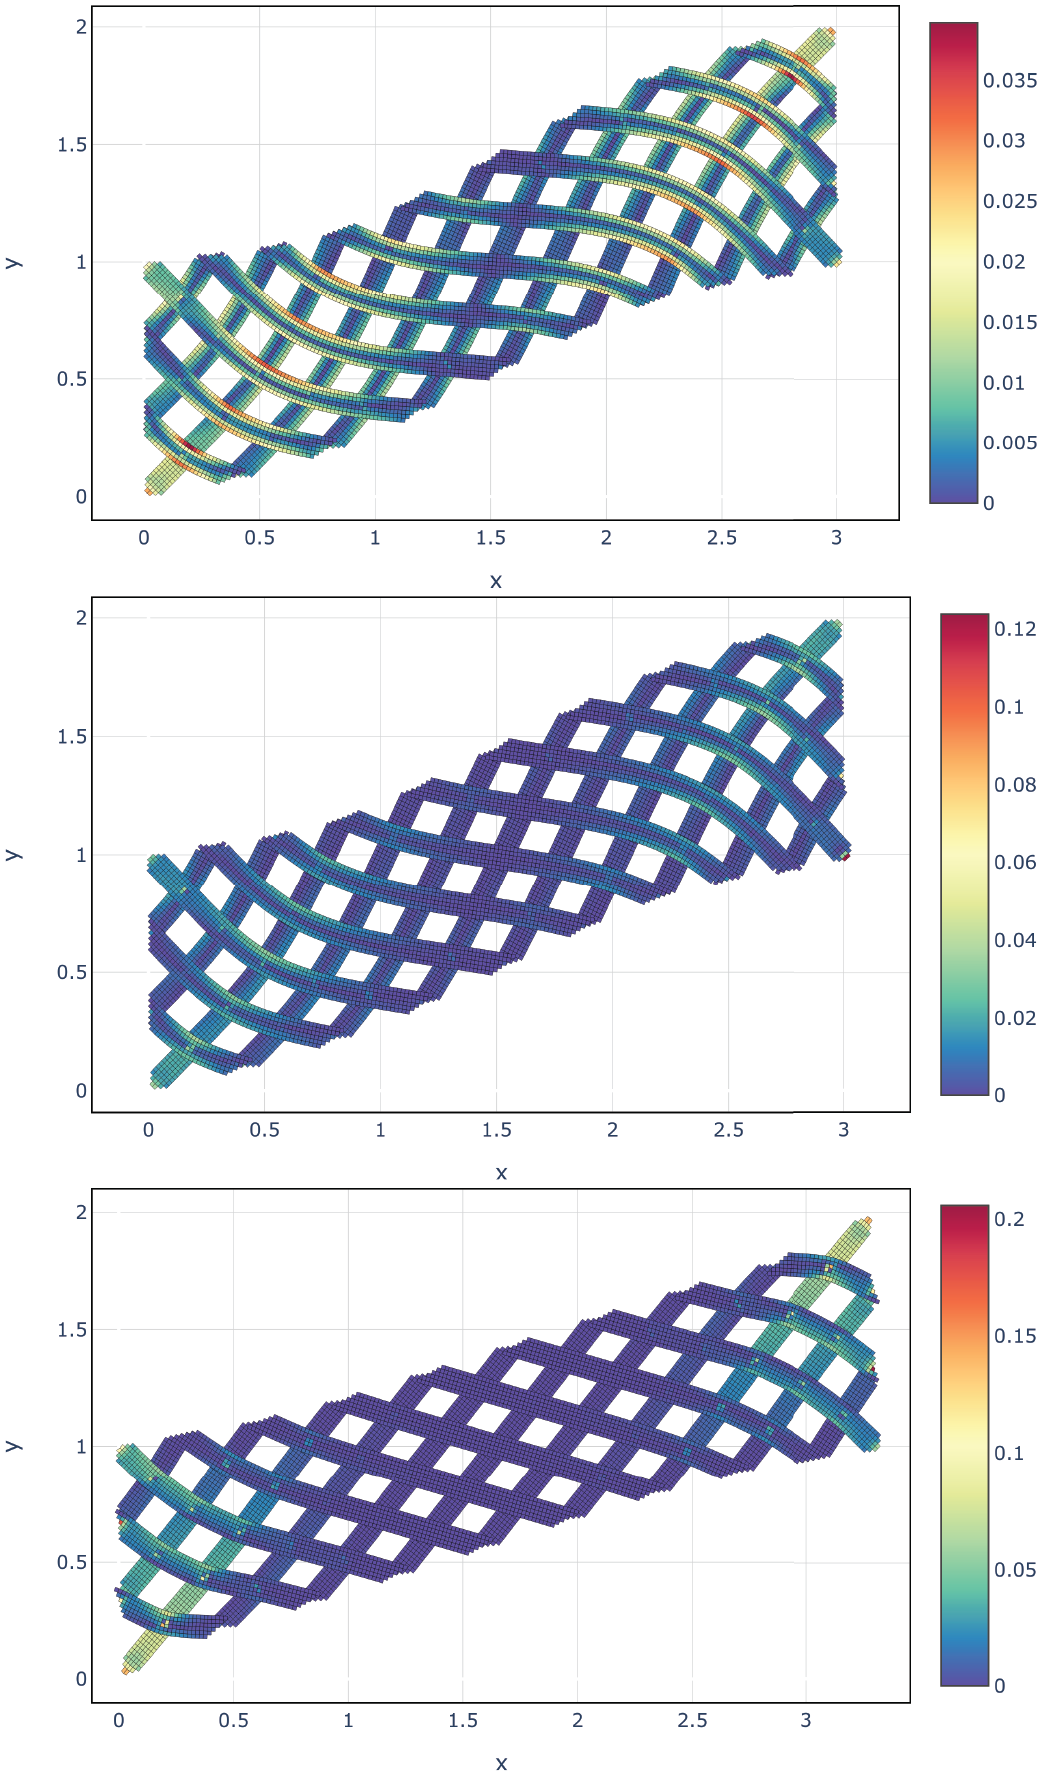
Image of the pantograph-swarm with 7 points in the section of the beam-shaped swarms in shear test. On top with only interaction A on first neighbors, in the middle interaction A on first and second neighbors, on the bottom interaction A and interaction B on first neighbors. The values are obtained with equation 6.
We noted that the interactions have a greater impact on the color distributions and on the final configurations. These simulations are shown only to qualitatively understand the impact of this parameter on the global swarm. In the follow, we will return to use three points per section for a limit of our GPU.
6. Comparisons
In this section, we show the simulation obtained with our model and the comparison between our simulation and the one in the paper [23]. For this reason, we tried to reproduce those tests in order to get more meaningful comparisons.
In order to check if our model can simulate a pantographic structure, we will explore the effects of each interaction on the global deformation and then we will compare our results with the results obtained with finite elements packages of COMSOL Multiphysics shown by dell’isola et al. [23], in particular, we are referring to the global shape and the strain energy distributions obtained in the traction test (Figure 7(b) by dell’isola et al. [23]) and shear tests (Figure 8 in dell’isola et al. [23]). Note, we will compare the color distributions in our model (that represents the relative variation in area of the cells of the swarm) with the strain energy distributions, this is because in our model, we do not have the concept of energy, but the relative variation in area of the cell is a quantity that we can (in analogy with the continuum mechanics physics) link with the energy distribution, as written by D’Avanzo et al. [1].
Because in dell’isola et al.’s study [23], a more thick pantograph sheet is used, we also used a different and thicker pantograph-swarm with the same ratio (1 : 3) shown in Figure 14. This swarm is composed of 46 beam-shaped swarms with section of 3 points and 241 pivots. Note that in dell’isola et al.’s study [23], they tried to simulate a slightly thicker pantograph sheet, but our GPU used has a limit on the number of points in the swarm, to pass this limit, we have to add a change in the CUDA script that we will introduce in a further paper. For this reason, our swarm is a bit smaller and so some deformations are less pronounced.
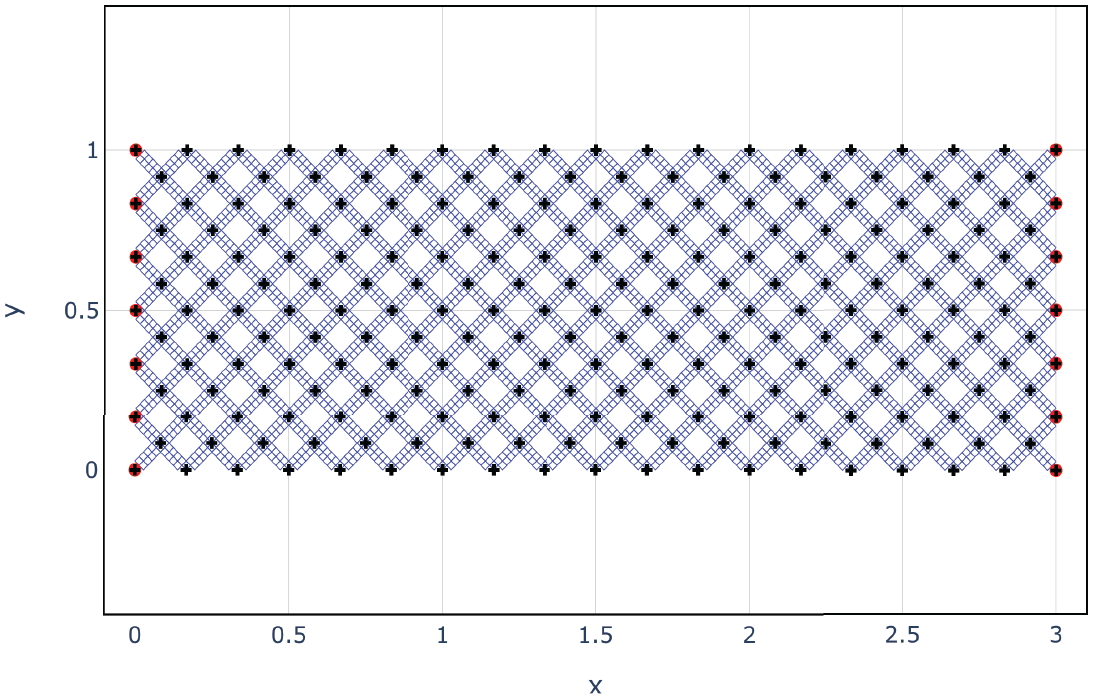
Image of the pantograph-swarm in the reference configuration C0, to make more clear the distinction among the beamshaped swarms we colored the link between the first neighbors in blue. The black dot are the pivot meanwhile the red we highlighted are the leaders (they are also pivots). This swarm is composed of 46 beam-shaped swarms with section of 3 points and 241 pivots.
In the last section, we have shown how the pantograph-swarm changes with the interactions used, instead to performing the comparisons shown in this section, we used only the interaction A on first neighbors, this because it already gives good results and because to use the other interactions we should have used long heuristic research of the best parameters. This is the simplest approach to the problem, and we are sure that this interaction works well as shown by Dell’Erba et al. [3], especially in shear tests that are useful here (i.e. also in the traction tests the beam-shaped swarms go under shear deformations).
It will be interesting to explore the other interactions in a quantitative comparison, and it could be really interesting to explore which parameters and interactions we need to use for a swarm with a centered square structure (i.e., not divided into beams, without reconstructing the pantograph structure) to simulate a pantographic sheet; therefore, in this way, we can avoid reconstructing the micro-structure and so we can handle in a better way the scale of the sample, similarly to what is done by De Angelo et al. [45], Shekarchizadeh et al. [46], and Abali [48].
6.1. Traction test
In the paper, dell’isola et al. [23] is shown a traction test with an elongation of about 28%: in order to reproduce this test, we fixed the left leaders and moved the right leader along the
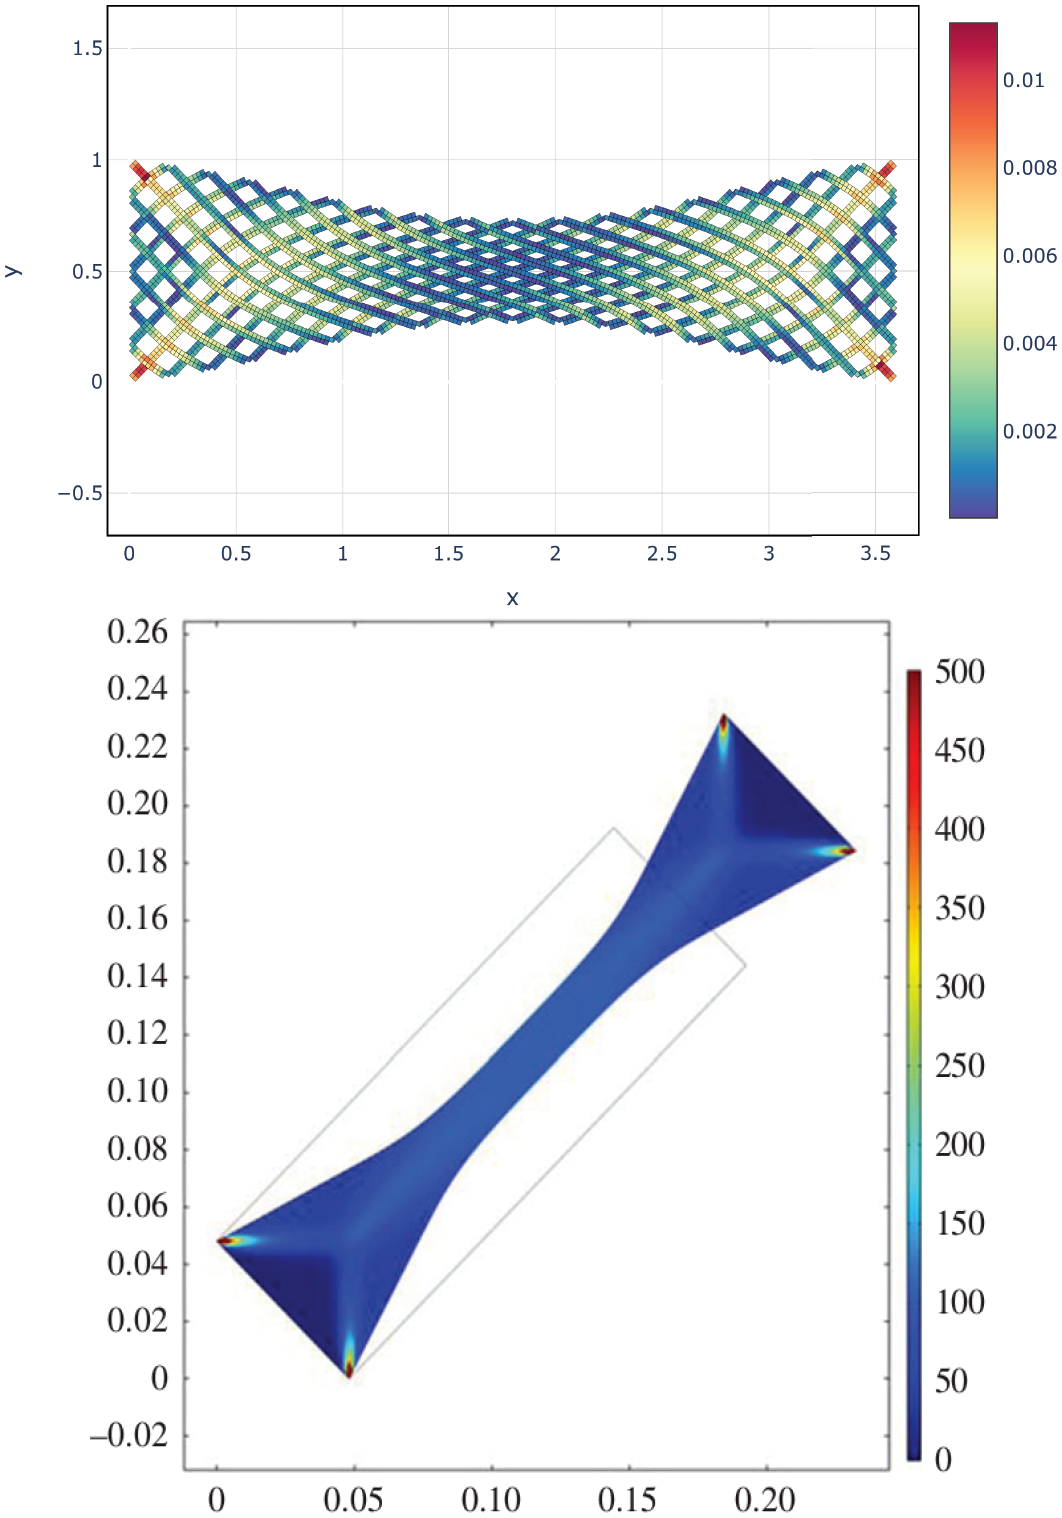
Comparison between the relative variation of cells’ area in module in our pantograph swarm and the strain energy distribution obtained by dell’isola et al. [23].
6.2. Shear tests
In the paper, dell’isola et al. [23] are shown three shear tests that shifted one side of the pantograph about 1, 1.5, and 2 times the height of the sample. We reproduced the same simulations and the results are in Figures 16–18.
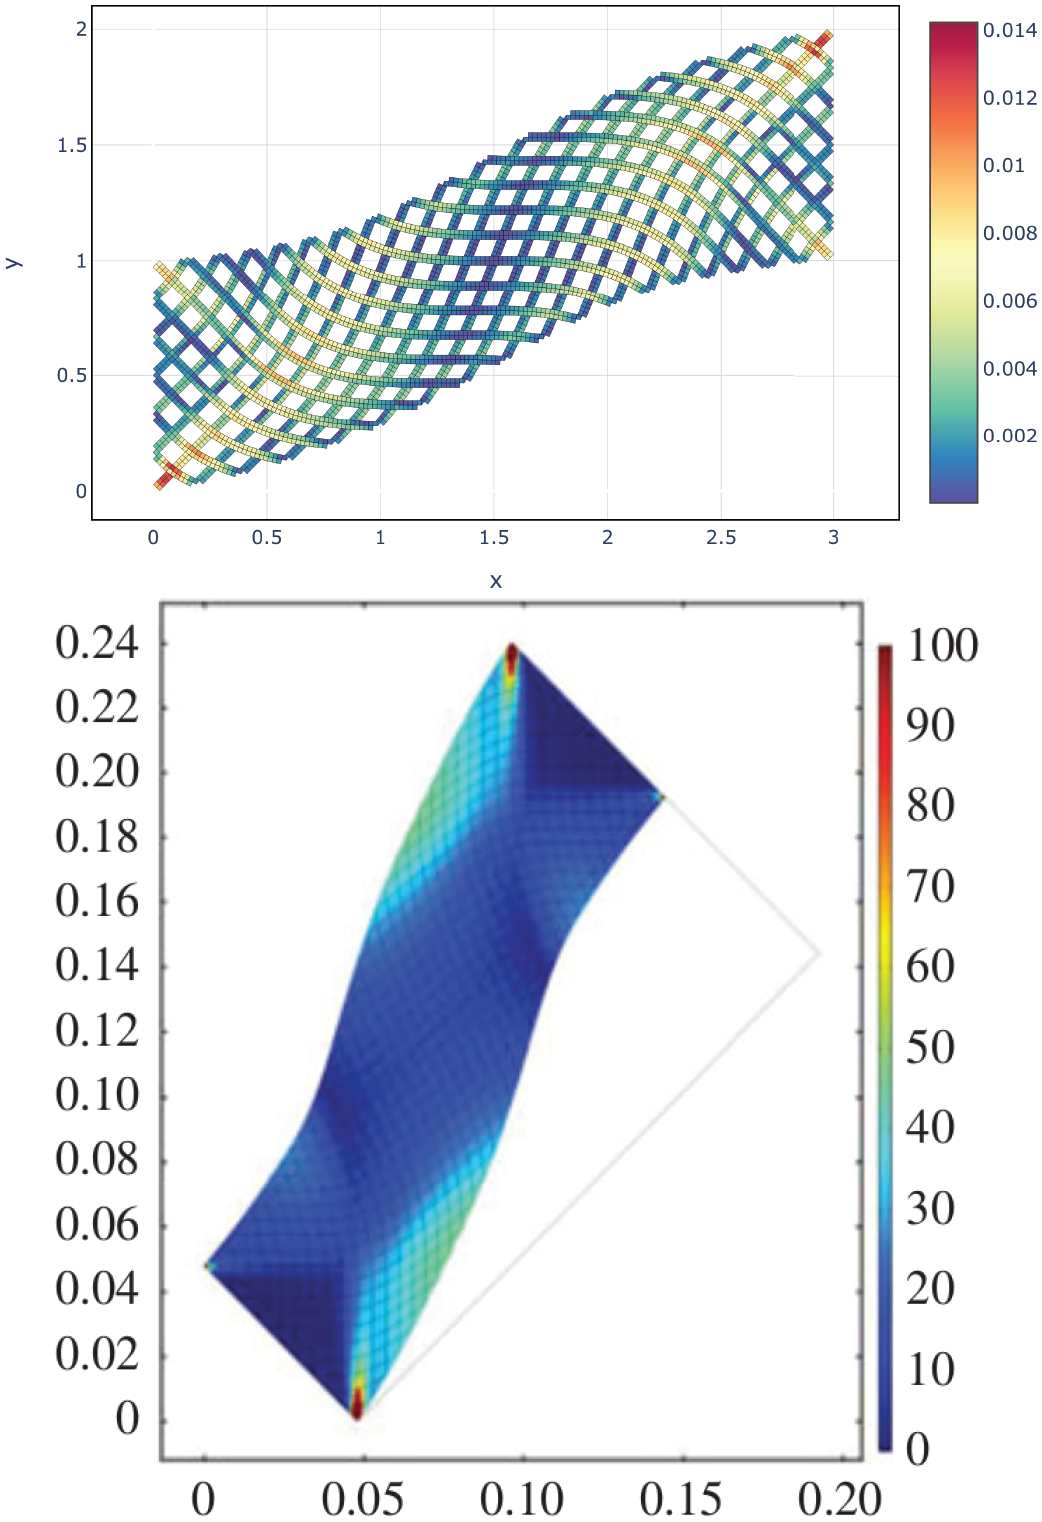
Comparison between the relative variation of cells’ area in module in our pantograph swarm and the strain energy distribution obtained in dell’isola et al. [23].
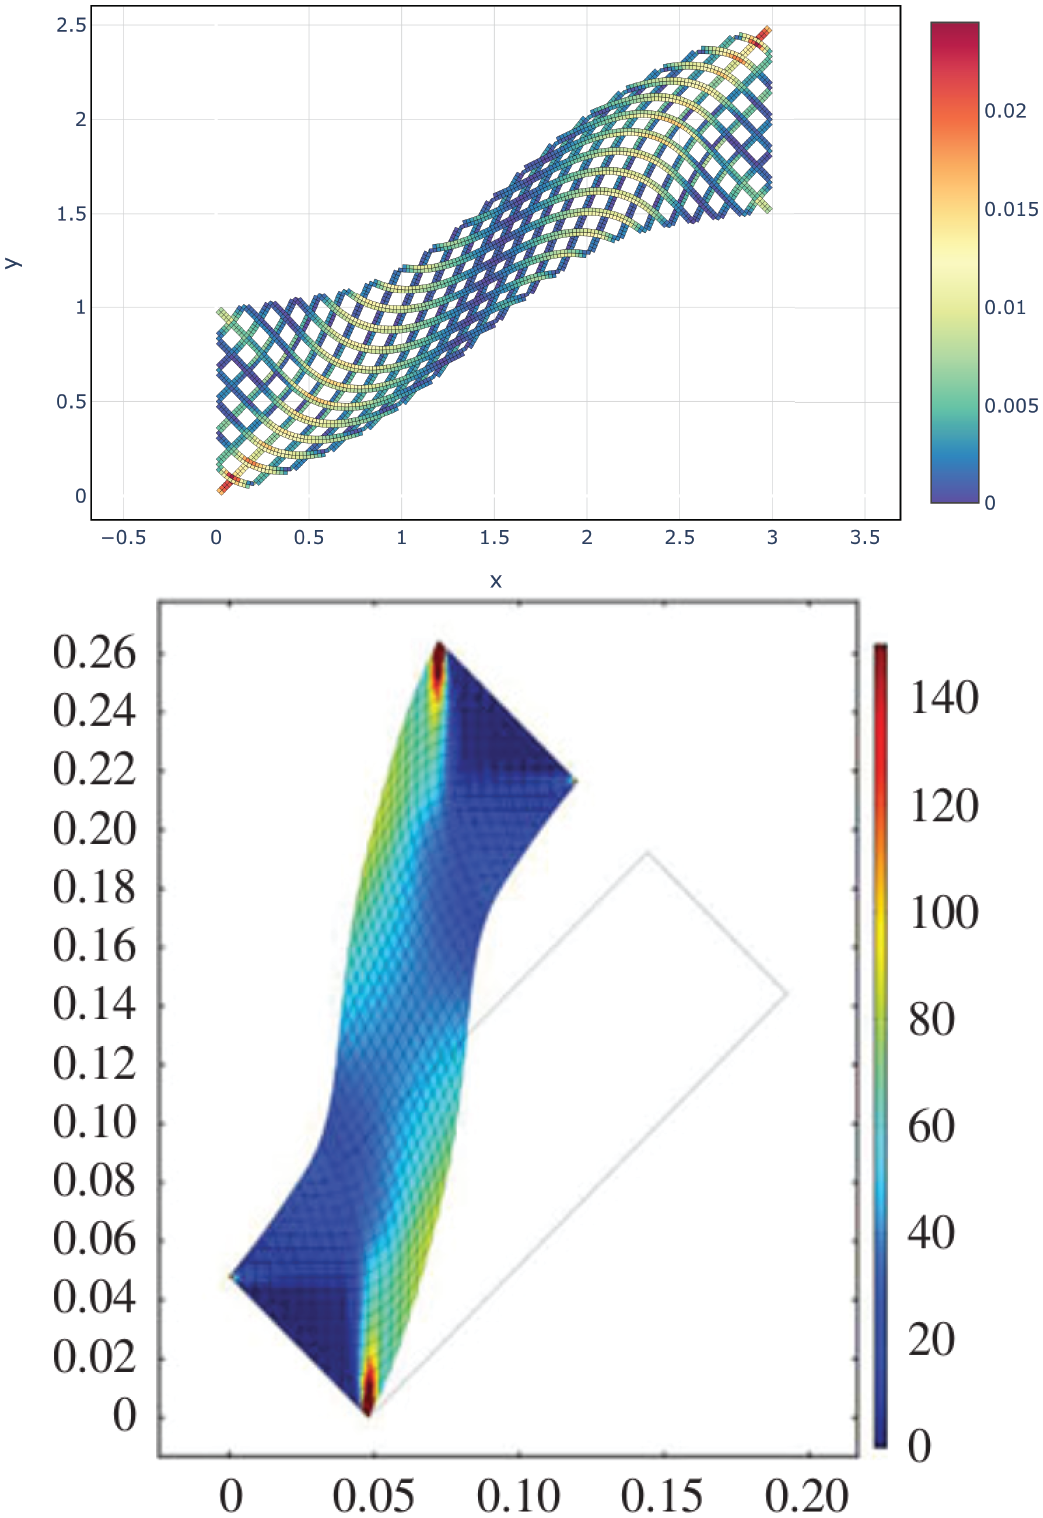
Comparison between the relative variation of cells’ area in module in our pantograph swarm and the strain energy distribution obtained in dell’isola et al. [23].
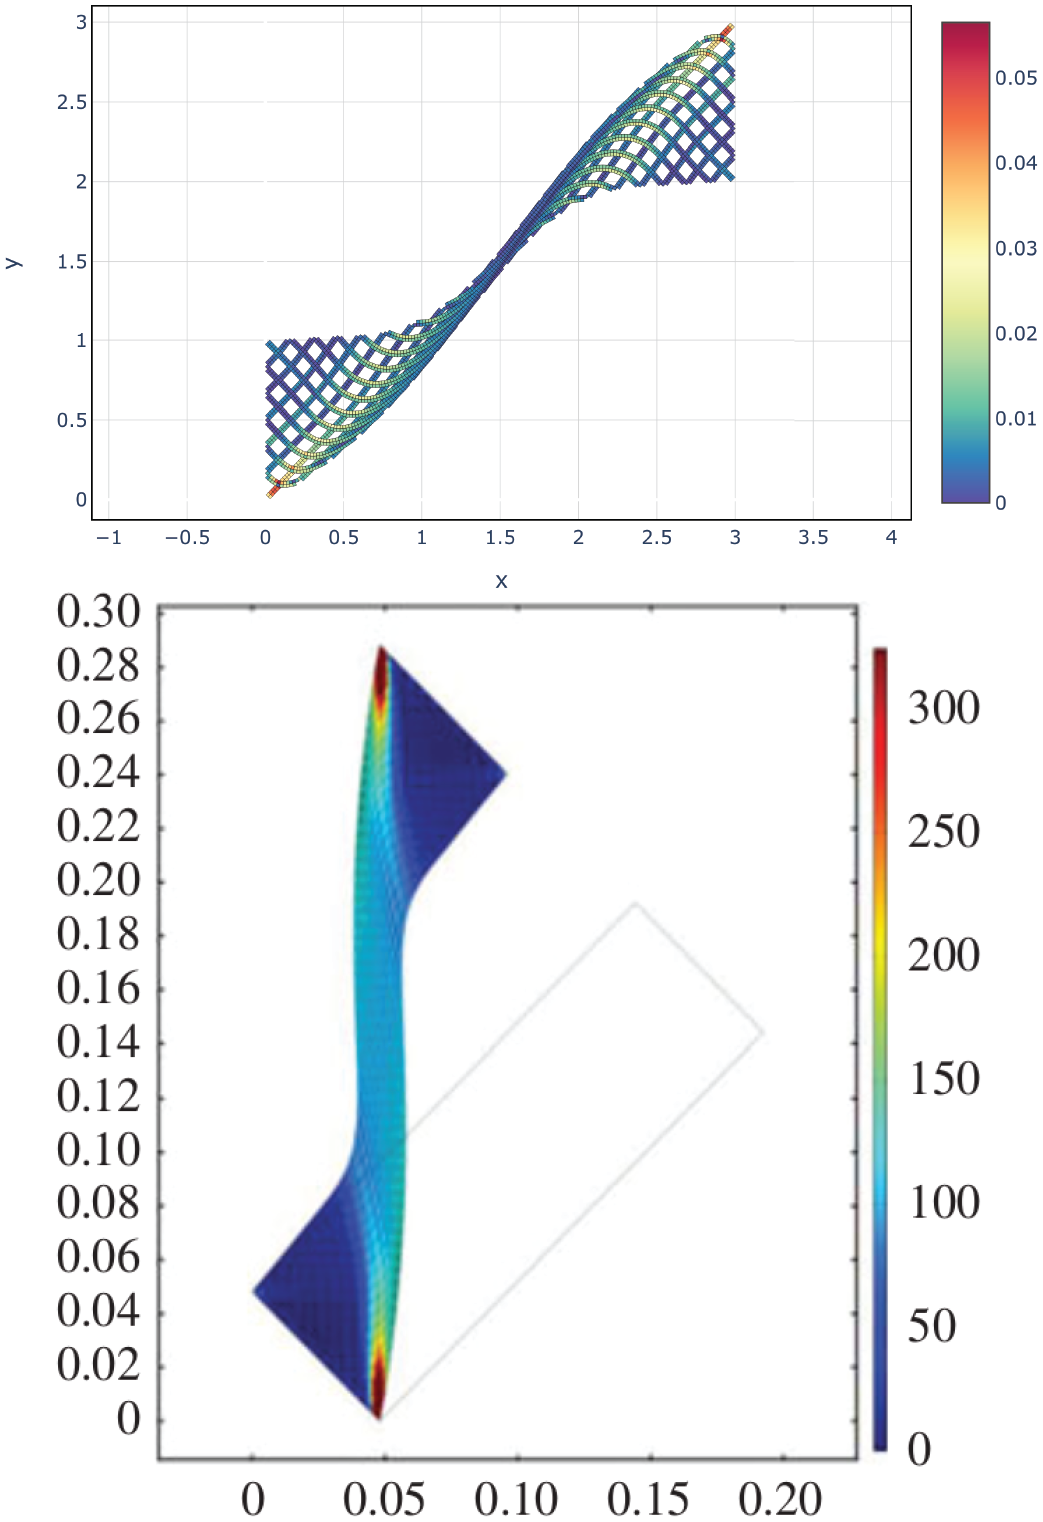
Comparison between the relative variation of cells’ area in module in our pantograph swarm and the strain energy distribution obtained in dell’isola et al. [23].
Also in these tests, our color distributions are similar to the strain energy distributions. We noted that in Figure 18, our central part of the swarm is thinner than the central part of the COMSOL’s sample, we supposed that this is due to the smaller dimension of our pantograph-swarm and the auto-interpenetration of the beam-shaped swarms. The color distributions in Figures 17 and 18 show some differences respect to the strain energy distribution, especially in the central part of the pantograph-swarm, we have to investigate more what is needed to explain these differences, if more interactions or a greater swarm.
7. Conclusion
A previously developed kinematic model was extended to pantographic structures, starting from the same base. This was achieved by enabling swarms of different points to interact through pivot modeling.
It has been shown that a purely kinematic approach can plausibly describe the deformations of a continuous material. In this approach, each beam is considered as a swarm of points, and specific rules are given for the treatment of pivots, that is, the set of points belonging to two intersecting beams. The outcomes of the predetermined deformations demonstrate a satisfactory plausibility of behaviour in the tensile, shear, and mixed cases that were studied.
Although certain characteristics, such as the torsional strength of the pivots, were not considered in this preliminary analysis, the model appears to be capable of qualitatively describing the deformation of a pantographic material and which areas of the sample should be related to higher deformation energy. Further quantitative investigations are required, particularly in the context of comparing the characteristics of different pantographs (e.g. varying points per section, number of pins, and other flocking rules).
The interaction between different swarms can be employed to represent materials with a microstructure or to simulate the collision or interaction of different materials. It is possible to obtain the same simulation of behaviour without explicitly replicating the microstructure, but instead by identifying the appropriate interaction. This issue will be addressed in the next stage of the research.
The field of continuum mechanics has identified pantographic structures as a significant area of research. Their distinctive mechanical characteristics, encompassing a high degree of deformation capability, distributed load transfer, nonlinearity, and adaptable anisotropic behaviour, render them invaluable for a multitude of applications. By furthering their comprehension of the fundamental mechanics and developing sophisticated modelling techniques, researchers can fully realise the potential of pantographs, thereby facilitating innovative solutions in domains such as robotics, the engineering of bio-inspired robots, metamaterials, and others.
The proposed tool is notable for its simplicity and flexibility. This enables the description of non-local interactions and deformation cases where Cauchy theory becomes computationally expensive.
The model can be further developed in numerous ways, including modifications to the type of lattice, flocking rules, and the manner in which first- and second-gradient interactions are performed. The tool is capable of reproducing a wide range of behaviours, including those associated with fractures.
As previously discussed, the model has certain weakness. One significant shortcoming is its lack of integration with the constituent parameters of the material, which are essential for understanding the underlying physics. Despite these limitations, the model offers promising potential and will be compared with real-world pantograph data in the near future.
8. Future developments
The model lends itself to many different developments. It is still at an embryonic stage and currently provides qualitative results that give us hope that the model can become quantitative (as discussed by Dell’Erba et al. [3]).
Possible improvements to the model that we are working on are:
The aim of the model is to become an adjunct and sometimes alternative tool to the finite-element method. There is still a lot of work to be done, but the current results look promising and encourage us to continue developing the algorithm.