
Abstract

245 Gender Differences in Hepatic Lipase Activity
Hepatic lipase (HL) is a lipolytic enzyme that hydrolyzes triglyceride and phospholipid in LDL and elevated HL activity is associated with small, dense and more atherogenic LDL particles. Elevated HL activity is associated with increasing age, male gender, high amounts of intraabdominal fat (IAF), and a hepatic lipase gene promoter polymorphism (-250 codon; GG genotype). We sought to investigate the mechanisms underlying the difference in HL activity between men and women.
Normal Caucasian men (n=19) and premenopausal women (n=39) with the same HL gene promoter genotype (GG) were compared in order to control for the effect of the polymorphism on HL activity, known to account for 20% of the variance in HL.; Exclusion criteria included body mass index >40 kg/m2, elevated triglyceride or LDL levels (>95% for age), use of estrogen or lipid lowering medications. Men had significantly higher HL activity (267.9 ± 92.4 vs. 145.0 ± 57.6 nmoles/ml/min, p<0.001, respectively), more IAF (162.7±76.7 vs. 63.6 ± 42.2 cm2, p<0.001) and more dense LDL than women (0.278 ±0.031 vs. 0.300 ± 0.023, p=0.006). After adjusting for the effect of IAF, men continued to have significantly higher amounts of HL activity than women (210.9 ±90.5 vs. 172.8 ±48.3, p=0.04, respectively). Using multiple linear regression, HL activity remained independently related to both gender (p<0.001) and IAF (p<0.001) but not age (p=0.09) with these variables accounting for 58% of the variance in HL activity (r=0.764), not including the gene polymorphism effect.
These data suggest that while IAF accumulation contributes to the differences in HL activity between sexes, gender-related factors (presumably sex-steroid hormones) still contribute to the higher HL activity seen in men compared to premenopausal women. These gender-related factors may account for the temporal separation in CAD risk between men and women. With estrogen deficiency at menopause, women accumulate IAF which contributes to an increase in HL activity and decrease in LDL size, and presumably to coronary risk.
246 Central Obesity, Elevated Albumin Excretion, and Dyslipidemia in Type 1 Diabetes
Thus far, evidence regarding whether central obesity syndrome (COS) is associated with diabetic nephropathy (DN) in type 1 diabetes (DM1) is inconclusive. While some studies have not found associations between COS traits and DN, others have demonstrated that insulin resistance, cardiovascular disease, and nephropathy track through the families of some subjects with DM1 suggesting that DN results from the interaction between hyperglycemia and some component of COS. The purpose of this study was to determine whether an unselected group of subjects with DM1 and elevated albumin excretion (albumin/creatinine ratio≥30mg albumin per gram creatinine) have more intraabdominal fat (IAF), dyslipidemia, and other COS traits than those with normal albumin excretion.
Sixty-one subjects from the Seattle cohort of the Epidemiology of Diabetes Intervention and Complications Trial (EDIC) (36 males and 25 females) have completed measures of IAF (via CT at the umbilicus), hepatic lipase, and plasma lipoproteins. The male/female ratio (p=0.13, Fisher's exact test), was 6/1 in subjects with elevated albumin excretion and 30/24 in normoalbuminuric subjects. Among males, those with elevated albumin excretion were found to have higher IAF (p=0.05) and waist-hip ratios (p=0.05), systolic blood pressures (p=0.01), and triglyceride (p=0.03), compared to those with normal albumin excretion. In conclusion, these data show that subjects who have elevated albumin excretion exhibit more COS traits than those with normoalbuminuria. Furthermore, these data suggest the possibility that, especially with improved glycemic control over the past few decades, factors related to COS may be important determinants in the development of DN.
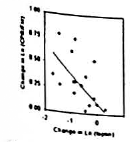
247 a Common Hepatic Lipase Gene Promoter Variant Determines Clinical Response to Intensive Lipid Lowering Treatment
The -514 C→T polymorphism in the promoter region of the hepatic lipase gene affects hepatic lipase (HL) activity. The common C allele is associated with higher HL activity and a more atherogenic lipid profile characterized by more dense low density lipoproteins (LDL) and lower levels of high density lipoprotein-2 cholesterol (HDL2-C). Intensive lipid-lowering therapy lowers HL activity, changes LDL and HDL buoyancy and promotes coronary artery disease (CAD) regression. We tested the hypothesis that subjects who experience the greatest CAD regression from these favorable effects are those with the HL gene promoter polymorphism (CC) associated with a more atherogenic lipid profile. Forty middle-aged men with dyslipidemia (apo B levels ≥125 mg/dl). and CAD diagnosed by angiography. undergoing 2½ years of intensive lipid-lowering therapy (lovastatin 20 mg bid and colestipol 10 g tid. or niacin 1 g qid and colestipol 10 g tid), were selected for the study of the impact of the HL gene promoter polymorphism on changes in HL activity, LDL buoyancy and lipoprotein levels and its association with CAD regression. Change in coronary stenosis was assessed by repeat quantitative angiography, the HL polymorphism by PCR amplification, HL activity by of 14C-labeled substrate and LDL buoyancy by plasma density gradient ultracentrifugation. The response to lipid-lowering therapy was significantly different among subjects with different HL gene promoter polymorphisms. Subjects homozygous for the C allele had the greatest decrease in HL activity (p<0.005 vs. TC and TT by ANOVA) and the greatest improvement in LDL density (p<0.005) and HDL2-C (p<0.05) with therapy. These subjects had the greatest CAD angiographic improvement, with 95% of them experiencing regression of coronary stenosis, while 63% of the heterozygous TC and none of the homozygous TT patients had disease regression (χ2=16.43; p<0.001).
In conclusion, in patients with established CAD and dyslipidemia. the HL gene -514 C→T polymorphism predicts coronary stenosis regression with lipid lowering treatment by modulating pharmacological effect on HL-mediated steps in LDL and HDL metabolism. This study identifies a gene that influences the clinical response to lipid-lowering drugs.
248 Co-Localization of Biglycan and Apolipoproteins in a Porcine Model of Atherogenesis
Lipid retention in the arterial intima is an early step in the pathogenesis of atherosclerosis. Recently, we have demonstrated co-localization of the small, dermatan sulfate proteoglycan, biglycan, and that apolipoproteins (apos) B, E and A-I co-localize with biglycan in human coronary atherosclerosis, suggesting a role for biglycan in the accumulation of lipids in atherosclerotic plaques.
To determine whether proteoglycan accumulation was associated with lipoprotein retention in a porcine model of atherogenesis, nine 8 wk-old Yorkshire male pigs were placed on either normal swine chow (NL, n=3) or a calorically-matched, hyperlipidemic diet containing 1.5% cholesterol and 19.5% lard (HC, n=6). Animals were sacrificed at 20 wks of age. Immunohistochemistry was performed on methanol-Carnoy's-fixed, paraffin-embedded sections of the right coronary arteries (RCAs) using polyclonal antisera raised against the proteoglycans, versican or biglycan, or against apolipoproteins B, E or A-I. There was little versican present in the RCAs of either NL or HC animals. In contrast, while there was little biglycan, apoB, apoE or apoA-I present in NL RCAs, deposits of all 4 molecules were present and co-localized in HC RCAs.
These results demonstrates that the relationship of biglycan accumulation to lipoprotein deposition seen in human atherosclerosis is replicated in this hyperlipidemic porcine model and suggest that this model may be useful in studies of novel therapies designed to interfere with biglycan/lipoprotein interactions.
249 Increased Visceral Adiposity and Insulin Resistance Are Determinants of An Atherogenic Lipoprotein Profile
Obesity and insulin resistance are both associated with an increase in cardiovascular disease due in part to an atherogenic lipoprotein profile. To determine whether the effect of obesity and insulin resistance on lipoproteins are dependent or independent of each other, we determined body size as body mass index (BMI) and visceral adiposity as intra-abdominal fat (IAF) area by CT scan at the level of the umbilicus in 225 apparently healthy subjects with an average age of 52.4 years. Insulin sensitivity was quantified as the insulin sensitivity index (SI) using Bergman's minimal model. Triglycerides (Tg), total cholesterol (TC), HDL-cholesterol cholesterol (HDL-C), LDL-cholesterol (LDL-C), apolipoprotein B (apoB) and peak LDL density as Rf were measured by described techniques. Subjects were prospectively subdivided into three groups based on BMI and SI: lean insulin sensitive (LIS; BMI <27.5, SI >4.2; n=72), lean insulin resistant (LIR; BMI <27.5, SI ≤4.2 n=83), and obese (BMI ≥27.5, SI ≤4.2; n=70).
p<0.05 LIR vs. LIS;
p<0.05 Obese vs LIS;
p<0.05 Obese vs. LIR
By correlation analysis controlling for SI, IAF area was related to logTg (r=0.26, p<0.0001), logHDL-C (r=-0.34, p<0.0001), logapoB (r=0.19, p<0.01) and logRf (r=-0.33, p<0.0001). When controlling for IAF, SI was related to logTg (r=-0.21, p<0.005), logTC (r=-0.17, p<0.05), logLDL-C (r=-0.18, p<0.01) and logapoB (r=-0.23, p<0.001).
We conclude that the increased risk for cardiovascular disease associated with an atherogenic lipoprotein profile is the result of both increased visceral adiposity and insulin resistance rather than either alone. Thus, attempts at reducing this risk should focus on a reduction in visceral adiposity as well as on insulin sensitization.
250 Effects of Troglitazone on Plasminogen Activator Inhibitor-1 (Pai-1) Concentrations in Blood in Patients with Type 2 Diabetus Mellitus and in Normal Lean and Obese Subjects
Low plasma fibrinolytic activity in association with increased plasma PAI-1 levels has been linked to an increased risk of atherosclerosis in obesity and in patients with type 2 diabetes mellitus. The aim of this study was to determine if troglitazone, which improves insulin sensitivity and lowers plasma insulin levels in insulin resistant obese subjects and type 2 diabetes mellitus patients, would also lower circulating PAI-1 antigen concentrations and activity. We assessed insulin sensitivity with a 5 hour, (80 mU/mβ/min) hyperinsulinemic euglycemic clamp, and measured plasma PAI-1 antigen and activities, and tissue plasminogen activator (tPA) in 14 patients with type 2 diabetes mellitus, and 20 normal control subjects (10 lean, 10 obese), before and after 3 months of treatment with troglitazone 600 mg/d. At baseline, plasma PAI-1 antigen levels after an overnight fast were significantly higher in the obese (33.5 ± 4.4 μg/l) and type 2 diabetic subjects (54.9 ± 6.3 μg/l) than in the lean controls (16.3 ± 3.2 μg/l, p<0.01, and p<0.001, respectively). Troglitazone decreased plasma PAI-1 antigen concentrations in the diabetic patients (36.8 ± 5.0 μg/l, p<0.001 vs. baseline), but the reduction in the obese subjects did not reach statistical significance. Changes in plasma PAI-1 antigen concentrations in the diabetic patients correlated with the reductions in fasting plasma insulin (r=0.60, p<0.05), non-esterified fatty acids (r=0.63, p<0.02) and fasting plasma glucose concentrations (r=0.64, p<0.02), but not with the improvement in glucose disposal rates during the glucose clamps. In summary, troglitazone enhances fibrinolytic system activity in insulin resistant type 2 diabetic patients. This effect appears to be intimately linked to its potential to lower plasma insulin levels and improve glycemic control through its peripheral tissue insulin sensitizing effects.
251 Effect of Acute Hyperinsulinemia on Plasma Homocysteine Levels in Di-Abetes Mellitus
TT Aoki, EO Grecu, JH Ahn,
Epidemiological evidence links increasing total homocysteine (tHcy) plasma levels with an in-creasing risk of atherotrhrombotic vascular disease. Data available in patients with diabetes mellitus (DM) indicate normal tHcy levels in the absence of vascular or renal complications, but elevated tHcy post-methionine load in subjects with type 2 DM (Munshi M et al, Metabolism 1996,45:133-135). Acute hyperinsulinemia has been reported to significantly lower tHcy plasma levels in non-diabetic, but not in type 2 DM, subjects (Fonseca VA et al, Metabolism 1998,47:686-689). No sim-ilar studies in type 1 DM subjects have been reported. We investigated whether plasma tHcy levels are influenced by acute hyperinsulinemia in type 1 and type 2 DM subjects. Nineteen type 1 DM (13F,6M; average age 50±6 years) and 10 type 2 DM (3F,7M; average age 62±5 years) patients un-dergoing weekly chronic intermittent intravenous insulin therapy (CIIIT) for at least 1 year, were enrolled in this prospective study. Each patient underwent plasma tHcy determination (HPLC) at baseline and at the end of two consecutive 60 minute periods of intravenous pulsatile insulin admin-istration by a programmable infusion pump (Bionica MD-110), separated by 60 minutes, as previ-ously described (Aoki TT et al, Lancet 1993,342:515-518). The dosage of insulin infusion was pre-determined for each patient, as required for normalization of the RQ response (Sensormedic Metabolic Measurement Cart), and averaged 18 and 13.5 mU/Kg/min for type 1 DM and 52 and 44 mU/Kg/min for type 2 DM patients, during the first and second hourly pulsatile insulin infusions, respectively. During the CIIIT procedure the plasma tHcy levels declined gradually and statistically significant in both type 1 DM patients [from 8.65±3.3 to 7.98±3.2μM/L (p=0.0004)] as well as in the type 2 DM cohort [from 8.42±3.2 to 7.88±3.0 μM/L (p=0.0003)].
These results suggest that acute hyperinsulinemia, when appropriately adjusted (dose) and admin-istered (pulsatile), acutely lowers plasma tHcy levels in both type 1 and type 2 DM patients.
252 Thyrotoxicosis is Associated with Functional B12 Deficiency, Potentially Increasing the Risk for Hyper-Homocysteinemia
Objective: Vitamin B12 and folate deficiencies can occur as a consequence of thyrotoxicosis. Since vitamin B12 and folate are important in the metabolism of homocysteine, deficiencies of these vitamins may be associated with hyperhomocysteinemia in thyrotoxicosis. We hypothesize that thyrotoxicosis is associated with clinically significant B12 and/or folate deficiency, resulting in hyperhomocysteinemia.
Methods: Ten subjects with newly diagnosed, untreated thyrotoxicosis, as well as ten age and sex matched euthyroid control subjects, were studied. Fasting blood was sampled for TSH, Free T4, homocysteine, B12, folate and methylmalonic acid (MMA; an index of bioactive B12). All subjects were aged 18 to 45 years.
Results: In thyrotoxic subjects, homocysteine was positively correlated with Free T4 levels (r=0.67, p=0.03), as was MMA (r=0.89, p=0.003). B12, Folate, homocysteine and MMA levels were not significantly different between the study groups, but there was a trend toward decreased B12 and folate levels, and increased homocysteine and MMA levels, in the thyrotoxic group compared to the euthyroid control group: B12 = 351±141 vs 418±219 pg/ml; folate = 15.7±4.6 vs 17.6±4.4 ng/ml, Homocysteine = 7.2±1.5 vs 6.8±1.1 μM/L, and MMA = 110±75 vs 87±37 nM/L, respectively.
Conclusions: The positive correlation between Free T4 levels and both homocysteine and MMA suggests that thyrotoxicosis is associated with functional B12 deficiency. Such a deficiency may result in clinically important hyperhomocysteinemia. These pilot data suggest that the current sample size may be too small to detect a difference in either B12 of homocysteine levels and that 25-35 subjects are necessary in each group to demonstrate a clinically significant difference in these parameters.
253 a New Method for the Study of Chylomicron Kinetics In Vivo
High fat diets are thought to contribute to obesity, insulin resistance and atherosclerosis. However, little is known about the metabolism of chylomicrons (chylos), the intestinal product of fat absorption. We have developed a method for labeling a 10% intravenous lipid emulsion with [14C] triolein. The material is purified by HPLC and heat sterilized prior to administration. Studies were conducted to determine whether the labeled emulsion could be used to quantify intestinal fat absorption. After an overnight fast, healthy volunteers (n=5) sipped a chocolate flavored drink labeled with [3H] triolein and prepared from nonfat dried milk and vegetable oil for 6.5 hours at a rate of 175 mg fat•kg−1•h−1. Beginning at hour 5, a [14C] triolein-containing lipid emulsion of high specific activity (total fat content = 300 mg) was infused intravenously for 90 minutes at ~ 0.3 μCi•min−1. Blood samples were taken every 10 min during the last 40 min of the infusion and analyzed for plasma chylo TG concentration and specific activity (SA). Results: During the study, plasma total and chylo TG concentrations increased from 104 ± 25 to 248 ± 47 mg•dL−1 and from undetectable to 42 ± 13 mg•dL−1, respectively. Steady-state chylo TG concentrations and SA were achieved in all subjects. Plasma chylo 3H TG SA was ~7% lower than the 3H TG SA in the drink, and PAGE gels showed that apo B-100 was present in the chylo isolates, consistent with minor contamination of the specimens by very low density lipoprotein (VLDL) TG. The tracer-determined appearance rate of chylo TG was 199 ± 33 mg•kg−1•h−1, ~14% higher than the presumed absorption rate of 175 mg•kg−1•h−1. When 3H TG SA was used to correct 14C chylo TG SA for the presence of unlabelled VLDL TG in the chylo specimens, chylo TG appearance rate was 185 ± 34 mg•kg−1•h−1 (p = NS compared to presumed absorption rate). In summary, when a radiolabeled lipid emulsion was used to trace intestinal fat absorption, it produced an excellent estimate of chylo TG appearance rate. This indicates that the lipid emulsion is metabolized by lipoprotein lipase in a fashion similar to native chylos. The results suggest that a radiolabeled lipid emulsion would be a useful tool for the study of TG-rich lipoprotein metabolism.
254 Glucose, but Not Fructose, Infusions Increases Circulating Leptin in Rhesus Macaques
Peter J. Havel Department of Nutrition, University of California, Davis, CA.
The adipose tissue hormone, leptin, reduces food intake and produces weight loss in rodents and leptin deficient humans. Circulating leptin concentrations correlate with adiposity in humans and rodents and decrease after weight loss or caloric restriction. Leptin production is regulated by insulin responses to meals and circulating leptin levels are reduced over a 24 h h period in human subjects consuming high fat compared with high carbohydrate meals (Havel et al, Diabetes, 1999). The difference observed between high fat and high carbohydrate meals may reflect a reduction of insulin-mediated glucose metabolism in adipose tissue. Since it is known that fructose, unlike glucose, does not stimulate insulin secretion, we examined plasma leptin during 8 h intravenous infusions of saline, glucose, or fructose (both 15 mg · kg−1 · min−1) in 9 adult overnight-fasted male rhesus monkeys. During saline infusion, plasma insulin declined by approximately 50% (p<0.01) with little change of plasma glucose while plasma leptin decreased from 4.4 ± 2.0 to 3.0 ± 1.7 ng/ml by 8 h (%Δ = −32 ± 9%; p<0.01). Plasma glucose increased from 72 ± 5 to 214 ± 20 mg/dl during glucose infusion raising plasma insulin from 25 ± 7 to 226 ± 98 μU/ml (p<0.01) Plasma leptin was significantly increased at 4 h (+0.7 ± 0.3 ng/ml; p<0.02) and continued to increase to 7.4 ± 3.0 ng/ml at 8 h (%Δ = + 55 ± 16%; p<0.005). Fructose infusion only modestly increased plasma glucose (+18 ± 5 mg/dl) and insulin (+10 ± 7 μU/ml), however, plasma leptin was unchanged at 8 h (−0.4 ± 0.2 ng/ml). The overall leptin response defined by the area under the curve (AUC) during glucose infusion was greater than during saline or fructose infusion (Both p<0.01), but the AUC was not different between saline and fructose. Since energy consumed as fructose does not increase the production of either insulin or leptin, both of which are considered to act as negative feedback signals from the periphery to the CNS in the long-term regulation food intake and body adiposity, excess calories consumed as fructose may promote weight gain and obesity.
255 Effect of Weight Loss on Cortisol Production Rate and Average 24 Hour Cortisol Levels in Humans
Animal models have demonstrated a role for the hypothalamic-pituitary-adrenal (HPA) axis in expression obesity and regulation of the HPA axis by leptin. These models predict that reductions in leptin with weight loss may activate the HPA axis. We have previously shown an increased cortisol production rate (CPR) determined by stable isotope enrichment over 24 hours using GC/MS in obese individuals. Increased CPR is correlated with both increased total fat mass and intra-abdominal fat (IAF) by CT. In this study, we proposed that CPR will not normalize with weight loss indicating that it plays an etiologic role in obesity. 19 subjects (n=11 Women, mean ± SD age of 43±9.2 years and BMI of 36±6.6kg/m2) consumed a diet of 1000 Kcal/day with an average reduction of body fat of 7.4% after 3 months. Weight loss resulted in reductions in fat mass (FM) (-13±6 kg, p<0.001) and fasting leptin levels (-8.8±8.8 ng/dL, p<0.001) but no change in CPR (7.4±2.1 mg/day/m2 vs. 6.9±1.6 mg/day/m2, p=0.13), 24 hour Cortisol level profile, or average 24 hour cortisol levels (5.2±1.3 vs. 6.9±1.6 mg/dL, p=0.13). When expressed in relation to subject's body composition, however, CPR and average cortisol level increased per kg of FM with weight loss (CPR/FM 0.394±0.168 vs. 0.519±0.222 mg/day/kg FM, p<0.001 and average cortisol/FM 0.129±0.05 vs. 0.239±0.15 mg/dL/kg FM, p<0.001). In addition, the fall in leptin level correlated with the increase in CPR/FM with weight loss (ΔLn [leptin] vs. ΔLn [CPR/FM], r=-0.58, p=0.008). Similar results with weight loss were found when CPR and average cortisol were expressed as a proportion of IAF (CPR/IAF 0.140±0.104 vs. 0.241±0.159 mg/dL/cm2, p<0.001; average cortisol/IAF 0.047±0.033 vs. 0.132±0.16 mg/dL/cm2, p<0.001; ΔLn [leptin] VS. ΔLn [CPR/IAF], r=-0.80, p<0.001). Therefore, weight loss and reduction in leptin results in a CPR and average cortisol level above what would be predicted for subject's new fat mass and 1AF. The lack of normalization of CPR and average cortisol levels may contribute to the metabolic milieu favoring weight regain after weight loss from caloric restriction.
256 Suppression of Food Intake by Somatostatin-13. a Novel Prosomatostatin Related Peptide
We have recently isolated a peptide from the small intestine of non-human primates that conforms to the sequence of somatostatin-28(1-13). This peptide, which we have termed somatostatin-13 (S-13) has not been described in previous studies of prosomatostatin (proS) processing. S-13 is present in highest concentrations in the ileum and is released into the circulation after meal ingestion. For this reason we posited a role for S-13 in the regulation of nutrient intake. We administered S-13 in doses ranging from 1 to 50 ug directly into the third cerebral ventricle of male rats just prior to the onset of dark phase and measured chow intake over the next four hours. S-13 dose dependently decreased food intake compared to saline treated controls, with 50 ug suppressing food intake by 30-50% for up to two hours. This anorectic effect was short-lived and waned by 4 hours. For comparison, we also administered somatostatin-28(1-12) (S-12), a previously described product of pros-containing CNS neurons, and a 13 amino acid peptide composed of the constituents of S-13 aligned in random order. Neither of these peptides, delivered at a dose of 50 ug, altered food intake significantly. While rats given S-13 had no outward manifestations of illness caution must always be exercised when interpreting reductions of food intake. Consequently we measured the effect of S-13 on the intake of 0.5 M NaCl in sodium deficient rats, a measure of aversive stimuli. While peripheral administration of toxic amounts of lithium chloride potently reduced NaCl intake, the 50 ug dose of S-13 did not. These data indicate that central administration of S-13 suppresses food intake in the rat, and that this response is not the result of behavioral incapacitation or malaise. Taken together with our previous demonstration that S-13 is released during the ingestion of meals, we propose that S-13 plays a role as a satiety factor.