
Abstract
CD2 (LFA-2) is expressed on thymocytes, natural killer cells, and virtually all peripheral T cells. CD2 binds to its primary ligand CD58 (LFA-3) on antigen presenting cells (APC) and stabilizes the T cell-APC interaction; this stable interaction then optimizes Ag-specific T-cell activation. We assessed whether CD2-cross-linking by mAb augments the process of T-cell stimulation through the TCR/CD3 complex. Plate-bound anti-CD2 or anti-CD3 mAb alone had no measurable effect on any of the assessed activation parameters of resting T cells. However, concomitant signaling through both CD2 and CD3 by plate-bound antibodies resulted in marked increases in CD69 expression on the T-cell surface and T-cell-cellular metabolism, as assessed by the ability of the cell to reduce 3-(4,5-dimethylthiazol-2-yl)-5-(3-carboxylmethoxyphenyl)-2-(4-sulphophenyl)-2H-tetrazolium (MTS) to formazan. In addition, simultaneous cross-linking of CD2 and CD3 caused a significant (P<0.001) increase in phosphatidylinositol hydrolysis in resting T cells compared to stimulation with anti-CD3 mAb alone and anti-CD3 mAb plus anti-CD2 isotype control antibody. These results indicate that CD2 augments signaling through CD3, and consequently functions as a costimulatory molecule for resting T cells in the initial activation step.
Introduction
CD2 (LFA-2, sheep red blood cell receptor) is a member of the immunoglobulin gene superfamily. CD2 is a 50- to 55-kd glycoprotein and is expressed on thymocytes, natural killer cells, and virtually all peripheral T cells.1,2 Its ligands, CD58 [leukocyte function-associated antigen-3 (LFA-3)], CD48 (Blast-1), and CD59 (complement protectin) are expressed on antigen presenting cells (APC) (such as monocytes, macrophages, and B cells) as well as neutrophils and T lymphocytes.3 The CD2-CD58 interaction contributes to the adhesion between T cells and LFA-3-bearing APCs. Because CD2 and the T-cell receptor (TCR) are approximately the same length (72Å), CD2-CD58 binding stabilizes the low affinity T-cell receptor/major histocompatibility complex (TCR/MHC) interactions, thus optimizing Ag-specific T-cell activation.4–7
The importance of CD2 in the T cell-APC interaction is indicated by the ability of anti-CD2 monoclonal antibodies (mAbs), soluble ligands to CD2, and mAbs to CD58 to inhibit T cell-APC conjugate formation, thereby inhibiting T-cell proliferation, cytokine production, and cytotoxicity. In vivo murine studies report that anti-CD2 mAbs inhibit T-cell-mediated responses, such as the development of cytotoxic T cells, delayed type hypersensitivity, experimental autoimmune neuritis, and graft rejection.8–14 Collectively, these studies support a critical role for CD2 in T cell-APC interaction, but it is possible that besides its role in APC-T-cell adhesion, CD2 also affects signaling in human T cells.
Signaling through the TCR leads to modifications in the cytoplasmic tail of CD2, which alters the conformation of the extracellular portion of CD2 increasing its affinity for its ligand CD58.15–17 This observation, and the recent realization that besides stabilizing T cell-APC interactions, cell-adhesion molecules also augment signaling, suggest that CD2 may also have an active role in T-cell signaling.
CD3 is the signaling portion of the TCR/CD3 complex and stimulation of resting T cells with anti-CD3 mAb crosslinks the TCR and initiates intracellular signaling. High concentrations of anti-CD3 mAb result in a mitogenic level signal, but lower concentrations impart a more physiologic signal, which require additional signals to activate the resting T cells. Stimulation with anti-CD3 mAb at lower concentrations together with mAbs against a putative costimulatory molecule represents a powerful model system to determine whether a molecule is costimulatory and to elucidate the signal it imparts.
An important early step in T-cell activation through CD3 is the activation of phospholipase C-y (PLC-y) isozymes, which hydrolyze membrane inositol phospholipids [phosphatidylinositol (PI)]18–20 with subsequent increases in intracellular calcium [Ca+2] 21 and protein kinase C (PKC) activation. 22,23 The Ca+2 flux and PKC activate nuclear transcription factors resulting in cell proliferation, effector function, and expression of the early surface activation marker (CD69).24
Because CD2 is constitutively expressed on the surface of resting T cells, we hypothesized that CD2 is important in augmenting CD3-mediated signaling in resting T cells. We report experiments which indicate that cross-linking of CD2 with a single mAb augments the anti-CD3 mAb induced increases in CD69 expression, cell metabolism, and PI hydrolysis in T cells.
Materials and Methods
Cells and Antibodies
Unlabelled mouse anti-human CD14 (3C10; ATCC-TIB228), CD3 (OKT3; ATCC-CRL-8001), and CD2 (OKT11; CRL-8027) mAbs were affinity-purified from cell culture supernatant using goat anti-mouse IgG agarose (Sigma, St. Louis, Mo). Mouse anti-human CD19 mAb was purchased from Southern Biotechnology Associates, Inc [(SBA), Birmingham, Ala], and mouse anti-human CD56 mAb was purchased from Becton Dickinson (San Jose, Calif). Peripheral blood mononuclear cells from normal nonsmoking human donors (18-65 years old) were isolated by Ficoll/Hypaque density gradient centrifugation. The cells were washed three times in buffer [phosphate-buffered saline (PBS) without Ca2+ containing 10% fetal calf serum (FCS; Hyclone Logan, Utah)].
T cells were purified by negative immunomagnetic separation as previously described.25 Briefly, peripheral blood mononuclear cells were labeled with mouse anti-human CD14, CD56, and CD19 antibodies. The cells were washed once and labeled with goat anti-mouse IgG magnetic beads (Miltenyi Biotech, Auburn, Calif) for an additional 15 minutes on ice. The cells were washed and applied to a B2 MACS column (Miltenyi Biotech). The unlabeled cells (enriched T cell) were collected. To check cell purity, three aliquots of the cell separation, each with 5×10⁵ cells, were surface labeled using FITC-IgG/PE-IgG2a controls, FITC-mouse anti-human CD19/PE-mouse anti-human CD3 mAb, or FITC-mouse anti-human CD14/PE-mouse antihuman CD56 mAb (purchased from Becton Dickinson). The aliquots were fixed with 1% paraformaldehyde and stored at 4°C until analysis using a FACSCalibur (Becton Dickinson); aliquots were consistently less than 5% positive for CD14, CD19, or CD56.
Cell Activation and Surface Cd69 Expression
A polyclonal goat anti-mouse IgG antibody (SBA) (final concentration 25 µg/mL) was plastic adhered overnight in 96 well culture plates (Costar). Nonadherent antibody was washed off with PBS, and combinations of monoclonal antibodies to CD2 (final concentrations 0.03, 0.125, and 0.25 µg/mL), CD3 (final concentration, 0.125 µg/mL) and appropriate isotype controls were incubated overnight at 37°C and adhered to the plastic coated goat anti-mouse antibody in individual wells with 36 replicates of each antibody combination. An aliquot of unstimulated purified CD3+ lymphocytes was stained with fluorescent anti-CD3 mAb and anti-CD69 mAb (Becton Dickinson) antibodies and the appropriate fluorescent isotype control antibodies to assess baseline CD69 expression. The remaining cells were resuspended in complete Rosewell Park Memorial Institute media (RPMI) (supplemented with 70 mM NaHCO3, 2 mmol/L L-glutamine, 100 U/mL penicillin, 100 µg/mL streptomycin, 0.25 µg/mL amphotericin, and 50 µmol 2ME) at 5×10⁵ cells/mL. Aliquots (100 µL) of cell suspension were added to each well and incubated for 3 days at 37°C in 5% CO2. Twenty-four wells of each stimulus were harvested, consolidated and labeled with fluorescein-conjugated anti-CD3, anti-CD69 or isotype control antibodies. The cells were analyzed on a FACSCalibur for CD69 expression. The remaining 12 wells were analyzed for metabolic activity.
Cellular Metabolic Activity
To the 12 remaining wells in the plates used for phenotypic analysis (above), we added 20 µL of the 3-(4,5-dimethylthiazol-2-yl)-5-(3-carboxylmethoxyphenyl)-2-(4-sulphophenyl)-2H-tetrazolium (MTS)/phenazine methosulfate solution (Promega, Madison, Wis). MTS is bioreduced by metabolically active cells to formazan in an amount directly proportional to the number of living cells in culture. 26,27 The quantity of formazan is measured by the amount of absorbance at 490 nm on a Biorad microplate reader at 1, 2.5, and 4 hours.
Receptor-Mediated Pi Hydrolysis
PI hydrolysis was assessed as previously described. 25 Briefly, T cells were washed three times in permeabilization buffer (20 mmol/L potassium PIPES [pH 7.1], 50 mmol/L potassium glutamate, 5 mmol/L glucose, 7 mmol/L magnesium acetate, 1 mmol/L EGTA, 5 mmol/L ATP, 12 µmol CaCl2 [0.1 µmol free Ca2+] and 0.1% FCS). 25,28 The cells were incubated for 50 minutes at 37°C in permeabilization buffer, with the permeabilization agent staphylococcal a-toxin (0.741 µg/mL) (Gibco Gaithersburg, Md) and 10 µCi [H]myoinositol (Amersham, Arlington Heights, III) in a final volume of 1 mL. The cells were washed three times in permeabilization buffer to remove all unincorporated [H]myoinositol. Cells were resuspended at 5×10º cells/mL in permeabilization buffer containing 5 mmol/L ATP and 10 mmol/L LiCl. OKT3 (final concentration 0.125 µg/mL), OKT11 (final concentrations 8.0, 2.0, 0.5, 0.125, and 0.03 µg/mL), and matched isotype control antibodies (final concentration 8.0 µg/mL) were adhered in 12×75-mm polypropylene tubes for 6-12 hours at 37°C. Nonadherent mAb was washed off with PBS. All tubes were previously coated with goat anti-mouse IgG (25 µg/mL for 6-12 hours at 37°C). We added the phosphatase inhibitor orthovanadate (Na3VO4; Fisher, Houston, Tex; final concentration 1 mmol/L), which induces extensive PI hydrolysis in permeabilized cells in the presence of ATP and Mg+2, to selected tubes as the positive control. Aliquots (200 µl) of the cell suspension were added to each tube, and the cells were centrifuged 1 minute at 51g and incubated at 37°C for a total of 10 minutes.
The cell stimulation was terminated by the addition of 750 µL methanol:4N HCl:chloroform (200:2:100). After addition of 250 µL chloroform and 250 µL 0.1N HCl, the tubes were vortexed and centrifuged. Aliquots of the aqueous phase containing hydrolyzed inositol phosphates were counted in a liquid scintillation counter. The entire organic phase from each tube was transferred to empty scintillation vials and counted after evaporation of the solvent.
The aqueous phase (containing hydrolyzed ³H-inositol phosphates) and organic phase (containing unhydrolyzed inositol phospholipids) were analyzed separately by liquid scintillation counting. The percentage PI hydrolyzed was calculated according to the formula: aqueous disintegrations per minute (DPM)/(aqueous DPM + organic DPM) ×100. Net percent PI hydrolysis was obtained by subtracting the PI hydrolysis measured in the isotype control tubes.
Statistical Analysis
Each CD69 expression experiment was performed at least three times and analyzed using the FACSCalibur's region statistics. Each cellular metabolic activity experiment (with 12 replicates) was repeated three times. The mean absorbance measured at 490 nm for each T-cell-stimulating antibody combination was compared using the Bonferroni test.
The PI hydrolysis experiments were performed in triplicate and repeated at least three times. The net percentage PI hydrolysis values for each stimulating antibody combination was compared using the Bonferroni test.
Results
We performed our experiments using negatively selected T cells (>95%) to avoid possible activation of the T cells before assays; enrichment of T cells minimizes the possibility of signaling from other cell types. The amount of anti-CD3 mAb we selected to stimulate our T-cell-enriched cultures is sufficient to bind all T cells in the well29 but is not mitogenic.
Surface Activation Marker (Cd69) Expression
To determine whether simultaneous cross-linking of both CD2 and CD3 activates resting T cells to a greater extent than cross-linking of CD3 alone, we assessed the T-cell surface expression of the T-cell activation marker (CD69) by flow cytometry after culturing the enriched T cells for 3 days with plate-bound mAbs. The percentage of CD3+ cells expressing surface CD69 before stimulation was similar to the percentage of T cells expressing CD69 after culture with anti-CD2 isotype control, anti-CD3, or anti-CD3 plus anti-CD2 isotype control antibodies (Figure 1). However, surface CD69 expression markedly increased after the cells were cocultured with anti-CD3 plus anti-CD2 mAb. The percentage of T cells expressing CD69 increased in an anti-CD2 mAb concentration dependent manner (Figure 1).
Cellular Metabolic Activity
To investigate whether simultaneous cross-linking of CD3 and CD2 molecules increases the T cells' metabolic activity (reflecting T-cell proliferation) of T cells, we measured the ability of T cells, cultured for 3 days, to reduce MTS to formazan. Cells cultured with anti-CD3 plus CD2 isotype control mAb had similar metabolic activity compared with uncoated wells, wells containing isotype control antibodies for anti-CD3 or anti-CD2, or wells containing anti-CD3 mAb. However, cells cultured with anti-CD3 plus anti-CD2 mAb had significantly greater metabolic activity in a dose-dependent fashion compared with anti-CD3 mAb or anti-CD3 mAb plus CD2 isotype control mAb-stimulated cells (Figure 2).
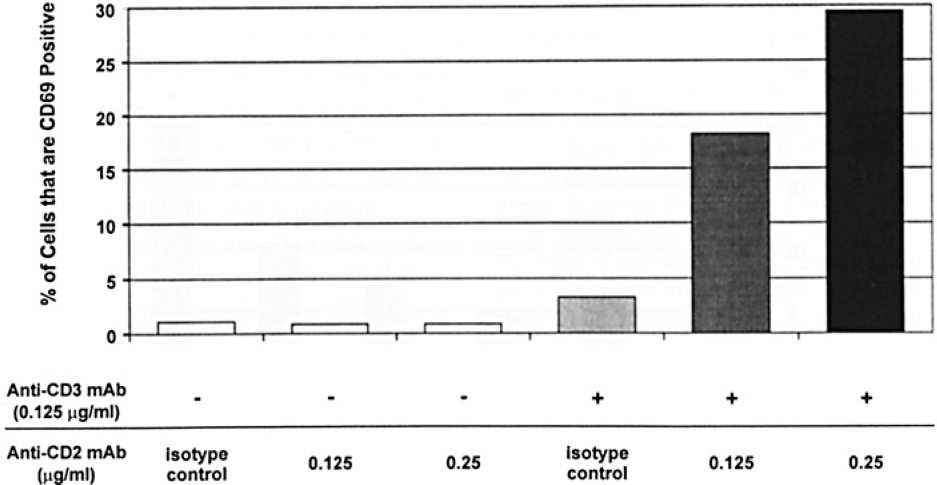
T-cell expression of surface CD69 following stimulation with anti-CD3 and anti-CD2 mAbs. The antibody stimulus for the enriched T cells is indicated on the x-axis, and the percentage of T cells is on the y-axis. This experiment was repeated three times with similar results.
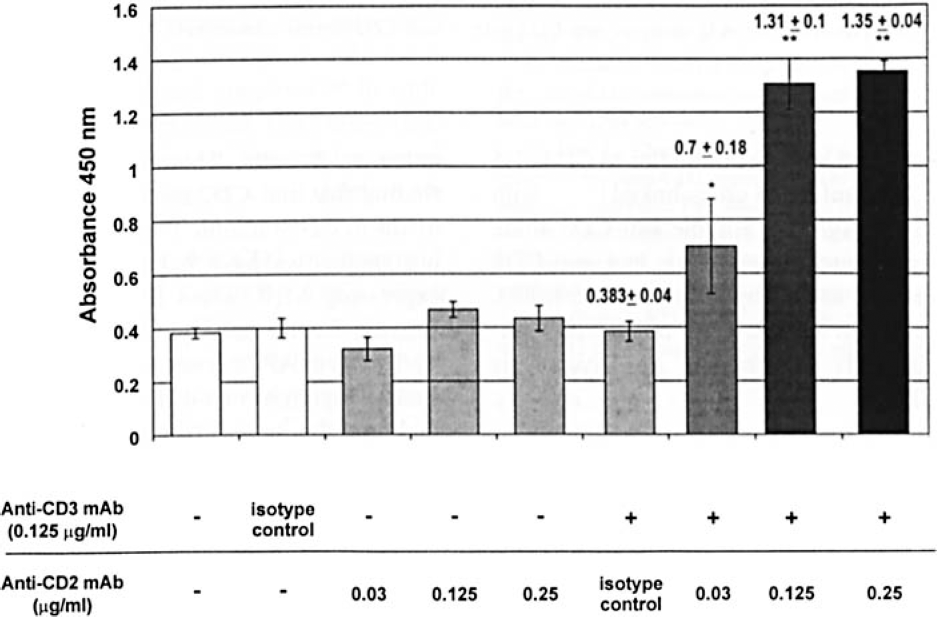
Metabolic activity of cells stimulated with anti-CD3 and anti-CD2 mAbs. Each bar represents the mean absorbance (± SEM) of 12 replicates. This experiment was repeated three times with similar results. *P<0.01 compared to CD3 alone or CD3 + isotype control (CD2). **P<0.001 compared to CD3 alone or CD3 and CD2 isotype control.
Phosphatidylinositol Hydrolysis
To determine whether anti-CD2 mAb augments PLC activation in freshly isolated human T cells, we measured the levels of PI hydrolyzed in T cells triggered in polypropylene tubes coated with anti-CD2 and anti-CD3 mAbs. Isotype-matched negative control antibodies produced only background PI hydrolysis (data not shown). The phosphatase inhibitor orthovanadate served as the positive control and consistently induced greater than 50% net PI hydrolysis. Anti-CD3 mAb alone produced 5.4±1.7% PI hydrolysis in cells from normal volunteers, and anti-CD2 mAb alone produced negligible PI hydrolysis (2.6±4%). However, the combination of anti-CD3 mAb and anti-CD2 mAb (2.0 and 8.0 µg/mL, respectively) significantly (P<0.001) increased the percent of PI hydrolysis (19.9±0.7 and 24.2±0.7, respectively) compared with anti-CD3 plus CD2 isotype control mAb (8.0 µg/mL) (Figure 3).
Anti-CD2 mAb may have increased the T-cell binding to the plastic adherent anti-CD3 mAb, explaining the observed synergy between CD2 and CD3. To evaluate the effect of increased adhesion on T-cell activation, we stimulated enriched T cells with soluble antibodies to CD3 (1.5 ng/mL) and CD2 (8.0 µg/mL) and cross-linked them with goat anti-mouse IgG (16 µg/mL). Soluble anti-CD3 alone produced 11.3±0.9 net percent hydrolysis and anti-CD2 mAb alone produced no net PI hydrolysis (0.9±1.0%). However, the combination of anti-CD3 mAb with anti-CD2 mAb significantly increased PI hydrolysis (23.4±1.2%; P<0.001).
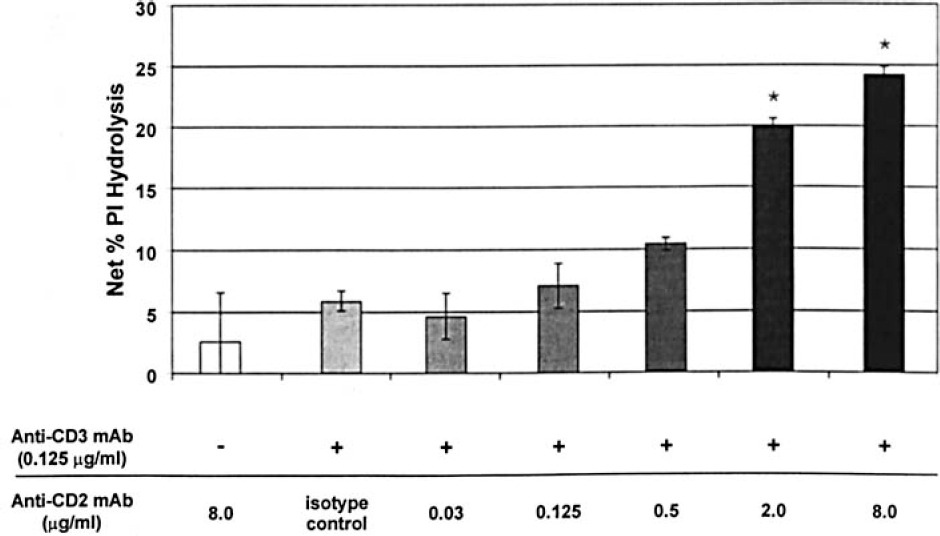
PI hydrolysis in human T cells stimulated with anti-CD3 and anti-CD2 mAbs. The percent PI hydrolysis (y-axis) is indicated for the T-cell-enriched population and stimulation with plastic adherent mAbs indicated on the x-axis. This experiment was repeated three times with similar results. *P<0.001 compared with anti-CD3 mAb alone or anti-CD3 mAb + anti-CD2 isotype control mAb.
Discussion
Our experiments clearly indicate that simultaneous cross-linking of CD3 and CD2 molecules on the surface of human T cells causes significantly increased CD69 surface expression, PI hydrolysis, and general metabolic activity compared to cross-linking of CD2 or CD3 alone. Reports by others that various parameters of T-cell activation are enhanced in cultured, transformed, or peripheral T cells using pairs of anti-CD2 mAbs and anti-CD3 mAb compared with anti-CD3 mAb stimulation alone support our findings. 6,30–41 These results thus support the hypothesis that signaling through CD2 increases the antigen-specific signal in T cells.
There is an apparent conflict in our data, which indicates that anti-CD2 mAb costimulates T cells, and the observation that anti-CD2 mAb treatment in vivo inhibits the T cell responses.8–14 The mechanism whereby anti-CD2 mAb blocks T cell mediated responses in vivo is likely due to blocking the APC-T-cell interaction by the anti-CD2 mAb, thereby causing inefficient antigen presentation to T cells. This contention is supported by the finding that anti-CD2 mAbs, soluble ligands to CD2, and mAbs to CD58 inhibit T cell-APC conjugate formation. In our studies we have bypassed this requirement for cells expressing MHC class II by using anti-CD3 mAb that activate T cells directly. Consequently, blocking adhesion by T cells to APCs is not a variable in our studies. The two studies highlight two different but critical aspects of CD2 function: the in vivo results reflect CD2's role in APC-T-cell adhesion, whereas our data reflect CD2's role in T-cell costimulation.
One possible explanation of our findings is that increased adherence, mediated by CD2 cross-linking, results in augmented signaling. However, our observation that soluble anti-CD3 mAb and anti-CD2 mAb also significantly increase PI hydrolysis in resting T cells, compared with anti-CD3 mAb and anti-CD2 control or anti-CD3 mAb alone, indicates that increased adhesion by anti-CD2 mAb cannot account for all of the observed activation effects caused by the anti-CD2 and anti-CD3 mAbs.
An alternative explanation is that our results are due to activation of other cells contaminating our T-cell preparations. However, it seems unlikely that the minor contaminants of non-T cells (<5%) produce such marked immediate increases in net PI hydrolysis after binding to the anti-CD2 and anti-CD3 mAb yet produce little signal after binding to anti-CD2 mAb alone. These results indicate that the synergistic signals are independent of contaminating cell populations. Our data reveal that CD2 cross-linking with CD3 in an enriched resting T-cell population synergistically increases surface expression of the activation marker CD69, metabolic activity, and inositol phospholipid production. Possibly, the observed CD2-mediated increases in CD3-initiated T-cell signaling is mediated by a cytoplasmic CD2-defined amino acid motif (260-265, PPPGHR) and the CD3 ζ chain resulting in p56lck and the subsequent PLC-yl phosphorylation and activation.42–45 Engagement of CD2 by its natural ligand or mAbs may lower the threshold for T-cell activation by the TCR thus increasing the efficiency of the T lymphocyte-APC interaction in T-cell effector functions. In addition to stimulating the cell through the PLCy-1 pathway, ligation of CD2 activates other signaling components, including the Zap-70 family tyrosine kinase p72syk, the Tec-family tyrosine kinase ITK, the cAMP cascade, and PI 3-Kinase.46–49 This synergistic signal may help regulate other important accessory T-cell surface molecules such as LFA-1, VLA-4, and CTLA-4 and cause the newly activated cell to proliferate, and differentiate into effector T cells. 50,51 Alternatively, the synergistic signal could aid in protecting the cell from anergy and apoptosis.52 In addition to cell stimulation and preservation, CD2 cross-linking on T cells induces apoptosis by Fas- and caspase-independent pathways, thus serving as a cell deletion (or clearance) mechanism.53–55
Our data thus support a role for CD2 on resting T lymphocytes in the activation of T cells by APCs, which express the ligands for CD2 (B cells and macrophages). The in vivo costimulation likely involves both intracellular signals generated by CD2 cross-linking and increased cell-cell adhesion. The synergistic effects of CD2 on TCR-induced T-cell activation suggests potential therapeutic implications such as the use of antibodies or fusion proteins to interrupt CD2/LFA-3 interactions and reduce T-cell activation in chronic inflammation, autoimmunity, or graft rejection.9–14,56,57
Footnotes
Acknowledgments
We thank Leah and Kyle Berney for their encouragement. This work was supported in part by NIH grants A130879, CA13148, T32-A107051, A134568, A140667 (H.H.); Louisiana American Heart Association Grant-in-Aid LA-966B03 (S.M.B.); Louisiana Education Quality Support Fund (LEQSF) Research and Development Program Award LEQSF (1998-01)-RD-A-09 (S.M.B.); and a Burroughs Wellcome Developing Investigator Award (T.P.A.).