
Abstract
While a rising prevalence of anemia in the United States was reported in older studies, recent data are lacking. To estimate the prevalence and time trends of anemia in the United States and to examine how these estimates differ by gender, age, race, and household income to poverty threshold ratio (HIPR), we used the National Health and Nutrition Examination Surveys from 1999 to 2020. The presence of anemia was determined using the World Health Organization criteria. Survey-weighted raw and adjusted prevalence ratios (PRs) were determined using generalized linear models for the overall population and by gender, age, race, and HIPR. In addition, an interaction between gender and race was explored. Complete data on anemia, age, gender, and race were available on 87,554 participants (mean age = 34.6 years, women = 49.8%, Whites = 37.3%). Anemia prevalence increased from 4.03% during the 1999–2000 survey cycle to 6.49% during 2017–2020. In adjusted analyses, anemia prevalence was higher in >65 than in 26–45 years old (PR = 2.14, 95% confidence interval (CI) = 1.95, 2.35), in Blacks than Whites (PR = 3.97, 95% CI = 3.63, 4.35), in women than men (PR = 1.98, 95% CI = 1.83, 2.13), and in those with HIPR ≤ 1 than >4 (PR = 0.68, 95% CI = 0.61, 0.75). Gender modified the relationship between anemia and race; when compared to their male counterparts, Black, Hispanic, and other women had higher anemia prevalence than White women (all interaction p values <0.05). The anemia prevalence in the United States has risen from 1999 to 2020 and remains high among the elderly, minorities, and women. The difference in anemia prevalence between men and women is larger in non-Whites.
Prior reports have noted that anemia prevalence was rising across the overall US population and all age, racial, and gender groups.
Recent anemia prevalence trends in the US population are unknown and it is unclear whether the prevalence is still rising, stable at a high level, or decreasing.
It is also unclear how healthcare disparities affect anemia prevalence trends in the United States.
Anemia prevalence in the United States has stopped recently. However, the overall prevalence remains high.
Significant disparities in anemia prevalence by age, gender, race, and household income are present. Furthermore, these disparities have not changed significantly during the observed period.
The difference between men and women in anemia prevalence is significantly larger in minorities when compared to the difference between White men and women highlighting an additional level of disparity among non-White women.
Study findings suggest that the health policy changes during the last two decades, rising focus on value-based healthcare delivery, and greater emphasis on healthcare quality may have contributed to stabilizing the anemia prevalence in the United States.
Identifying factors that underlie the persistently high anemia prevalence, especially a higher prevalence of anemia in women from racial minorities, may suggest effective interventions.
Introduction
By some estimates, anemia affected 1.62 billion people in 2008 with a higher prevalence in children of preschool age, pregnant women, and non-pregnant women, while men tend to be the least affected. 1 During the past 20 years, the global prevalence of anemia in women of reproductive age has not changed while there has been a decrease in prevalence in pregnant women and children under five. 2 In the United States, anemia is particularly prevalent in reproductive-age women, children, and the elderly. 3 The presence of anemia has significant associations with increased morbidity, all-cause hospitalizations, and all-cause mortality in adults. 4 Serious adverse effects associated with anemia are observed in patients with heart failure with preserved ejection fraction,5,6 and the presence of anemia status is a valuable prognostic indicator in several serious diseases, including soft tissue sarcomas 7 and heart failure. 6
Some older data suggest that the prevalence of anemia is rising in the general population of the United States. Between 2003 and 2012, the overall prevalence of anemia increased from 4.0% to 7.9%, and a substantial increase in anemia prevalence was found for non-Hispanic Blacks, Hispanics, the elderly, pregnant women, and women of reproductive age. Several recent changes in healthcare at the national level, such as the Accountable Care Act and increasing focus on value-based care, may lower the prevalence of anemia and reverse the rising trend in anemia prevalence. However, recent estimates on the anemia prevalence and time trends in the general US population are lacking. Therefore, the objective of this study was to estimate the prevalence and time trends of anemia in the general US population and examine how these estimates differ by race/ethnicity, gender, age, and household income.
Materials and methods
We used the continuous National Health and Nutrition Examination Survey (NHANES), an ongoing cross-sectional, complex, multistage, stratified, clustered sampling design survey representative of the civilian, non-institutionalized US population. The Centers for Disease Control and Prevention’s Institutional Review Board approved the NHANES, and all participants provided written informed consent. Detailed descriptions of survey methods and procedures are available on the NHANES website. 8 Each NHANES survey includes a national sample of approximately 10,000 individuals of all ages and genders. Persons 60 and older, African-Americans, and Hispanics are oversampled to produce reliable data. A survey cycle of the continuous NHANES consists of 2-year data; however, the data collection for the 2019–2020 cycle was interrupted in March 2020 due to the COVID-19 pandemic. The data collected from 2019 to March 2020 were combined with data from the NHANES 2017–2018 cycle to form a nationally representative sample of NHANES 2017–March 2020 pre-pandemic data. Thus, participants from 10 survey cycles (1999–2020) were included in the study and the last survey cycle included 2017 to March 2020 data.
Race/ethnicity, gender, and age were self-reported by study participants. To obtain anemia prevalence estimates independent of age distributional assumptions and age group-specific prevalence estimates, we divided age into the following categories: 0–5, 6–15, 16–25, 26–45, 46–65, and >65 years. The race/ethnicity was categorized into Whites, African Americans, Hispanics, and Others. To examine the effect of socioeconomic factors, we used the Household Income to Poverty Threshold Ratio (HIPR)—a ratio of ≤1 represents a household with income less than or equal to the poverty threshold while a ratio >4 represents a household with income >4 times the poverty threshold. The use of HIPR mitigates the effect of monetary inflation when comparing household income across a wide period.
Hemoglobin was measured on the Beckman Coulter DxH 800 (Brea, California, USA) instrument, using a single beam photometer for hemoglobinometry, in the NHANES mobile examination center. The results were measured twice and the results from both readings were averaged to obtain final hemoglobin levels. Anemia was defined using the World Health Organization definition with the following thresholds for specific populations: <11 g/dL for younger than 5 years, <11.5 g/dL for 5–11 years, 12.0 g/dL for 12–14 years and non-pregnant women 15 or older, and 13.0 g/dL for men 15 years or older. 9 Moderate–severe anemia was defined as hemoglobin<10 g/dL for children <5 years and <11 g/DL for the rest.
Percentage and frequencies were used as descriptive statistics. We conducted all analyses taking into account the complex survey sampling design of the NHANES. Survey weights were generated from the 10 survey cycles for the complete dataset so that the results are representative of the US population. Prevalence was determined for each group using the number of participants with anemia as the numerator and the total number of participants as the denominator in the respective group. Adjusted prevalence and prevalence ratio (PR) were calculated using generalized linear models with log link and binomial family. 10 We used PR, and not prevalence odds ratio, as the prevalence of anemia was high in some subpopulations, and prevalence odds ratio would have poorly approximated the underlying relative risk and overestimated the strength of association. 11 We excluded pregnant women from the analysis due to the high prevalence of anemia. As there may be interest in knowing the anemia prevalence for the whole population including pregnant women, we present a rerun of the analysis including pregnant women in Supplemental data; the hemoglobin threshold for anemia definition was 11 g/dL for pregnant women. Age in categories, HIPR, and study period were included in the adjusted models. We used an interaction term to examine the differential effect of gender on anemia and race/ethnicity relationship. We also used interaction terms in the models to examine whether anemia time trends differ by age categories, race/ethnicity, or gender. All analyses were conducted using Stata 16.1 (College Station, TX, USA), and a p < 0.05 was considered significant.
Results
Of the 85,992 participants included in the analysis (20,068 and 1562 were excluded due to missing hemoglobin values and pregnancy, respectively), 42,802 (49.8%) were women, 32,064 (37.3%) were Whites, 25,588 (29.8%) were Hispanics, and 20,361 (23.7%) were Blacks (Table 1). The mean (standard deviation) age was 34.6 (24.3) years, hemoglobin was 13.8 (1.50) mg/dL, and HIPR was 2.3 (1.6). As the data on the HIPR were missing on 7288 individuals, analyses including HIPR were conducted on 78,704 participants.
Unweighted sample sizes and frequencies of the study population (excluding pregnant women) by gender, age group, household income to poverty income threshold ratio, and race/ethnicity and Hispanic origin in the NHANES, 1999–2000
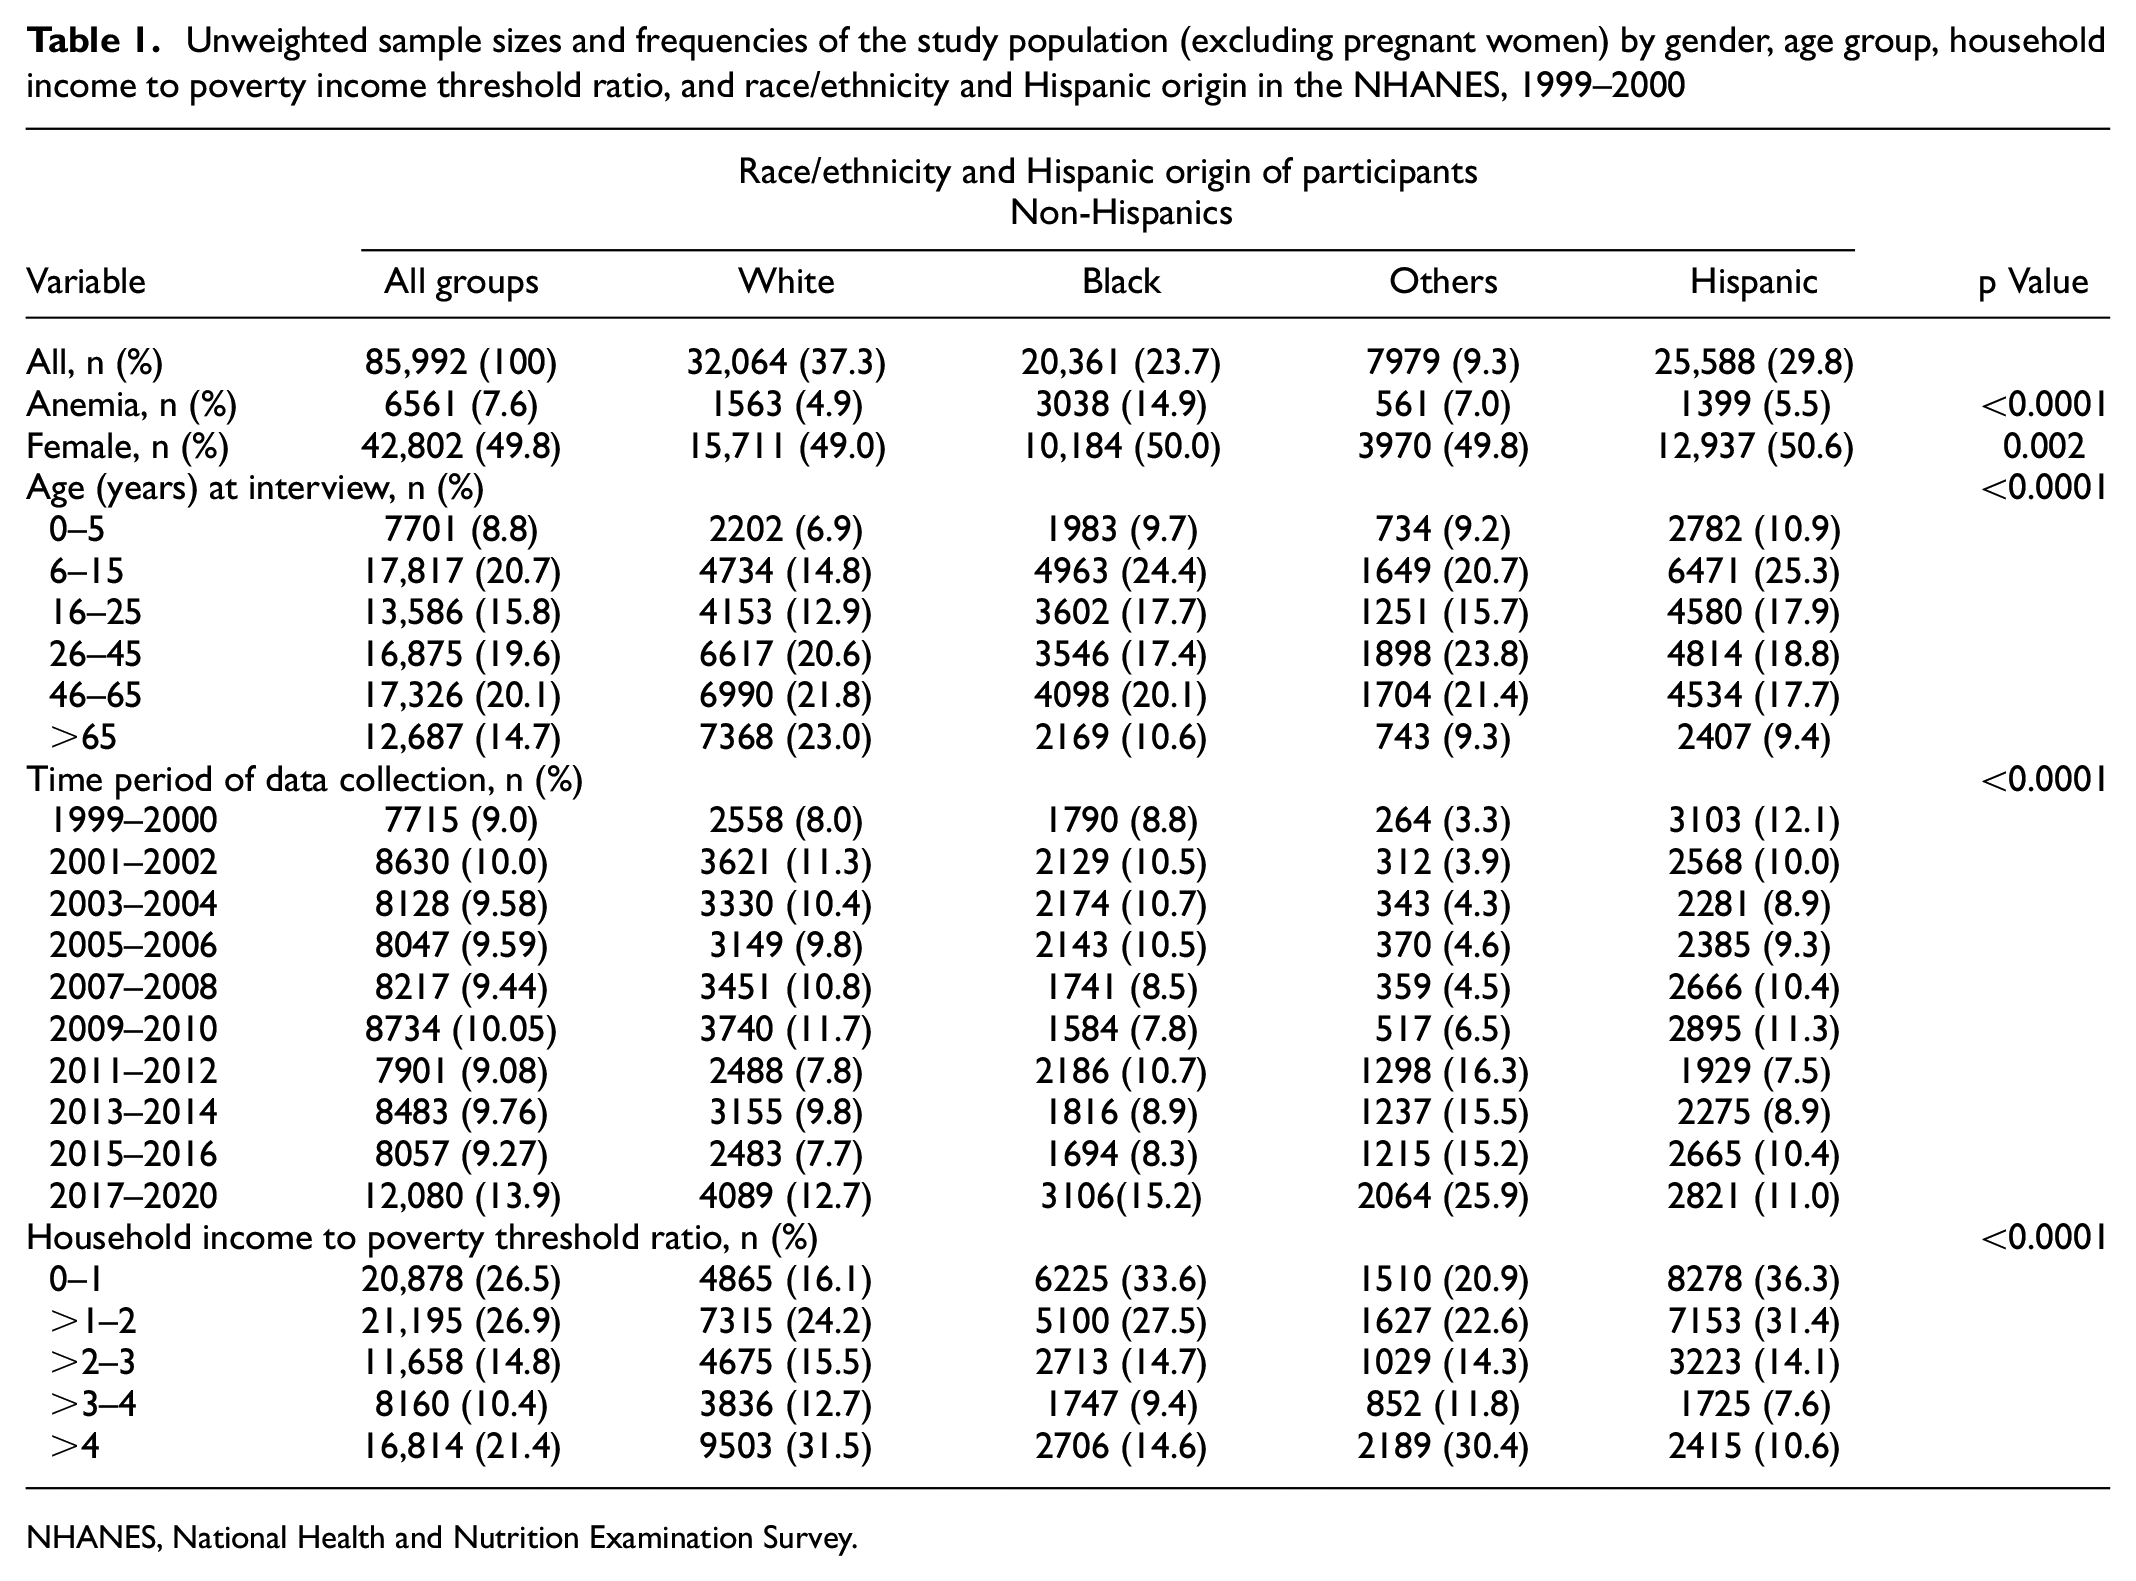
NHANES, National Health and Nutrition Examination Survey.
Anemia prevalence by race/ethnicity, gender, and age
The overall, weighted unadjusted prevalence of anemia was 5.74% (95% confidence interval (CI) = 5.41–6.09). Almost 1 out of 17 participants, 1 out of 6 African Americans, 1 out of 13 women, and 1 out of 8 elderly participants had anemia. The unadjusted anemia prevalence was significantly higher in African Americans (15.7%, 95% CI = 15.0%, 16.5%) than in Whites (3.96%; 95% CI = 3.64%, 4.30%), Hispanics (5.62%, 95% CI = 5.15%, 6.13%), or other racial groups (6.15%, 95% CI = 5.48%, 6.89%). In the analysis adjusted for age, gender, period of data collection, and HIPR, the prevalence of anemia was almost four-fold higher in African Americans than in Whites (PR: 3.97, 95% CI = 3.63–4.35), while Hispanics had a 56% higher prevalence of anemia than Whites (PR = 1.56, 95% CI = 1.38, 1.77) (Table 2). As expected, weighted unadjusted anemia prevalence was higher in women (prevalence = 7.86%, 95% CI = 7.39%, 8.35%) than in men (3.57%, 95% CI = 3.30%, 3.86%). In adjusted analysis, women were twice as likely to be anemic as men (PR = 1.98; 95% CI = 1.83, 2.13) (Table 2).
Weighted unadjusted and adjusted prevalence, difference in adjusted prevalence, adjusted PR for anemia, and linear trend across characteristics (where possible) for NHANES participants (excluding pregnant women) 1999–2020
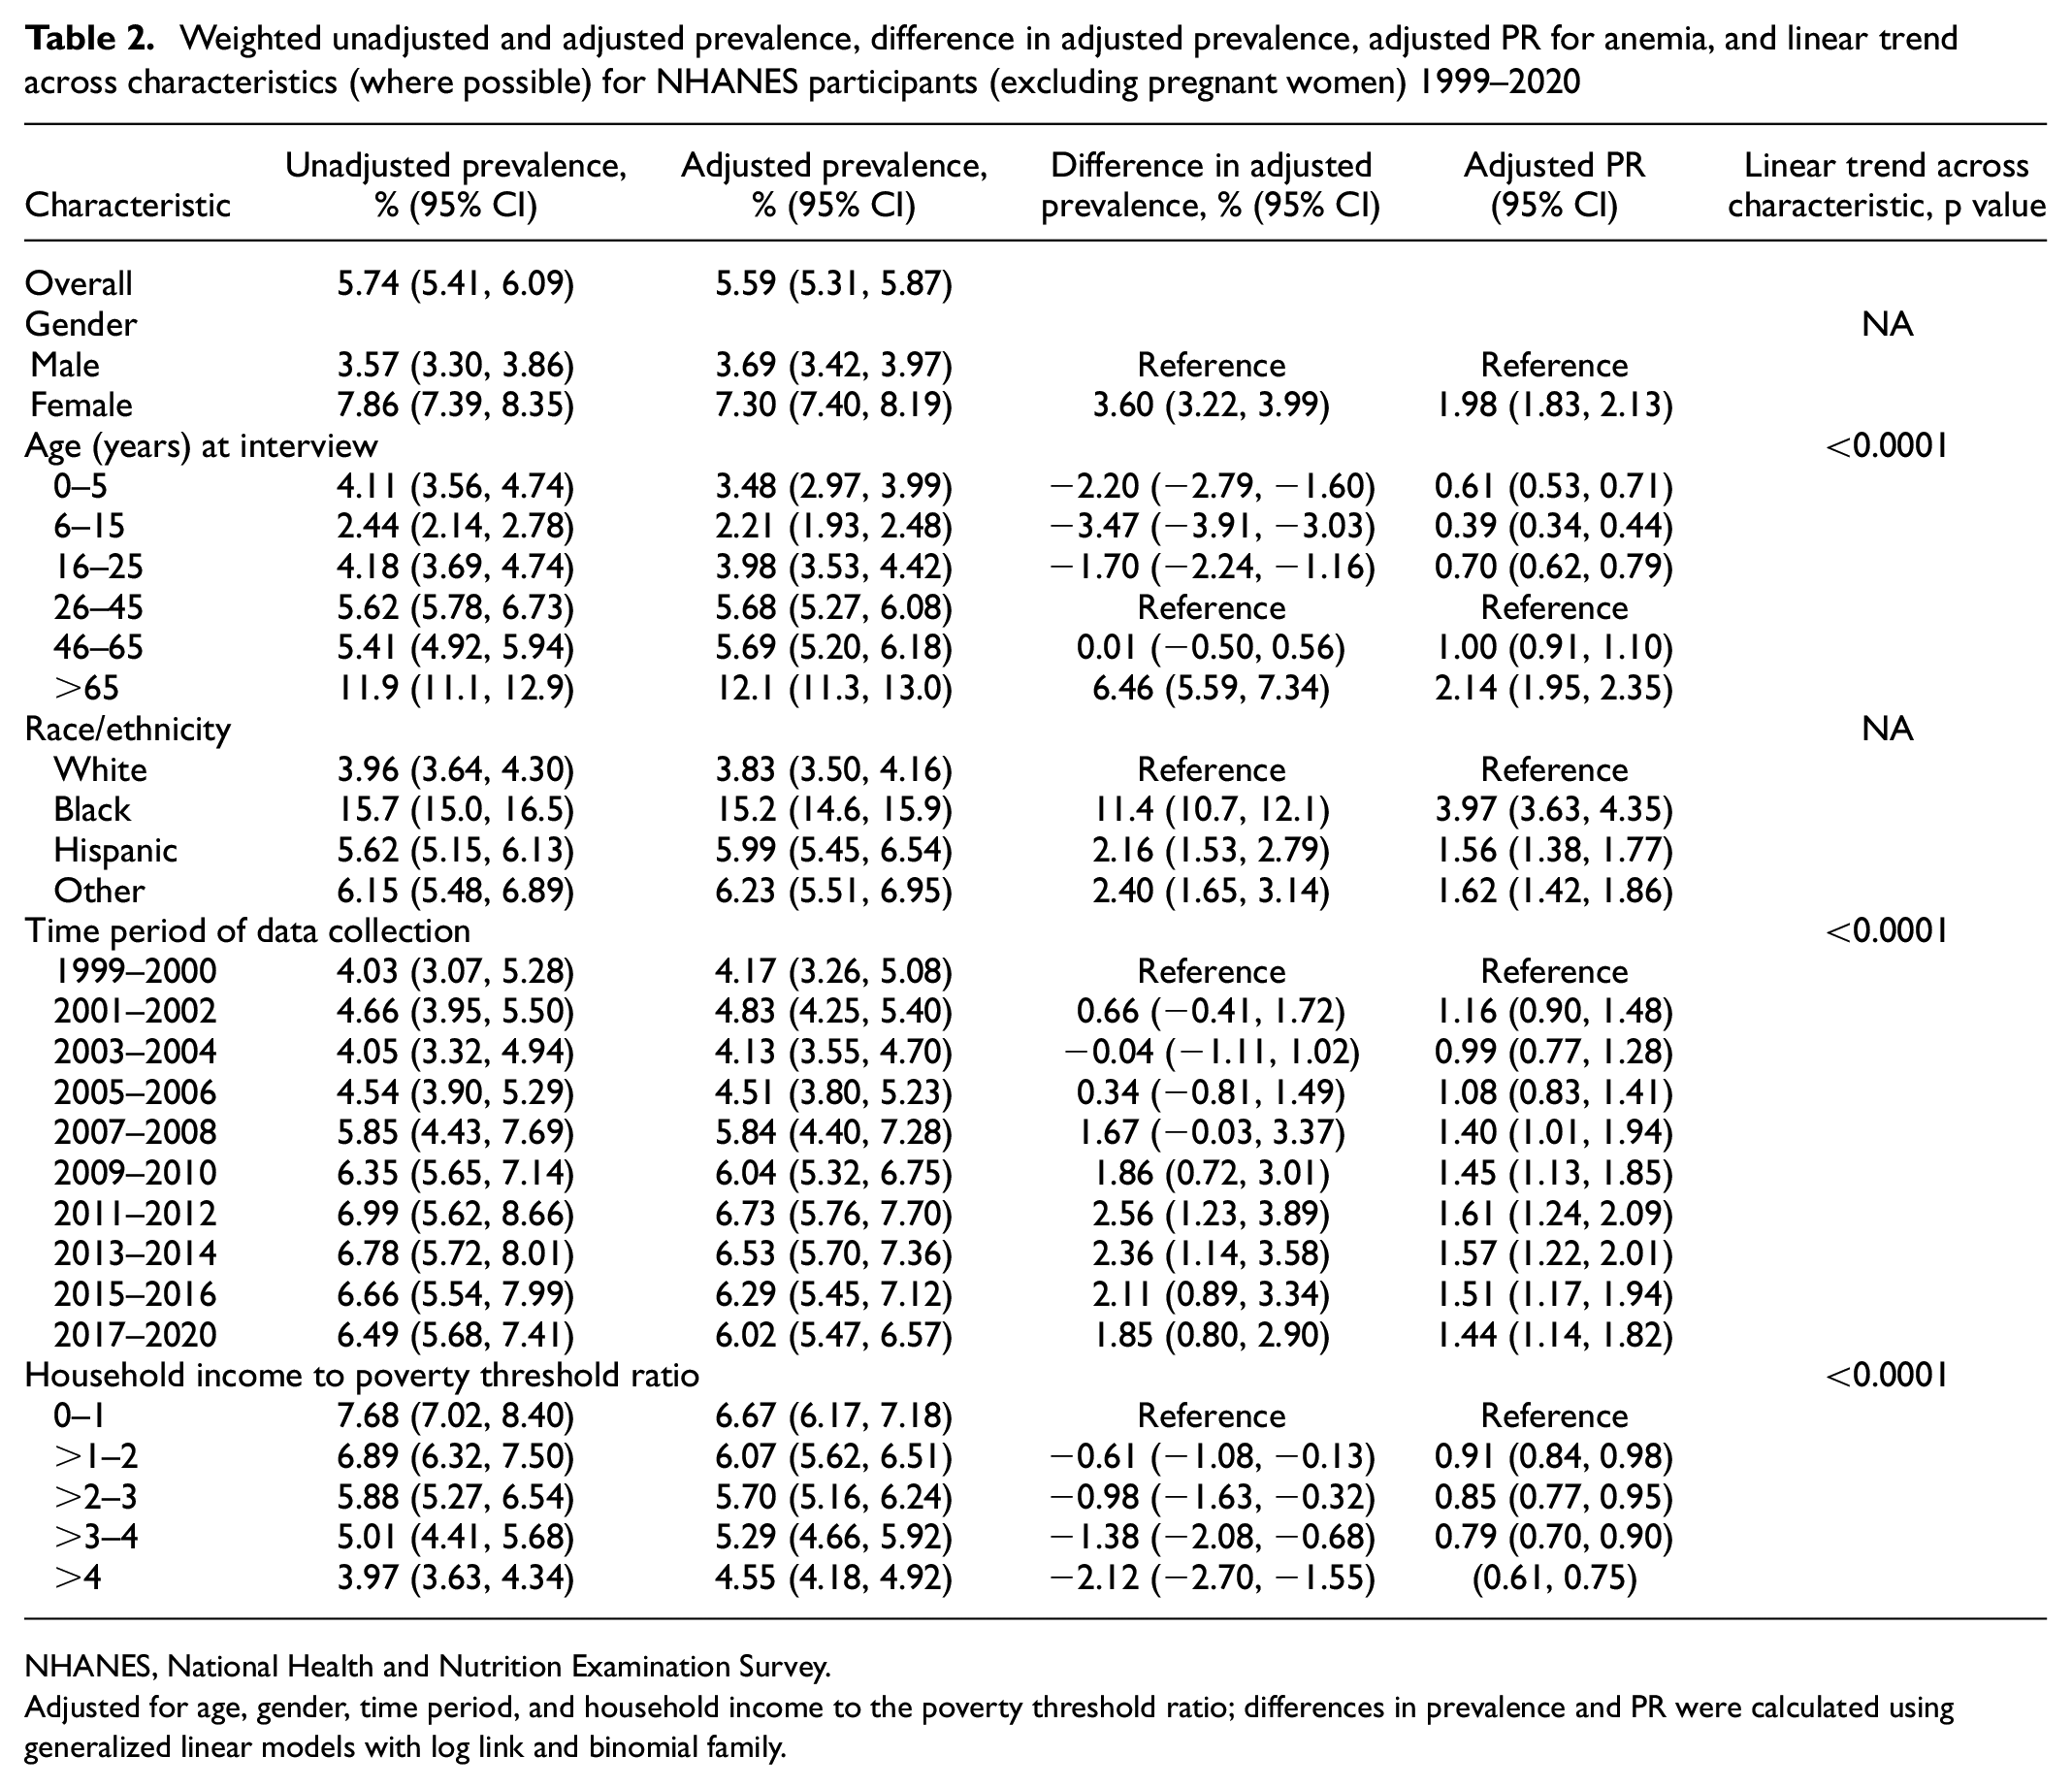
NHANES, National Health and Nutrition Examination Survey.
Adjusted for age, gender, time period, and household income to the poverty threshold ratio; differences in prevalence and PR were calculated using generalized linear models with log link and binomial family.
The lowest prevalence of anemia was noted in the 6–15 years age group (2.44%, 95% CI = 2.14%, 2.78%), and the highest prevalence was noted in the >65 years age group (11.9%, 95% CI = 11.1%, 12.9%). There was a linear trend of increase in anemia prevalence (p < 0.001 for trend). In adjusted analysis, when compared to the 26–45 age group, the prevalence of anemia was 61% lower in the 6–15 age group (PR = 0.39, 95% CI = 0.34, 0.44), and 114% higher in the >65 years age group (PR = 2.14, 95% CI = 1.95, 2.35) (Table 2). We found an inverse relationship between anemia prevalence and the HIPR (p < 0.001 for trend); participants with HIPR ≤ 1 had the highest prevalence of anemia (7.68%, 95% CI = 7.02%, 8.40%), while prevalence was lowest in participants with HIPR > 4 (3.97%, 95% CI = 3.63%, 4.34%). In adjusted analysis, those with HIPR > 4 had a 32% lower risk of anemia than those in the HIPR ≤ 1 group (adjusted PR = 0.68, 95% CI = 0.61, 0.75).
Weighted adjusted prevalence of anemia (95% CIs) by race across population characteristics for NHANES participants 1999–2020 (excluding pregnant women)
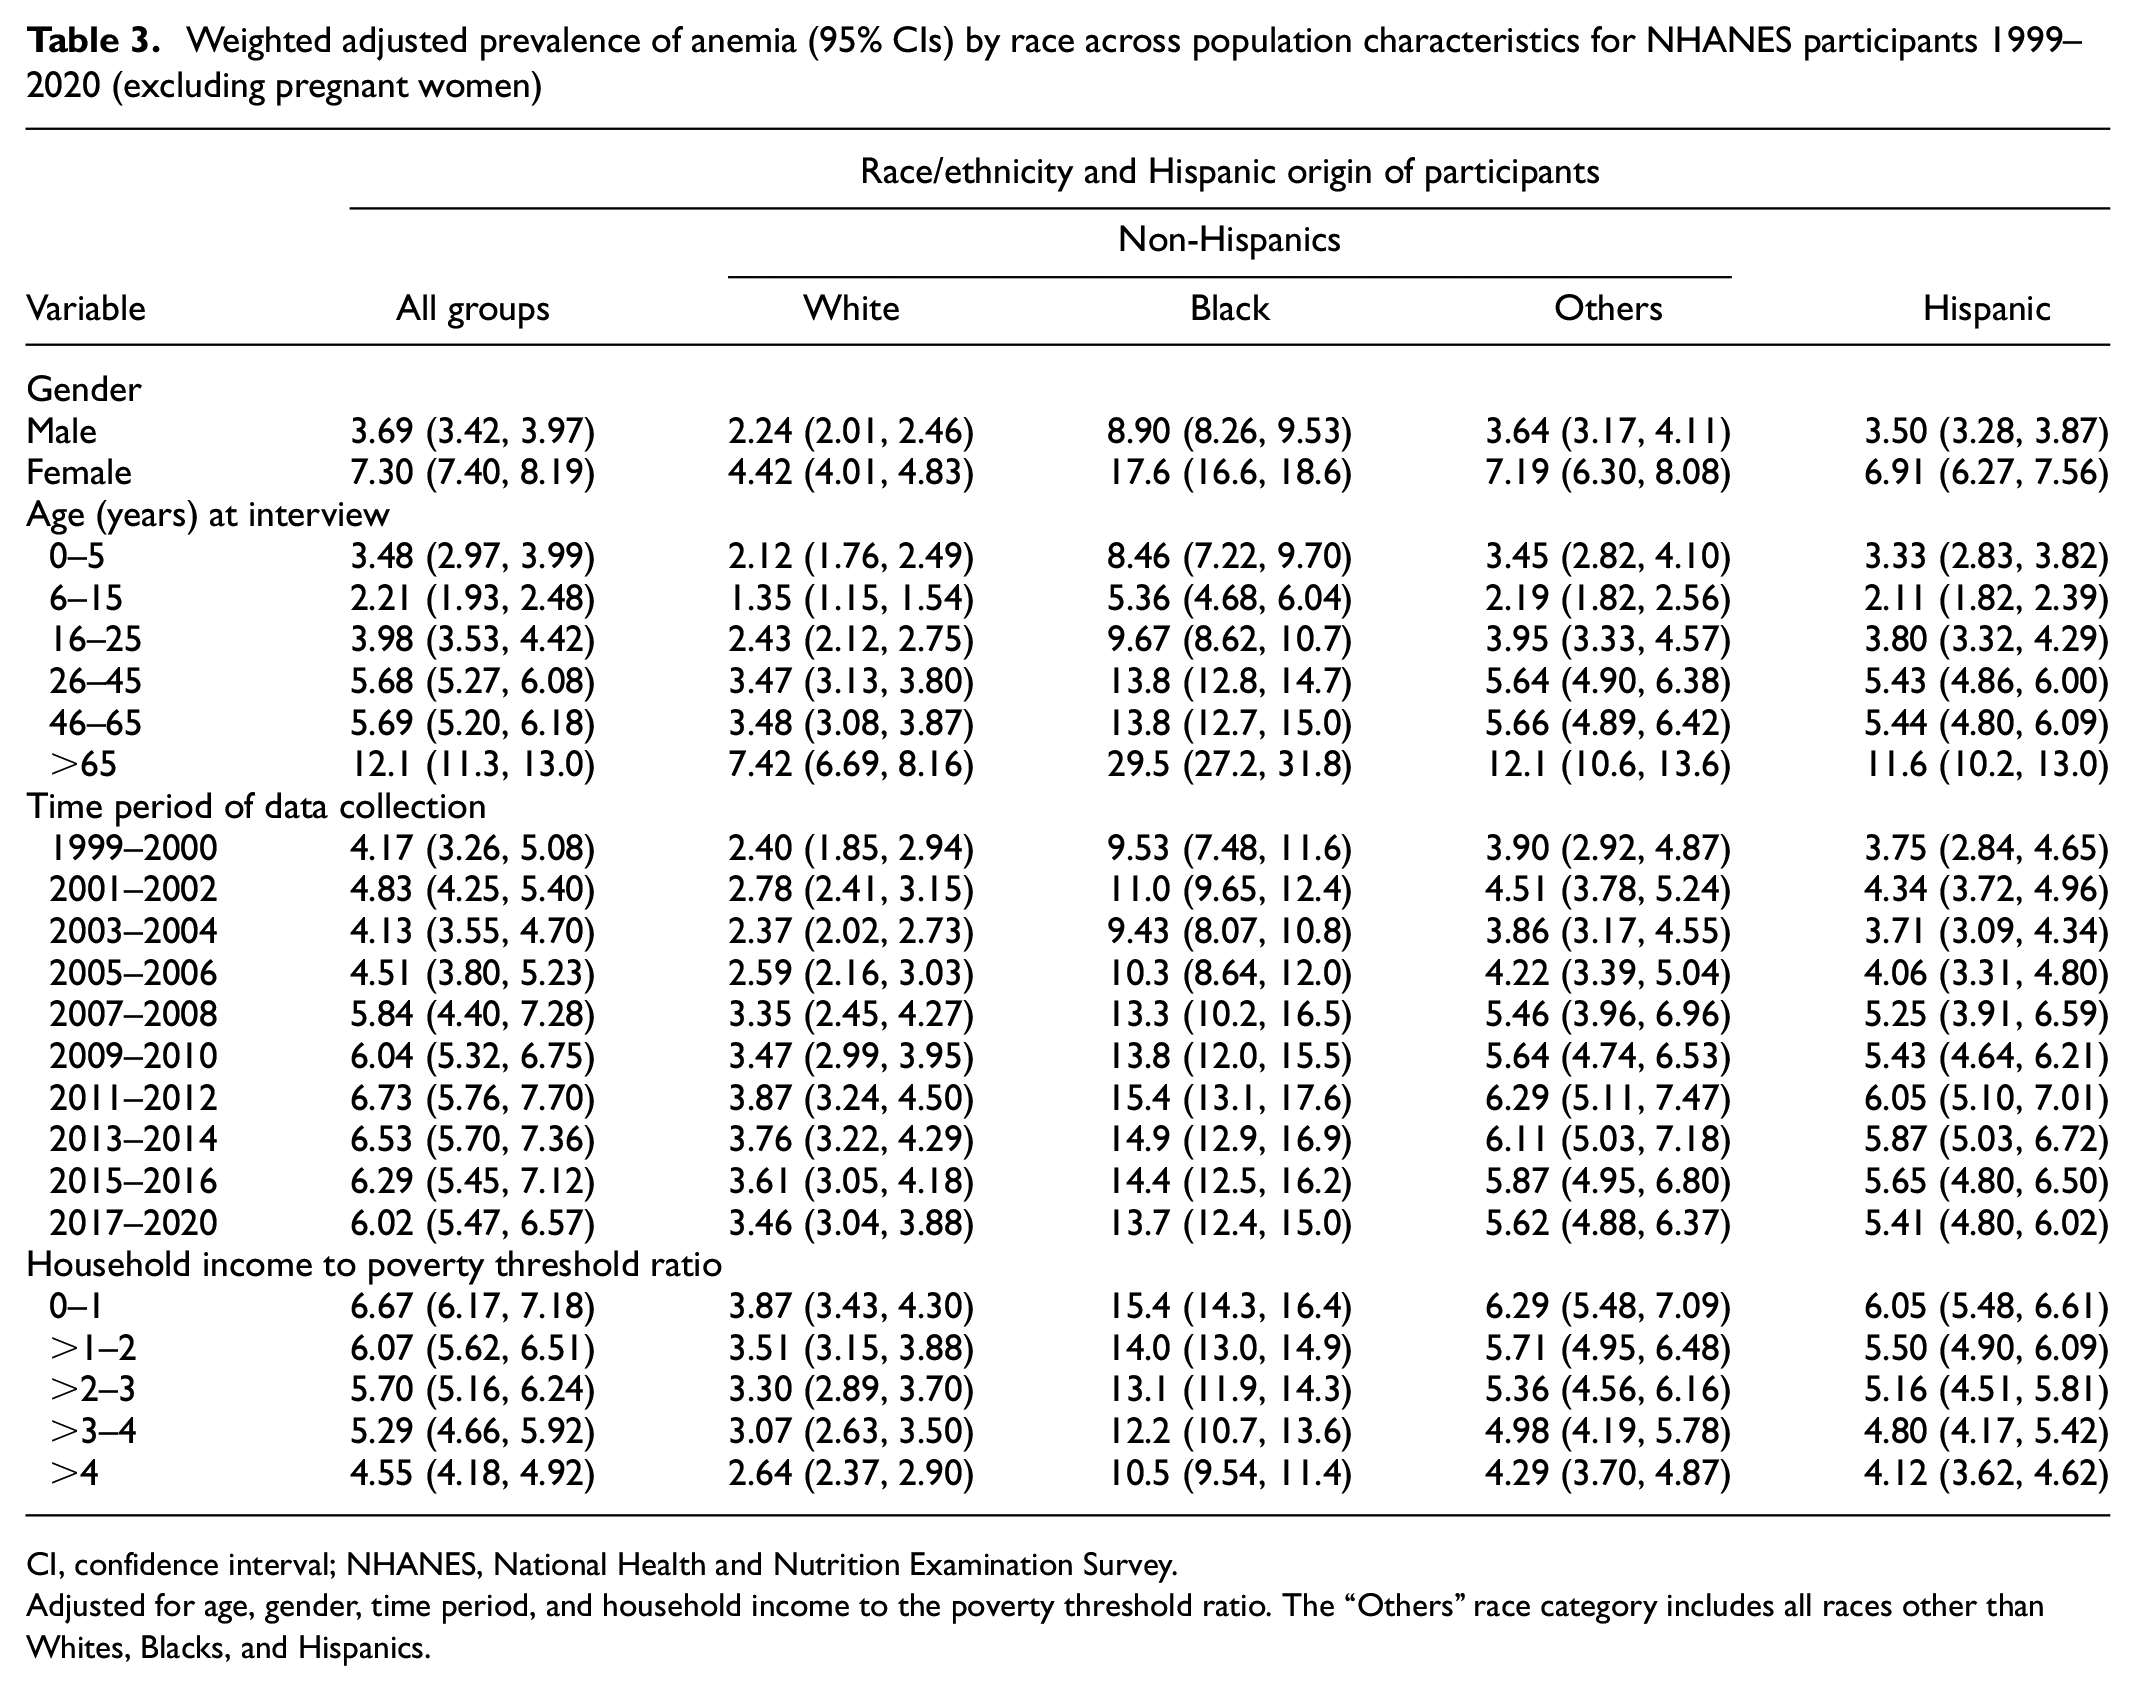
CI, confidence interval; NHANES, National Health and Nutrition Examination Survey.
Adjusted for age, gender, time period, and household income to the poverty threshold ratio. The “Others” race category includes all races other than Whites, Blacks, and Hispanics.
Anemia prevalence time trends
The prevalence of anemia increased from 4.03% during the 1999–2000 study period to 6.49% during 2017–2020. In linear adjusted models, anemia prevalence rose by 0.25% (95% CI = 1.8%, 3.4%) during each 2-year survey period (p < 0.001 for linear trend) (Table 2). We further explored if the time trends of rising anemia prevalence were different within age, gender, race/ethnicity, or HIPR groups using interaction terms in the models and found no evidence of differential anemia prevalence within these variables (Supplemental Tables 4A–D). We then included survey cycles as categories in statistical models; as compared to participants in the 1999–2000 survey cycle, the adjusted prevalence was 61% higher in the 2011–2012 cycle (PR = 1.61, 95% CI = 1.24, 2.09), while the last study cycle, 2017–2020, had a 44% higher adjusted prevalence of anemia (PR = 1.44; 95% CI = 1.14, 1.82). To explore whether the rate of anemia prevalence rise was slowing, we used a quadratic term for survey cycles; this quadratic term was negative and significant, suggesting that the rate of anemia prevalence was slowing at 0.04% per survey cycle (Supplemental Table 5). When examined by categories, between 1999–2000 and 2017–2020, there was a significant increase in the adjusted prevalence of mild (3.3% vs 4.5% p = 0.02) and moderate–severe anemia (0.9% vs 1.6%; p = 0.02) (Figure 1).
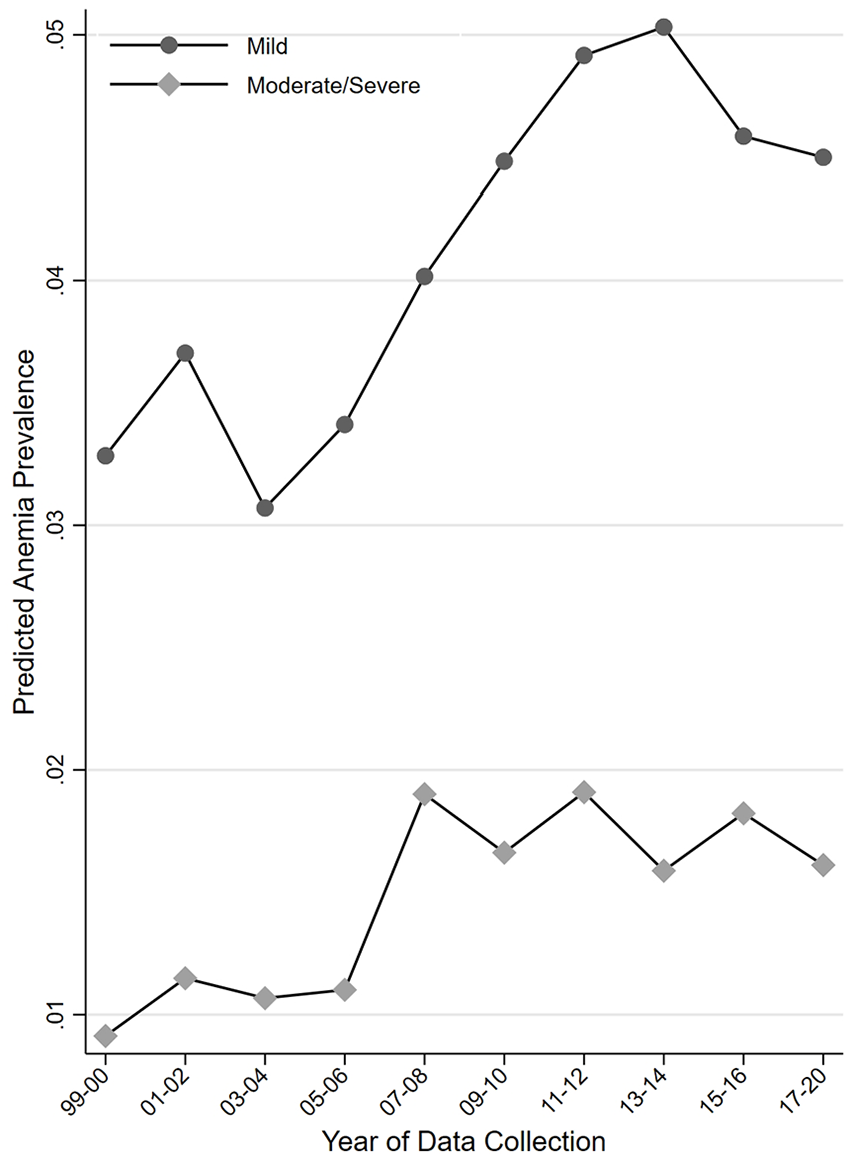
Prevalence time trends by anemia severity. The prevalence of anemia categories was predicted using a survey-adjusted multinomial logistic model adjusting for age, race/ethnicity, gender, and household income to poverty threshold ratio.
Gender modifies the relationship between anemia prevalence and race/ethnicity
As anemia prevalence differs by gender and by race/ethnicity, we examined whether gender modifies the relationship between anemia and race/ethnicity by examining an interaction effect between race/ethnicity and gender. First, with respect to racial groups, we found a significantly higher adjusted prevalence of anemia in Black men as compared to White men (PR = 3.15; 95% CI = 2.76, 3.60); there was no significant difference between White men and Hispanic men (PR = 0.84; 95% CI = 0.68, 1.02) or men from other racial groups (PR = 1.23; 95% CI = 0.97, 1.56). Second, for gender, we confirmed a significantly higher prevalence of anemia in White women than in White men in this interaction model (PR = 1.53; 95% CI = 1.34, 1.74). Third, we found that the anemia prevalence was also higher in women belonging to other racial groups than their male counterparts within the same racial group. Furthermore, as compared to the PR between White men and women, the PRs were significantly higher between Black men and women (interaction PR = 1.39; 95% CI = 1.20, 1.62), Hispanic men and women (interaction PR = 2.38; 95% CI = 1.91, 2.95), and the other-racial-group men and women (interaction PR = 1.50; 95% CI = 1.13, 1.99) (Figure 2 and Supplemental Table 6).
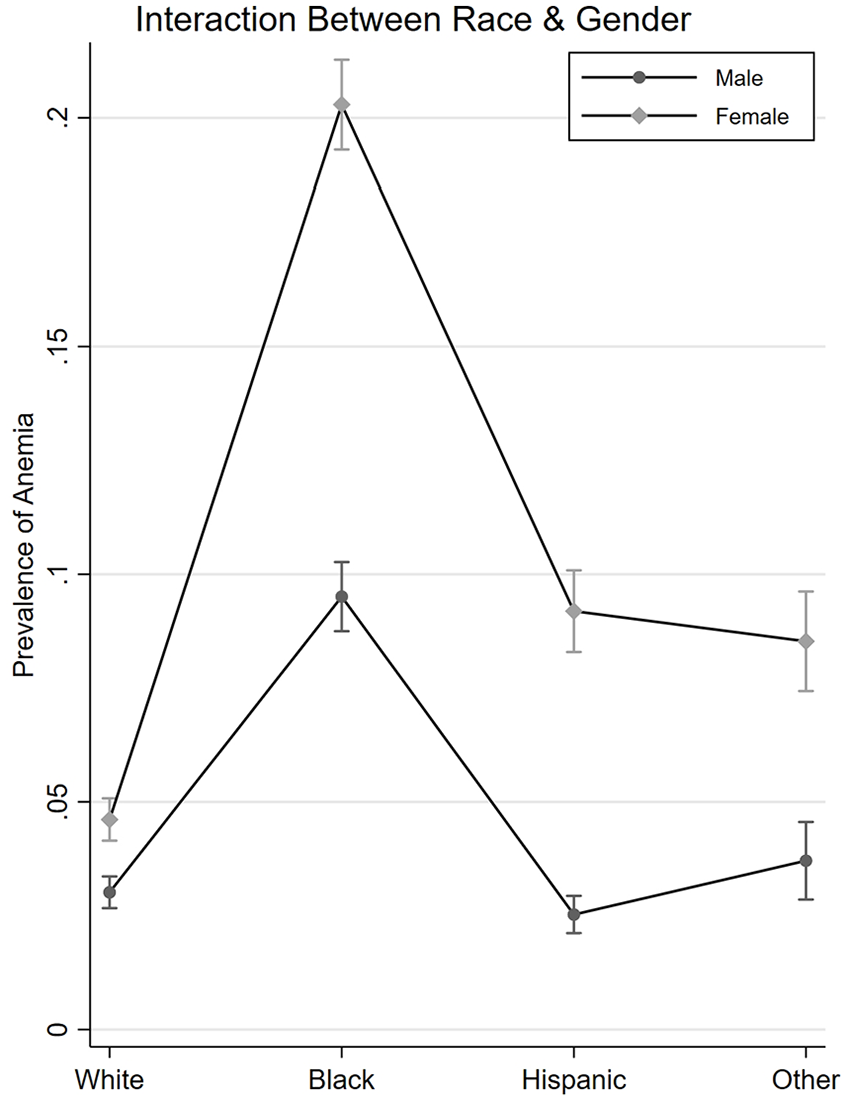
Anemia prevalence in racial groups by gender. The prevalence of anemia was predicted based on a model examining the interaction of race/ethnicity and gender on anemia with adjustment for age, study time period, and household income to poverty threshold ratio. A log scale was used for the y-axis to highlight the multiplicative change in anemia prevalence and to represent model results effectively.
Age modifies the relationship between anemia prevalence and gender
The prevalence of anemia in females was similar to males in the 0–5 years age group (3.4% vs 3.5%; p = 0.85). The anemia prevalence in females rose with age and the prevalence difference between females and males reached a maximum in the 26–45 years age group (9.6% vs 1.3%; p < 0.001). With a subsequent sharp rise in anemia prevalence in males, the difference between females and males decreased; in the >65 years age group females had lower anemia prevalence than men (11.2% vs 15.3%; p < 0.001) (Figure 3).
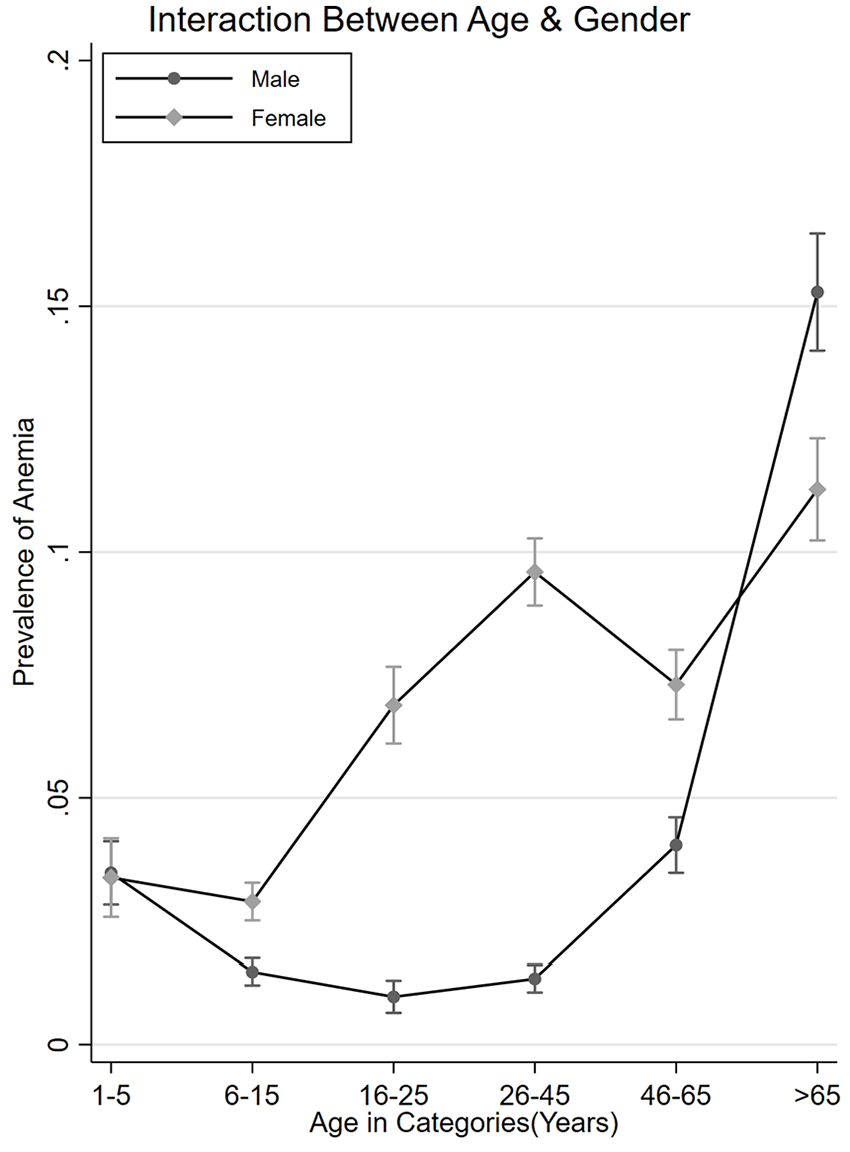
Anemia prevalence in age groups by gender. The prevalence of anemia was predicted based on a model examining the interaction of age groups and gender. The models were also adjusted for race, study time period, and household income to poverty threshold ratio.
Discussion
Using the NHANES data from 1999 to 2020, we show that anemia prevalence is higher in the elderly, in racial minorities (especially African Americans), in those living in poverty, and in women. We also found that anemia prevalence has increased during the last two decades, although the rate of increase in anemia prevalence may have stopped. These estimates of anemia prevalence were robust and were present after accounting for age, gender, race/ethnicity, and HIPR. The trend of increase in anemia prevalence was similar across age categories, racial groups, gender, or poverty status. Importantly, we report that while women had a higher prevalence of anemia than men, the difference in anemia prevalence between women and men was larger for racial minorities than the difference between White women and men.
Several factors may be responsible for the high prevalence of anemia in the United States and may selectively affect population subgroups. These may include rising income inequality resulting in poor access to healthy foods and healthcare, cultural shifts in dietary preferences, rising prevalence of hemoglobin disorders, a growing elderly population, greater use of angiotensin-converting enzyme (ACE) inhibitors, and increasing prevalence of menorrhagia in women. Income inequality has continued to rise in the United States during the past several decades, resulting in stagnant or increased mortality in low-income groups. 12 Importantly, access to healthy foods is limited in areas inhabited by racially segregated or disadvantaged people, 13 and limited access to food and food insecurity are associated with anemia in infants, toddlers, adolescents, and women of reproductive age.14–16 Cultural changes in dietary habits such as the preference for White meat (from chicken and fish) over red meat and rising veganism may contribute to anemia associated with iron or vitamin B12 deficiency. 17 The amount of heme iron is 10-fold higher in red meat than in White meat. 17 Heme iron, more readily found in animal products than plant foods, is better absorbed than non-heme iron and accounts for 95% of the functional iron in the human body. 17 Similarly, the prevalence of vitamin B12 deficiency is higher in those who follow vegan dietary restrictions than in those who do not (43% vs 3%).18,19 The prevalence of genetic hemoglobin disorders, such as sickle cell anemia and thalassemia, is rising in the United States at least partly due to better treatment and immigration from regions with higher prevalence.20,21 Another factor that may result in a rise in anemia prevalence is an increase in the elderly population. 22 The elderly have higher anemia prevalence due to various factors, and this may partly explain the increase in overall anemia prevalence during the observed period. 23 However, we did not find an interaction between age groups and overall time trend in anemia prevalence, suggesting this may be a weakly contributing factor at best. ACE inhibitor use is associated with anemia and has been rising during the last two decades. 24 Lastly, there has been an increasing prevalence of menorrhagia in women, a condition often associated with a higher prevalence of anemia. 25
Finding that the anemia prevalence is stabilizing has important implications for public health and policy, future research, and medical education. Health policy changes during the last two decades, rising focus on value-based healthcare delivery, and greater emphasis on healthcare quality may have contributed to a slowdown in the rising rate of anemia prevalence. Anemia prevalence was higher in the older age group, and as the US population ages, the prevalence of anemia threatens to increase at a higher rate. Future health policy changes may need a greater focus on the promotion of health particularly among the elderly and minorities. Identifying factors that underlie the persistently high national anemia prevalence, especially a higher prevalence of anemia in women from racial minorities, may suggest effective interventions. Consequently, discovering interventions that can lower anemia prevalence should be the focus of future research. Furthermore, prevention strategies targeting subpopulations with the highest prevalence of anemia may yield higher dividends. Prevention and identification of anemia and individualized care plans for people with anemia or at risk for anemia may need to be included as part of the routine delivery of clinical care.
This study has several strengths and some potential limitations. First, we examined national trends in anemia over a two-decade period using a nationally representative sample of the US population. Furthermore, we explored anemia trends across a range of age groups, gender, and racial groups, thus providing a comprehensive picture of anemia prevalence trends in the United States. We did not examine the underlying causes of anemia in this study, as our focus was to examine the overall and subpopulation trends in the prevalence of anemia. Although we used sampling weights to adjust for nonresponse bias, residual bias remains a possibility due to incomplete responses or nonresponses from the participants. We used HIPR as a surrogate marker of socioeconomic status; HIPR may be an imperfect measure of socioeconomic status. Lastly, several variables used in our study from the NHANES data are based on self-report and are subject to random and systematic reporting errors; however, a large nationally representative population sample and strong quality measures during data collection mitigate such errors.
Since 1999, anemia prevalence has increased among the overall US population and across all age, racial, and gender groups. Importantly, significant differences in anemia prevalence exist across age, racial, and gender groups, providing significant opportunities. Within the same racial groups, women belonging to minority groups have a relatively higher prevalence of anemia than men as compared to the PR between White women and men, highlighting the undesirable interaction of race/ethnicity and gender disparities. Nationwide efforts in clinical care and research can help prevent further increases in anemia prevalence and mitigate race/ethnicity and gender disparities.
Supplemental Material
sj-docx-1-imj-10.1177_10815589221140597 – Supplemental material for Anemia prevalence time trends and disparities in the US population: examination of NHANES 1999–2020
Supplemental material, sj-docx-1-imj-10.1177_10815589221140597 for Anemia prevalence time trends and disparities in the US population: examination of NHANES 1999–2020 by Yunjoo Hwang, Kripa R Ahuja, Syed M Haque, George F Jones, Adan Naseer, Oren Shechter, Simrah Siddiqui and Rehan Qayyum in Journal of Investigative Medicine
Footnotes
Author contributions
Concept and design: All authors. Acquisition, analysis, and interpretation of data: All authors. Drafting of the manuscript: All authors. Critical revision of the manuscript for important intellectual content: All authors. Statistical analysis: Dr. Rehan Qayyum. Supervision: Dr. Rehan Qayyum. Author Access to Data: Dr. Rehan Qayyum had full access to all the data in the study and takes responsibility for the integrity of the data and the accuracy of the data analysis.
Declaration of conflicting interests
The author(s) declared no potential conflicts of interest with respect to the research, authorship, and/or publication of this article.
Funding
The author(s) received no financial support for the research, authorship, and/or publication of this article.
Supplemental material
Supplemental material for this article is available online.
References
Supplementary Material
Please find the following supplemental material available below.
For Open Access articles published under a Creative Commons License, all supplemental material carries the same license as the article it is associated with.
For non-Open Access articles published, all supplemental material carries a non-exclusive license, and permission requests for re-use of supplemental material or any part of supplemental material shall be sent directly to the copyright owner as specified in the copyright notice associated with the article.