
Abstract
The triglyceride-glucose (TyG) index is a new reliable marker of insulin resistance (IR) and has recently been reported to be associated with renal dysfunction and contrast-induced nephropathy (CIN). Our aim in this study is to investigate the relationship between the TyG index and CIN in non-diabetic non-ST elevation acute myocardial infarction (NSTEMI) patients. The study included 272 non-diabetic patients who applied with NSTEMI and underwent coronary angiography (CAG). Patient data were divided into quartiles according to the TyG index: Q1: TyG < 8.55; Q2: 8.55 ≤ TyG ≤ 8.87; Q3: 8.88 ≤ TyG ≤ 9.29; and Q4: TyG > 9.29. Baseline characteristics, laboratory measurements, angiography data, and the incidence of CIN were compared between the groups. CIN was observed in 18 (6.6%) patients in the study. The incidence of CIN was lowest in the Q1 group and highest in the Q4 group (1 (1.5%) in Q1; 3 (4.4%) in Q2; 5 (7.4%) in Q3; 9 (13.2%) in Q4; p = 0.040). TyG index was found to be an independent risk factor for the development of CIN in multivariate logistic regression analysis (odds ratio = 6.58; confidence interval (CI) = 2.12–20.40; p = 0.001). TyG index value of 9.17 was identified as an effective cut-off point for the prediction of CIN (Area under the curve: 0.712, CI: 0.590–0.834, p = 0.003), and it had a sensitivity of 61% and a specificity of 72%. The results of this study showed that a high TyG index increases the incidence of CIN after CAG in non-diabetic NSTEMI patients and is an independent risk factor for the development of CIN.
Keywords
Contrast-induced nephropathy (CIN), an undesirable side effect of coronary angiography and percutaneous coronary intervention procedures, is defined as a decrease in renal function after intravascular injection of the contrast medium. Insulin resistance (IR) is considered a prediabetic process. The triglyceride-glucose (TyG) index has emerged as a new IR marker and it is an easily accessible, inexpensive, and simple method. It has been previously reported that a high TyG index is associated with CIN.
In our study, we found that a high TyG index increased the incidence of CIN after CAG in non-ST elevation acute myocardial infarction patients without diabetes mellitus, anemia, and chronic kidney disease. Our study is the first prospective study investigating the relationship between the TyG index and CIN in non-diabetic patients.
CIN is associated with increased mortality, permanent renal damage, prolonged hospitalization, and higher healthcare expenditures. The TyG index can be a very simple, inexpensive, and easily accessible new potential marker to identify patients at high risk for the development of CIN.
Introduction
Coronary artery disease (CAD) is a prevalent health problem worldwide. Coronary angiography (CAG) and percutaneous coronary intervention (PCI) play a crucial role in the diagnosis and treatment of CAD, especially in patients with acute coronary syndrome. Contrast-induced nephropathy (CIN), an undesirable side effect of CAG and PCI procedures, is defined as a decrease in renal function after intravascular injection of contrast medium. 1 Although most cases of CIN are self-limiting; it is associated with increased mortality, permanent renal damage, prolonged hospitalization, and higher healthcare expenditures.2–4 The potential risk factors for developing CIN include pre-existing chronic kidney disease (CKD), diabetes mellitus (DM), congestive heart failure (CHF), advanced age, pre-procedural dehydration, hypotension, anemia, contrast agent type and volume, concomitant use of nephrotoxic agents, and female gender. 5
Insulin resistance (IR) is characterized by decreased metabolic responses and decreased sensitivity of cells to insulin and is associated with a consequent higher insulin concentration. 6 Thus, IR is considered a prediabetic process. Generally, the hyperinsulinemic–euglycemic clamp test and the homeostatic model of IR (HOMA-IR) test are used to detect IR.7,8 Recently, the triglyceride-glucose (TyG) index has emerged as a new IR marker, and it is an easily accessible, inexpensive, and simple method. In fact, it has been suggested in a recent study that it is a stronger predictor than HOMA-IR in predicting type 2 DM. 9
Prediabetes is associated with decreased kidney function. 10 In addition, it has been previously reported that IR increases the risk of CIN after elective PCI. 11 Two recently published studies reported that a high TyG index is also associated with CIN.6,12
To the best of our knowledge, the relationship between the TyG index and CIN has not been investigated in patients with non-ST elevation myocardial infarction (NSTEMI) without DM. Our aim in this study was to investigate the relationship between the TyG index and CIN in patients presenting with NSTEMI without DM, anemia, and CKD.
Material and methods
Design and study population
This study was a prospective cohort study that included patients presenting with NSTEMI and undergoing CAG between March 2022 and August 2022, conducted in a tertiary healthcare institution. All patients were informed before inclusion in the study and an informed consent form was signed. The exclusion criteria were as follows; (1) younger than 18 years old; (2) DM; (3) anemia (hemoglobin level < 12 g/dL); (4) CKD with estimated glomerular filtration rate (eGFR) < 60 mL/min/1.73 m2; (5) recent exposure to contrast agent or nephrotoxic agency (within 7 days of enrollment); (6) severe liver failure, malignancy, and chronic inflammatory disease; (7) history of coronary artery bypass graft; (8) cardiogenic shock or persistent hypotension (<90/60 mmHg); (9) CHF with ejection fraction (EF) ≤%40 or severe valvular heart disease; (10) fasting triglyceride (TG) level ≥ 500 mg/dL or use of fenofibrate; (11) lack of data on serum creatinine during the 72 h after the procedure; and (12) patients with exposed to contrast agent again during the 72 h after the procedure.
Two hundred seventy-two consecutive patients who met the study criteria were included in the study. The patients were divided into four quartile groups according to their TyG index levels; Q1 (n = 68, TyG index < 8.55), Q2 (n = 68, 8.55 ≤ TyG index ≤ 8.87), Q3 (n = 68, 8.88 ≤ TyG index ≤ 9.29), and Q4 (n = 68, TyG index > 9.29).
The study was also approved by the Institutional Review Board and was conducted following the Helsinki Declaration.
Biochemical analysis
Blood samples were obtained from the antecubital vein after 12 h of fasting. All laboratory measurements were obtained from the blood taken before CAG. Fasting plasma glucose (FPG), TG, serum creatinine levels, and other biochemical parameters were measured in blood samples using a Beckman Coulter AU 5800 autoanalyzer (Beckman Coulter Inc., CA, USA). Post-angiography creatinine level was measured for 72 h to follow the development of CIN. The TyG index was calculated using the following formula: TyG = ln (fasting TG (mg/dL) × FPG (mg/dL)/2). 13
Coronary angiography
CAG procedures were performed by experienced cardiologists on a Siemens CAG device (Siemens Healthineers, GmbH, Erlangen, Germany). PCI was performed on eligible patients in line with the current European Society of Cardiology guidelines. A contrast agent containing iohexol was used during all CAG procedures. The number of vessels with lesions (stenosis grade ≥ 50%), the amount of contrast agent used (cc), the number of patients who underwent PCI, the number of implanted stents, and the stent length (total length of implanted stents) were recorded. All patients received a loading dose of aspirin (300 mg) and clopidogrel (600 mg) or ticagrelor (180 mg) before the procedure. In addition, unfractionated heparin was administered at a dose of 100 U/kg during the PCI procedure. A standard prophylactic hydration protocol was applied to all patients (intravenous 0.9% NaCl administered at 3–4 mL/kg/h 4 h before and 4 h after contrast injection). 12
Definition and measurements
CIN was defined as more than a 25% or 0.5 mg/dL increase in serum creatinine from baseline during the first 48–72 h after the contrast agent was administered. 14 eGFR was calculated using the Modification of Diet in Renal Disease study equation. 15 Body-mass index (BMI) was calculated by dividing weight in kilograms by the square of height in meters. DM was defined according to the following criteria: (1) history of DM or use of antidiabetic agents; (2) FPG value ≥126 mg/dL; (3) occasional plasma glucose value of ≥200 mg/dL; (4) oral glucose tolerance test 2-h value in venous plasma ≥200 mg/dL; and (5) HbA1c ≥ 6.5%. 16 Hypertension was defined as a previous diagnosis of hypertension or use of antihypertensive medication, or systolic blood pressure (SBP) ≥140 mmHg or/and diastolic blood pressure ≥90 mmHg. Blood pressures were measured three times after a 5-min rest using a mercury manometer. An average of three measurements was taken into account. EF was measured using the Simpson method by two experienced cardiologists using an echocardiography device (EPIQ 7, Philips Medical System, Chicago, USA).
Statistical analysis
Data were analyzed using SPSS 17 (SPSS Inc., Chicago, IL, USA) package software for Windows. Results were expressed as mean ± standard deviation for normally distributed data, as median (min–max) for non-normally distributed data, and as a percentage (%) for categorical data. The Kolmogorov–Smirnov normality test was used to determine the distribution pattern of the data. Normally distributed variables were compared using the One-Way analysis of variance (ANOVA) test, whereas non-normally distributed variables were compared using the Kruskal–Wallis H test. Categorical data were compared using the chi-square test. Multivariate logistic regression analysis was performed using variables with p < 0.25 in univariate logistic regression analysis to identify independent risk factors contributing to the development of CIN. FPG and TG values were not evaluated due to high collinearity with the TyG index in the multivariate logistic regression analysis. Hosmer–Lemeshow statistics were used to evaluate the compatibility of the model. The Nagelkerke pseudo-R 2 test was used to evaluate the consistency between variables. Receiver operating characteristic (ROC) analyses were performed to determine the TyG index value associated with CIN. The area under the curve (AUC), cut-off value, sensitivity, specificity, and confidence interval (CI) were determined by ROC analyses. p values < 0.05 were accepted as statistically significant.
Results
The study cohort comprised 272 patients (216 males, 56 females) with a mean age of 60.47 ± 12.25 years. The number of patients undergoing PCI in the study population was 237 (87.1%). Fifty-six percent of the patients were current smokers, 60.3% had hypertension, and 23.5% had a history of CAD. The mean TyG index, median FPG, and median TG were 8.90 ± 0.55, 109 mg/dL, and 133.50 mg/dL, respectively. The patients were divided into four quartile groups according to their TyG index levels; Q1 (n = 68, TyG index < 8.55), Q2 (n = 68, 8.55 ≤ TyG index ≤ 8.87), Q3 (n = 68, 8.88 ≤ TyG index ≤ 9.29), and Q4 (n = 68, TyG index > 9.29). The patients in the Q4 group were younger, and also had higher BMI, FPG, and TG values. The groups were similar in terms of other demographic data, angiographic data, and medical treatment (Table 1). CIN was observed in 18 (6.6%) patients. The incidence of CIN was lowest in the Q1 group and highest in the Q4 group (1 (1.5%) in Q1; 3 (4.4%) in Q2; 5 (7.4%) in Q3; 9 (13.2%) in Q4; p = 0.040) (Figure 1, Table 1).
Baseline characteristics in four groups with different TyG levels.
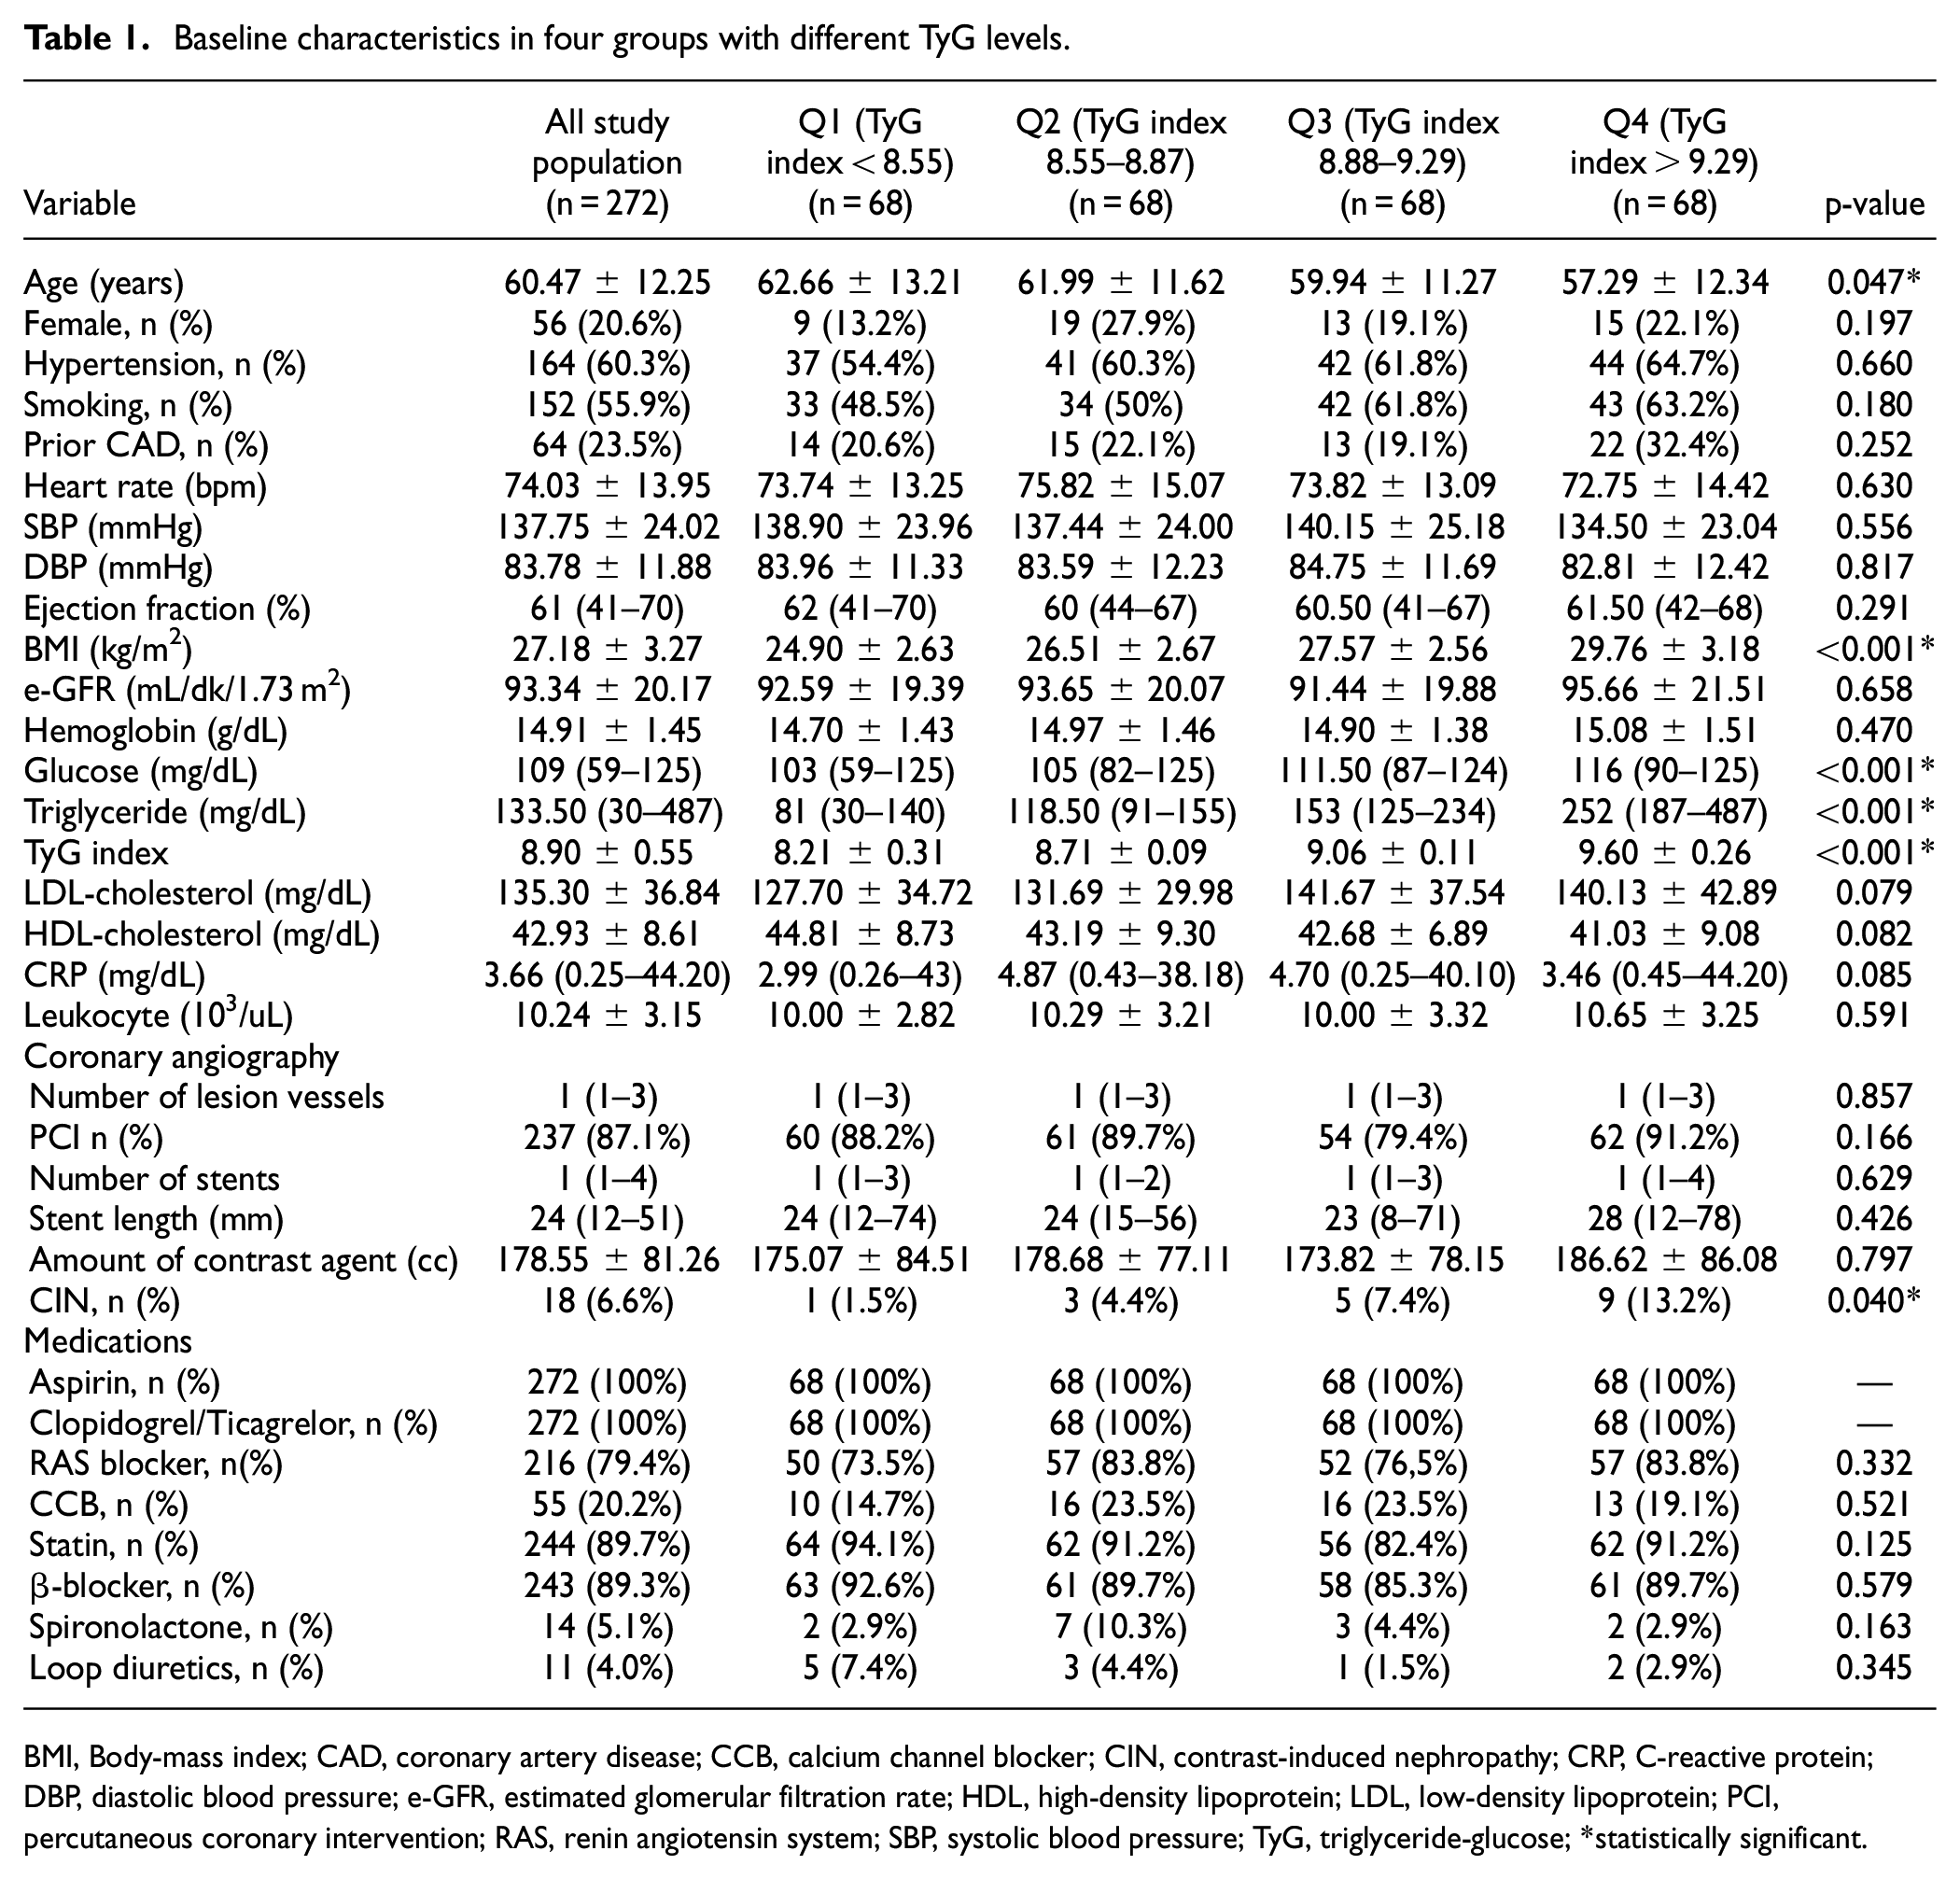
BMI, Body-mass index; CAD, coronary artery disease; CCB, calcium channel blocker; CIN, contrast-induced nephropathy; CRP, C-reactive protein; DBP, diastolic blood pressure; e-GFR, estimated glomerular filtration rate; HDL, high-density lipoprotein; LDL, low-density lipoprotein; PCI, percutaneous coronary intervention; RAS, renin angiotensin system; SBP, systolic blood pressure; TyG, triglyceride-glucose; *statistically significant.
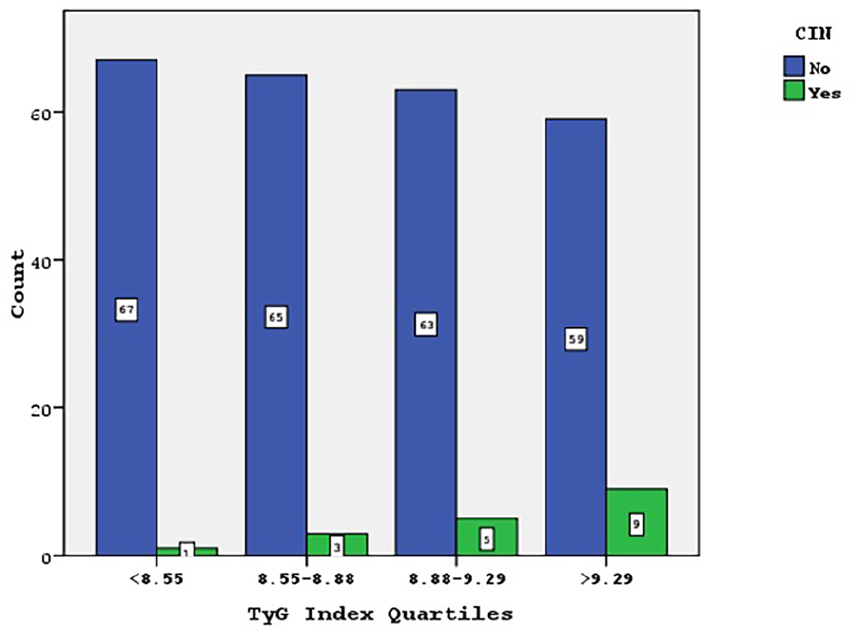
CIN distribution in TyG index quartiles.
Univariate and multivariate logistic regression analyses were performed to determine the independent predictors of CIN in the study population. The variables with p < 0.25 in the univariate logistic analysis (age (p = 0.026), hypertension (p = 0.127), eGFR (p = 0.026), TyG index (p = 0.001), low-density lipoprotein cholesterol (p = 0.237), number of lesion vessels (p = 0.189), amount of contrast agent (p = 0.020)) were evaluated in multivariate logistic regression analysis. TyG index (odds ratio (OR) = 6.58; CI = 2.12–20.40; p = 0.001), age (OR = 1.06; CI = 1.01–1.12; p = 0.023), and amount of contrast agent (OR = 1.01; CI = 1.00–1.01; p = 0.018) were found as independent variables (Table 2).
Univariate and multivariate logistic regression analysis for contrast-induced nephropathy.
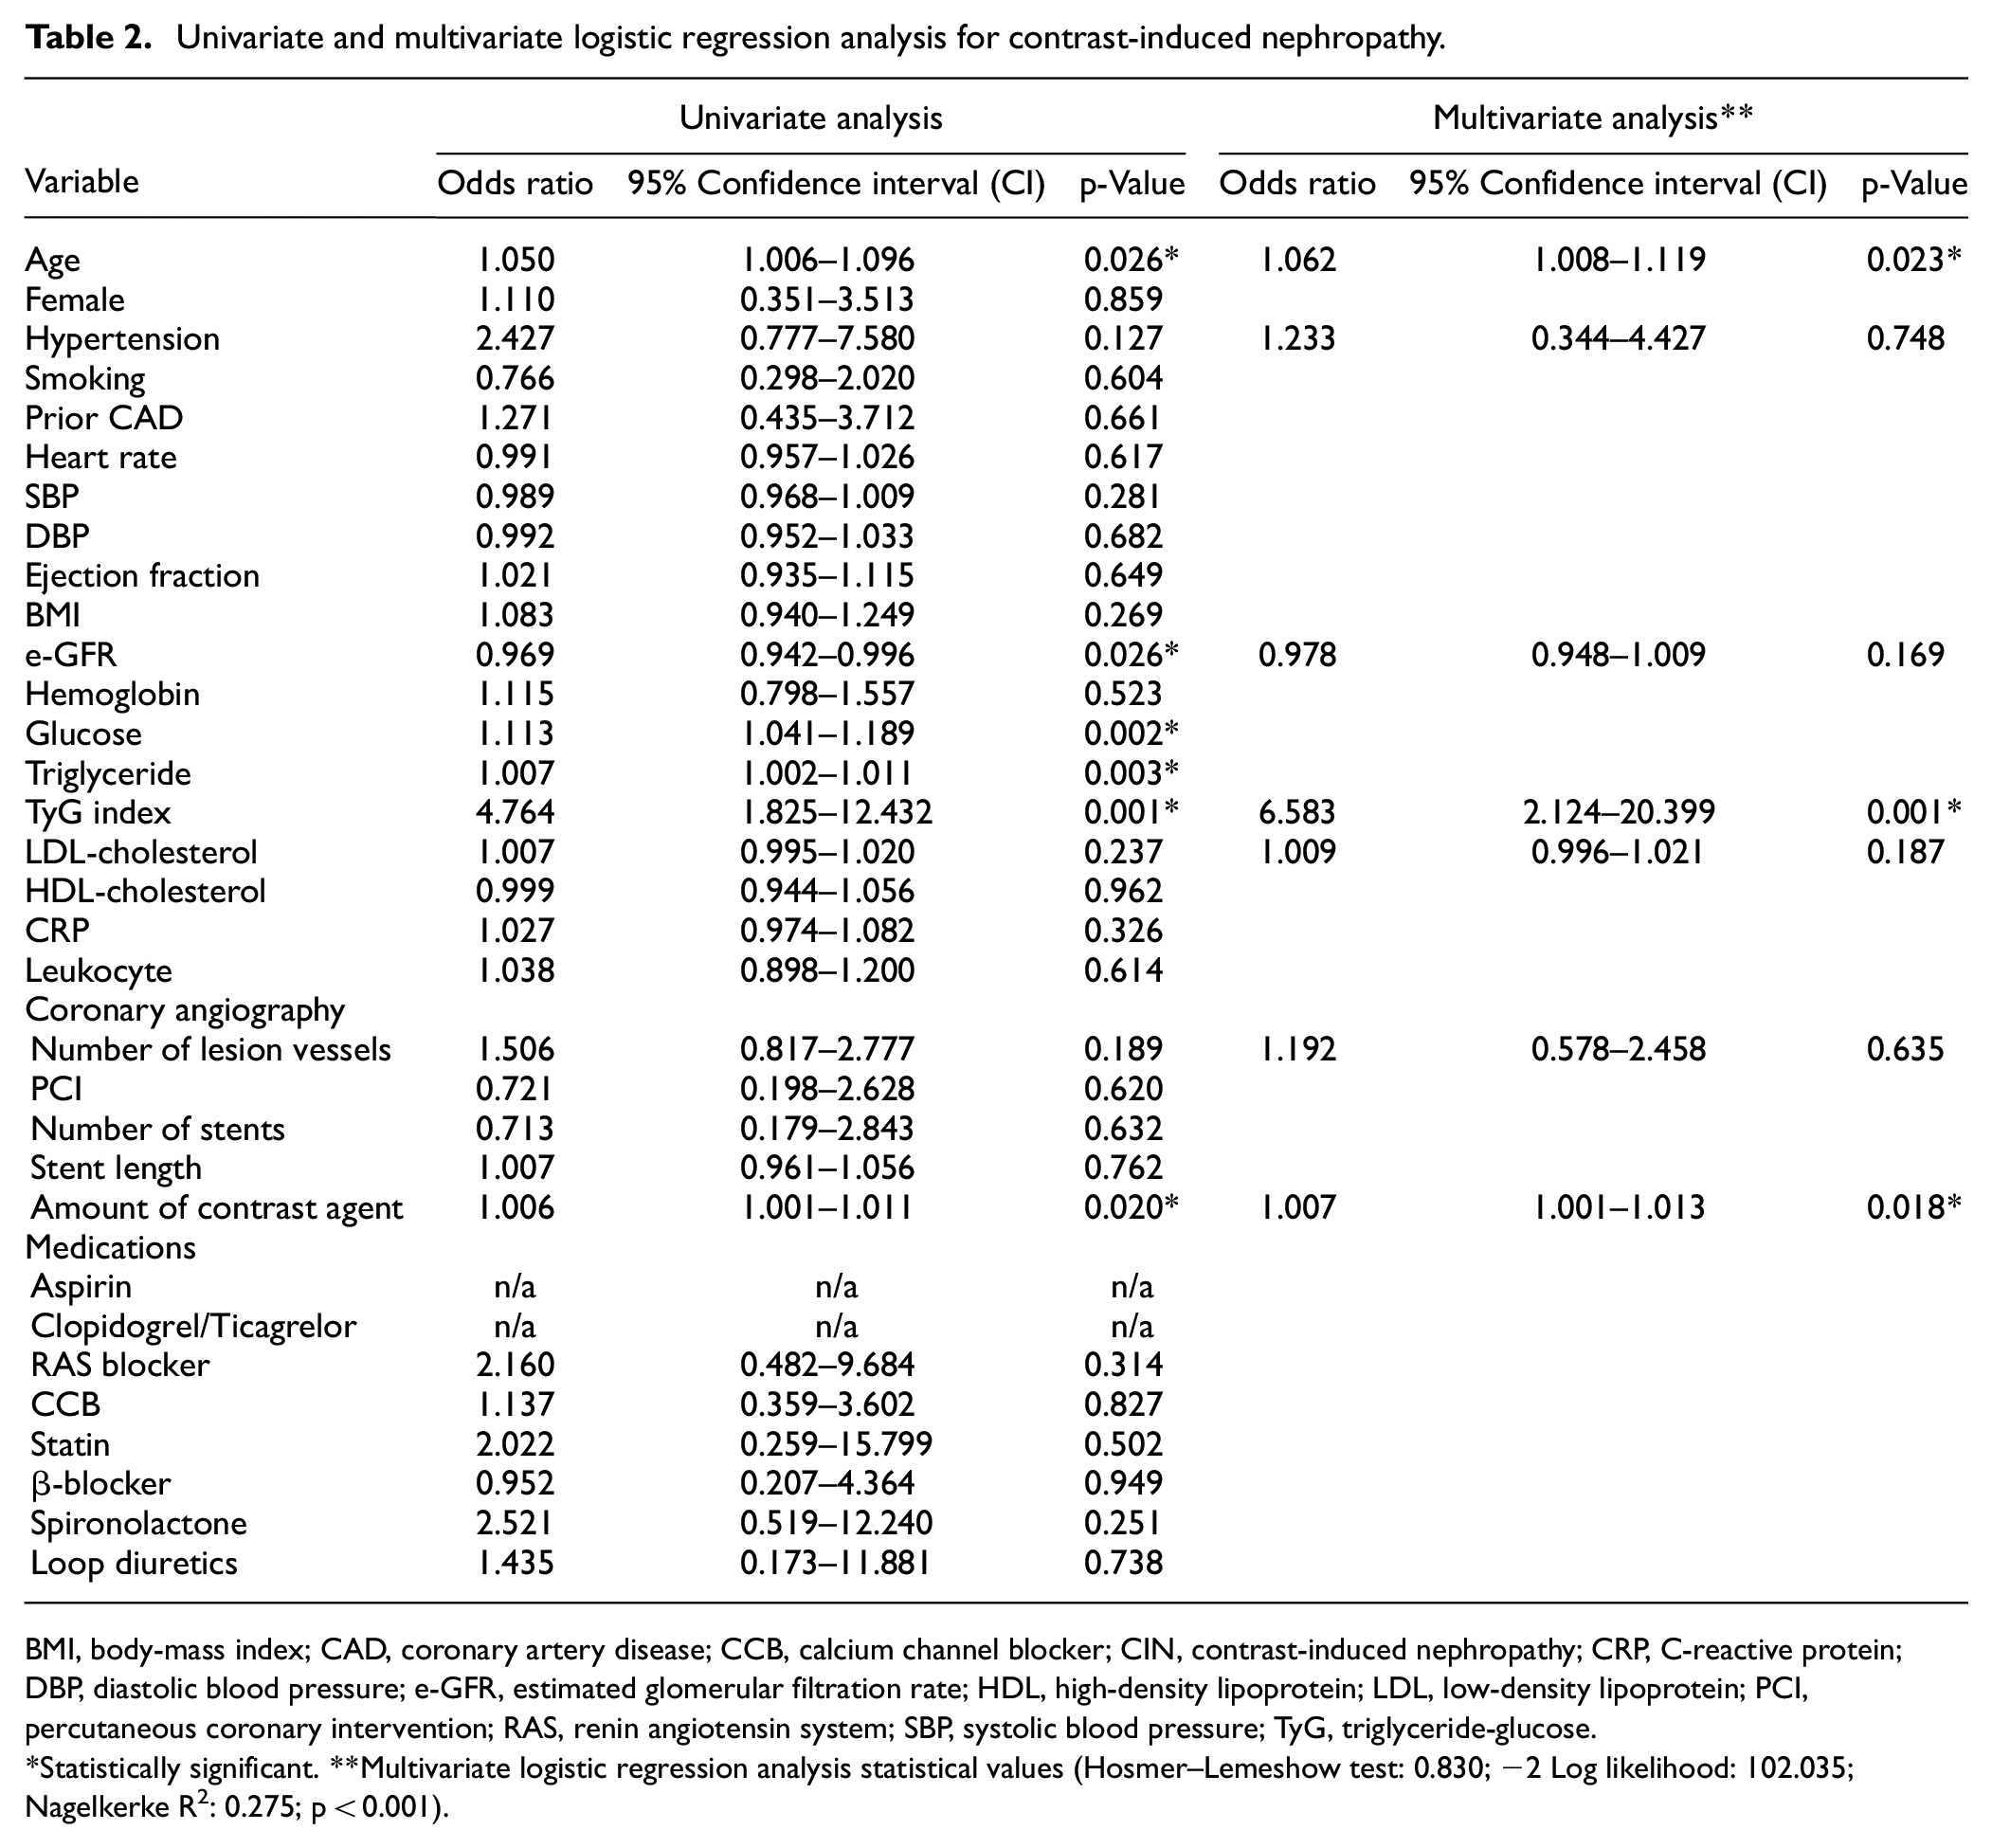
BMI, body-mass index; CAD, coronary artery disease; CCB, calcium channel blocker; CIN, contrast-induced nephropathy; CRP, C-reactive protein; DBP, diastolic blood pressure; e-GFR, estimated glomerular filtration rate; HDL, high-density lipoprotein; LDL, low-density lipoprotein; PCI, percutaneous coronary intervention; RAS, renin angiotensin system; SBP, systolic blood pressure; TyG, triglyceride-glucose.
Statistically significant. **Multivariate logistic regression analysis statistical values (Hosmer–Lemeshow test: 0.830; −2 Log likelihood: 102.035; Nagelkerke R2: 0.275; p < 0.001).
ROC analysis was performed to define the AUC of the TyG index value for predicting CIN. The TyG index value of 9.17 was identified as an effective cut-off point for the prediction of CIN (AUC: 0.712, CI: 0.590–0.834, p = 0.003), and it had a sensitivity of 61% and a specificity of 72% (Figure 2).
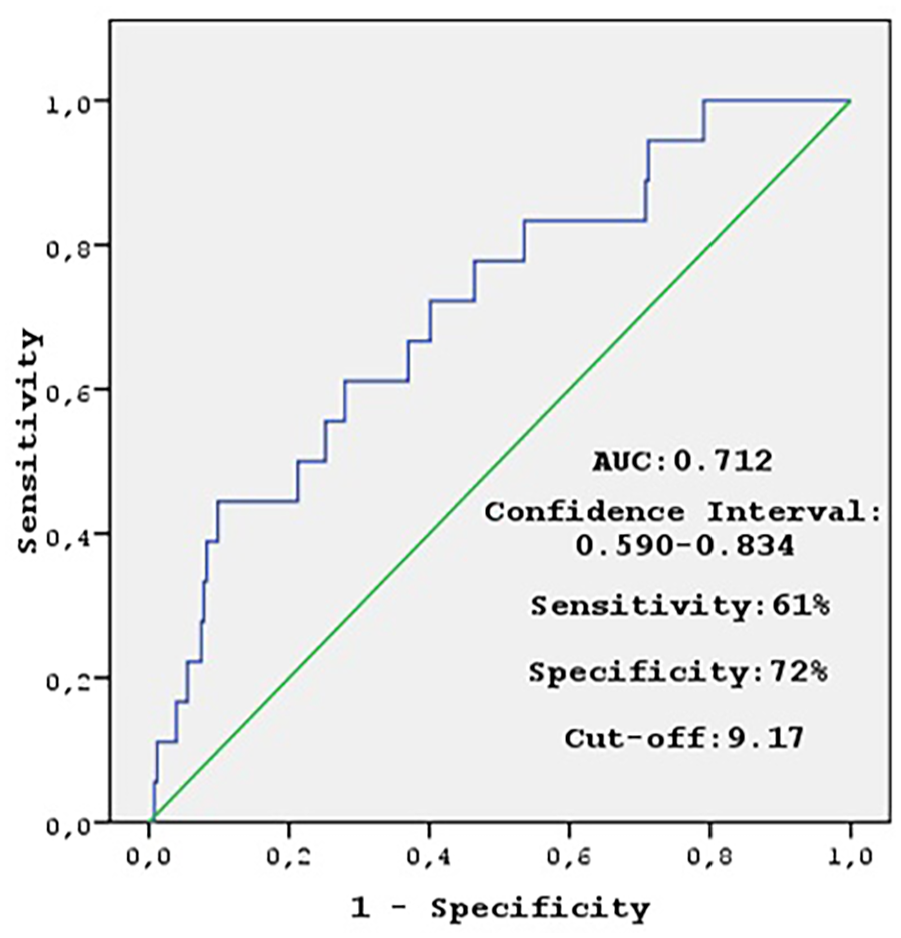
The TyG index value which can predict CIN.
Discussion
In this study, we found that an increased TyG index is associated with the development of CIN in non-diabetic NSTEMI patients and the TyG index is one of the independent risk factors predicting CIN. Additionally, we determined the cut-off value for the TyG index predicting the development of CIN.
IR results from a combination of genetic and environmental factors and is associated with hyperlipidemia, hyperinsulinemia, and hyperglycemia. 17 IR is a common feature of most types of metabolic disorders, such as obesity, metabolic syndrome, dyslipidemia, cardiovascular diseases, non-alcoholic fatty liver disease, and polycystic ovary syndrome. 18 Additionally, it has been reported in previous studies that IR has harmful effects on renal function and increases the risk of CIN after elective PCI.10,11 The TyG index has recently emerged as an effective marker of IR, and its measurement is simple, inexpensive, and accessible. 19 Recently, several studies have revealed the negative effects of an increased TyG index on renal function.20–22 In a population-based longitudinal study, Okamura et al. showed that the TyG index predicted the development of CKD. 20 In another study by Liu et al., it was reported that the TyG index is associated with diabetic nephropathy. 21 Fritz et al. reported that the TyG index was associated with the risk of developing end-stage kidney disease in a large-scale population study conducted in Austrian adults. 22 Additionally, two recently published articles have reported that the TyG index is associated with CIN.6,12 Qin et al., in a prospectively conducted study of 928 patients, found that the TyG index was closely associated with the development of CIN in type 2 DM patients and was an independent risk factor for CIN. 12 Similarly, Li et al. reported that a high TyG index was associated with the development of CIN in a retrospective study of patients with non-ST elevation acute coronary syndrome. 6 Although the results of these two studies are quite compatible with our study, our study differs from other studies in some aspects. Our study was conducted prospectively in patients with NSTEMI. Additionally, this study is the first to reveal the relationship between the TyG index and CIN in non-diabetic patients, prospectively. Another factor that sets our study apart is that diseases known to contribute to the development of CIN such as anemia, CKD, cardiogenic shock, and CHF were excluded from the study.
The most likely explanation for the relationship between the TyG index and CIN is the negative effects of IR on renal functions. IR increases glomerular hydrostatic pressure, resulting in increased renal vascular permeability and finally glomerular hyperfiltration. 23 . Other mechanisms of the relationship between IR and CIN may be inflammation, oxidative stress, metabolic acidosis, and increased lipotoxicity leading to the development of microangiopathy. 21
In this study, we found a cut-off value for the TyG index, which predicts the development of CIN. In previous studies, the optimal cut-off value for the TyG index predicting the development of CIN was found to be 9.043 by Li et al., and 8.88 by Qin et al. 6,12 In our study, the optimal cut-off value of the TyG index for developing CIN was found to be 9.17. The different cut-off values in studies may be due to the size of the study population, study design, and different exclusion criteria. The most likely reason why we found a higher cut-off value in our study compared with other studies may be that we excluded patients with DM, CKD, anemia, and CHF. Because the exclusion of these diseases that contribute to the development of CIN, especially DM, from the study may have increased the TyG index cut-off value for the development of CIN in the study population.
This study had several limitations. First, our study was conducted in a single center with a relatively small sample size and lacked external evaluation. Second, a single TyG index value was considered for the analyses. Finally, only one of the existing definitions of CIN was used in this study; therefore, results may not be reproducible using other CIN diagnostic criteria.
Conclusion
The results of this study showed that a high TyG index increases the incidence of CIN after CAG in non-diabetic NSTEMI patients and is an independent risk factor for the development of CIN. The TyG index can be a very simple, inexpensive, and easily accessible new potential marker to identify patients at high risk for the development of CIN. We need further studies with a large cohort to determine the clinical implications of these findings.
Footnotes
Author contributions
Conception and design: HA, MG, SI. Data collection and processing: HA, OY, SG. Analysis and interpretation: HA, SI, MG. Literature review: HA, MG, SG, OY. Writer: HA, MG, SI. Critical review: HA, SI, MG, SG, OY.
Declaration of conflicting interests
The author(s) declared no potential conflicts of interest with respect to the research, authorship, and/or publication of this article.
Funding
The author(s) received no financial support for the research, authorship, and/or publication of this article.
Ethics approval
All the procedures were in accordance with the ethical standards of our institutional, and national research committee, and with the 1964 Helsinki Declaration. This study was approved by the local ethics committee (Aksaray University, No: 2022/04-06, Date: 24.02.2022).