
Abstract
Multiple myeloma (MM) is a bone marrow malignancy characterized by plasma cell proliferation. It was aimed to investigate pentraxin 3 (PTX3) levels, oxidative/antioxidative status, and their correlation in MM. In the study, four groups were established, including newly diagnosed MM (NDMM), MM in remission (Rem-MM), relapsed/refractory MM (RRMM) patients, and a healthy control group. PTX3 levels were measured using enzyme-linked immunosorbent assay, and the total antioxidant status (TAS) and total oxidant status (TOS) were assessed with an autoanalyzer. The oxidative stress index (OSI) was calculated using the formula: OSI (arbitrary unit) = TOS (µmol H2O2 Eq/L)/TAS (mmol Trolox Eq/L) × 100. The study involved comparing PTX3, TAS, TOS, and OSI levels among these four groups. PTX3 levels were significantly elevated in NDMM and RRMM groups compared to controls and the Rem-MM group (NDMM vs control; p < 0.001, NDMM vs Rem-MM; p < 0.001, RRMM vs control; p < 0.001, and RRMM vs Rem-MM; p = 0.006). TAS was higher in NDMM and RRMM groups versus controls (p = 0.009 and p < 0.001, respectively), and TOS was higher in rem-MM group versus NDMM and control groups (p < 0.001 and p = 0.016, respectively). OSI was higher in the Rem-MM group than in NDMM and RRMM groups (p < 0.001 and p = 0.009, respectively). Multivariate analysis confirmed associations between MM groups and PTX3 levels. Receiver operating characteristic analysis revealed high specificity (90%) and sensitivity (79%) for PTX3 in NDMM at a >0.56 ng/mL cut-off value. This study suggests that PTX3 levels may have diagnostic and prognostic potential in MM and its relationship with oxidative stress requires further exploration.
Keywords
Introduction
Multiple myeloma (MM) is a malignancy of the bone marrow, categorized as a relatively uncommon cancer, comprising approximately 1%–2% of all malignancies and slightly more than 17% of hematologic malignancies.1,2 Despite advancements in treatment options such as proteasome inhibitors, immunomodulatory agents, and monoclonal antibodies, MM remains an incurable malignancy. Globally, there are an estimated 180,000 cases and 117,000 fatalities attributed to MM annually. 3
In healthy cells, while reactive oxygen species (ROS) and other free radicals are generated, there are concurrently antioxidant defense systems in place to cope with them. This situation maintains the balance of redox equilibrium, ensuring homeostasis. The oxidant-antioxidant balance is crucial for cell function and normal metabolism. Disruption of this balance can lead to an increase in ROS and other free radicals, resulting in elevated levels of oxidative stress and posing a risk of mutations in cells, consequently increasing the risk of cancer development.4,5 Increased oxidative stress is recognized as a risk factor in the etiopathogenesis of MM. 6 However, some studies suggest that alterations in oxidative conditions may also play a role in therapeutic responses and the emergence of drug resistance in MM patients. 7 Therefore, determining how oxidative stress levels change in patients with MM who achieve remission or show resistance after treatment becomes crucial.
Pentraxin-3 (PTX3) levels are elevated in multiple myeloma (MM) cultures.
PTX3 exhibits a dual role in oncogenesis, acting as both a pro-tumor and anti-tumor factor.
Studies show variability in oxidative status levels among MM patients
For the first time in the literature, elevated levels of PTX3 were shown in both newly-diagnosed MM (NDMM) and refractory-relapsed MM (RRMM) patients compared to the patients in remission (Rem-MM).
Oxidative stress, as indicated by OSI, was higher in the Rem-MM group compared to the NDMM and RRMM groups.
Despite the elevated levels of PTX3 in MM patients, a correlation analysis revealed no significant association between PTX3 and oxidative status markers.
PTX3 emerges as a promising biomarker for MM progression.
We are currently speculating on their potential as therapeutic targets or biomarkers.
Pentraxin 3 (PTX3) is a glycosylated octameric protein consisting of 381 amino acids with a molecular weight of 40 kDa. 8 Elevated synthesis of inflammatory markers and activation of diverse cellular mechanisms can stimulate expression of PTX3 in various cell types. 9 The octameric structure of PTX3, a prototype of the long pentraxin subfamily, contains two regions that exhibit high affinity and selectivity for fibroblast growth factor 2 (FGF2). 10 This binding prevents the appropriate binding of FGF2 to receptors and heparan sulfate proteoglycans, thereby halting FGF2’s pro-angiogenic activity and inhibiting endothelial cell proliferation, migration, and FGF2-dependent neovascularization. 11 Cell culture studies have demonstrated that elevated PTX3 application reduces angiogenesis and progression of MM cells by sequestering FGF2, which is an anti-tumor characteristic of PTX3. 12 Nevertheless, a study conducted in chronic lymphocytic leukemia (CLL) patients indicated that down-regulation of PTX3 enhances apoptosis in CLL cells, which is a pro-tumor characteristic of PTX3. 13 These studies reveal dual role of PTX3 in oncogenesis, exhibiting both pro-tumor and anti-tumor properties. However, there is currently no study examining the levels of PTX3 in newly diagnosed MM (NDMM) patients and investigating how it changes after treatment in MM patients.
Some studies have indicated that increased oxidative stress leads to elevated PTX3 levels. 14 An investigation in MM patients revealed the role of increased FGF2 levels in reducing oxidative stress within tumor cells. 15 However, there is no study investigating the relationship between altered oxidative/antioxidative status and PTX3 in MM patients.
The aim of this study is to investigate the oxidative/antioxidative status and PTX3 levels, which are believed to be influential in the onset and treatment of MM, in NDMM, in MM patients in remission (Rem-MM), and relapsed/refractory MM (RRMM). Additionally, this study aims to examine the relationship between PTX3 and oxidative stress in MM patients.
Materials and methods
Study design and selection of participants
Our study was designed as a single-center prospective case-control study. MM patients who presented to the Hematology Clinic of our Institute between February 2022 and January 2023 were included in the study. Participants were categorized into four groups: NDMM, Rem-MM, RRMM, and a healthy control group. The Rem-MM group comprised patients who attained a minimum of partial remission or a more favorable response through treatment. The RRMM group included patients who were identified as having progressive disease, inadequate response to treatment, progression within 60 days of the most recent treatment in a patient who had achieved remission, lack of at least minimal response, or primary refractory MM. The control group was comprised of individuals of comparable age and gender who had no documented history of any acute or chronic illnesses or cancer.
The study was conducted in adherence to the ethical principles delineated in the Helsinki Declaration. The study protocol received approval from the Local Ethics Committee of Hatay Mustafa Kemal University (Approval No: 21/06/2023-21).
MM diagnosis, staging, and treatment response
The International Myeloma Working Group (IMWG) diagnostic criteria from 2014 were used for MM diagnosis. 16 According to the IMWG criteria, the presence of more than 10% plasma cells (PCs) in the bone marrow, along with one or more of the CRAB (Hypercalcemia, Renal dysfunction, Anemia, and Bone disease) criteria, defined MM. Additionally, when CRAB criteria are not present, the diagnosis of MM was established based on the existence of MM-defining events. These events encompass the presence of 60% or more clonal PCs in the bone marrow, a serum ratio of involved to uninvolved free light chains equal to or exceeding 100 (given that the absolute level of the involved light chain is at least 100 mg/L), and the presence of more than one focal lesion on magnetic resonance imaging that measures 5 mm or larger. Treatment response assessments were conducted according to the 2016 IMWG criteria. 17
Sample collection, handling, and equipment used
A total of 5 mL blood samples were collected from all participants using yellow-capped biochemical tubes (BD Vacutainer SST II Advance) to measure PTX3 and antioxidant capacity through total antioxidant status (TAS) and total oxidant status (TOS). Following a 20-min incubation period, the collected blood samples underwent centrifugation at 1500 × g for 10 min. Subsequently, the supernatants were separated and portioned for storage at −80°C until the day of analysis.
For the storage and partitioning of collected blood samples, a deep freezer (New Brunswick Scientific U570), refrigerated centrifuge (Thermo Scientific SL 16 R, UK), and calibrated pipette (Thermo Scientific, FINNIPIPETTE F2 Finland) were employed. These instruments were utilized to ensure the integrity and preservation of the samples for subsequent analyses. The Thermo Fisher Scientific Multiscan Go device from Finland was employed for measuring parameters using the enzyme-linked immunosorbent assay (ELISA) method.
Pentraxin 3
For the quantification of PTX3, a sandwich ELISA method was employed, utilizing a commercial kit (Fine Test PTX3 ELISA Kit, Cat. No: EH0263). Optical density measurements were conducted spectrophotometrically at a wavelength of 450 nm. Concentrations were determined using a 4P-logic calibration curve, and the results were expressed in ng/mL. The analytical range spanned from 0.313 to 20 ng/mL, with a sensitivity of 0.188 ng/mL. Precision was at <8% for intra-assay coefficient of variation (CV) and <10% for inter-assay CV.
Serum oxidative stress parameters
TAS and TOS levels were determined through a colorimetric method outlined by Erel. 18 TAS results were reported in millimoles of Trolox equivalent per liter (mmol Trolox Eq/L), while TOS results were expressed as micromoles of hydrogen peroxide equivalent per liter (µmol H2O2 Eq/L). 19 To assess oxidative stress, the oxidative stress index (OSI) was calculated using the formula: OSI (arbitrary unit) = TOS (µmol H2O2 Eq/L)/TAS (mmol Trolox Eq/L) × 100, as detailed in the study by Karapinar et al. 20
Statistical analysis
Considering the absence of pre-existing data concerning PTX3 levels, we opted for a convenient sample size of 120 participants for our study. A post hoc analysis was performed, indicating that having 20 patients per group would afford us 100% statistical power in detecting an effect size (f) of 1.27, assuming a standard deviation of 0.36 ng/mL and utilizing a significance level (α) of 0.05. These sample size calculations were executed utilizing the G*power package version 3.1 (Heinrich Heine University, Dusseldorf, Germany). To assess the distribution of continuous variables, the Shapiro-Wilk test for normality was employed. For variables with skewed distributions, non-parametric statistical methods were applied. Descriptive statistics were reported in the form of medians accompanied by interquartile ranges. Non-normally distributed variables across more than two groups were compared by the Kruskal–Wallis test, and post-hoc pairwise comparisons were performed using the Mann–Whitney U test. Categorical variable associations were analyzed using the chi-square test. Receiver Operating Characteristic (ROC) analysis was conducted to evaluate the diagnostic performance of PTX3 levels (measured in ng/mL). This analysis involved calculating the area under the curve (AUC) value, sensitivity, and specificity.
The Spearman-Rho correlation coefficient was used to assess the relationship between two non-normally distributed variables. A multivariate generalized linear model was employed to investigate the connection between the presence of MM disease and PTX3 levels. The variables included in this model were selected based on their significance level (p < 0.05) in univariate generalized linear model analyses. To assess potential multicollinearity, variance inflation factors were computed. In the multivariate model, PTX3 levels were considered the dependent variable, while age, TAS, TOS, and OSI levels, and study groups were set as independent variables.
All statistical analyses were performed using the Statistical Package for the Social Sciences (SPSS) version 26.0 (SPSS Inc., Chicago, IL, United States). A significance level of p < 0.05 was used to determine statistical significance.
Results
The study enrolled a total of 120 participants, categorized into the NDMM (n:20), Rem-MM (n:20), RRMM (n:20), and control (n:60) groups. The mean age of individuals within the NDMM, Rem-MM, RRMM, and control groups was recorded as 64 ± 10 years, 60 ± 9 years, 68 ± 12 years, and 60 ± 10 years, respectively. Regarding gender distribution, 9 (45%), 10 (50%), 9 (45%), and 30 (50%) participants in the NDMM, Rem-MM, RRMM, and control groups were females, respectively. Detailed demographic characteristics and laboratory findings for each group are presented in Table 1.
The demographic characteristics of the groups.
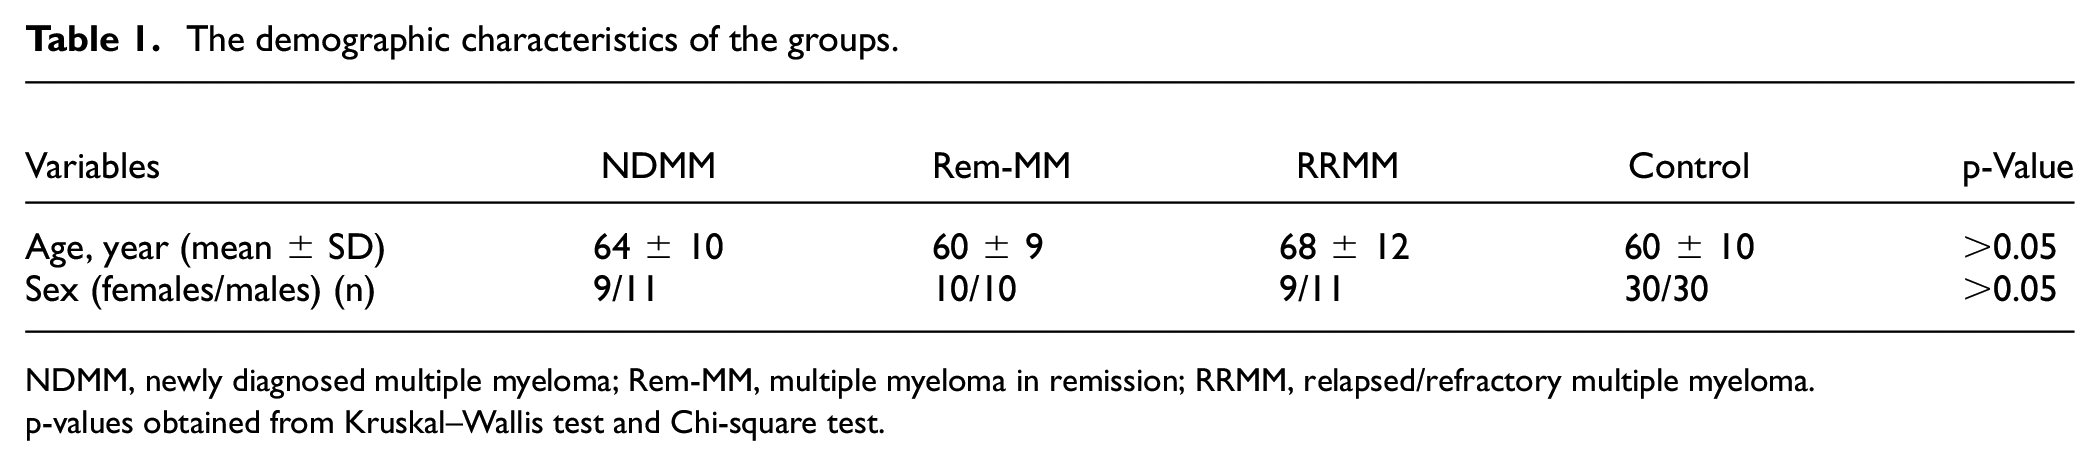
NDMM, newly diagnosed multiple myeloma; Rem-MM, multiple myeloma in remission; RRMM, relapsed/refractory multiple myeloma.
p-values obtained from Kruskal–Wallis test and Chi-square test.
Table 2 presents comparative analysis of ELISA indicators and oxidative status markers across the study groups. Notably, the PTX3 levels exhibited substantial increases in both the NDMM and RRMM groups when compared to the control and Rem-MM groups (NDMM vs control; p < 0.001, NDMM vs Rem-MM; p < 0.001, RRMM vs control; p < 0.001, and RRMM vs Rem-MM; p = 0.006). TAS levels were observed to be elevated in the NDMM and RRMM groups when compared to the control group (p = 0.009 and p < 0.001, respectively). Furthermore, TAS levels were significantly higher in the RRMM group than in the Rem-MM group (p = 0.02). However, TOS levels were found to be higher in the Rem-MM group compared to both the control and NDMM groups (p = 0.016 and p < 0.001, respectively). Notably, the Rem-MM group exhibited increased OSI levels in relation to both the NDMM and RRMM groups (p < 0.001 and p = 0.009, respectively).
PTX3 and oxidative status markers among all groups.
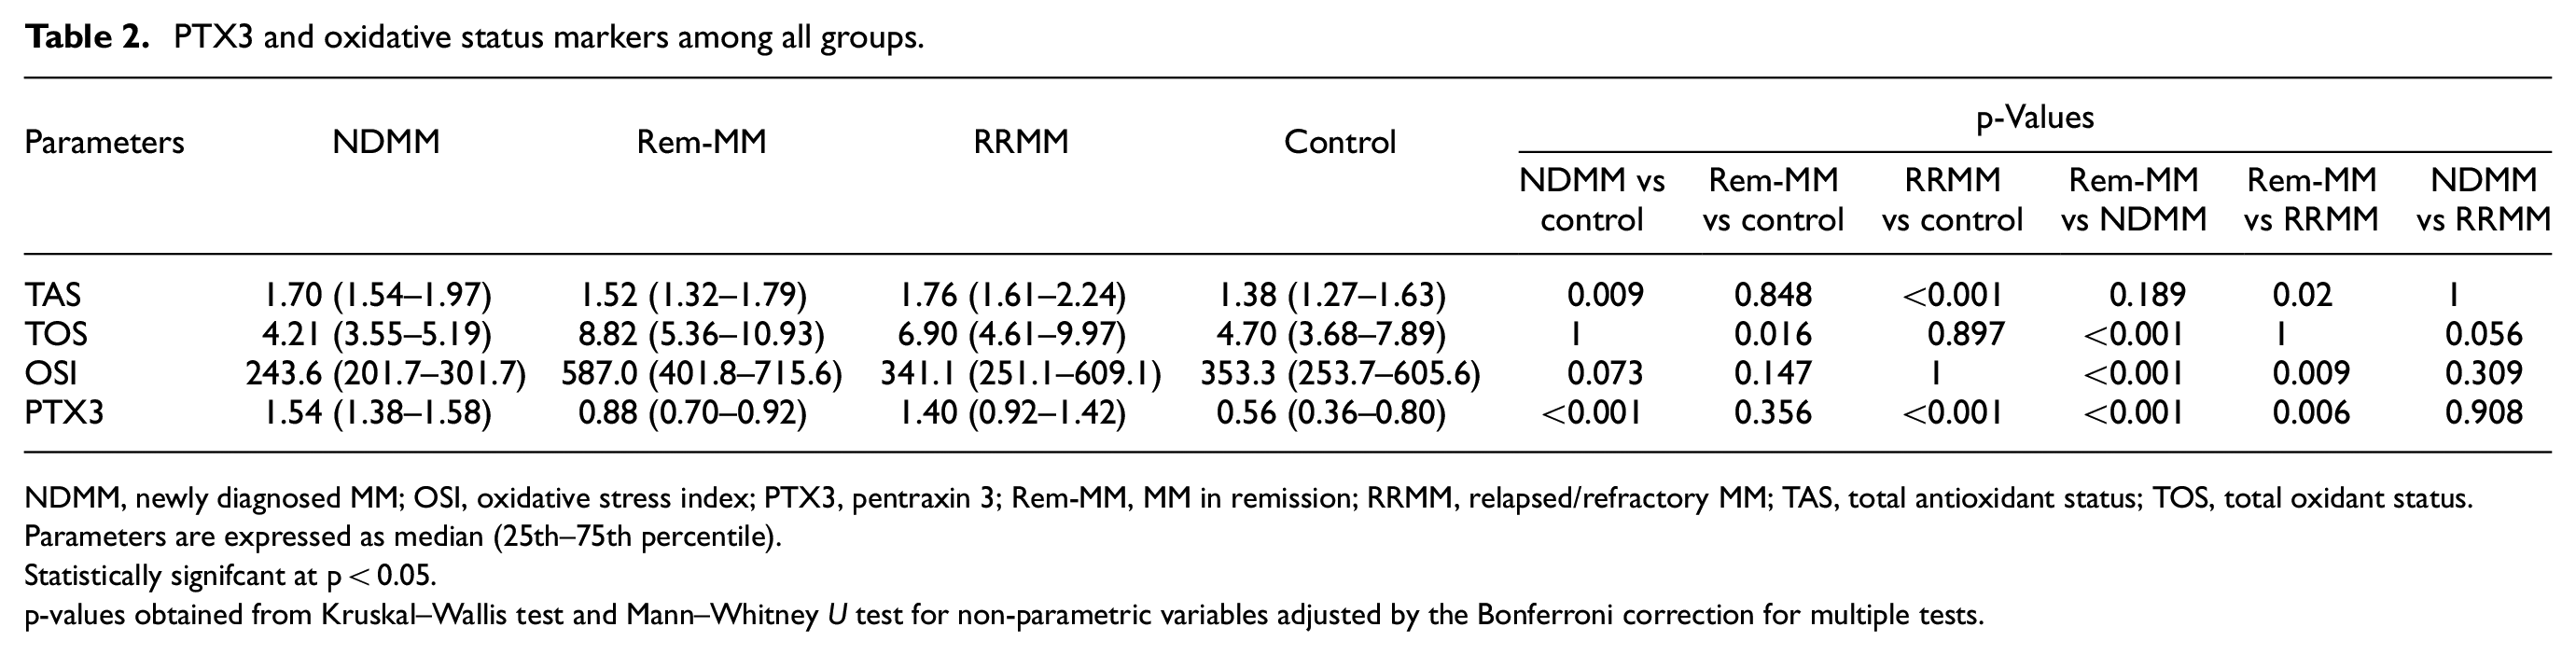
NDMM, newly diagnosed MM; OSI, oxidative stress index; PTX3, pentraxin 3; Rem-MM, MM in remission; RRMM, relapsed/refractory MM; TAS, total antioxidant status; TOS, total oxidant status.
Parameters are expressed as median (25th–75th percentile).
Statistically signifcant at p < 0.05.
p-values obtained from Kruskal–Wallis test and Mann–Whitney U test for non-parametric variables adjusted by the Bonferroni correction for multiple tests.
Table 3 presents an analysis of the correlations of PTX3 with age, TAS, TOS, and OSI. Significant positive correlations were discerned between PTX3 and age across all subjects. Moreover, significant negative correlations emerged between PTX3 and both TOS and OSI within the entire subject pool. However, it is noteworthy to mention that no discernible correlations were identified between PTX3 and the remaining parameters within the NDMM, Rem-MM, and RRMM groups.
Correlations between clinical PTX3 with age and oxidative status parameters in all subjects and MM subgroups.
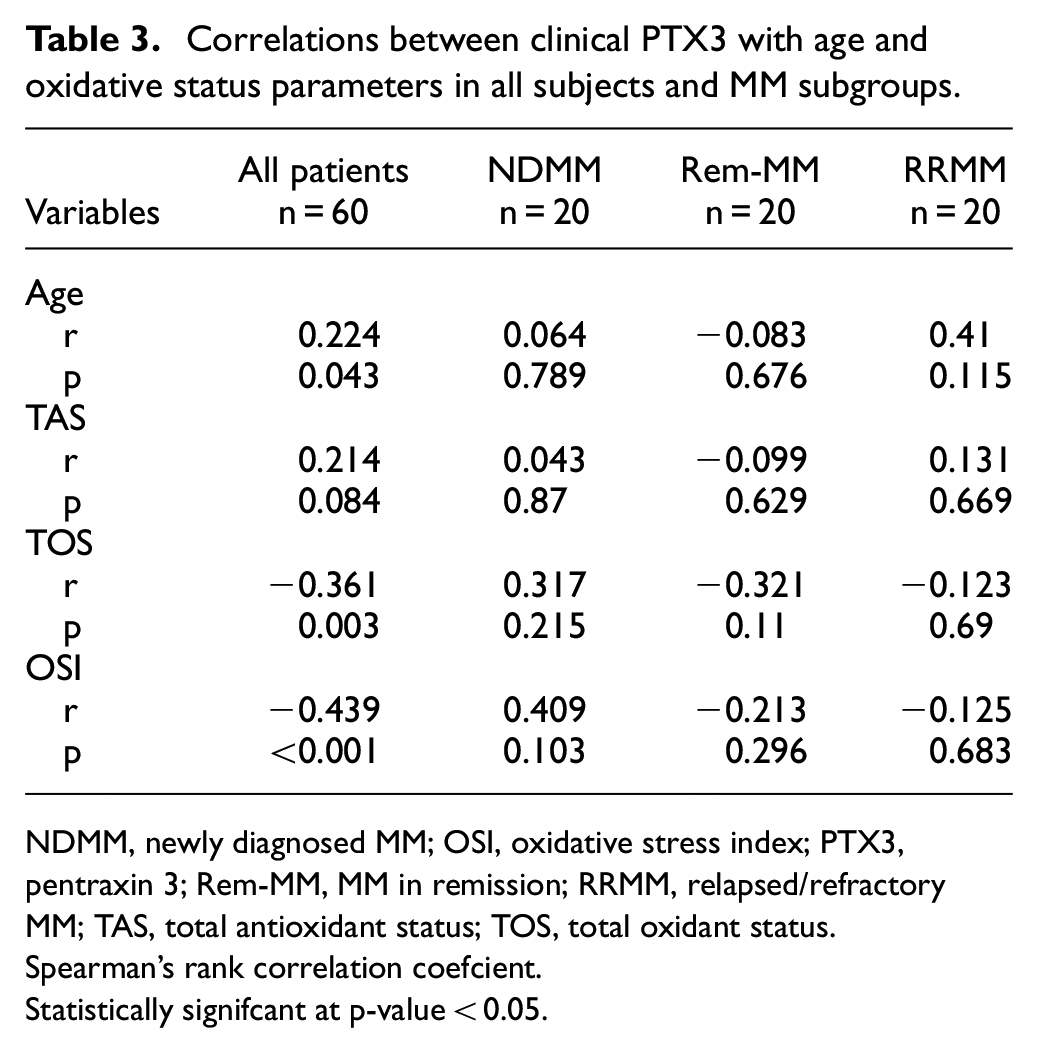
NDMM, newly diagnosed MM; OSI, oxidative stress index; PTX3, pentraxin 3; Rem-MM, MM in remission; RRMM, relapsed/refractory MM; TAS, total antioxidant status; TOS, total oxidant status.
Spearman’s rank correlation coefcient.
Statistically signifcant at p-value < 0.05.
Table 4 shows the results of univariate and multivariate generalized linear regression analyses for the factors affecting the levels of PTX3. Notably, gender did not exhibit any significant associations with PTX3 levels (p = 0.903), indicating that gender did not play a significant role in determining variations in PTX3 levels among the subjects. On the other hand, in the univariate analysis, variables including the NDMM group (β = 0.444, 95% CI = 0.351–0.536), the Rem-MM group (β = 0.123, 95% CI = 0.037–0.209), and the RRMM group (β = 0.383, 95% CI = 0.286–0.481), as well as age (β = 0.005, 95% CI = 0.001–0.010), TAS (β = 0.227, 95% CI = 0.024–0.429), TOS (β = −0.015, 95% CI = −0.023 to −0.007), and OSI (β = 0.001, 95% CI = 0–0.001), exhibited significant associations with PTX3 levels. In the multivariate analysis, higher levels of PTX3 were associated with the NDMM group (β = 0.409, 95% CI = 0.293–0.525), the Rem-MM group (β = 0.133, 95% CI = 0.028–0.238), and the RRMM group (β = 0.374, 95% CI = 0.249–0.498) (p < 0.001, p = 0.013, and p < 0.001, respectively).
Generalized linear regression analysis of factors affecting PTX3 levels.
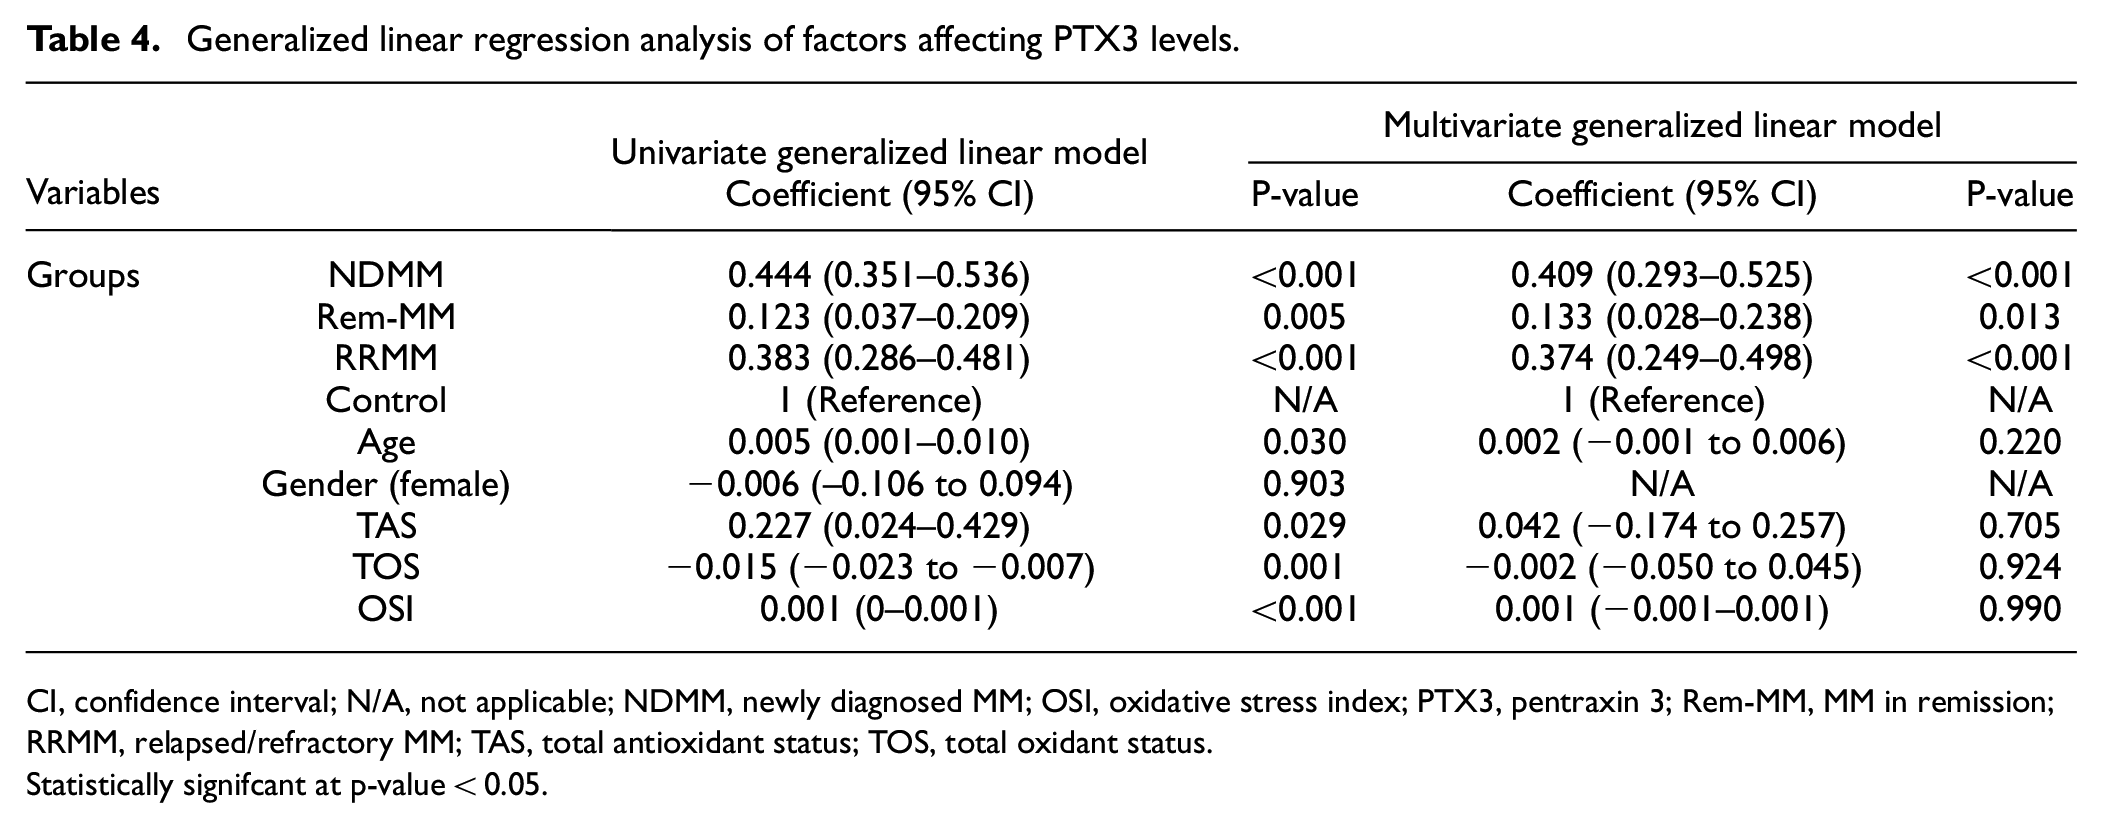
CI, confidence interval; N/A, not applicable; NDMM, newly diagnosed MM; OSI, oxidative stress index; PTX3, pentraxin 3; Rem-MM, MM in remission; RRMM, relapsed/refractory MM; TAS, total antioxidant status; TOS, total oxidant status.
Statistically signifcant at p-value < 0.05.
To evaluate the diagnostic efficacy of PTX3 specifically for individuals diagnosed with NDMM, a comprehensive analysis using the ROC curve was employed. In the ROC analysis, the AUC value for PTX3 levels was determined to be 0.910. The sensitivity was calculated at 90%, while specificity values were determined to be 79%. The cut-off value was identified as >0.56 ng/mL (Figure 1).
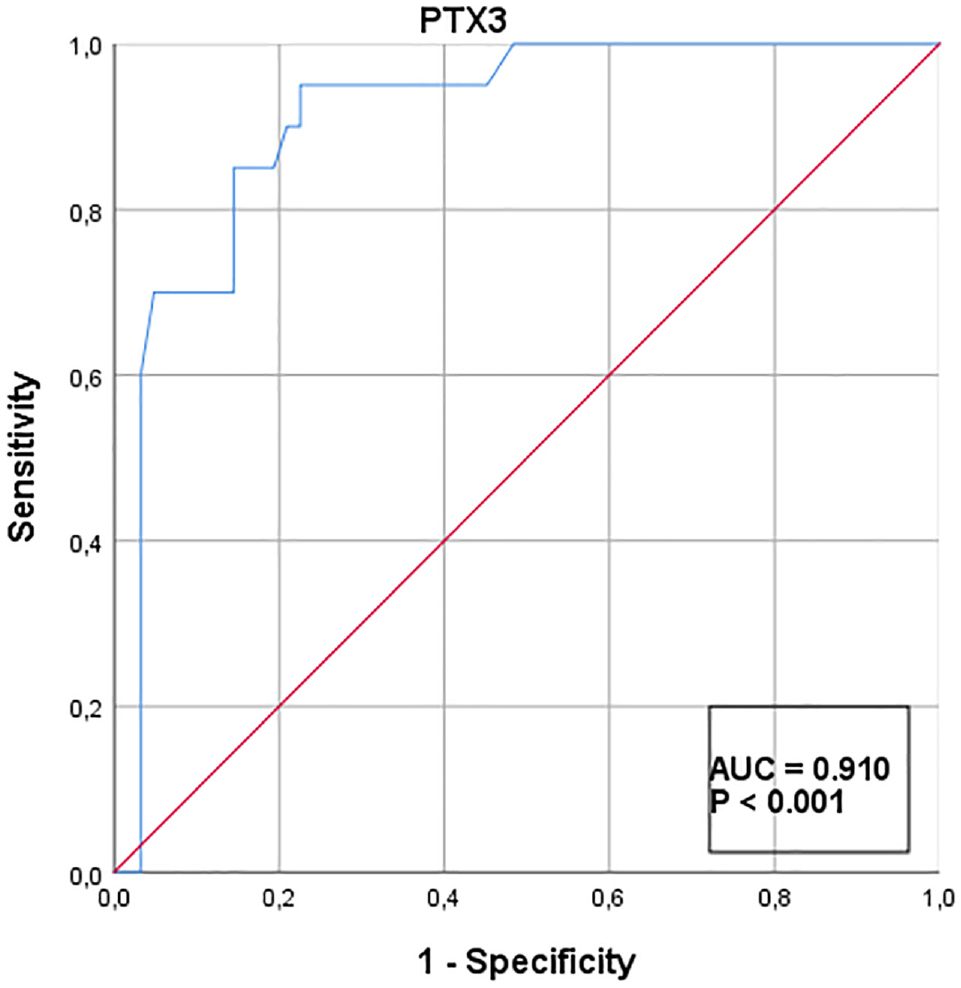
The diagnostic performance of PTX3 levels in NDMM patients: ROC analysis.
Discussion
In this study, for the first time in the literature, elevated levels of PTX3 were shown in both NDMM and RRMM groups compared to the patients in remission. However, it was also shown that oxidative stress, as indicated by OSI, was higher in the Rem-MM group compared to the NDMM and RRMM groups.
In this study, serum PTX3 levels of MM patients were compared to those of a healthy control group, revealing significantly elevated PTX3 levels in the NDMM patients (p < 0.001). Research has demonstrated elevated PTX3 levels in patients with infections, inflammation, and cancer. 21 A study conducted in MM patients indicated that PTX3 levels were higher in samples obtained from fibroblast, endothelial, and PC cultures compared to control groups. 12 In this context, the results we obtained are consistent with previous studies.
In the context of multivariate generalized linear regression analysis, it was observed that apart from factors such as age, gender, and oxidative stress markers, the elevation of PTX3 is associated with the different MM patient groups (NDMM, Rem-MM, RRMM). PTX3 levels exhibited the significant variation among the MM patient groups (Table 4). Particularly, a substantial increase in PTX3 levels was observed in the NDMM and RRMM groups when compared to the Rem-MM and control groups (Table 2). In studies, it has been demonstrated that the levels of PTX3 can change during the treatment process of certain cancer types, and in the progressive phase of the disease, PTX3 levels are higher in comparison to remission status. 22 In a study involving colorectal cancer patients, it was shown that the 5-year survival rate was lower in patients with high PTX3 levels. 23 The observed decrease in PTX3 levels within the Rem-MM group in this study might be linked to a reduction in PC count associated with disease remission. Another possible explanation for this phenomenon could be a reduced PTX3/FGF2 ratio in patients entering remission. 11 These results prompt the idea that PTX3 levels could be higher in MM patients compared to healthy individuals and that PTX3 levels might vary based on treatment response.
In the ROC analysis, PTX3 demonstrated strong performance in NDMM cases. PTX3 exhibited high specificity and sensitivity for NDMM. Therefore, if these findings are confirmed, PTX3 levels could have the potential to be used as a marker for MM disease.
Cancer cells tend to produce higher levels of ROS due to oncogene activation and/or increased metabolic activity compared to normal cells. 24 Increased oxidative stress has been shown to promote cancer cell proliferation, motility, and invasion. 25 Accordingly, antioxidants have long been considered tumor-suppressive agents. 26 However, recent studies have reported that antioxidants can actually promote tumor progression and lymph node metastasis. 27 Furthermore, tumors are known to employ various mechanisms to suppress oxidative stress. 28 A change in oxidative status is not only responsible for the initiation and progression of MM but also considered crucial for achieving therapeutic responses and preventing the development of chemoresistance. 29 Numerous studies demonstrate that excessive ROS production inhibits the proliferation, viability, and transformation into various phenotypes of tumor cells. 30 Nevertheless, studies have also shown an increase in antioxidant parameters such as superoxide dismutase, catalase, glutathione peroxidase, and nitric oxide, as well as a decrease in oxidative stress parameters in MM patients post-treatment. 31 Proteasome inhibitors, widely used in MM treatment, disrupt cellular protein folding, leading to accumulation of unfolded proteins and incorrect protein folding, triggering endoplasmic reticulum stress and subsequent oxidative stress. 32 Proteasome inhibitors have been reported to increase intracellular ROS production. 33 Immunomodulatory drugs, also crucial in MM treatment, have been shown to increase cellular oxidative stress levels by blocking peroxidase-mediated degradation of hydrogen peroxide through the cereblon molecule. 34 The initial increase in ROS production by these drugs is considered a significant indicator of tumor cell death.
In this study, it was observed that the Rem-MM group exhibited the highest total oxidant capacity, OSI, and the lowest total antioxidant capacity. This observation may be attributed to the oxidative stress induced by proteasome inhibitors and immunomodulatory drugs used in the treatment of the disease. Additionally, OSI values were found to be higher in the Rem-MM group compared to those not in the RRMM group. Although OSI levels increased slightly in the RRMM, it is believed that these levels did not reach a lethal threshold for tumor cells. These findings support the notion that high levels of ROS in MM cells can reduce proliferation and viability. Therefore, inducing high ROS levels in MM cells, if reaching efficiently lethal concentrations, seems to be a promising strategy.
Another focus of this study was the relationship between PTX3 and oxidative/antioxidative status. When considering all groups together, a negative correlation between PTX3 and OSI was observed. However, when evaluating each group separately, a significant correlation between PTX3 and OSI was not found. Furthermore, in the multivariate generalized linear regression analysis, oxidative stress markers did not significantly affect PTX3 levels. Similar studies have also failed to establish a correlation between PTX3 and oxidative/antioxidative status. 35 These results suggest that PTX3 levels in MM patients might be influenced by factors other than oxidative/antioxidative status, such as tumor cell quantity.
First limitation of this study is its single-center design and the relatively small sample size. Second limitation is the variability in therapeutic approaches among patients. The third and most significant limitation is the lack of long-term follow-up for patients, which may create a limitation regarding the impact of PTX3 in the survey relationship of MM patients.
Conclusion
In conclusion, our study highlights the potential significance of oxidative stress markers and PTX3 in MM. The differences observed in PTX3 levels among patient groups suggest its potential as a diagnostic and prognostic marker in MM. Further research is warranted to elucidate the precise roles of PTX3 and oxidative stress in MM and to validate their potential as therapeutic targets or biomarkers.
Footnotes
Declaration of conflicting interests
The author(s) declared no potential conflicts of interest with respect to the research, authorship, and/or publication of this article.
Funding
The author(s) received no financial support for the research, authorship, and/or publication of this article.