
Abstract
Pulmonary embolism (PE) can present with several “classic” electrocardiographic (ECG) abnormalities—most notably the S1Q3T3 pattern, right ventricular (RV) strain, right bundle branch block, sinus tachycardia, and T-wave inversions. We prospectively studied every adult who underwent computed tomography pulmonary angiography (CTPA) for suspected PE in a tertiary cardiology hospital between January 2021 and December 2023. All 12-lead ECGs acquired on the same day or after CTPA were interpreted by blinded cardiologists. Diagnostic accuracy (sensitivity, specificity, positive and negative likelihood ratios [LR+, LR–]) and multivariable logistic regression were calculated for each predefined ECG criterion; clinical utility was judged by whether the 95 % confidence interval (CI) of LR+ or LR– crossed 1. Of 273 consecutive patients (mean age 61 years; 54 % women), PE was confirmed in 75 (27.5 %), including 14 subsegmental events. In the multivariable model, only sinus tachycardia (OR 1.93, 95 % CI 1.09–3.41) and inversion/flattening of inferior T-waves (OR 1.82, 95 % CI 1.04–3.18) remained significant. Among traditional signs, S1Q3T3 yielded LR+ 2.07 (95 % CI 1.27–3.39) and liberal RV strain (inverted/flattened T-waves in ≥2 inferior +≥2 anterior leads) yielded LR+ 4.75 (95 % CI 2.3–9.8); all other findings were noninformative. Reclassifying subsegmental emboli as controls did not materially change results. Overall, classical ECG findings modestly increase post-test probability but lack sufficient standalone accuracy, underscoring that ECG should not be used in isolation to rule in or rule out PE.
Introduction
Pulmonary embolism (PE) is characterized by the acute obstruction of pulmonary arteries, most frequently resulting from thrombi originating in lower limb veins, which migrate to the pulmonary circulation. 1 It is a significant contributor to global morbidity and mortality, ranking as the third leading vascular cause of death, surpassed only by myocardial infarction and stroke. 2 Its population incidence is heterogeneous. Large administrative datasets from Europe report rates between 45 and 120 cases per 100,000 adults per year: in Denmark the incidence rose from 45 to 83/100,000 between 2006 and 2018, 3 whereas a Swiss nationwide analysis showed an increase from 87 to 119/100,000 between 2003 and 2022. 4 In the United States, the estimated annual incidence of PE in the general population ranges from 60 to 120 per 100,000, causing between 60,000 and 100,000 deaths annually. 1
Within emergency departments (ED), the clinical burden of PE is substantial, representing approximately 0.2% of all visits, with nearly two-thirds of these cases necessitating hospitalization. 5 Admission rates, however, vary by era and geography: nationwide datasets from the United States (1999–2014) show a rise in PE-related hospitalizations from 65 to 137 per 100,000 population, 6 while contemporary European and Asian series report rates between 14 and 98 per 100,000.7,8 Despite advancements in diagnostic technology and management protocols—including increased adoption of direct oral anticoagulants and reduced thrombolytic use—PE remains a critical emergency due to its potential lethality. 9 High-risk PE cases can reach an in-hospital mortality rate of over 50%. 6
Electrocardiographic (ECG) findings historically associated with PE diagnosis include the classical S1Q3T3 pattern, right bundle branch block (RBBB), sinus tachycardia, right axis deviation, and anterior T-wave inversions. 10 These abnormalities primarily reflect right ventricular (RV) strain resulting from increased pulmonary artery pressure following embolic obstruction. However, the diagnostic reliability of these ECG findings remains inconsistent. For instance, the S1Q3T3 pattern, 11 though traditionally linked to PE, occurs infrequently and lacks both sensitivity and specificity, thus providing limited diagnostic utility. Given the uncertainty surrounding their clinical utility, ECG abnormalities alone cannot reliably confirm or exclude a diagnosis of PE, necessitating interpretation alongside additional clinical assessments and imaging studies.
Therefore, the present study critically revisits classical electrocardiographic signs associated with pulmonary embolism by employing a rigorous diagnostic accuracy methodology, aiming to refine their clinical utility and reliability in contemporary emergency care.
Classical ECG patterns (e.g., S1Q3T3 and RV strain) are widely taught as PE clues.
Misinterpretation of these patterns can lead to over-diagnosis in inexperienced clinicians.
Only tachycardia and inferior T-wave inversion were independently associated with PE.
S1Q3T3 and liberal RV strain produced LR+ values of 2.07 and 4.75, respectively.
Most other “classic” ECG signs showed no meaningful diagnostic contribution.
Highlights the need for EBM-based education to prevent over-reliance on isolated ECG patterns.
May reduce unnecessary CTPA by correcting misconceptions about ECG specificity in PE.
Methods
We conducted a cross-sectional diagnostic accuracy study evaluating all consecutive patients who underwent contrast-enhanced pulmonary angiography (CTPA) at a high-volume tertiary cardiology referral center in São Paulo, Brazil, from January 2021 through December 2023.
Participants
Patients were eligible if they were aged 18 or older with clinical suspicion of PE who underwent CTPA at our institution and had an ECG performed on the same day or after the imaging study. Patients were excluded from the analysis if they presented ventricular-paced rhythms or ventricular pre-excitation, as these conditions alter ventricular activation and repolarization patterns.
Test methods
Index test: The electrocardiogram (ECG) was analyzed systematically by experienced cardiologists who were blinded not only to CTPA findings, but also to all other clinical information. ECG PDF files were exported with identifiers removed; reviewers had access only to the tracing itself plus patient age and biologic sex. No data on symptoms, vital signs, laboratory results, or imaging were available during interpretation. ECG parameters classically described as indicative of PE—hereafter termed “classic criteria”—were individually recorded and analyzed for diagnostic accuracy, irrespective of logistic regression outcomes. These classic criteria include:
Tachycardia (heart rate >100 bpm)
Right axis deviation (>90°)
Classic S1Q3T3 pattern, strictly considered when accompanied by a negative T-wave in lead III
S1Q3T3 pattern with a prominent Q wave in lead III (≥1.5 mm amplitude)
Predominant R-wave amplitude over S-wave amplitude (R > S) in lead V1
Incomplete right bundle branch block (QRS duration >100 ms, with terminal R-wave in lead V1 or aVR)
Complete right bundle branch block (RBBB)
ST-segment elevation (STE) >1 mm in lead III
Right ventricular (RV) strain pattern, defined as concurrent ST-segment depression (STD ≥0.5 mm) and T-wave inversion in ≥2 inferior leads accompanied by STD (≥0.5 mm) and T-wave inversion in ≥2 anterior leads (V1–V3).
Additional ECG parameters less specifically associated with PE but clinically relevant were systematically documented as secondary findings. These included atrial conduction disturbances (atrial fibrillation, atrial flutter, atrial tachycardia), excluding AV nodal reentrant or accessory pathway-mediated tachycardias; criteria suggestive of atrial enlargement, such as increased P-wave amplitude (>2.5 mm) in lead II (“P pulmonale”), terminal positivity of the P-wave component (≥1.5 mm) in lead V1 (“P congenitale”), and signs of left atrial enlargement (“P mitrale” by Morris index); deviations of cardiac axis not classically associated with PE, including left axis deviation, extreme axis deviation, and indeterminate axis (R = S amplitude in leads I and aVF); ventricular depolarization abnormalities such as predominant S-wave amplitude in lead V6 (S > R) and complete left bundle branch block; and various ventricular repolarization changes, including widespread ST-segment depression (≥0.5 mm) in ≥7 leads combined with ST-segment elevation in lead aVR, ST-segment elevation meeting fourth universal definition criteria in anterior leads (≥2 leads from V1–V3), isolated negative or flattened T-waves in anterior (V1–V3), inferior (II, III, aVF), or lateral leads (I, aVL, V5–V6), as well as primary T-wave polarity (positive or negative) documented individually for anterior and inferior leads.
Reference test: CTPA, confirming filling defects in the pulmonary artery or its branches. Subsegmental pulmonary embolism (SSPE), defined as emboli located exclusively within subsegmental branches of the pulmonary arteries—which are smaller and more distal compared to segmental or lobar arteries, typically measuring 2–3 mm—was analyzed separately, both included among cases and reclassified as controls in subsequent analyses.12,13 Statistical outcomes of both analyses will be presented in the Results section. Investigators evaluating ECG parameters were blinded to CTPA results.
Analysis
Anonymized data were aggregated in Excel. Sample size calculation was based on previously described ECG findings for PE, which typically demonstrate low sensitivity and high specificity. Assuming a sensitivity of 15%, a specificity of 97%, an estimated disease prevalence of 20%, and a required confidence level of 95%, the calculated sample size for this study was 245 patients. 14
All analyses focused strictly on ECG variables. The predefined findings listed in the “Index Test” section constituted the candidate pool for regression. Each variable was first evaluated in a univariable logistic model (first simple, then multiple). ECG signs identified as statistically significant in multivariate logistic regression analysis subsequently underwent calculation of diagnostic accuracy measures (sensitivity, specificity, positive and negative likelihood ratios).
Independent of regression outcomes, diagnostic accuracy parameters were calculated and reported for each classic ECG criterion listed above. Sensitivity, specificity, LR+, and LR– with their respective 95% confidence intervals (95% CI) were calculated using the Clopper-Pearson exact method. 15 Clinical utility of each ECG parameter was determined by examining the 95% confidence intervals of LR+ and LR–. Parameters whose confidence intervals for LR+ or LR– crossed the value of 1 were considered clinically non-useful, indicating insufficient statistical confidence that a positive or negative test result meaningfully altered the post-test probability of PE. 16
This study adheres to the Standards for Reporting Diagnostic Accuracy (STARD) guidelines 17 and received approval from our Institutional Review Board (IRB number 77563524.0.0000.5462).
Results
Between January 2021 and December 2023, 576 patients underwent CTPA due to suspected PE. Of these, 283 patients were excluded due to the absence of ECG records in the system or because ECGs were performed prior to CTPA. This left 293 eligible patients whose ECGs were blindly analyzed by investigators. Subsequently, 20 additional patients were excluded for ventricular-paced rhythms or ventricular pre-excitation patterns, resulting in a final study population of 273 patients. The patient selection flow is summarized in Figure 1.
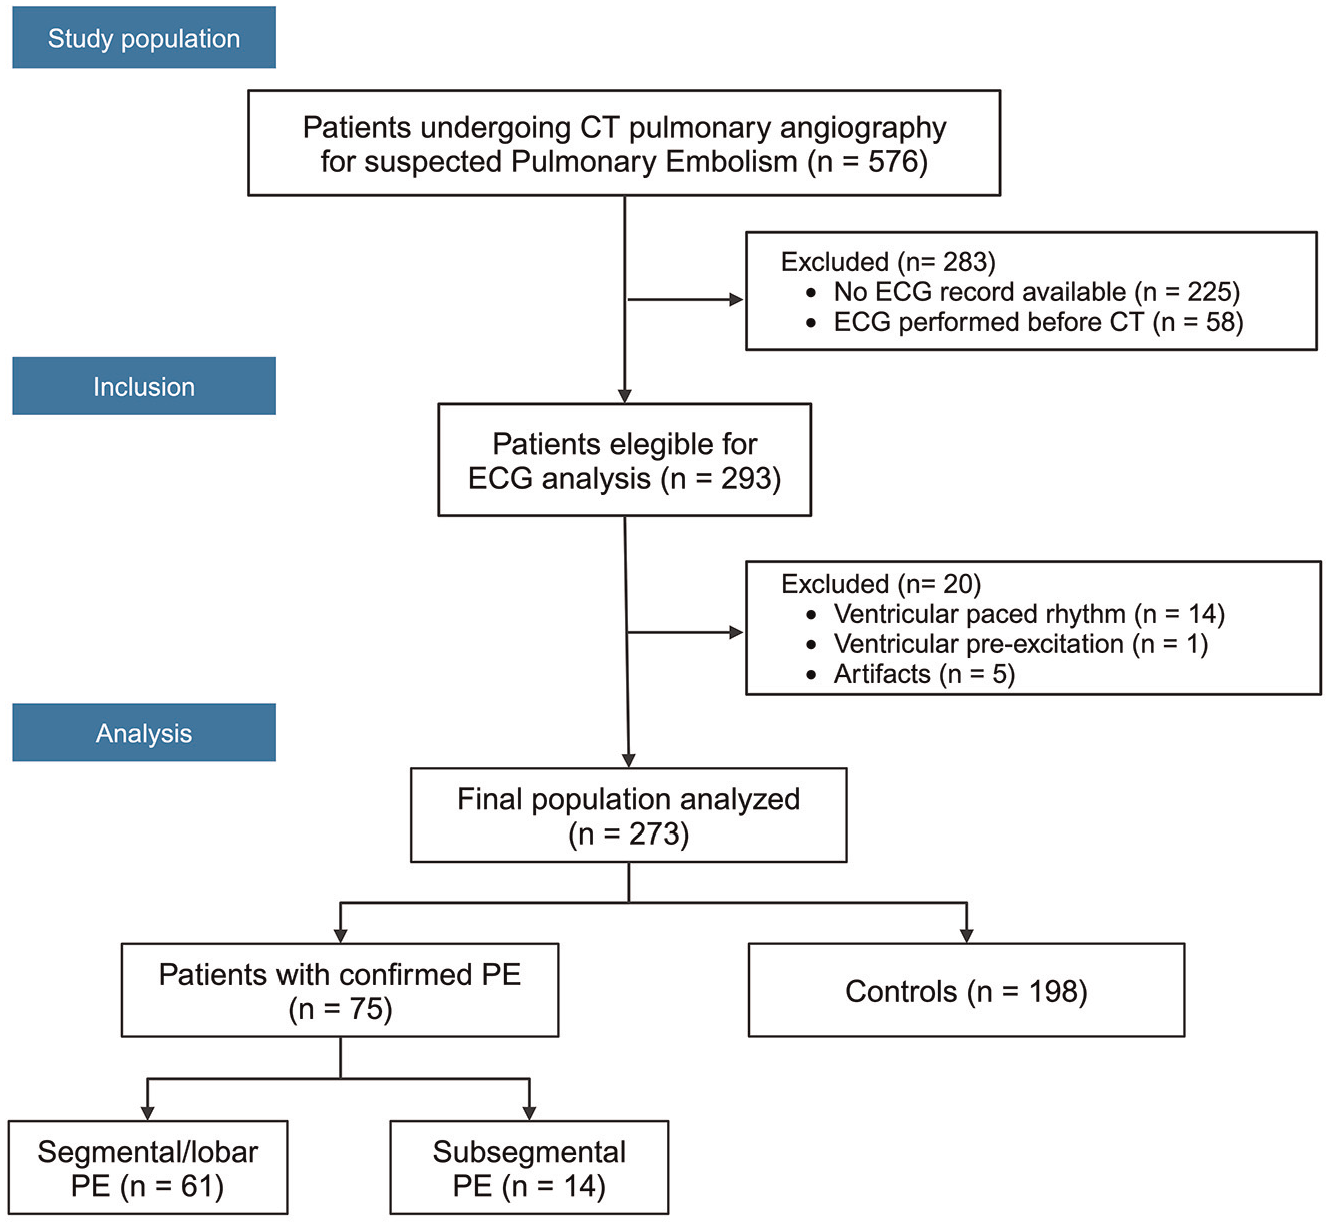
Flow diagram illustrating patient selection.
The mean age of participants was 61 years (range 19–92 years), with 148 women (54.2%) and 125 men (45.8%). PE was confirmed in 75 patients (27.5%), of which 14 cases were subsegmental, while 198 patients (72.5%) served as controls (Table 1).
Patient characteristics.
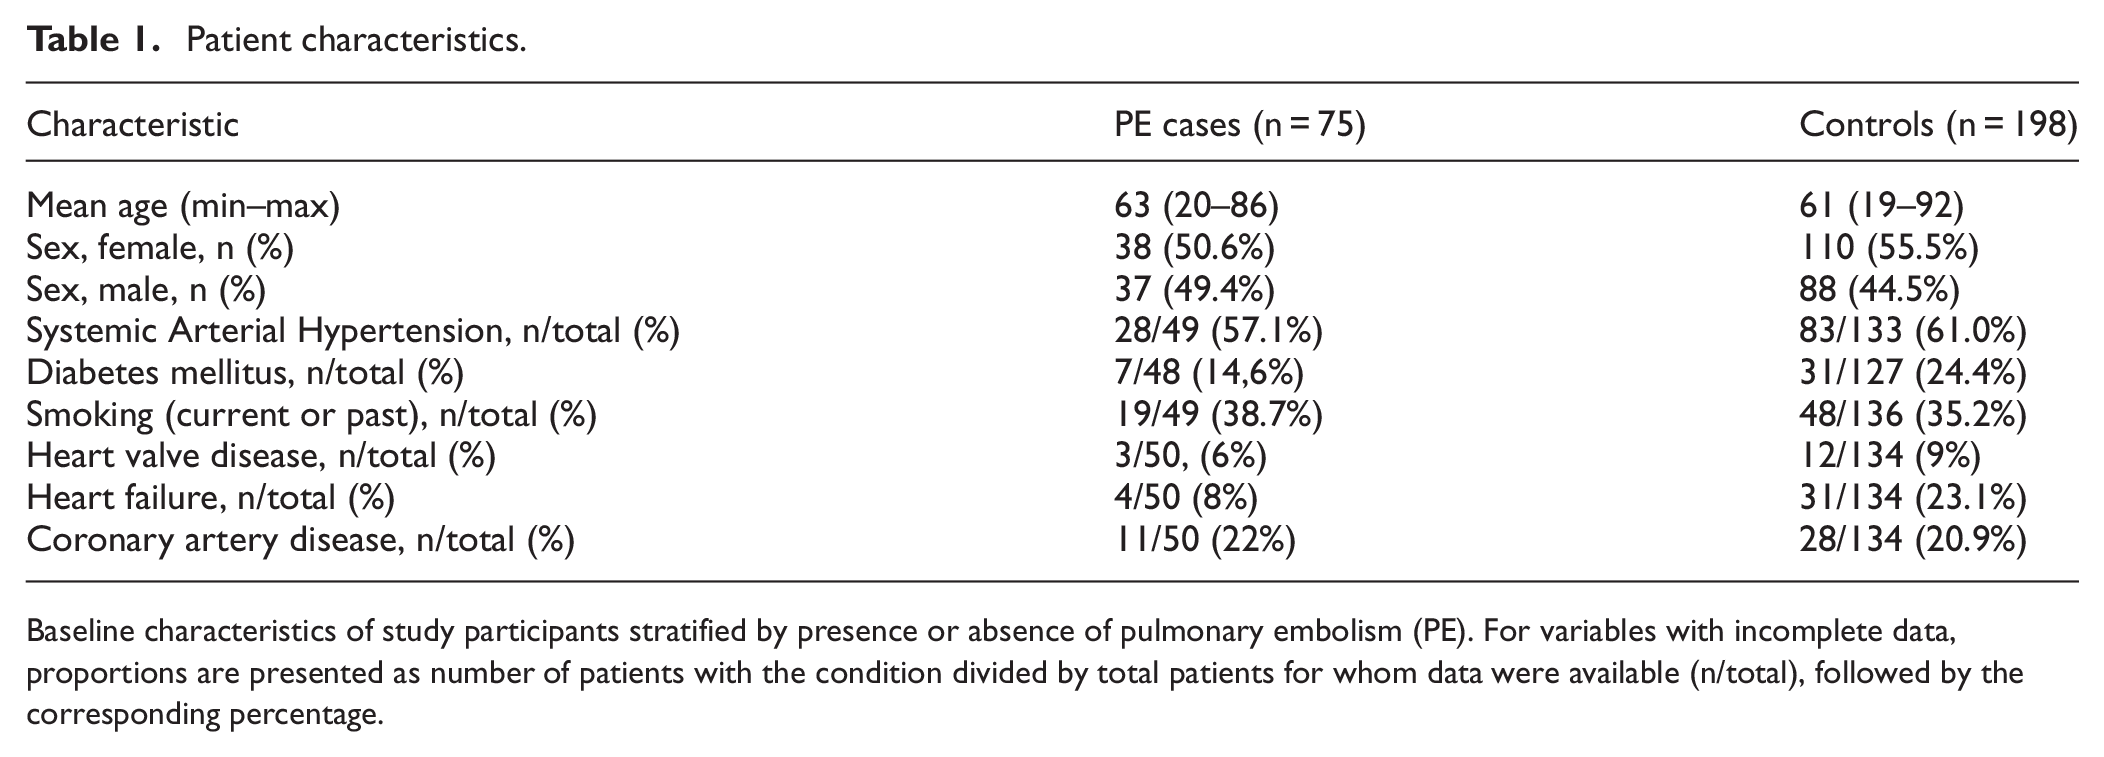
Baseline characteristics of study participants stratified by presence or absence of pulmonary embolism (PE). For variables with incomplete data, proportions are presented as number of patients with the condition divided by total patients for whom data were available (n/total), followed by the corresponding percentage.
Logistic regression analysis
In the simple logistic regression analysis, ECG findings of tachycardia (heart rate >100 bpm), negative or flattened T-waves in ≥2 inferior leads, and negative or flattened T-waves in ≥2 anterior leads (V1–V3) demonstrated statistically significant associations with PE. However, in the multiple logistic regression model, only tachycardia and negative or flattened T-waves in ≥2 inferior leads maintained statistical significance (Table 2). Despite achieving statistical significance, this regression model was not pursued further for clinical diagnosis or used for developing a diagnostic score, due to the marginal effect sizes and the limited discriminatory power of the model, reflected by an area under the receiver operating characteristic curve (AUC) of 0.64 (95% CI 0.57–0.71).
Logistic regression analysis of ECG findings.
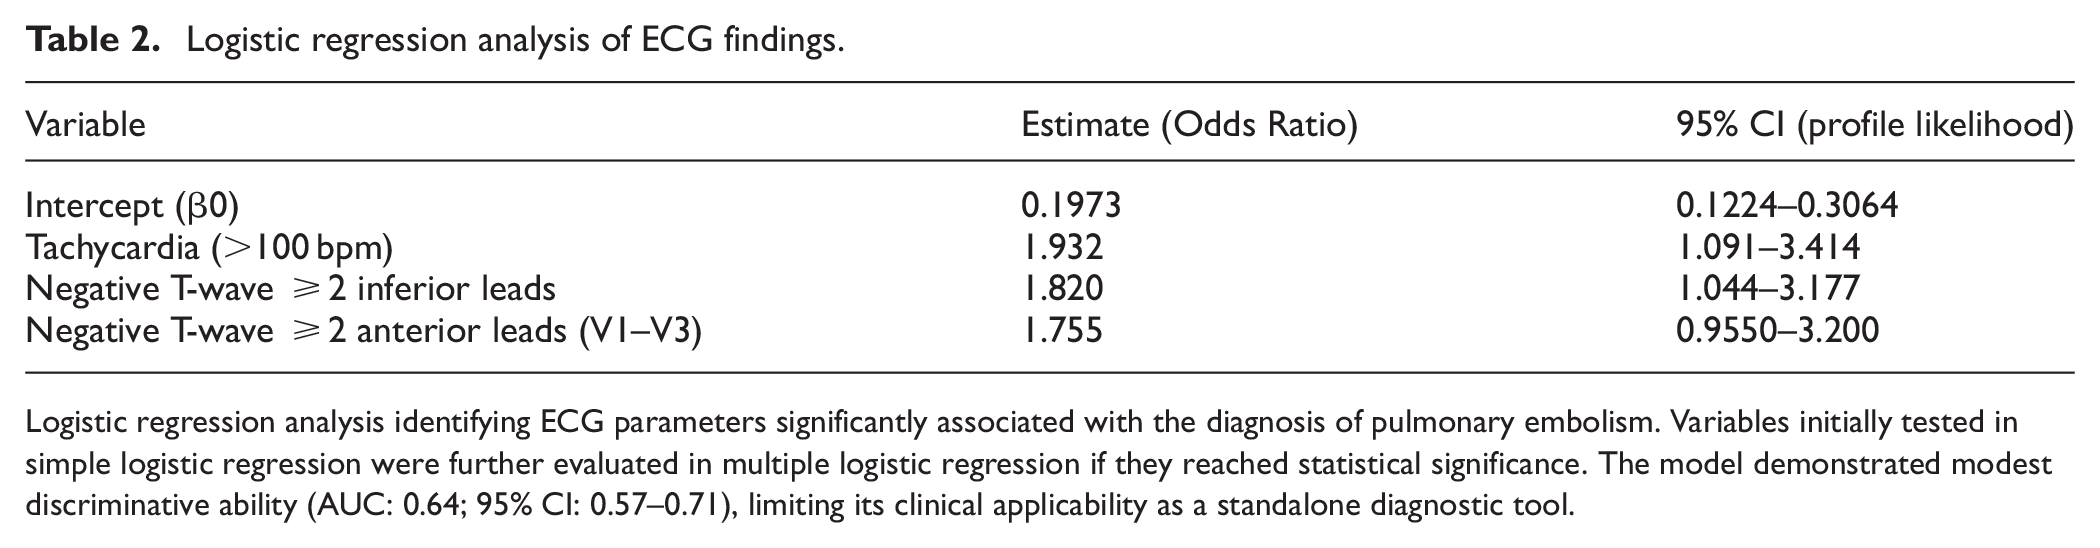
Logistic regression analysis identifying ECG parameters significantly associated with the diagnosis of pulmonary embolism. Variables initially tested in simple logistic regression were further evaluated in multiple logistic regression if they reached statistical significance. The model demonstrated modest discriminative ability (AUC: 0.64; 95% CI: 0.57–0.71), limiting its clinical applicability as a standalone diagnostic tool.
Diagnostic accuracy measures
We subsequently evaluated the diagnostic accuracy metrics for the ECG criteria traditionally associated with PE. In addition, negative or flattened T-waves in ≥2 inferior leads were analyzed individually, as this finding was identified as statistically significant in both simple and multiple logistic regression analyses.
The classical definition of RV strain (ST-segment depression ≥0.5 mm and negative T-waves concurrently present in ≥2 inferior leads and ≥2 anterior leads [V1–V3]) was extremely uncommon in our sample, occurring in only one patient in the PE group, thus precluding meaningful accuracy calculations. Therefore, we decided to analyze a more liberal definition of RV strain, considering isolated negative or flattened T-waves (without requiring concurrent ST depression) in ≥2 inferior and ≥2 anterior leads. This modified RV strain definition was selected based on the statistically significant associations found for inferior and anterior negative T-wave findings in the logistic regression analysis. The diagnostic accuracy results for these ECG parameters are presented in Table 3.
Diagnostic accuracy of selected ECG findings for PE diagnosis.
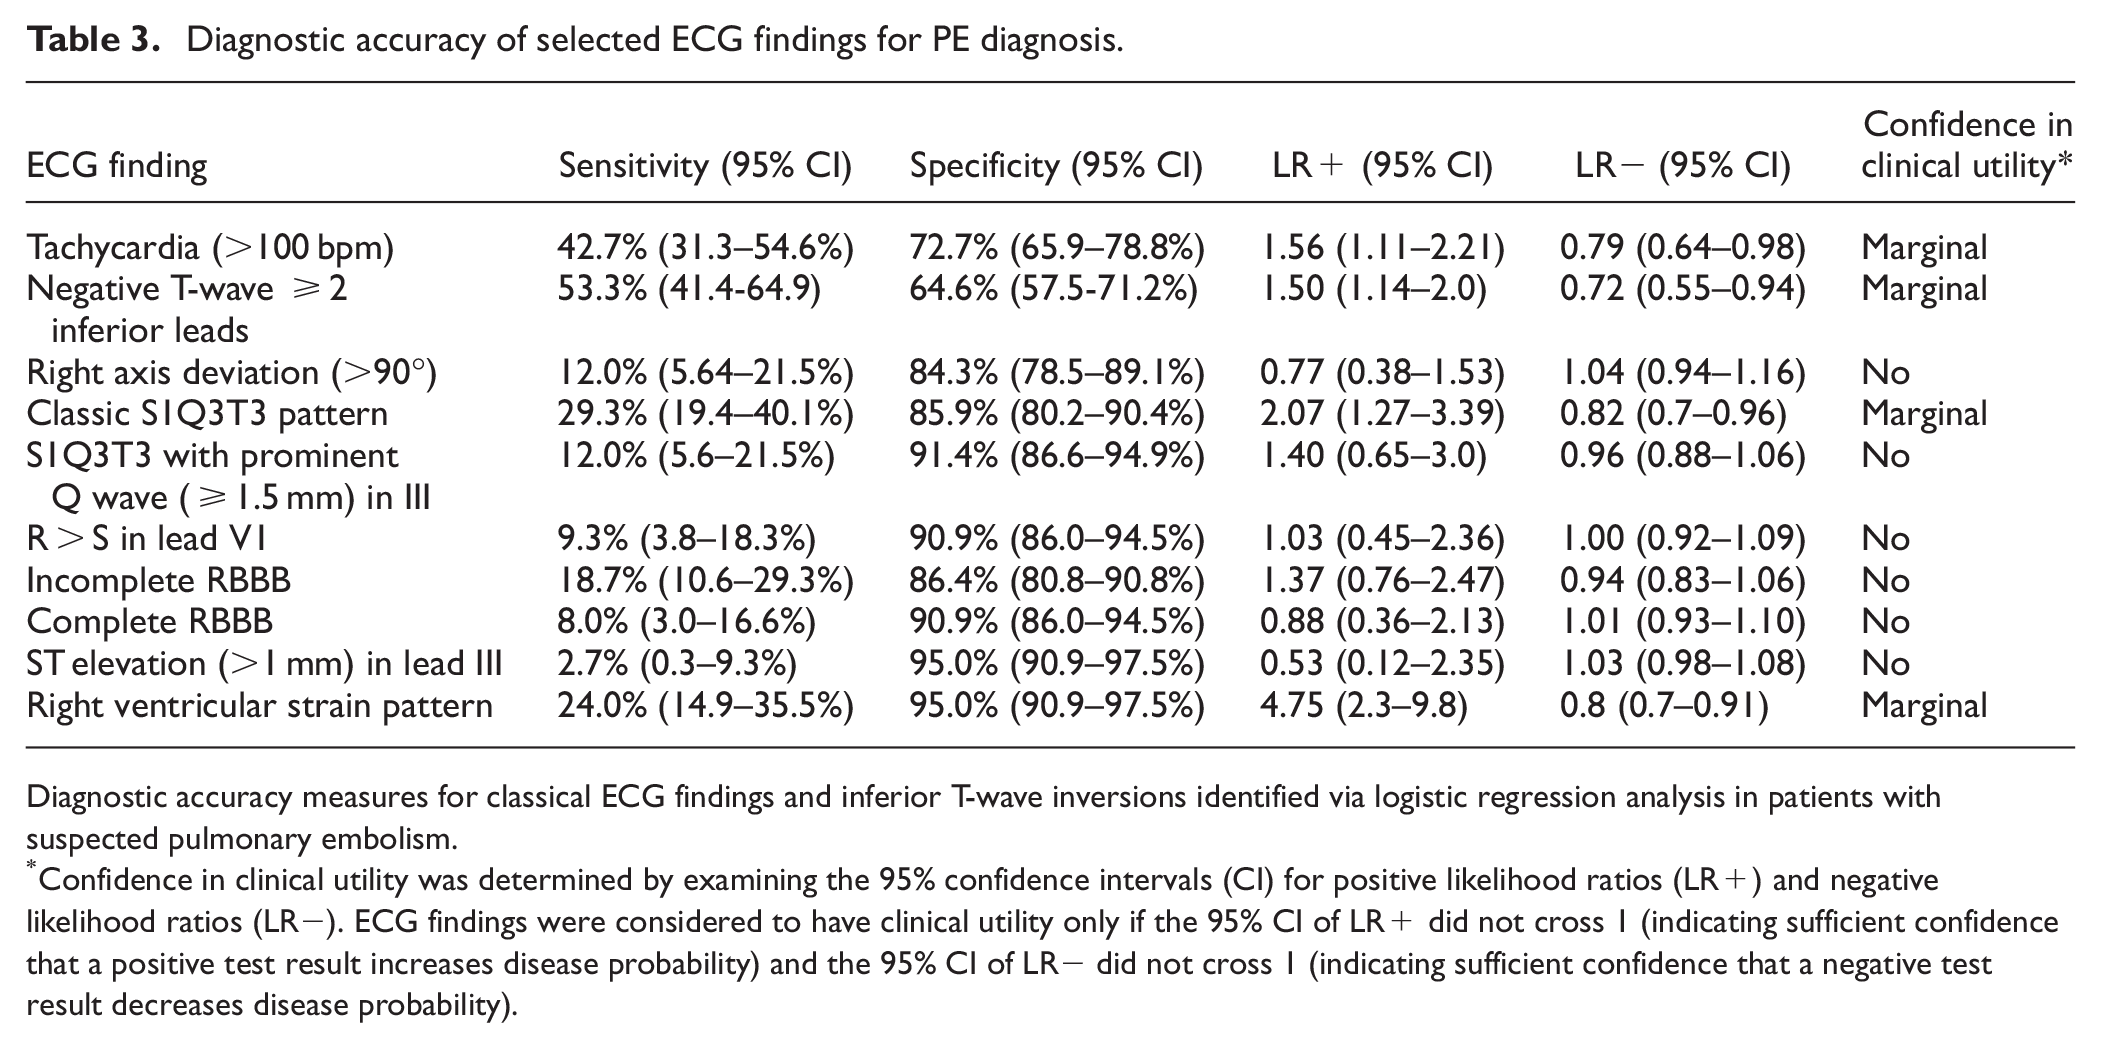
Diagnostic accuracy measures for classical ECG findings and inferior T-wave inversions identified via logistic regression analysis in patients with suspected pulmonary embolism.
Confidence in clinical utility was determined by examining the 95% confidence intervals (CI) for positive likelihood ratios (LR+) and negative likelihood ratios (LR−). ECG findings were considered to have clinical utility only if the 95% CI of LR+ did not cross 1 (indicating sufficient confidence that a positive test result increases disease probability) and the 95% CI of LR− did not cross 1 (indicating sufficient confidence that a negative test result decreases disease probability).
Additional analyses
The diagnostic accuracy of ECG findings was reassessed after reclassifying subsegmental pulmonary embolism cases as controls (resulting in 62 PE cases and 211 controls). In this analysis, tachycardia, negative or flattened T-waves in ≥2 inferior leads, and the RV strain pattern retained statistical significance, although their diagnostic utility remained marginal, as indicated by their LR+ values and confidence intervals (Table 4). The other classical ECG findings lost statistical significance and clinical utility under these revised conditions.
Diagnostic accuracy measures with subsegmental PE considered controls.
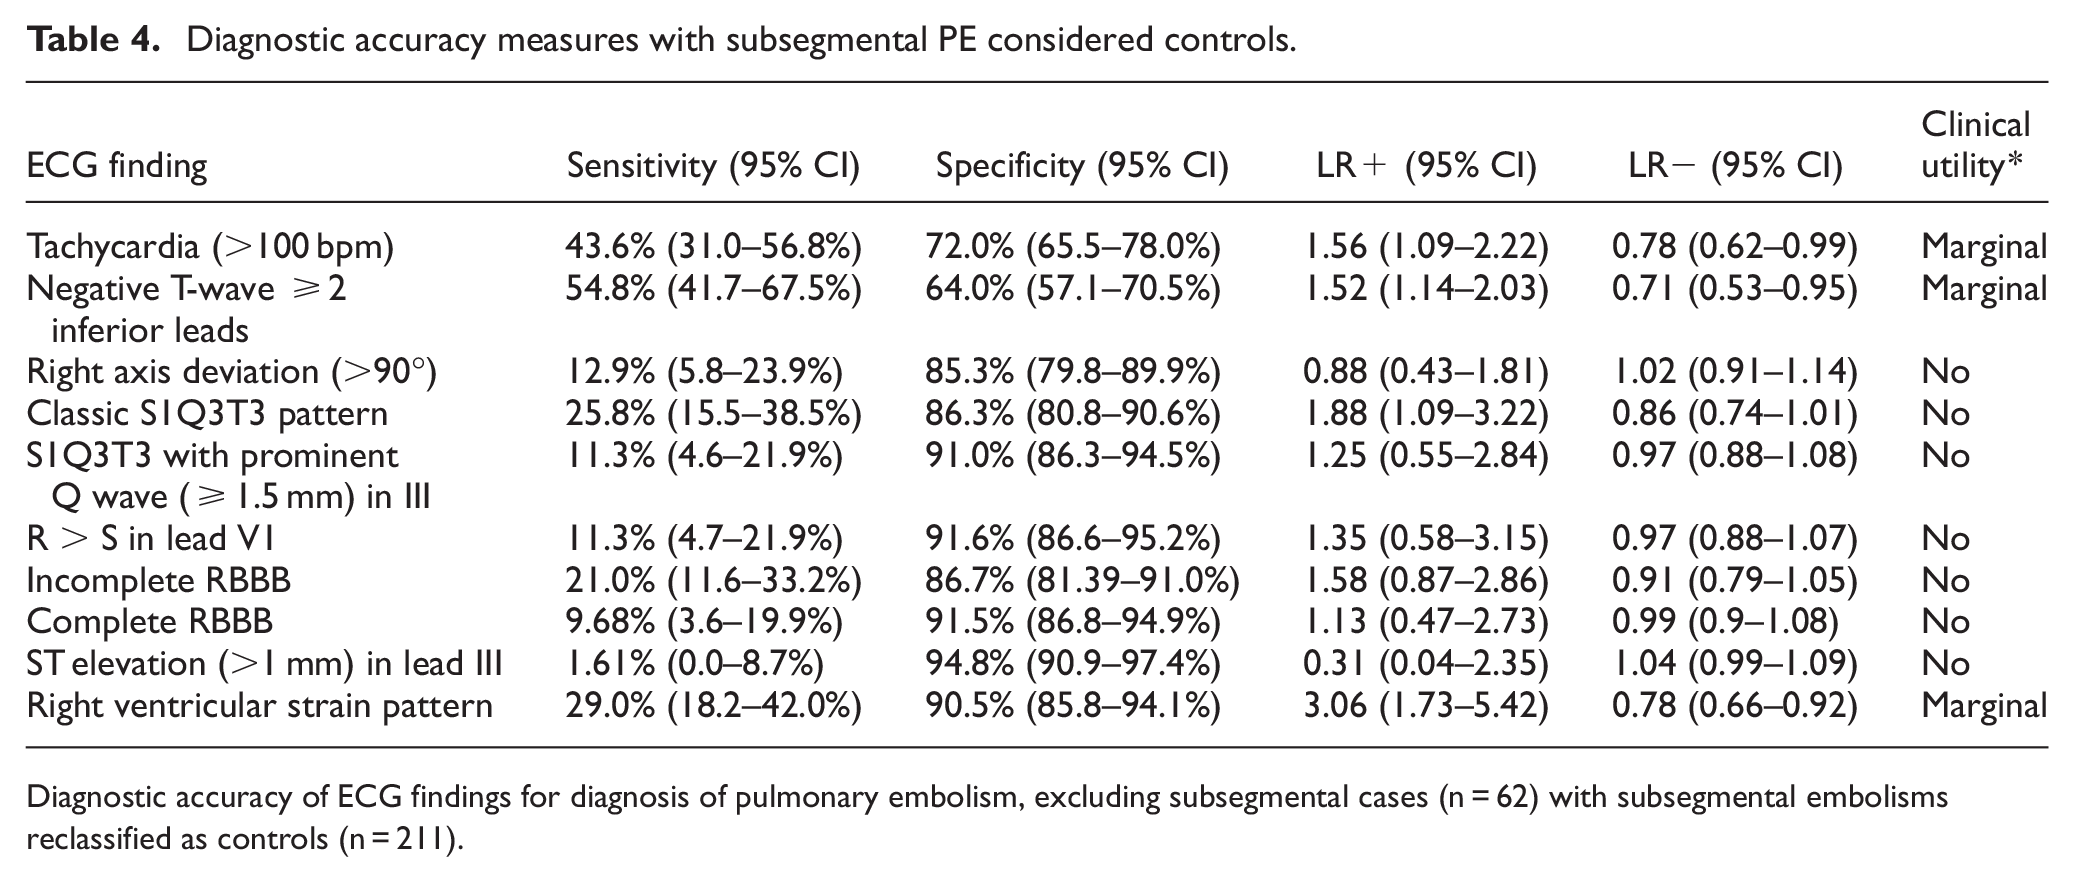
Diagnostic accuracy of ECG findings for diagnosis of pulmonary embolism, excluding subsegmental cases (n = 62) with subsegmental embolisms reclassified as controls (n = 211).
Discussion
While the limited role of ECG signs in diagnosing PE is likely familiar to experienced clinicians, persistent misconceptions regarding the specificity or diagnostic reliability of classic ECG patterns remain common. Much of this misunderstanding arises from frequency-based observational studies, which often fail to compare the prevalence of ECG findings between PE patients and appropriate controls or neglect to provide confidence intervals, thereby obscuring the true diagnostic performance of these signs.
Our cross-sectional diagnostic accuracy study included all consecutive patients with suspected PE undergoing CTPA at a high-volume tertiary cardiology center over a two-year period. Among the classical ECG signs traditionally associated with PE, only the S1Q3T3 pattern and the RV strain pattern showed sufficient statistical evidence to meaningfully alter the likelihood of PE. However, important caveats accompany these findings.
The clinical utility of both S1Q3T3 and the RV strain pattern in our study was minimal, with LR suggesting marginal clinical relevance at best. The confidence intervals for LR+ and LR− were carefully evaluated for clinical utility. Although statistically significant, the LR+ of 2.07 (95% CI: 1.27–3.39) for the S1Q3T3 pattern offers minimal diagnostic support. Translating this into clinical practice, a patient with a low Wells score and a pretest probability for PE of approximately 1.3% 18 who presents with an S1Q3T3 pattern would experience only a marginal increase in post-test probability, rising to roughly 2.7%. 19 Such a marginal increase is clinically insignificant, given that the probability of a false-positive result remains exceedingly high at 97.3%.
The classical definition of RV strain, STD, and negative T-waves in both inferior and anterior (V1–V3) leads was scarcely encountered in our sample, limiting statistical analysis. We therefore adopted a more liberal definition, requiring negative or flattened T-waves in ≥2 inferior leads and ≥2 anterior leads (V1–V3). This decision was supported by findings from our logistic regression analyses, which identified these T-wave changes as independently significant. Even with this relaxed definition, the resulting LR+ of 4.75 (95% CI: 2.3–9.8), though statistically significant, remained clinically questionable. Using the same example patient scenario (low Wells score, pretest probability of 1.3%), the presence of this liberalized RV strain pattern would yield a modestly increased post-test probability of approximately 5.9%, still accompanied by a substantial likelihood of false-positive findings (94.1%).
Previous cross-sectional studies align with our findings. Sinha et al. found a sensitivity of 11.54% (95% CI 6.60%–18.32%) and specificity of 97.14% (95% CI 92.85%–99.22%) for the S1Q3T3 pattern. 20 Their reported LR+ of 4.04 (95% CI: 1.38–11.85), although statistically significant, remains marginal from a clinical standpoint. In addition, the wide confidence interval considerably reduces the statistical confidence of this finding—an important limitation not highlighted by the original authors.
Marchick et al. conducted perhaps the largest multicenter study on ECG accuracy in PE. Their results closely mirror ours: the S1Q3T3 pattern had a sensitivity of 8.47% (95% CI 5.79%–11.88%), specificity of 97.74% (95% CI 97.32%–98.11%), and an LR+ of 3.75 (95% CI 2.56–5.49). 15 Notably, tachycardia had an odds ratio of 1.8 (95% CI 1.1–2.9) in their multiple logistic regression analysis, closely resembling our own findings (OR 1.93; 95% CI 1.09–3.41).
Our analysis emphasizes the critical point that ECG signs, although widely discussed in clinical education and guidelines, provide minimal diagnostic contribution in suspected PE cases. Evaluating clinical utility through LR confidence intervals reveals the marginal or negligible diagnostic value of these ECG parameters, underscoring the need for cautious interpretation in clinical practice. Clinicians must recognize that an ECG alone lacks the power to meaningfully influence diagnostic decisions regarding PE.
It is essential to clarify that our study strictly assessed diagnostic accuracy, not prognostic relevance. A recent systematic review demonstrated that ECG findings could significantly predict adverse outcomes, including in-hospital mortality, with notable associations identified for the S1Q3T3 pattern, complete RBBB, T-wave inversions, right axis deviation, and atrial fibrillation. 21 Likewise, a single-center series of 677 unselected PE cases (no control arm) reported S1Q3T3 in only 10% of the overall cohort but in 62% of patients who exhibited CT-defined RV enlargement. 22 Taken together, these data suggest that classical ECG abnormalities could have prognostic value once RV pressure overload is documented, yet they remain insufficiently sensitive or specific for initial diagnosis in an undifferentiated ED population. Our cohort did not include sufficient numbers of severely ill patients to evaluate prognostic implications reliably.
Limitations
Our study presents certain limitations that merit consideration. First, we experienced a substantial number of patient exclusions (n = 283) due to missing or inadequately timed ECG recordings, potentially introducing selection bias into our sample. Additionally, our study was vulnerable to potential work-up bias, as inclusion was restricted exclusively to patients who underwent CTPA, our reference standard. Consequently, patients with lower clinical suspicion or milder symptoms—who typically do not receive CTPA—may have been systematically underrepresented, possibly skewing our reported sensitivity and specificity metrics toward a more severe clinical presentation.
Furthermore, patients with massive PE or significant hemodynamic instability were probably underrepresented in our sample, limiting the generalizability of our findings to this higher-risk population. We did not collect CT- or echo-defined RV strain parameters, so we could not analyze ECG performance in the subset with hemodynamically significant PE; however, external studies that did include such metrics have reported numbers very similar to ours.
Another limitation stems from the single-center design of our study, conducted at a tertiary cardiology referral center. Such institutions typically manage more complex cardiac cases, possibly influencing baseline ECG abnormalities and limiting the external validity of our findings to broader, nonspecialized settings.
Moreover, while our sample size was calculated based on historical estimates of ECG sensitivity and specificity, the relatively small absolute number of confirmed PE cases (n = 75) may have limited our ability to identify statistically robust differences, particularly for rarer ECG abnormalities or specific subtypes of PE (e.g., massive PE).
Finally, our methodology involved multiple ECG parameters tested simultaneously, potentially increasing the risk of type I statistical error due to multiple comparisons. Although we mitigated this by employing logistic regression to initially select relevant ECG findings, residual effects of multiplicity cannot be entirely excluded.
Conclusion
In this cross-sectional diagnostic accuracy study involving consecutive patients with suspected pulmonary embolism undergoing CTPA, we found that classical electrocardiographic signs traditionally associated with PE demonstrated poor diagnostic performance. Among these, only the S1Q3T3 pattern and a liberalized definition of RV strain showed statistically significant, albeit marginal, diagnostic accuracy. Both findings yielded likelihood ratios insufficient for meaningful clinical decision-making, highlighting the limited utility of ECG in diagnosing PE.
Our findings reinforce a crucial clinical message: electrocardiographic signs, despite historical emphasis, should not significantly influence diagnostic reasoning in PE due to their minimal predictive value. Clinicians should interpret ECG abnormalities cautiously, always integrating them with clinical probability assessments and validated imaging modalities, given the high false-positive rates associated with these findings.
Footnotes
Author Contributions
MFS: Project administration, analysis, writing, and reviewing final draft.
GPSAS, JNH, MTCA, MKS, SPF, MFNDM: Analysis.
JNdA: Methodology, project administration, writing, reviewing final draft.
Declaration of Conflicting Interests
The author(s) declared no potential conflicts of interest with respect to the research, authorship, and/or publication of this article.
Funding
The author(s) received no financial support for the research, authorship, and/or publication of this article.