






Abstract
Type 2 diabetes mellitus (T2DM) involves inadequate insulin production and utilization. Osteocalcin (OC) links bone and energy metabolism, existing as carboxylated (cOC) and undercarboxylated (ucOC) isoforms. The ucOC/cOC ratio is influenced by vitamin K epoxide reductase complex subunit 1 (VKORC1) gene variants and vitamin intake. This study analyzes the effects of vitamin D3 (VD3) and vitamin K2 (VK2) supplementation on ucOC, insulin levels, homeostatic model assessment of insulin resistance (HOMA-IR), and the percentage of functional pancreatic beta cells (%FPβC) in Mexican Citizens with T2DM carrying the VKORC1 rs8050894 variant. The present randomized clinical trial recruited 40 Mexican subjects with T2DM. Participants were assigned to one of three groups receiving VD3, VK2, or a combination of both over a 3-month period. ucOC levels and insulin were measured using an ELISA assay; glucose and lipid profiles were measured by spectrophotometry (ERBA XL200). HOMA-IR and %FPβC were calculated. The rs8050894 variant was genotyped using allelic discrimination with real-time polymerase chain reaction. All groups exhibited significantly lower levels of glucose and %FPβC. Significant effects were observed in glucose, insulin, %FPβC, and HOMA-IR in CG genotype carriers in the VK2 group. On the other hand, CC genotype carriers showed higher ucOC levels compared to other genotypes in the VK2 and VK2 + D3 intervention groups.
Trial Registration number: NCT04041492. 2019-07-3. https://clinicaltrials.gov/show/NCT04041492
Introduction
Type 2 diabetes mellitus (T2DM) is a condition characterized by insufficient insulin production and impaired insulin action, resulting in reduced glucose uptake by insulin-dependent tissues, which induces hyperglycemia. This hyperglycemia contributes to metabolic dysregulation due to insulin resistance, decreased glucose utilization, and increased endogenous glucose synthesis.1,2 Insulin resistance is the central pathophysiological feature of T2DM, commonly assessed using surrogate indices based on fasting glucose and insulin concentration. Homeostatic model assessment of insulin resistance (HOMA-IR) is one of the most widely used and validated tools for estimating insulin resistance in clinical and epidemiological studies, particularly in intervention settings.3,4 The long-term complications of T2DM include comorbidities such as retinopathy, nephropathy, peripheral neuropathy, atherosclerosis, and hypertension.1,2
T2DM is also a significant risk factor for cardiovascular diseases, as reported by the American Heart Association. 5 Patients with T2DM often exhibit characteristics such as central obesity and dyslipidemia, which include low levels of high-density lipoprotein (HDL) cholesterol, normal or slightly elevated low-density lipoprotein (LDL) cholesterol with a predominance of small, dense LDL particles, elevated triglyceride levels, and increased very low-density lipoproteins (VLDL). 6
The World Health Organization reported a significant increase in the number of individuals with T2DM, rising from 200 million in 1990 to 830 million in 2022. In addition, T2DM prevalence has increased among young adults over recent decades. 7 According to data, México has one of the highest prevalences of T2DM in Latin America. 8 The National Health and Nutrition Survey (ENSANUT) in 2022 reported a T2DM prevalence of 18.3% in the Mexican population. 9
Nutrition plays a crucial role in the development, prevention, and management of T2DM. Multiple studies have identified an association between high intakes of processed meats and sugary beverages, along with low intakes of fruits and vegetables, and an increased risk of T2DM. In addition, an unhealthy diet combined with insufficient physical activity contributes to overweight and obesity, which are also linked to the development of T2DM. Therefore, an effective treatment strategy for these patients should emphasize a balanced approach that includes proper nutrition, medication, and regular physical exercise.10–12
Prolonged exposure to a diabetic environment leads to alterations in bone metabolism and compromised bone microarchitecture through various mechanisms. These mechanisms may involve direct effects, such as altered cross-link formation, or indirect effects, including changes in the cellular activity of osteoblasts and bone progenitor cells. The combination of these alterations ultimately reduces the tensile strength and post-yield properties of bone, making bone tissue in T2DM patients more susceptible to microdamage, fragility fractures, and delayed fracture healing. 13
T2DM is a chronic degenerative condition where the body does not produce enough insulin or the cells do not respond properly, leading to hyperglycemia.
According to the National Health and Nutrition Survey (ENSANUT) 2022, the prevalence of T2DM in Mexico was 18.4% (including diagnosed and undiagnosed cases), and 83% of the adult population presented associated risk factors.
Recent research has indicated that ucOC is involved in glucose metabolism by regulating insulin signaling.
There was a significant decrease in glucose as well as in %FPβC levels in all supplementation groups.
CG genotype carriers of rs8050894 (VKORC1) may exhibit a more favorable response to VK2 supplementation, as they showed greater improvement in glucose, insulin, %FPβC, and HOMA-IR.
CG genotype carriers of rs8050894 (VKORC1) may also have a favorable response to VK2 + VD3 supplementation, as they showed improvement in glucose levels.
In this study, we observed that effects can differ according to genotype and should be considered in how supplementing may affect subjects with T2DM.
Future research studies should assess the impact of the combination of VK2 and VD3 with different dosages and consider other factors involved in energy metabolism.
Beyond its metabolic complexity, growing evidence suggests that micronutrients involved in bone and energy metabolism may play a modulatory role in glucose homeostasis. In particular, two liposoluble vitamins, vitamin K (VK) and vitamin D (VD), have gained attention due to their complementary roles in bone-derived endocrine signaling and glucose regulation.14–16
Vitamin K2 (VK2) has been shown to enhance insulin sensitivity by downregulating the gene expression of pro-inflammatory cytokines, such as interleukin 6 (IL-6), tumor necrosis factor-alpha (TNF-α), and interleukin-1beta (IL-1β). Beyond its anti-inflammatory effect, VK2 acts as a cofactor in the γ-carboxylation of VK-dependent proteins, including osteocalcin (OC), which supports bone mineralization and metabolic regulation.17,18 Studies have demonstrated that VK2 supplementation improves insulin resistance and reduces the risk of developing T2DM and its associated comorbidities.19,20 A daily dose of 100 µg of VK2 has been shown to enhance OC γ-carboxylation, thereby improving bone metabolism. 21
A complementary vitamin is vitamin D3 (VD3), playing a distinct role in this system. VD3 is a crucial factor for bone development and maintenance, as well as for the regulation of normal calcium and phosphorus homeostasis. 16 VD deficiency is more prevalent among patients with T2DM compared to the general population. In a state of VD deficiency, the small intestine can absorb up to 10%–15% of dietary calcium, which has significant clinical implications for bone health and metabolic functions. Furthermore, VD plays a role in reducing inflammation, which helps mitigate insulin resistance, a key factor in the development of T2DM.22,23 At the molecular level, VD binds to the VD receptor in osteoblasts and activates osteocalcin gene (BGLAP) transcription, increasing OC synthesis, a 49-amino acid protein. This increases substrate availability for subsequent VK-dependent carboxylation. 24 The synergistic role of these micronutrients, in combination, is well-defined as adjuvants for enhancing bone health and contributing to an improved glycemic profile. 25
In this context, OC has emerged as a key mediator of the crosstalk between bone and energy metabolism. Following synthesis, OC undergoes post-translational modification by the γ-glutamyl carboxylase enzyme (GGCX).26–28 This enzymatic modification results in two isoforms: carboxylated osteocalcin (cOC) and uncarboxylated osteocalcin (ucOC). The latter exerts significant metabolic effects by enhancing glucose tolerance through increased proliferation of pancreatic beta cells, as well as promoting insulin synthesis, secretion, and glucose uptake.28–31
The γ-carboxylation of OC depends on the VK cycle, which relies on two key enzymes: GGCX and VK epoxide reductase (VKOR). GGCX catalyzes the carboxylation reaction and requires VK hydroquinone (VKH), carbon dioxide, and oxygen as cofactors. During this reaction, VKH is oxidized to form VK epoxide (VKE). Subsequently, VKOR reduces VKE back to VKH, thereby restoring its bioavailability and completing the cycle.19,29 This regeneration process is essential because the γ-carboxylation of OC is directly dependent on the continuous availability of VK, where VD participates simultaneously (Figure 1). Any disruption in this cycle can shift the balance from cOC toward ucOC production. 26
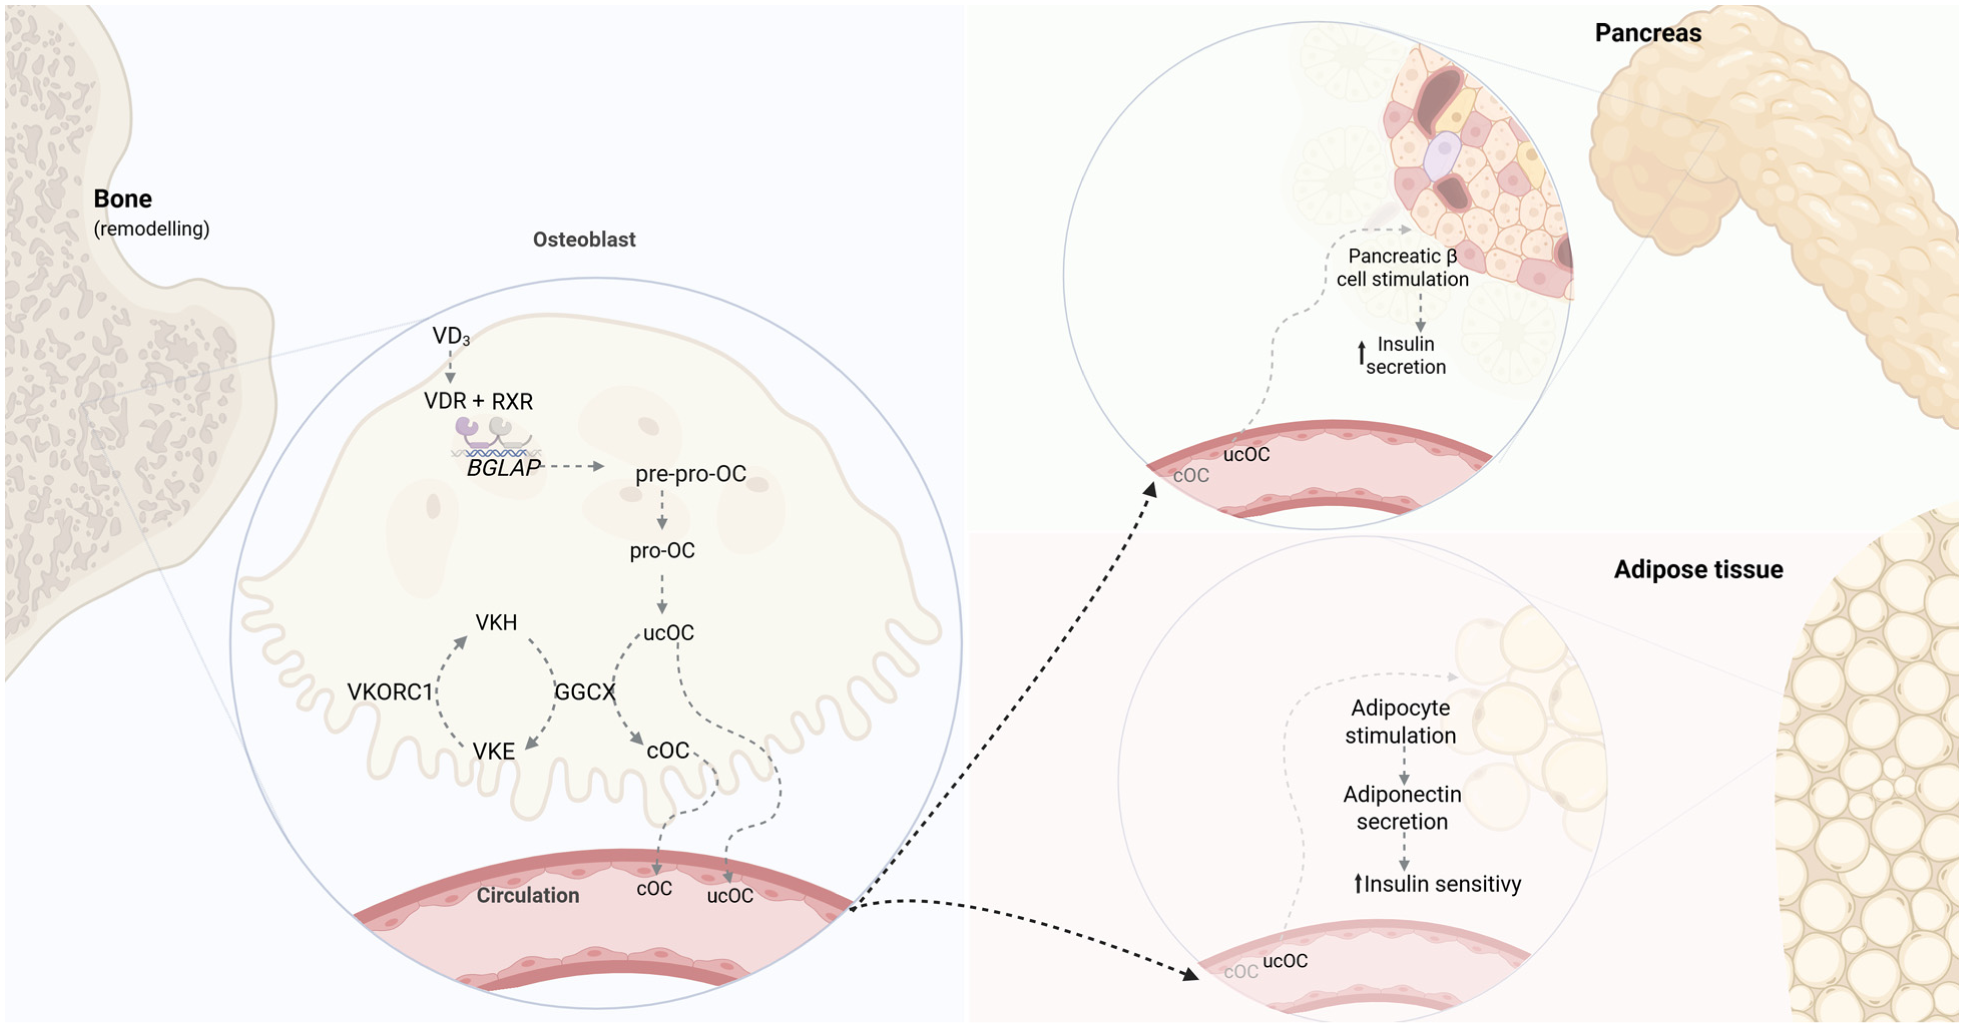
Integration of VD, VK cycle, and OC. VD actions are primarily mediated by its activated form through the VDR. Upon nuclear entry, the metabolite binds to VDR, which heterodimerizes with RXR, and this complex binds VD-responsive elements in DNA to modulate gene transcription. VD activation occurs in the liver and kidney, though osteoblasts can also locally activate 25(OH)D3 for autocrine regulation. 16 Through direct action on osteoblasts, VD promotes cellular maturation and upregulates BGLAP expression, producing pre-pro-osteocalcin to then form pro-osteocalcin. Pro-osteocalcin undergoes VK-dependent γ-carboxylation by GGCX, which requires VKH as a cofactor that is oxidized to VKE and recycled by VKORC1, known as the VK cycle. During bone remodeling, both cOC and ucOC are released into circulation, where ucOC functions as an endocrine hormone that enhances glucose metabolism by stimulating pancreatic β-cell proliferation and insulin secretion, promoting adiponectin release to improve insulin sensitivity, playing a critical role in glucose homeostasis and diabetic pathophysiology. Adapted from Aaseth et al. 16 and Martiniakova et al. 24 Created with Biorender.
The VKORC1 gene encodes the catalytic subunit of the VKOR complex. The rs8050894 (C>G) is a single-nucleotide variant (SNV) located in intron 2 of the gene.32–34 There is evidence that this variant is associated with reduced mRNA expression, thereby decreasing the levels of the enzyme responsible for converting VKE to VKH and affecting the efficiency of the VK cycle. In addition, the functional consequences of this variant are genotype-dependent: individuals with the GG genotype have been reported to have a lower percentage of ucOC.32,35–38 In the liver, this genetic variant significantly impacts warfarin metabolism; studies have shown that individuals homozygous for the C allele require lower doses of warfarin compared to those homozygous for the G allele. 36 Moreover, this variant has been linked to decreased bone mineral density (BMD) and variations in plasma phylloquinone concentrations.38,39 Overall, this variant affects VK-dependent OC carboxylation, influencing the ratio of cOC to ucOC levels and potentially impacting both bone health and glucose metabolism. 29
However, the impact of VKORC1 genetic variability on osteocalcin-related metabolic responses to VD and VK supplementation remains poorly characterized in populations with T2DM. In light of this knowledge gap, the aims of the present study were to (1) determine the allelic and genotypic frequencies of VKORC1 rs8050894 among Mexican patients with T2DM, (2) analyze the effects of VD3 and VK2 supplementation on the ucOC levels, HOMA-IR, and %FPβC, and (3) better understand the supplementation effects according to rs8050894 genotype.
Materials and methods
A controlled, randomized, double-blind clinical trial was conducted at the Institute of Ophthalmology, as well as the Microbiology Laboratory, Universidad de Guadalajara, from February 2017 to February 2019 (ClinicalTrials.gov identifier: NCT04041492). No participant or public was involved in the design, conduct, or reporting of the trial. Eligibility criteria were assessed through a structured face-to-face interview conducted by a physician. A comprehensive medical record was obtained for each participant, which included sociodemographic data, clinical assessments, anthropometric measurements, lifestyle habits, and medication usage.
After screening, individuals aged 30–75 years, residing in central-west México, with a confirmed diagnosis of T2DM for at least 5 years, were enrolled. Diagnosis was confirmed according to the American Diabetes Association criteria. The exclusion criteria included the following: (1) current treatment with bisphosphonates, insulin, thiazolidinediones, thiazides, acenocoumarin, steroids, oral contraceptives, orlistat, phenytoin, phenobarbital, or calcium supplements; (2) pregnancy; (3) lactation; (4) serum creatinine or transaminase levels more than twice the upper limit; and (5) dietary supplementation with calcium or VD or VK. The elimination criteria were as follows: (1) lack of adherence to the treatment protocol; (2) moderate to severe adverse drug reactions; (3) withdrawal from the study; and (4) physical or mental incapacity to complete questionnaires or provide informed consent.
All subjects signed an informed consent form, which was preceded by random assignment using a closed envelope containing the corresponding random number. Randomization was performed by an individual outside the research team, who maintained custody of the pills and treatment assignment codes. This person was also responsible for the distribution and collection of self-report compliance diaries, as well as the counting of pills and vials. The assignment of patients’ random numbers was carried out using SPSS® Statistics software, simple randomization.
Subjects were randomly assigned to one of the following groups: Group 1, VD3 1000 IU + calcinated magnesium; Group 2, VK2 100 µg + calcinated magnesium; and Group 3, VD3 1000 IU + VK2 100 µg. Each group received two pills per day for 3 months. The treatments were identical in appearance, taste, and smell. The pills had the same number, shape, size, color, and consistency. These were provided in equal vials for all groups. The calcined magnesia used in some groups has an antacid effect 39 and was administered as a placebo, ensuring that the study remained double-blinded.
All subjects were instructed to follow a healthy lifestyle; however, no pharmacological treatment nor healthy lifestyle intervention was provided. Subjects underwent a 3-month follow-up and were assessed monthly. Subjects were instructed to record all significant events in the compliance diary to ensure correct intake and monitor any adverse effects. Adherence was measured using the Morisky–Green–Levine test. Data were kept under strict confidentiality and could only be accessed upon completion of the study.
Anthropometric and clinical measurements
Anthropometric and clinical assessments were performed at baseline and follow-up visits. Body weight (kg), height (m), waist circumference (cm), body fat percentage (BF%), and blood pressure (mmHg) were measured in all participants.
Weight and BF% were assessed using a bioelectrical impedance analyzer (TANITA® TBF-300A). Height was measured using a SECA® stadiometer using a standardized technique. Body mass index (BMI) was calculated using the formula: weight in kilograms divided by height in meters squared (kg/m2).
Waist circumference was measured at the end of a normal expiration, at the midpoint between the lowest rib and the superior border of the iliac crest, using a flexible measuring tape. Blood pressure was measured using an OMRON baumanometer.
Biochemical analysis
Ten milliliters of peripheral blood was drawn from each participant’s forearm after 8 h of overnight fasting, both before and after the intervention. Blood samples were collected by venipuncture into a serum separator tube (without additive) and centrifuged at 4000 rpm for 15 min to obtain serum. Serum glucose, total cholesterol, VLDL, and triglycerides were measured using a clinical chemistry analyzer (ERBA XL-200). cOC, ucOC, and insulin concentrations were determined using the following ELISA kits: Undercarboxylated osteocalcin Glu-Oc, Cat. No.: MK-118, and carboxylated osteocalcin Gla-Oc, Cat. No: MK-111 (Takara, USA); and Insulin Test System, 2425-300 (Monobind, Lake Forest, CA, USA).
HOMA-IR was calculated using the formula: HOMA-IR = [fasting glucose (mg/dL) × fasting insulin (μU/mL)]/405. The percentage of functional pancreatic beta cells (%FPβC) was calculated using the formula: %FPβC = [fasting plasma insulin (μU/mL) × 360]/[fasting plasma glucose (mg/dL) - 63].
DNA extraction and genotyping
Genomic DNA was extracted from leukocytes using the Roche® DNA extraction kit. The rs8050894 variant was determined by allelic discrimination with TaqMan® probes (Drug Metabolism Assay, Cat. No. 4362691; Applied Biosystems, Foster City, CA, USA). The final DNA concentration was 50 ng/μL. Experiments and analysis were conducted using the Roche LightCycler 96®. The following polymerase chain reaction conditions were applied: pre-incubation at 95°C for 60 s, followed by 45 cycles of amplification: 95°C for 15 s and annealing/extension at 60°C for 60 s.
Statistical analysis
Sample size
The sample size was calculated using the statistical formula for comparing two means, considering serum levels of ucOC in the general population as the outcome variable, with 95% statistical confidence, 80% statistical power, and a significance level of p ≤ 0.05. The calculated sample size was 12 subjects, to which 20% was added to account for potential dropouts, resulting in a final sample size of 15 subjects per group.
The Shapiro–Wilk test was used to analyze normal distribution variables. Qualitative variables were expressed as frequency and percentage, while quantitative variables as mean and standard deviation (SD) or median and interquartile range. Intra-group differences were analyzed using the paired Student’s t-test or Wilcoxon test, and between groups using Student’s t-test or Mann–Whitney U test. Comparisons between three or more groups with a dependent scalar variable were conducted using a one-way ANOVA or Kruskal–Wallis and adjusted by Bonferroni. Hardy–Weinberg equilibrium (HWE) and comparisons of genotype and allele frequency distributions between groups were evaluated using the chi-squared test (χ2). Spearman’s correlation coefficient (rho) was used to assess correlations. A p-value of <0.05 was considered statistically significant. All statistical analyses were performed using SPSS Statistics (Version 25; IBM Corp.©).
Ethics committee approval
The study was approved by the Ethics and Research Committee of the Health Sciences University Center, Universidad de Guadalajara, under registry number F-2017-1702-14. All subjects provided written informed consent in accordance with the Declaration of Helsinki.
Results
Characteristics of the study population
Forty subjects who met the inclusion criteria were randomly assigned to one of the three intervention groups: VD3, VK2, or combined VD3 + VK2. Baseline sociodemographic characteristics of the participants are summarized in Table 1. Anthropometric, biochemical, and clinical characteristics before and after intervention are shown in Table 2. One participant did not consent to genotyping; therefore, 39 subjects were included in genotype-based analyses (Supplemental Figure S1).
Sociodemographic characteristics of the study population, pre-intervention.
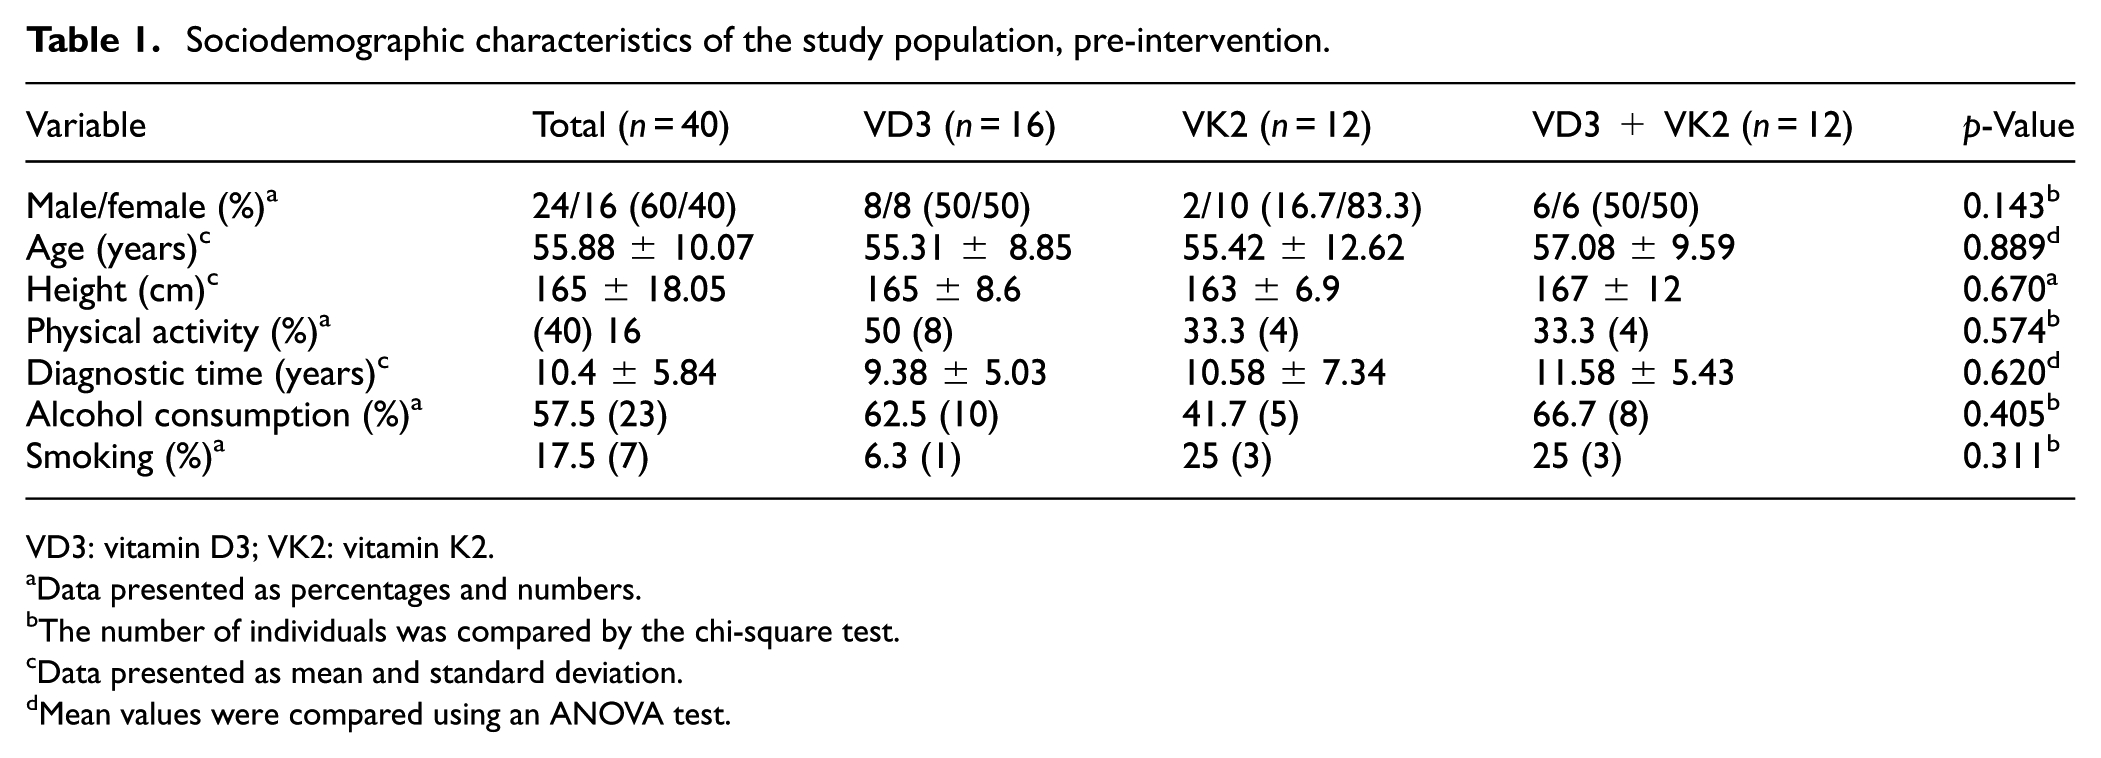
VD3: vitamin D3; VK2: vitamin K2.
Data presented as percentages and numbers.
The number of individuals was compared by the chi-square test.
Data presented as mean and standard deviation.
Mean values were compared using an ANOVA test.
Anthropometric, biochemical, and clinical characteristics of the study population, pre-intervention and post-intervention.
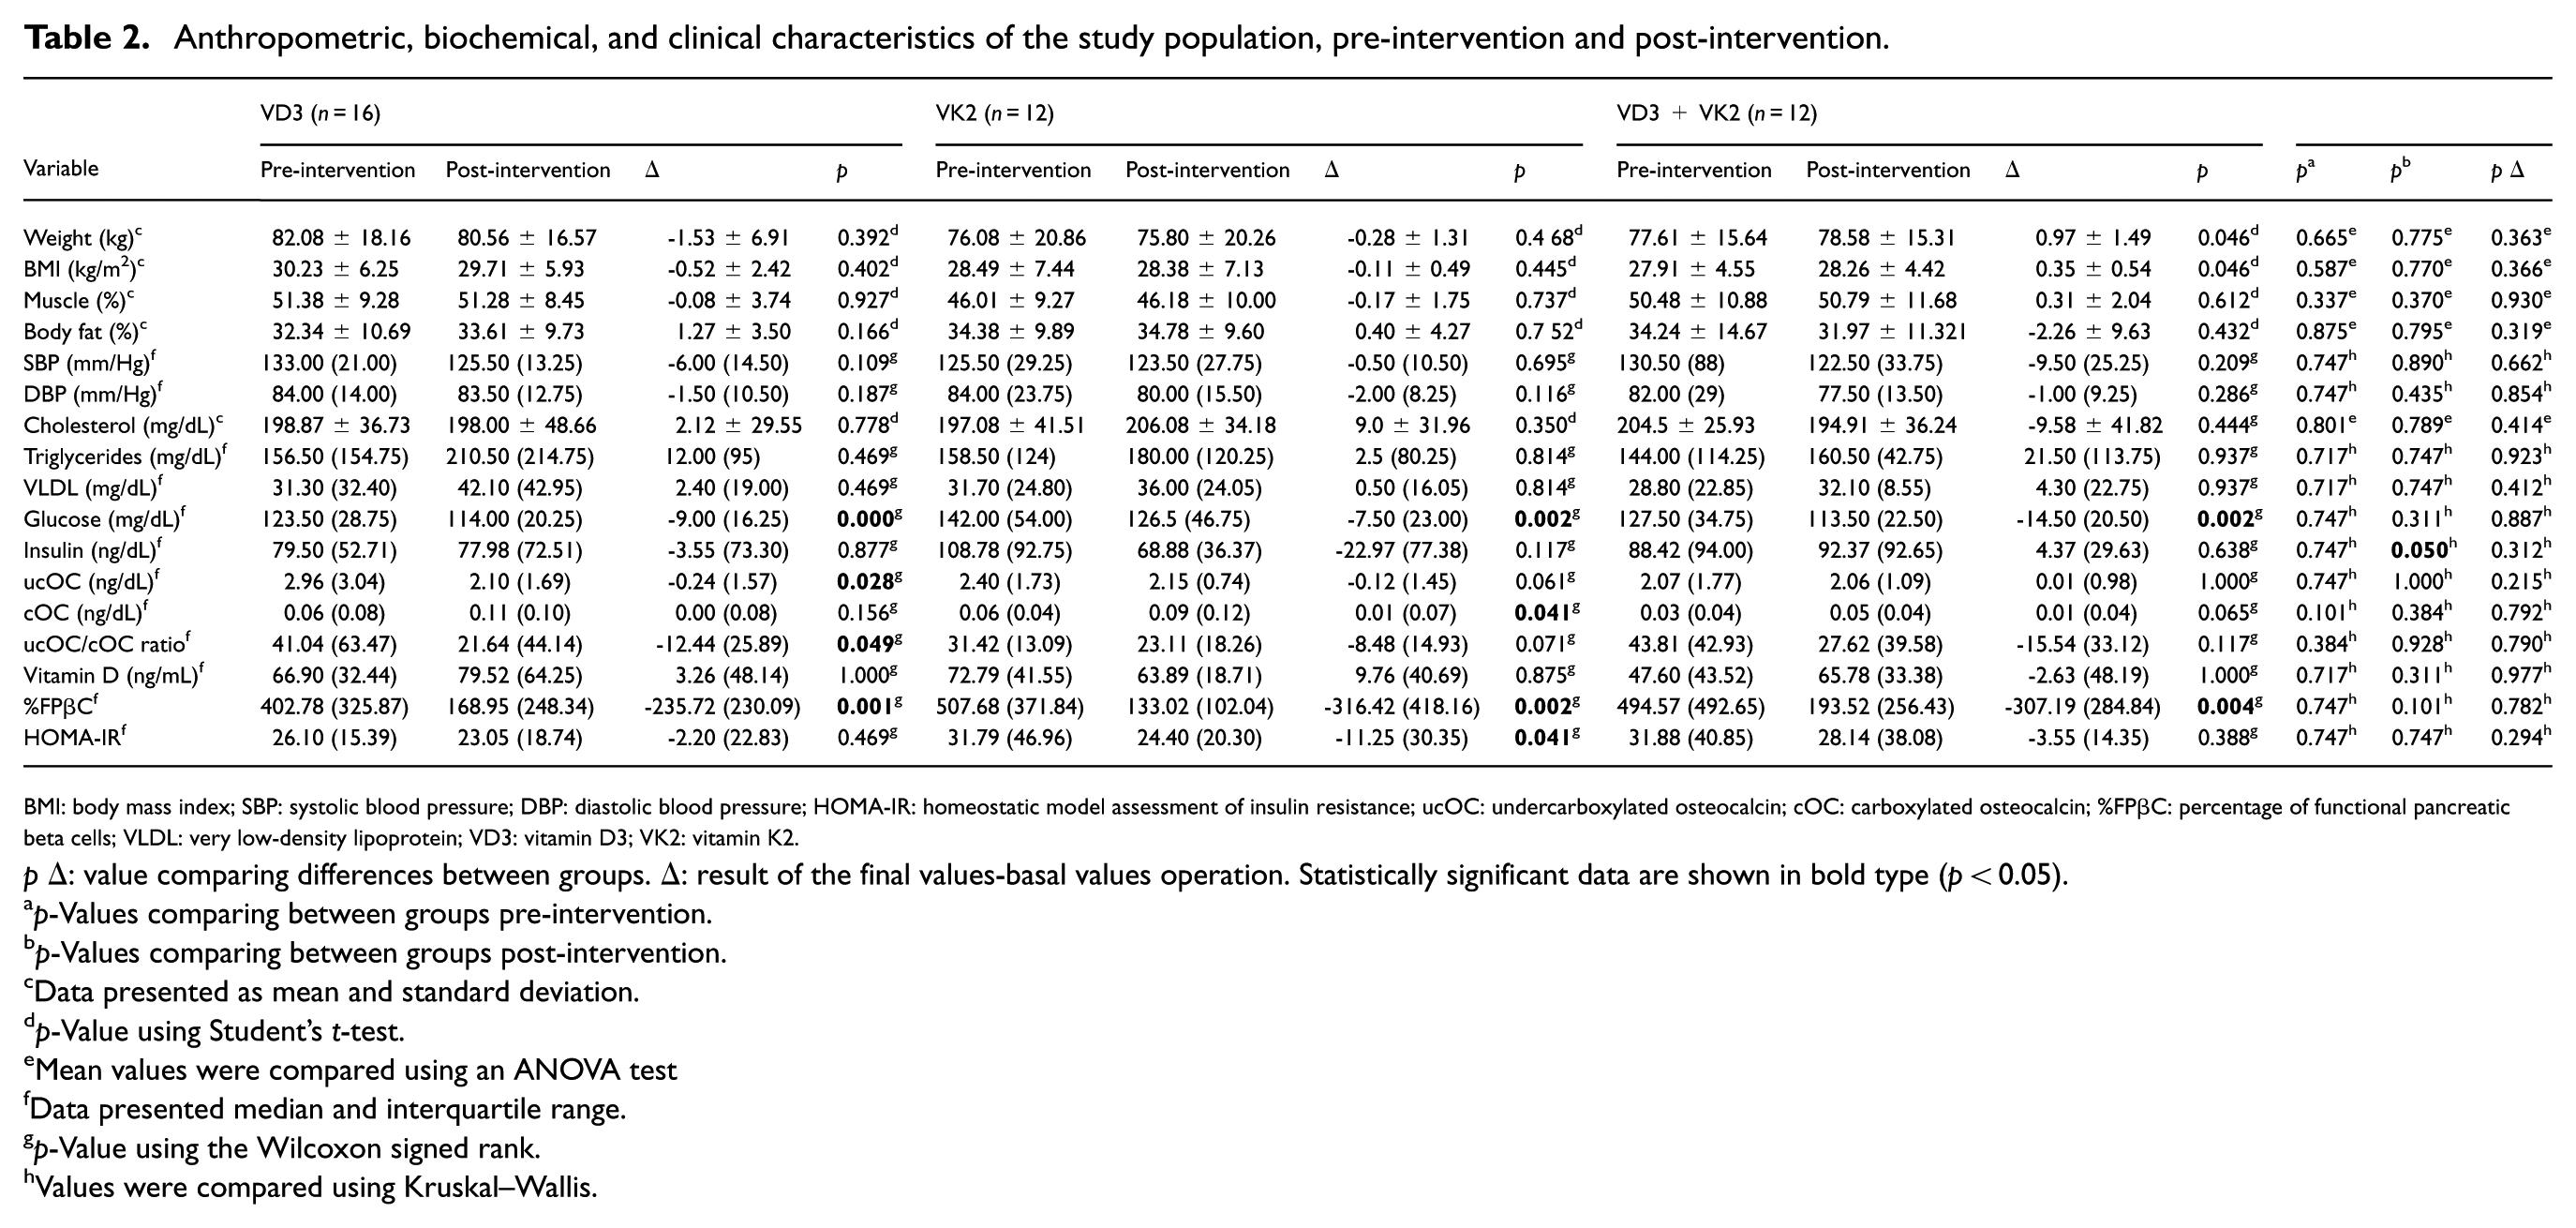
BMI: body mass index; SBP: systolic blood pressure; DBP: diastolic blood pressure; HOMA-IR: homeostatic model assessment of insulin resistance; ucOC: undercarboxylated osteocalcin; cOC: carboxylated osteocalcin; %FPβC: percentage of functional pancreatic beta cells; VLDL: very low-density lipoprotein; VD3: vitamin D3; VK2: vitamin K2.
pΔ: value comparing differences between groups. Δ: result of the final values-basal values operation. Statistically significant data are shown in bold type (p < 0.05).
p-Values comparing between groups pre-intervention.
p-Values comparing between groups post-intervention.
Data presented as mean and standard deviation.
p-Value using Student’s t-test.
Mean values were compared using an ANOVA test
Data presented median and interquartile range.
p-Value using the Wilcoxon signed rank.
Values were compared using Kruskal–Wallis.
Although random allocation resulted in a higher proportion of female participants in the VK2 group, this did not affect baseline comparability between groups. Overall, participants exhibited mean concentrations of triglycerides, VLDL, glucose, and cholesterol at or above upper reference limits (Table 2).
Metabolic responses by treatment group
At the end of the intervention, insulin had a significant difference between treatment groups (p = 0.050). When compared within groups, the VD3 group showed a significant decrease in glucose, ucOC, ucOC/cOC ratio, and %FPβC; the VK2 group showed a significant change in glucose, cOC, %FPβC, and HOMA-IR; and the combined group showed a significant change in glucose and %FPβC (Table 2). No adverse effects were reported.
Genotypic and allelic distribution of VKORC1 rs8050894
Genotypic and allelic distribution and frequency of the VKORC1 rs8050894 variant are presented in Supplemental Tables S1 and S2. Among the 39 genotyped participants, 38.46% were heterozygous (CG), 33.33% were homozygous for the wild-type allele (CC), and 28.20% were homozygous for the polymorphic allele (GG). Allele and genotype frequencies were in HWE (p = 0.15).
Characteristics of the study subjects grouped by treatment and genotype
Treatment groups were stratified according to VKORC1 rs8050894 to genotype (Supplemental Tables S3–S5). The CG genotype was the most frequent genotype in the VK2 and VD3 + VK2 groups.
Genotype-dependent changes in metabolic and osteocalcin-related parameters
Changes in metabolic parameters and in ucOC, cOC, and the ucOC/cOC ratio following supplementation were analyzed according to VKORC1 genotype. The VD3 supplementation group showed a statistically significant difference post-treatment in %FPβC in the CC genotype (p = 0.018; Figure 2(a)). In addition, glucose levels were significantly reduced in the CC and GG genotypes (p = 0.018 and p = 0.043; Figure 2(b)).
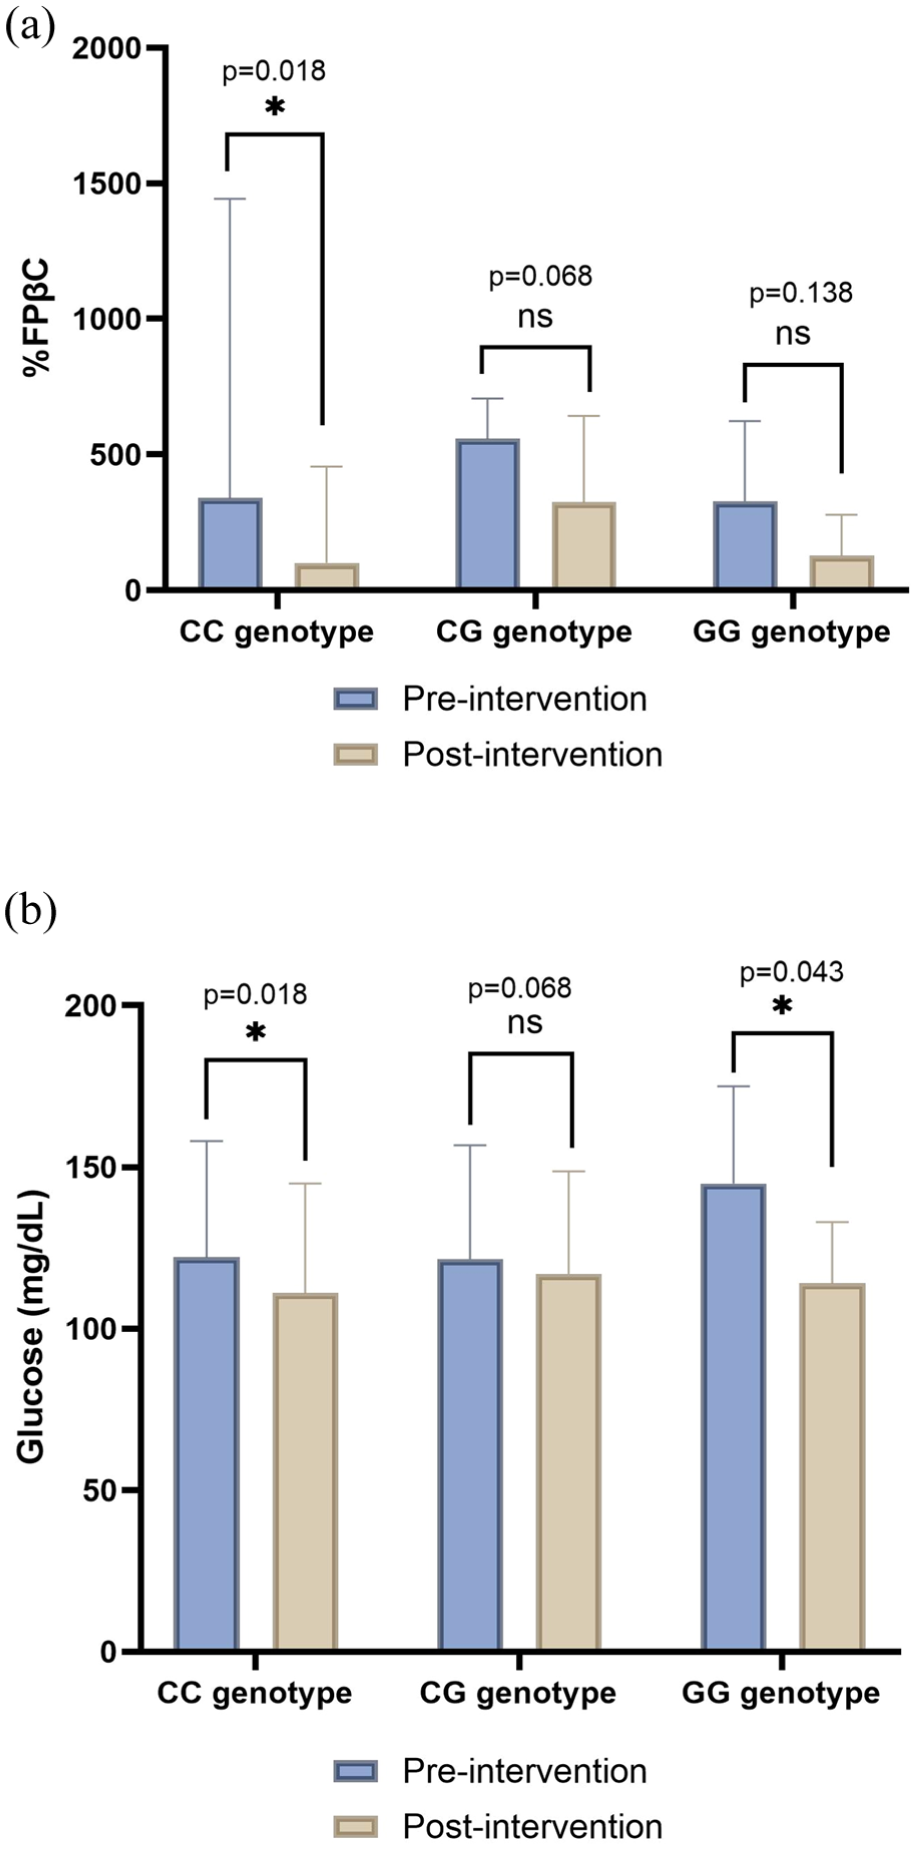
Percentage of FPβC and glucose concentrations comparing each genotype pre and post-intervention in the group supplemented with VD3. (a) Bar plot represents the comparison of %FPβC, and (b) bar plot represents the comparison of the glucose concentrations. Data are shown as median and interquartile range. Significant values <0.05*.
In the VK2 group, only the CG genotype showed statistically significant differences, with improvements observed in insulin, HOMA-IR, %FPβC, and glucose (p = 0.046, p = 0.028, p = 0.028, and p = 0.028), respectively (Figure 3(a)–(d)). In the GG genotype, ucOC increased by 0.060 ng/dL at the end of treatment, although the increase did not reach statistical significance. However, compared to the other groups, this was the largest increase observed.
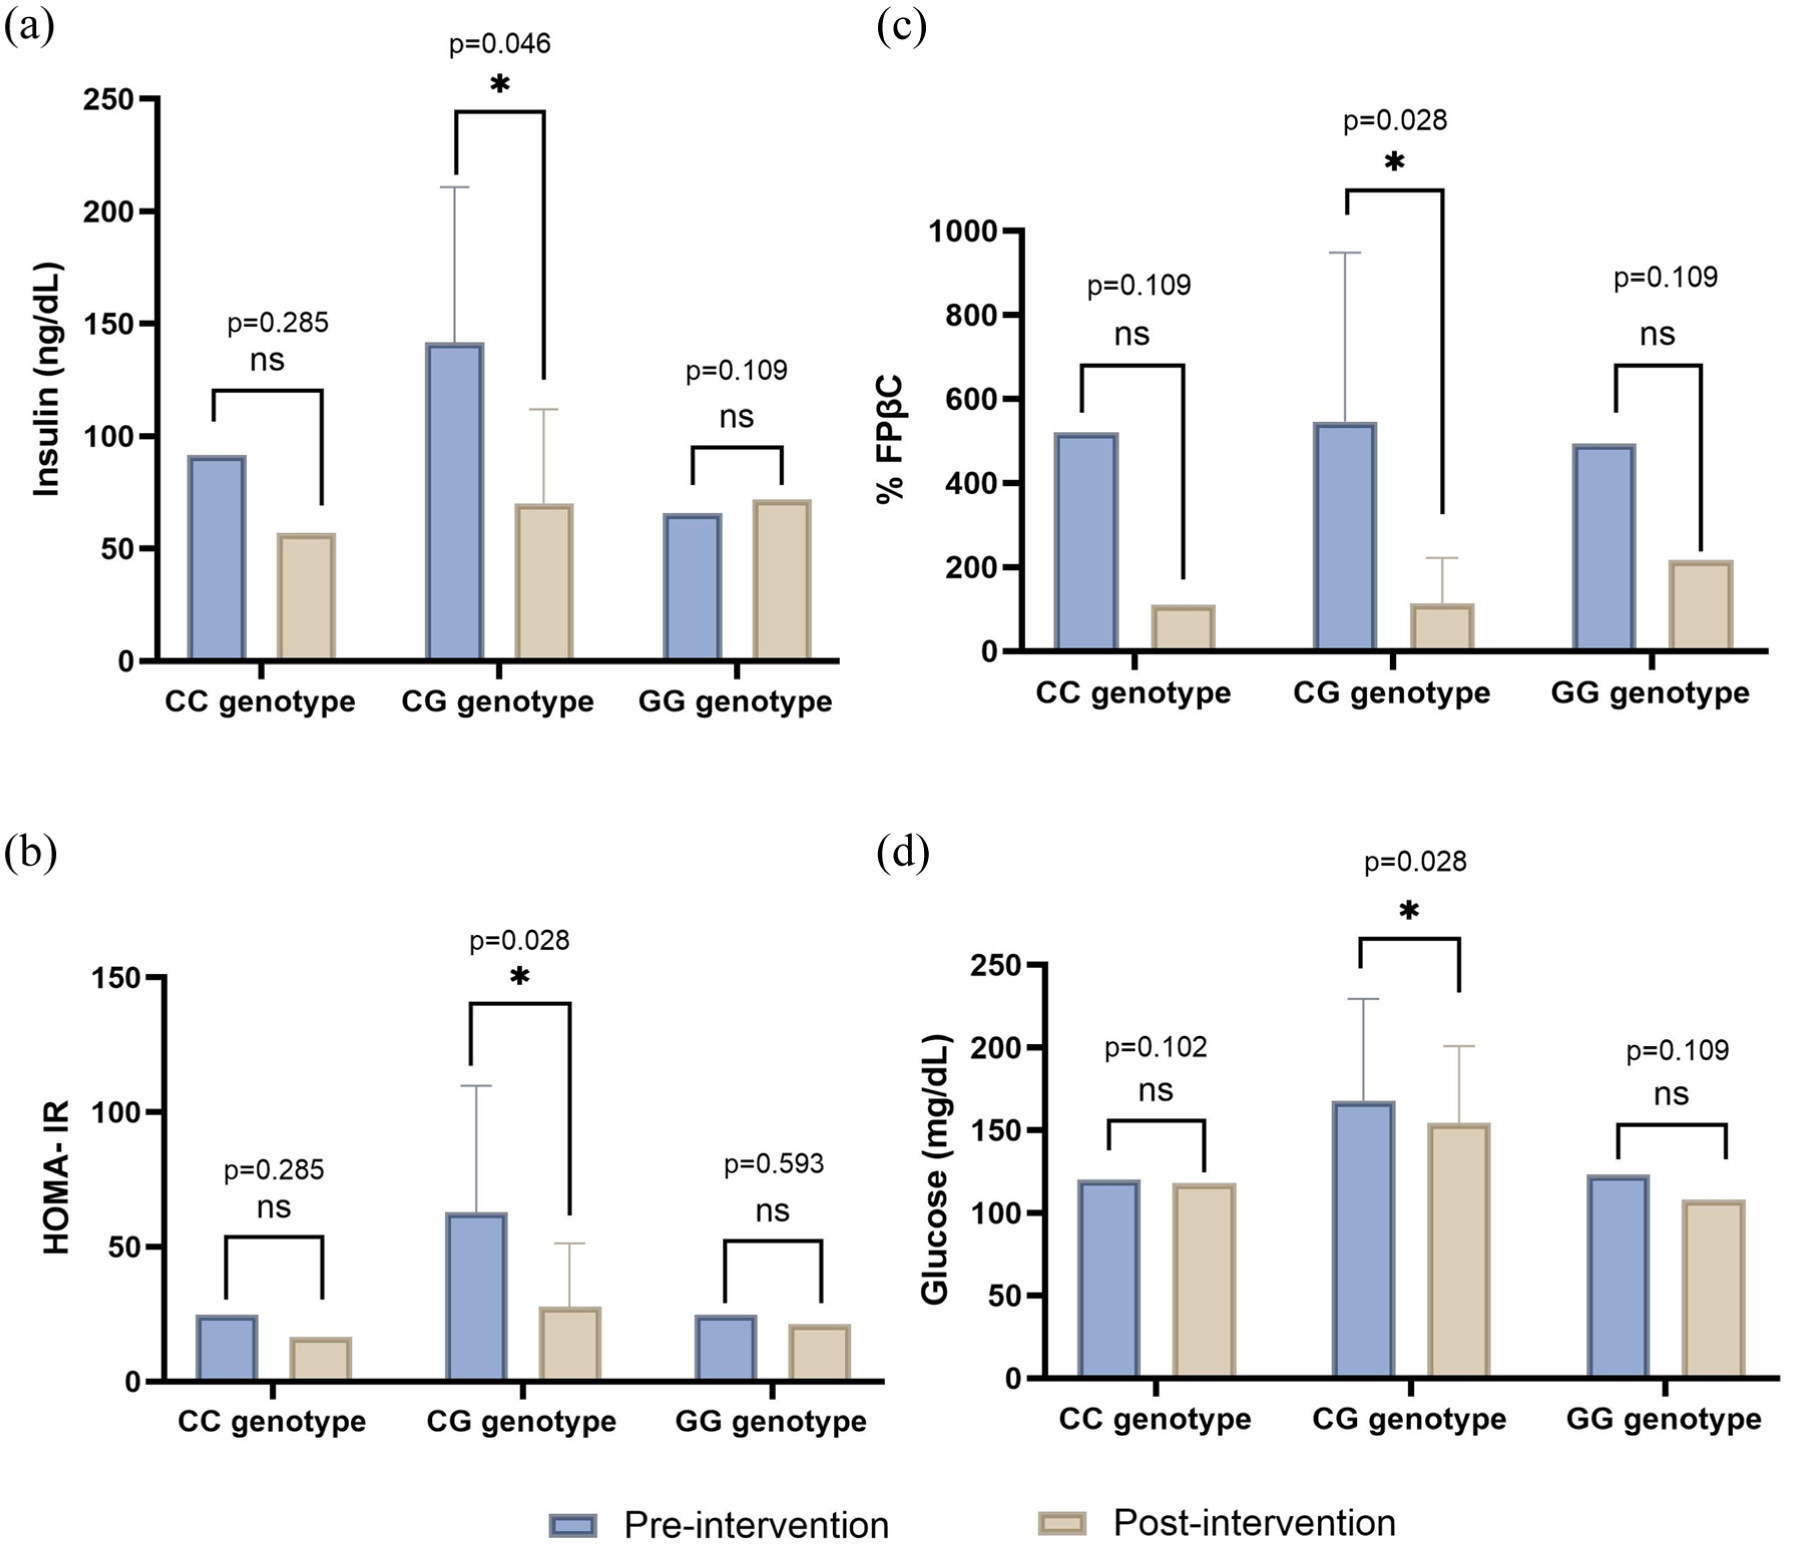
Insulin, glucose, HOMA-IR, and %FPβC pre- and post-intervention in the group supplemented with VK2: (a) Insulin levels, (b) HOMA-IR levels, (c) %FPβC, and (d) glucose in the group supplemented only with VK2. Data are shown as median and interquartile range. Significant values <0.05*.
In the group supplemented with both VD3 and VK2, glucose was the only one variable that showed a statistically significant change, with a decrease of -23.00 (15.00) mg/dL (p = 0.043) in the CG genotype (Figure 4).
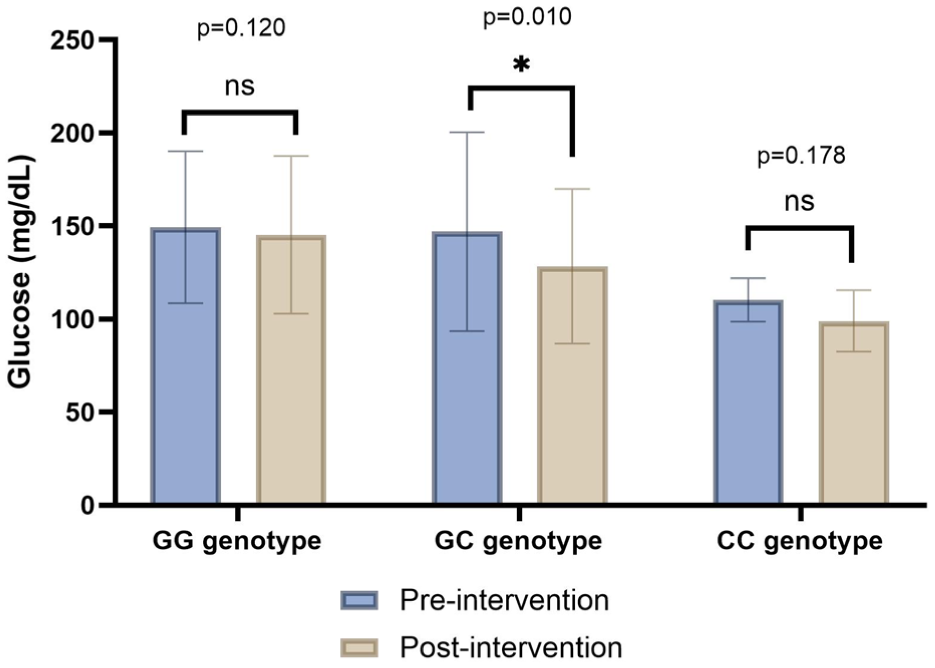
Pre- and post-intervention glucose concentrations by genotype in the combined VD3 + VK2 supplemented group. Data are shown as median and interquartile range. Significant values <0.05*.
Comparisons between grouped genotypes and osteocalcin parameters
Further analyses were performed to understand the relationship between the CC genotype and the CG + GG genotype. When compared in the VD group, no differences were observed for either ucOC or cOC; however, in VK2, the CC genotype exhibited higher ucOC levels post-intervention than those carriers with CG or GG (3.25 (0) ng/dL vs 2.11 (0.77) ng/dL), p = 0.009. The CC genotype within the VD3 + VK2 also showed higher levels of ucOC than the other genotypes (3.25 (0) ng/dL vs 1.92 (1.25) ng/dL), p = 0.024.
Correlation between VKORC1 rs8050894 and osteocalcin parameters
The correlation of ucOC with VKORC1 rs8050894 was found to be a positive and statistically significant pre- and post-intervention in the whole cohort (rho = 0.394, p = 0.013; rho = 0.478, p = 0.002, respectively), suggesting a potential association between ucOC and genotypes (Supplemental Table S6).
Discussion
Prior research has established associations between this variant and warfarin dose, 32 BMD, 38 and arterial stiffness40; however, its role in modulating OC γ-carboxylation and metabolic outcomes in response to micronutrient supplementation had not been previously characterized in Mexican patients with T2DM. To our knowledge, this is the first study to examine genotype-dependent responses to VK2 and VD3 supplementation according to VKORC1 rs8050894 in this population, contributing to this gap by showing that supplementation effects on ucOC and metabolic parameters differed according to VKORC1 rs8050894 genotype, underscoring the potential relevance of genetic background in nutritional interventions targeting the VK-dependent carboxylation pathway.
In the present study, CC genotype carriers showed a change in ucOC levels following VK supplementation. In 2009, a cross-sectional study by Crosier et al. reported that genetic variation in VKORC1 was associated with carboxylation of OC in participants with a mean age of 68 ± 5.5 years. Among the VKORC1 variants examined in his study, homozygous carriers of the minor allele of rs8050894 (G) had significantly lower % ucOC compared with CC or CG genotype carriers (36.8 ± 1.9 vs 41.1 ± 0.9; p = 0.043). 35
VKORC1 converts VKE to VKH, the active and reduced form of VK, which is a cofactor for γ-carboxylation by the enzyme GGCX and is essential for bone-related proteins, such as OC.41,42 Crawford hypothesized that VKORC1 genetic variants may be associated with BMD and osteoporosis in the general population. Specifically, they found that rs8050894 was associated with osteoporosis in Mexican-American males. In adjusted models stratified by race/ethnicity and sex, this variant was also associated with decreased BMD among non-Hispanic Black males. 38
The synergistic interaction between VD and VK could promote the production of VKDPs, such as OC, which requires VK for proper carboxylation. This synergy is supported by studies showing that combined VD and VK supplementation significantly increases BMD and reduces the ucOC/OC ratio more effectively than single-vitamin supplementation.15,16,25,32,43 Although there is also evidence that both possess individual effects.20,44,45 Whereas in this study, we found distinct patterns of ucOC and metabolic responses were observed across VKORC1 genotypes. Specifically, ucOC concentrations increased post-treatment in VK2 and VD3 + VK2 groups, particularly among CC genotype carriers. However, none were observed in the VD3 group, a finding that contrasts with the evidence. This discrepancy may be attributable to the modulating role of VKORC1 genotype, though further investigation with larger samples and genotype-stratified randomized controlled trials is needed to confirm this interpretation. In parallel, metabolic improvements were more consistently observed in CG genotype carriers rather than in CC or GG carriers.
These patterns likely reflect genotype-dependent and context-specific interactions between VD–induced OC synthesis, 46 VK-dependent γ-carboxylation capacity, 47 and VKORC1-mediated VK recycling efficiency. 48 Experimental and clinical studies have shown that increased OC transcription driven by VD may exceed γ-carboxylation capacity when VK recycling is limited, resulting in higher circulating ucOC levels without proportional metabolic benefit.15,48,49 Conversely, a more balanced interaction between vitamin availability and enzymatic recycling capacity may favor improved metabolic responsiveness, as observed in CG genotype carriers. Taken together, these findings suggest that osteocalcin-related and metabolic responses are dissociable and modulated by VKORC1 genotype rather than uniformly coupled.
Regulatory polymorphisms in VKORC1 have been shown to affect gene expression and VK recycling efficiency. Wang et al. demonstrated that VKORC1 variants associated with altered mRNA expression led to differences in VK availability for γ-carboxylation. 32 These findings provide a mechanistic framework to interpret the genotype-dependent differences in ucOC observed in the present study, suggesting that variability in VKORC1 expression may modulate extrahepatic VK utilization and OC carboxylation in supplementation.
From a clinical and nutritional standpoint, these mechanistic insights provide the rationale for the VD dosage. The recommended dosage of VD in México is 400 IU/day for adults and 600 IU/day for those over 70 years, according to the Instituto Nacional de Ciencias Médicas y Nutrición Salvador Zubirán. 50 In this study, a higher dosage was provided based on a study by López-Bautista, which found that 50.4% of the population had VD insufficiency and 5% had a deficiency. 51
In addition, the rationale for VK2 dosing merits consideration in light of its role in OC regulation. The adequate intake (AI) for VK is 120 μg for men and 90 μg for women. 49 However, there is no consensus on the AI for VK2 specifically; interventions with dosages ranging from 180 to 200 μg/day have been shown to reduce insulin levels and fasting plasma glucose levels, 45 which is consistent with the insulin and glucose levels found in this study, particularly in the CG genotype of the VK2 group.52,53
Pre-intervention VD3 and VK2 groups exhibited high triglyceride concentrations, exceeding the recommended values (<150 mg/dL). 54 In addition, the mean cholesterol concentration of the participants was close to the upper healthy limit (>200 mg/dL), which is a common pattern observed in patients with T2DM. This pattern is associated with poor glycemic control within the study population. The increase in triglyceride concentrations is attributed to insulin resistance. Insulin resistance promotes hepatic triglyceride synthesis and increased VLDL production, resulting in hypertriglyceridemia and decreased HDL cholesterol.55,56
Taken together, these metabolic characteristics highlight the complex pathophysiology of T2DM in the studied population, a disease characterized by interactions among genetic predisposition, insulin resistance, beta cell dysfunction, inflammation, dietary patterns, and lifestyle factors. 57 %FPβC was selected as a functional surrogate for beta cell performance because it estimates beta cell output as a percentage of theoretical normal function derived from fasting glucose and insulin concentrations, allowing standardized comparisons across treatment groups and genotypes in a population with established insulin resistance. 58 In contrast to dynamic methods such as oral glucose tolerance test-derived indices or hyperglycemic clamps, HOMA-B offers greater feasibility and reproducibility in clinical and interventional settings, particularly in studies with larger sample sizes and repeated measurements. Supporting its use as a treatment-sensitive outcome, prior randomized controlled trials evaluating VK and/or VD supplementation in T2DM patients have reported changes in HOMA-B alongside improvements in insulin resistance and sensitivity indices.43,59,60 Nevertheless, these findings should be interpreted with caution, as HOMA-based indices rely on mathematical assumptions and fasting conditions and do not capture dynamic postprandial insulin secretion or beta cell mass. Future studies incorporating complementary dynamic and biomarker-based assessments would provide a more comprehensive evaluation of beta-cell function.61,62
In this context, although ucOC has been proposed as a mediator of glucose metabolism, its effects in humans with established T2DM are influenced by multiple confounding variables. Therefore, the metabolic changes observed in this study likely reflect the combined effects of micronutrient supplementation, genetic background, and baseline metabolic status rather than a direct causal role of ucOC alone. It has also been hypothesized that the associations between VKORC1 gene variants and warfarin sensitivity are related to differences in the availability of VK for γ-carboxylation reactions. Other studies suggest that SNVs in GGCX are significantly associated with ucOC levels and may influence the γ-carboxylation of OC. 35
To better understand the genotype distribution in the global population, Supplemental Table S7 shows a comparison of the allelic frequencies for rs8050894 in VKORC1. Worldwide, the reference allele has been reported as (C) with different variants as (G/A/T). 32 In our study, the variant allele (G) was found in 47% of subjects and the reference allele (C) in 52%, similar to the allele frequencies reported for Latin Americans, as reported by the Allele Frequency database (Supplemental Table S7).
These findings should be interpreted in light of the study’s sample size and design; their translational relevance requires confirmation in larger, prospective studies before supporting genotype-based modification to VD or VK supplementation dosing in clinical practice. Before this SNV can be considered clinically actionable in guiding individualized micronutrient dosing in T2DM management, adequately powered genotype-stratified randomized controlled trials are needed. Such studies should incorporate direct measures of plasma VK and VD status, a broader panel of VK pathway SNVs, including variants in genes involved in vitamin metabolism, and longer follow-up periods to assess sustained metabolic effects. The present study provides an exploratory foundation and rationale for these investigations, particularly in underrepresented Latin American populations, where allele frequency distributions and dietary patterns may differ substantially from those in previously studied cohorts.
Limitations
This study has some limitations. First, when stratifying the subjects by treatment and genotype, the number of subjects resulted in smaller subgroup sizes; therefore, these findings require validation in larger cohorts. In addition, sex, BF%, and BMI should be taken into consideration to have equal distribution among groups for future studies, as these are lipid-soluble vitamins and may affect VD and VK levels. Furthermore, serum VK levels were not measured; this is an important variable in the OC carboxylation process. Future studies could benefit from including enzymes involved in the VK cycle, along with their associated SNVs, to provide a clearer understanding of the γ-carboxylation process. Although HbA1c represents a more stable indicator of long-term glucose control, it was not available for all participants and therefore could not be included in the analysis.
In addition, the ethnic origin of the study population should also be considered, as the distribution of rs8050894 varies by geographic region. Therefore, the findings may only be applicable to genetically similar populations.
Conclusions
To our knowledge, this is the first study to evaluate the VKORC1 rs8050894 variant in a Mexican population with T2DM and to examine genotype-dependent responses to VK2 and VD3 supplementation. Our findings indicate that responses to supplementation differed according to VKORC1 rs8050894 genotype. Improvements in metabolic parameters were most consistently observed among CG carriers, particularly following VK2 supplementation. By contrast, increased levels in ucOC were more pronounced in CC carriers compared to CG + GG carriers. These findings suggest a genotype-specific and context-dependent interaction between vitamin availability and VKORC1-mediated osteocalcin regulation, highlighting potentially distinct metabolic and biochemical response pathways across genotypes.
Supplemental Material
sj-docx-1-imj-10.1177_10815589261460882 – Supplemental material for Association between the VKORC1 rs8050894 CC genotype and undercarboxylated osteocalcin levels following vitamin K and D supplementation in Mexican Citizens with T2DM: A randomized clinical trial
Supplemental material, sj-docx-1-imj-10.1177_10815589261460882 for Association between the VKORC1 rs8050894 CC genotype and undercarboxylated osteocalcin levels following vitamin K and D supplementation in Mexican Citizens with T2DM: A randomized clinical trial by Yahatziri Salinas-Varela, Marco Antonio Barajas-González, Erika Martínez-López, Iris Monserrat Llamas-Covarrubias, Andres Lopez-Quintero, Sergio Sánchez-Enríquez and Edgar Alfonso Rivera-León in Journal of Investigative Medicine
Footnotes
Acknowledgements
The authors would like to express their gratitude for the support provided to this research by Alondra Rodríguez Patiño, MD; Karina Gónzalez Becerra, PhD; Mercedes Elvira Gónzalez Hita, PhD; Marco Aurelio Ibarra Aceves, LN.; and Iván Aguayo Ruiz, PhD.

Ethical considerations
The project adhered to the principles outlined in the 2013 Declaration of Helsinki and was approved by the Ethics, Biosecurity, and Research Committee of the Centro Universitario de Ciencias de la Salud, Universidad de Guadalajara (protocol code number F-2017-1702-14). Written informed consent was obtained from all subjects involved in the study.
Author contributions
Conceptualization: Edgar Alfonso Rivera-León, Methodology: Erika Martínez-López; Software: Sergio Sánchez-Enríquez, Marco Barajas-González, and Yahatziri Salinas-Varela; Validation: Edgar Alfonso Rivera-León, and Marco Barajas-González, and Yahatziri Salinas-Varela; Formal Analysis: Iris Monserrat Llamas-Covarrubias; Research: Edgar Alfonso Rivera-León; Resources: Erika Martínez-López; Writing – Original draft: Edgar Alfonso Rivera-León, and Iris Monserrat Llamas-Covarrubias; Writing – Revision and editing: Erika Martínez-López, Sergio Sánchez-Enríquez, and Edgar Alfonso Rivera-León; Visualization: Sergio Sánchez-Enríquez; Supervision and Acquisition of Financing: Edgar Alfonso Rivera-León. All authors have read and approved the final manuscript.
Funding
The authors disclosed receipt of the following financial support for the research, authorship, and/or publication of this article: This project was funded by resources from the “Apoyo a la Incorporación de Nuevos PTCs” project [UDG-PTC-1475].
Declaration of conflicting interests
The authors declared no potential conflicts of interest with respect to the research, authorship, and/or publication of this article.
Data availability statement
Data on the interventions performed on subjects to support the findings of this study are included in the article. Additional data can be made available upon request from the Research, Bioethics, and Biosafety Committee of the University Center of Health Sciences, Universidad de Guadalajara. For inquiries, please contact Dr. Edith Oregón Romero (PhD) at
Supplemental material
Supplemental material for this article is available online.
References
Supplementary Material
Please find the following supplemental material available below.
For Open Access articles published under a Creative Commons License, all supplemental material carries the same license as the article it is associated with.
For non-Open Access articles published, all supplemental material carries a non-exclusive license, and permission requests for re-use of supplemental material or any part of supplemental material shall be sent directly to the copyright owner as specified in the copyright notice associated with the article.
