
Abstract
Tiger nut is a tuber used to produce tiger nut milk that yields a high quantity of solid waste, which can be dried and used as fiber source. The objective of this paper was to evaluate the quality of gluten-free bread formulated with different tiger nut-derived products in order to substitute soya flour (which is an allergen ingredient) and, at the same time, increase the use of tiger nut-derived products. Four gluten-free formulations based on corn starch and containing tiger nut milk, tiger nut milk by-product, tiger nut flour, or soya flour (as reference formulation) were studied. Tiger nut milk increased G′ of gluten-free batter and rendered breads with the softest crumb (502.46 g ± 102.05), the highest loaf-specific volume (3.35 cm3/g ± 0.25), and it was mostly preferred by consumers (61.02%). Breads elaborated with tiger nut flour had similar characteristics than soya flour breads (except in color and crumb structure). The addition of tiger nut milk by-product resulted in a hard (1047.64 g ± 145.74) and dark (L* = 70.02 ± 3.38) crumb bread, which was the least preferred by consumers. Results showed that tiger nut is a promising ingredient to formulate gluten-free baked products.
Introduction
Celiac disease is one of the most common lifelong disorders in many areas of the world (Catassi and Fasano, 2008), and its detection has increased with the availability of improved and more accessible diagnostic tools. Therefore, demand of gluten-free products is also increasing, and there is a need for gluten-free quality products, especially bread. Production of high-quality gluten-free bread is a big challenge because gluten network confers unique viscoelastic properties to bread dough that render breads with good baking characteristics. For this reason, most of gluten-free bakery products have an inferior quality than wheat counterparts (Gallagher et al., 2003b; Thompson, 2009).
Many gluten-free formulations contain soya (Glycine max L.) flour as a protein source. Our research group has developed a formulation that contains soya flour and offers good baking (high volume and soft crumb) and sensory characteristics (Miñarro et al., 2012). However, soya-associated digestive and allergy problems are leading to more research into alternative ingredients in order to obtain not only gluten-free bread but also allergen-free bread that has a wider consumer market.
Tiger nut (Cyperus esculentus L.) is a tuber rich in carbohydrates, lipids, fiber, some minerals (potassium, phosphorus, and calcium), and vitamins E and C. It has moderate protein content with more essential amino acids content (mg/g protein) than the FAO/WHO recommended protein standard (Bosch et al., 2005). Nutritional properties of tiger nut and, by extension, its derived products are mainly related with its lipidic profile and fiber content. Tiger nut lipidic profile is similar to olive and hazelnut oils (Coş kuner et al., 2002). Ingredients with high-fiber content are particularly interesting in gluten-free diets as it has been reported that fiber intake of celiac patients is low (Thompson et al., 2005).
In Spain, tiger nut is mostly cultivated for the production of “horchata de chufa” or tiger nut milk that is a non-alcoholic and refreshing beverage mainly consumed during summer period, but it is underutilized in many countries in the world (Sánchez-Zapata et al., 2012). For the elaboration of tiger nut milk, tiger nut tubers are washed, soaked, grinded, and pressed to separate tiger nut milk from tiger nut solid waste (tiger nut milk by-product). This solid waste, with a high content of insoluble fiber, is an economic and environmental problem for food industry and is used for animal feed, combustion, or composting (Sánchez-Zapata et al., 2009). Tiger nut milk is also used as a flavoring agent in ice cream, and tiger nut flour is added to biscuits and other bakery products (Coş kuner et al., 2002; Sánchez-Zapata et al., 2012). Recently, some researchers have used tiger nut to improve the nutritional profile or the technological characteristics of some products. Chinma et al. (2010) obtained acceptable wheat-based cakes with 30% of tiger nut flour, with better nutritional characteristics than 100% wheat cake. Demirkesen et al. (2011) observed that 10 or 20% of tiger nut flour improved gluten-free rice bread conventionally baked or infrared-microwave combination baked, respectively.
Considering the nutritional profile of tiger nut-derived products and the fact that they are not labeled as allergens, these ingredients could be adequate to formulate healthy and allergen-free gluten-free breads. At the same time, this application would contribute to increase their use and exploitation. Therefore, the aim of this research was to evaluate the use of tiger nut flour, tiger nut milk, and tiger nut milk by-product to formulate gluten-free breads.
Materials and methods
Raw materials
Ingredients used for batter and bread formulation were tap water, corn starch (Syral Iberia S.A.U., Zaragoza, Spain), white sugar (Azucarera Ebro S.L., Madrid, Spain), tiger nut milk and tiger nut milk by-product (Artgelato S.L., Barcelona, Spain), tiger nut flour (Tigernuts Traders S.L., Valencia, Spain), soya flour (Trades, Barcelona), shortening (Puratos, Sils, Spain), iodized refined salt (Sal Costa S.A., Barcelona), baking powder (Panreac Química S.L.U., Castellar del Vallès, Spain), dry yeast (Lallemand Iberica S.A., Cachofarra, Portugal), xanthan gum, and emulsifier: citric acid esters of mono and diglycerides and sucrose fatty acid esters (Degussa Texturant Systems, Paris, France).
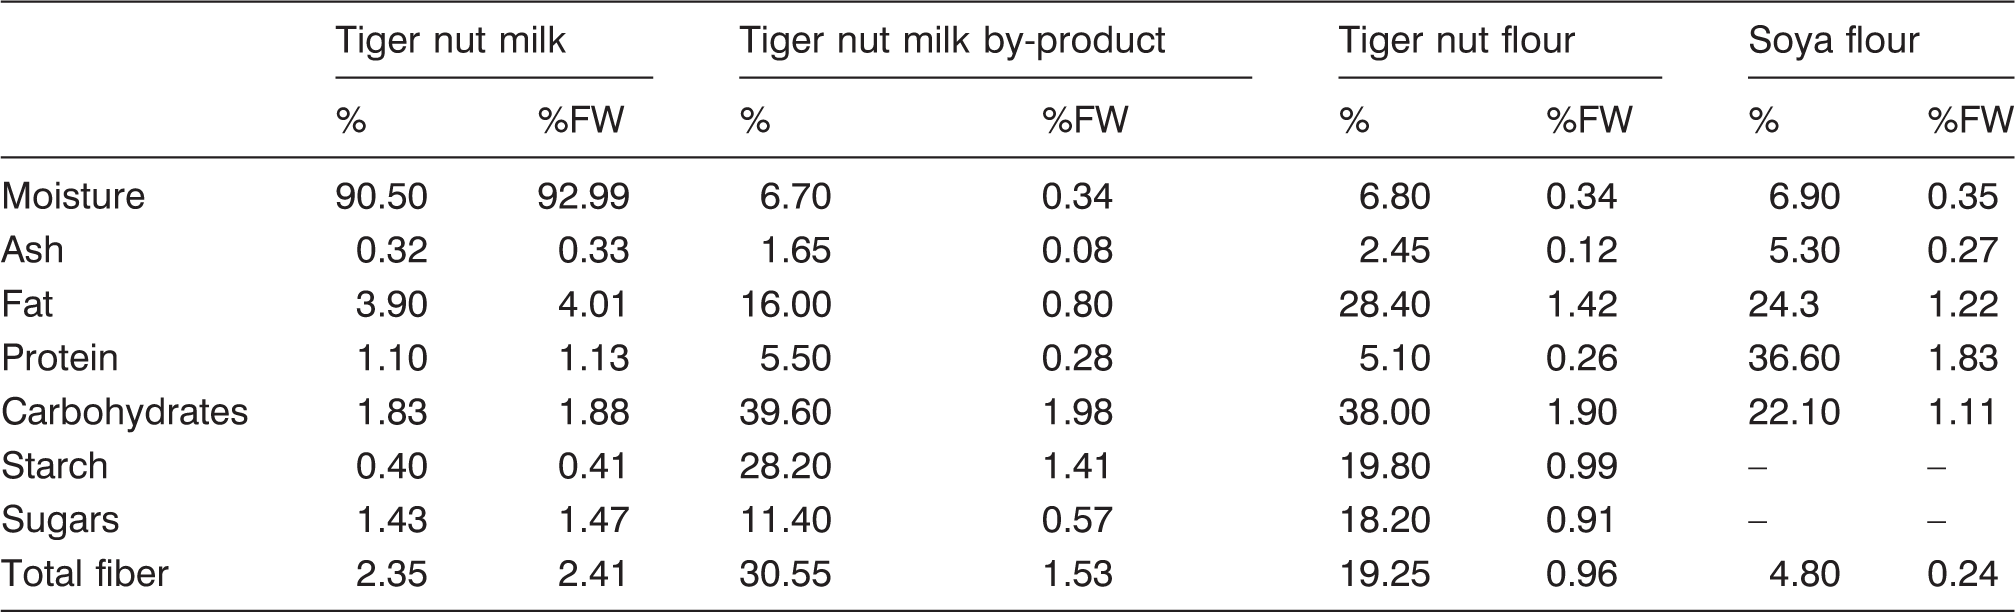
Figure 1 shows tiger nut ingredients processing flowchart, and Table 1 shows tiger nut ingredients and soya flour composition. Moisture, ash, lipids, protein, sugars, and soluble and insoluble fiber content were determined according to the official methods (AOAC, 2005). Carbohydrate and starch content were calculated per difference.
Flowchart for the production of tiger-nut derived products. Nutritional composition of tiger nut-derived products and soya flour (%) and nutrients of these ingredients provided to final batter formulation expressed in percentage of flour weight (%FW)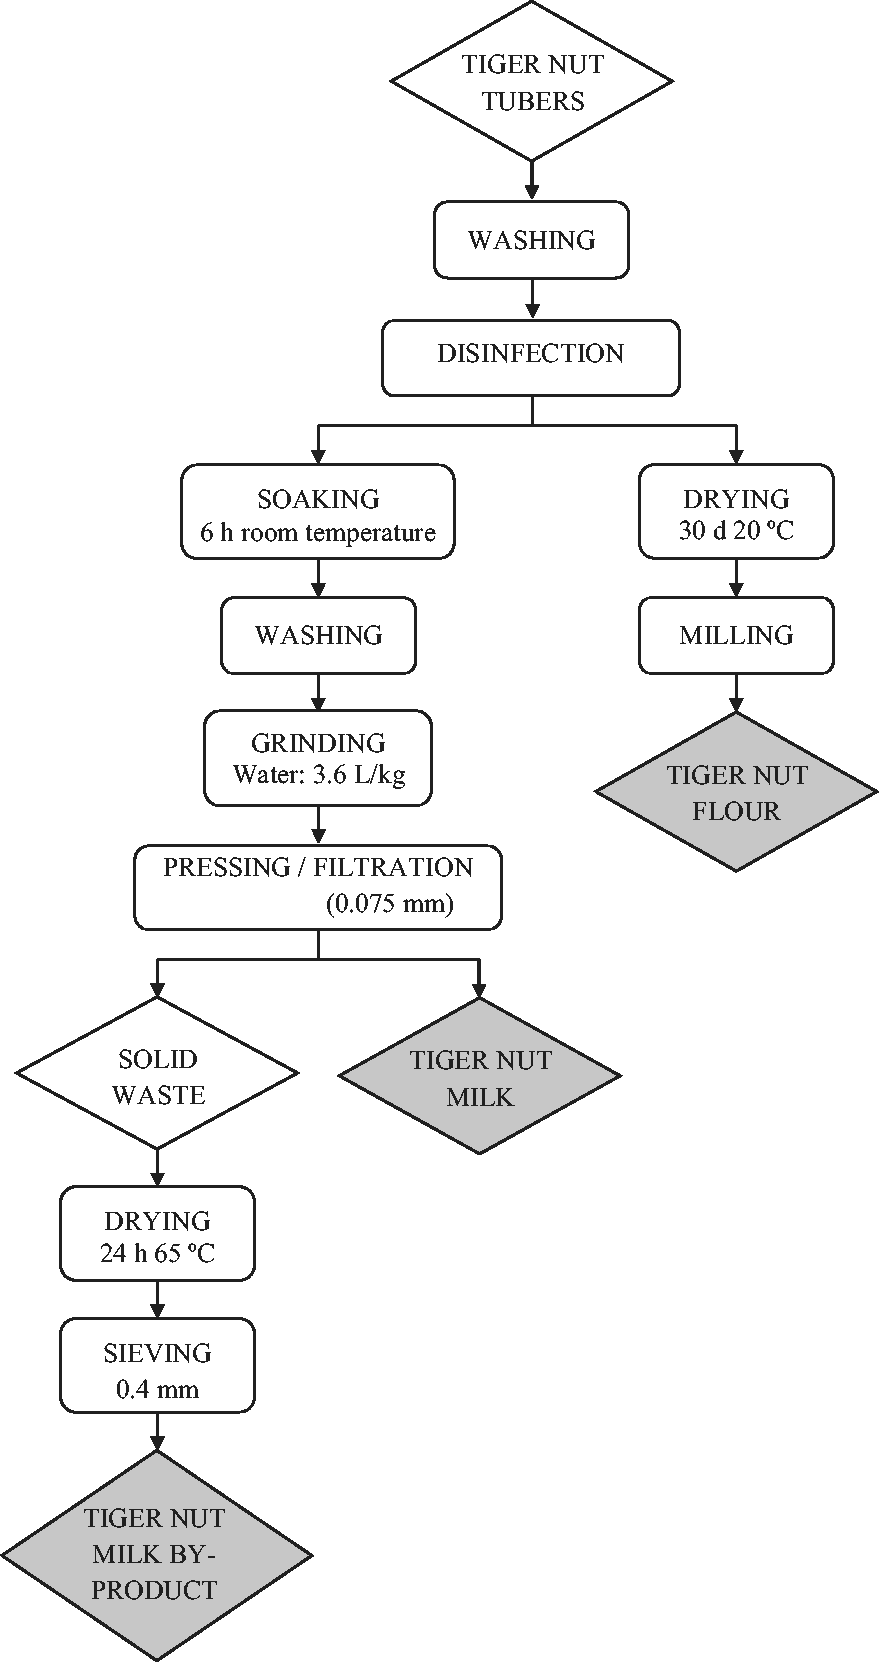
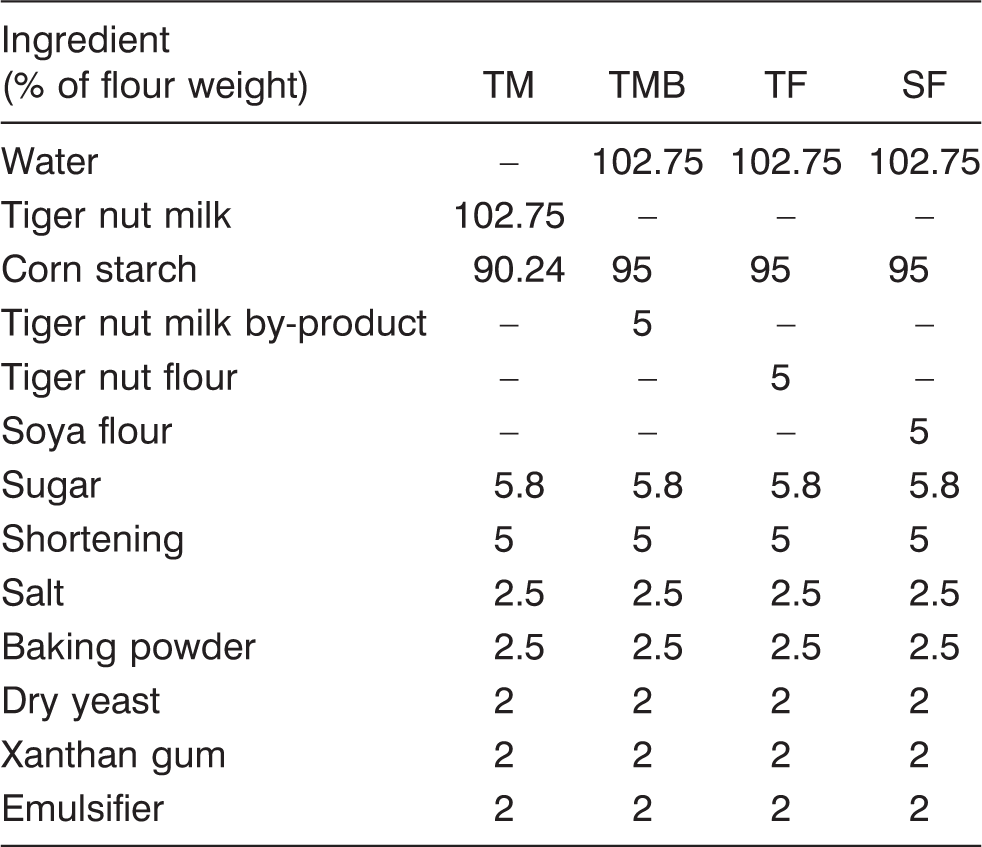
Gluten-free formulations (TM: tiger nut milk; TMB: tiger nut milk by-product; TF: tiger nut flour; SF: soya flour) expressed in % of flour weight
Bread making procedure
Bread was elaborated at CERPTA (Universitat Autònoma de Barcelona) food processing plant. Powder ingredients were weighed and kneaded in a mixer (Sammic S.L., Gipuzkoa, Spain) at low speed (85 rpm). Water (25 ℃ ± 1 ℃) or TM (25 ℃ ± 1 ℃) and melted shortening were added to the powder ingredients. Batter was mixed for 2 min at low speed (85 rpm), 2 min at medium speed (222 rpm), and 30 s at high speed (385 rpm). Batter was weighed in 200 g portions in each baking pan (5 × 8 × 14 cm) and proofed in a chamber (Salva, Lezo, Spain) for 35 min at 85% RH and 30 ℃. Finally, the baking process was carried out in a classic deck oven (Sveba-Dahlen AB, Fristad, Sweeden) at 180 ℃ for 30 min with steam injection during 10 s at the start of baking. After baking, loaves were depanned and cooled for 2 h at room temperature. Bread samples were packed in a modified atmosphere of 70% N2: 30% CO2 and stored for 4 days at 20 ℃ ± 1 ℃. Three independent batches of each formulation were elaborated.
Batter analysis
Moisture of batters was analyzed using a gravimetric method. To measure the batter moisture, 3 g of sample was weighed and mixed with sand to increase the drying area. Batters were dried with a forced air oven at 98–100 ℃ to constant weight, and moisture percent was calculated per difference.
For rheology studies, viscoelastic behavior was analyzed by oscillatory frequency sweep in the linear viscoelastic range. Batters were prepared as explained before but excluding yeast to avoid gas bubbles formation during the analysis (Lazaridou et al., 2007; Miñarro et al., 2012) and were placed between corrugated plates (35 mm diameter, with a 2-mm gap) of a controlled stress and strain rheometer, Haake Rheo Stress 1 (Thermo Scientific, Karlsruhe, Germany). Temperature was regulated at 30 ℃ ± 0.1 ℃ with a Haake SC100 water bath (Thermo Scientific). Excess batter was removed, and the exposed edges were covered with water to avoid desiccation. Batter rested for 5 min before being tested to allow relaxation. During test, the whole system was covered to prevent changes in temperature. Preliminary strain-sweep tests at 1 Hz of frequency were performed, which showed that a strain of 0.05% was within the linear viscoelastic region. Storage modulus (G′) and loss modulus (G′′) were obtained from frequency sweep tests performed at frequencies between 0.1 and 10 Hz with a target strain of 5 × 10⁻⁴ (0.05%). Three independent batches and at least two repetitions were analyzed.
A rheofermentometer F3 (Chopin, Villeneuve-la-Garenne, France) was utilized to measure CO2 production, loss and retention, and batter height. The analysis was performed with 315 g of batter at 28.5 ℃ for 3 h. A cylindrical weight of 500 g was used to run the test. Three independent batches were evaluated.
Bread characteristics
Moisture (%) of breads was measured according to AOAC standard method (AOAC, 2005), and three replicates were analyzed.
Initial batter weight and weight of bread after cooling were measured. Bake loss was calculated using the formula: bake loss (%) = (initial weight of batter − weight of bread after cooling) × 100/initial weight of batter. Loaf volume was measured by the method of displacement of millet seeds (Griswold, 1962) with a bread volumeter (Chopin, Villeneuve-la-Garenne Cedex, France). Specific volume was calculated using the formula: specific volume (cm3/g) = volume (cm3)/weight (g). Water activity was measured by the dew-point method using an Aqualab hygrometer (Aqualab Series 3TE, Decagon Devices Inc., Pullman, USA).
A Hunter Lab colorimeter miniScan XTE (Hunter Associates Laboratory INC, Reston, Virginia, USA) was used, and CIE L* values (lightness) were measured with a D65 illuminant and a standard observer of 10 °. Crust color was measured on six zones of the top of each loaf, and crumb color was measured at four equidistant points from the center of each slice.
A flatbed scanner (HP ScanJet N6310c, Hewlett Packard) and its supporting software were used to capture bread images with a resolution of 300 dots per inch (dpi). From each batch, nine slices of each sample were processed. A 4 × 4-cm2 field of each slice was evaluated, which captured the majority of the crumb area of individual slice of bread. Sigma Scan Pro 5 software (Systat software Inc, Chicago, USA) and a threshold method were used to analyze mean-cell area and total number of cells.
Texture analysis was carried out using AACC (74-09) standard method at 0, 2, and 4 days of storage at 20 ℃ ± 1 ℃, with a TA-TX2 texture analyzer (Stable Micro Systems, Surrey, UK) using a cylindrical probe of 35 mm diameter. Uniform slices of 12.5 mm thickness were obtained by cutting the bread transversely using an automatic cutter. Two slices were stacked together to obtain uniform slices of 25 mm. Probe speed was set to 2 mm/s to compress the center of bread crumb to 40% of its original height. Hardness values, corresponding to the maximum peak force of the first compression, were recorded. Staling percent was calculated using the formula: staling (%) = (hardness day 2/hardness day 0) × 100.
Three independent batches of each formulation were elaborated to determine bake loss, loaf specific volume, water activity, color, texture, and cell size. In each experiment, three breads from each formulation were analyzed.
Sensory analysis
Sensory analysis of bread was performed by 59 volunteers recruited among university staff and students. Testers were both female and male, aged between 18 and 58, and regular bread consumers. To study the sensory characteristics of different breads, consumers evaluated acceptability and intensity of each attribute (porosity, crumb color, aroma, taste, chewiness, and hardness) with a nine-point hedonic scale. At the end of the test, consumers were asked to select the most and the least preferred bread (results of preference test are expressed in % of preference). One slice of each sample, randomly codified using three digits, was analyzed simultaneously, 24 h after bread making.
Statistical analysis
Results were analyzed by analysis of variance (ANOVA) using the general linear models procedure of Statistical Analysis System (SAS, 9.1 version). Student–Newman–Keuls test was applied to compare the sample data. Evaluations were based on a significance level of p < 0.05.
Results and discussion
Batter characteristics
Batter rheology results are shown in Figure 2. All batters presented higher storage modulus values (G′) than loss modulus values (G′′) in all range of frequencies studied, indicating a solid elastic-like behavior of all samples. TMB and TM showed the highest G′ values compared with TF and SF, which remained very close to each other. Different water and fiber content of batters, as well as fiber size, may account for batter consistency differences. Demirkesen et al. (2010) found an increase in G′ when fiber content of gluten-free batter increased due to the presence of chestnut flour, probably caused by the association of fibers. Therefore, TM and TMB batters had higher G′ than TF and SF because of its higher fiber content expressed in % of flour weight (%FW) (Table 1). However, TMB formulation, that had lower fiber content than TM (Table 1), presented higher G′. This behavior could be attributed to the different size of fiber present in tiger nut milk by-product compared to tiger nut milk. The fiber particle size plays an important role in batters’ rheological behavior, as reported by Gómez et al. (2010) who stated an increase of G′ and G′′ with increasing fiber size in wheat layer cake batters. In this research, tiger nut milk was filtered (0.075 mm) during its obtaining process (Figure 1), and in consequence, the size of fiber particles from tiger nut milk by-product was higher than fiber size from tiger nut milk, and thus, TMB batter presented higher G′ compared to TM.
Batter parameters from oscillatory test (G′ and G′′). TM: tiger nut milk; TMB: tiger nut milk by-product; TF: tiger nut flour; SF: soya flour.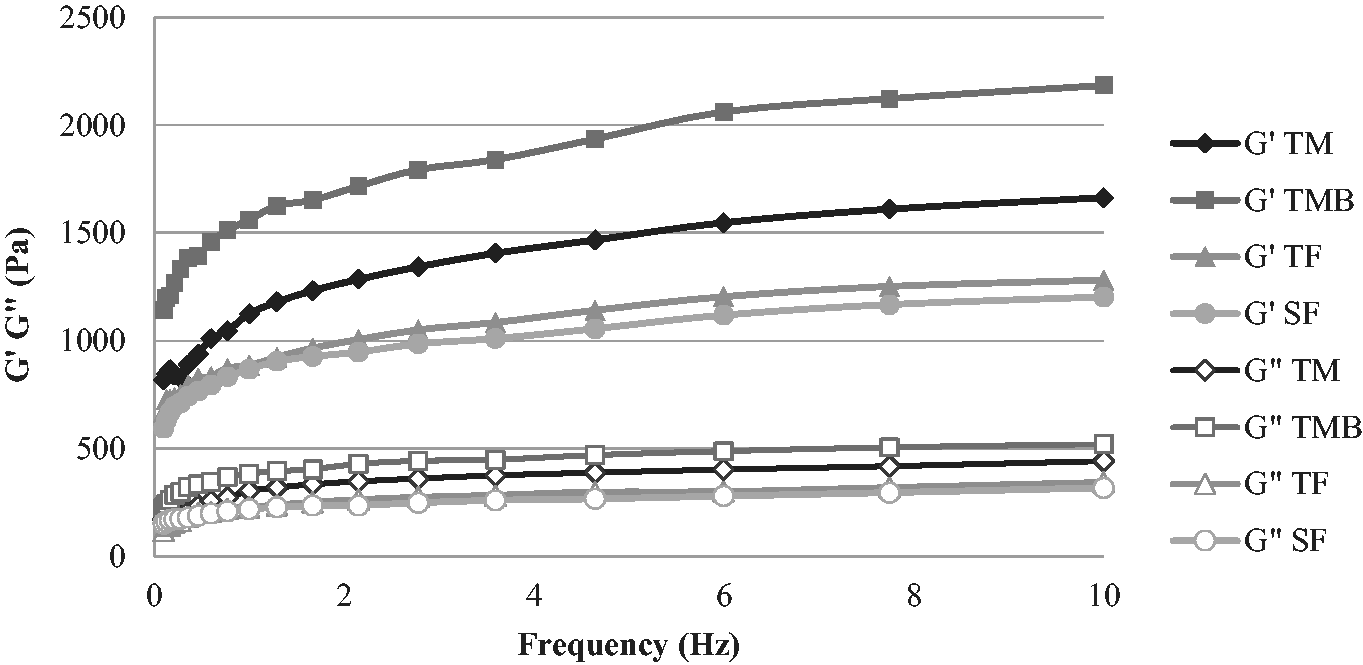
Higher G′ values of TM batter than TF or SF batters may be related to the low-moisture content of TM batter (47.31% ± 0.07%) compared to TF and SF (51.13% ± 0.12% and 51.07% ± 0.28%, respectively). Moisture of TM batter was the lowest because water was substituted by tiger nut milk, which contained 9.5% of solids (Table 1). Lazaridou et al. (2007) and Ronda et al. (2013) also observed higher values of G′ when water content decreased in gluten-free formulations. Moreover, higher G′ values of TM batter compared to TF and SF batters might also be related to fiber content, as tiger nut milk provides higher fiber content (expressed in % of flour weight) than tiger nut flour or soya flour (Table 1). Demirkesen et al. (2010) also found an increase in G′ when incrementing chestnut flour content, which increased fiber concentration of gluten-free formulations. Figure 3 presents batter development results from the rheofermentometer test during 3 h of fermentation. The TMB batter had the lowest development curve as well as the lowest gas released during 3 h of fermentation (1417.00 ml ± 34.70; p < 0.05). The low-batter development of this batter could be related to its rheological characteristics, as TMB batter had the highest G′, and thus was too consistent to allow optimum development during fermentation. Furthermore, the low CO2 released by TMB batter could be related to the low proportion of directly fermentable sugars that tiger nut milk by-product provides to the formulation, expressed in % of flour weight (%FW) (Table 1).
Batter parameters from rheofermentometer analysis (height of batter development). TM: tiger nut milk; TMB: tiger nut milk by-product; TF: tiger nut flour; SF: soya flour.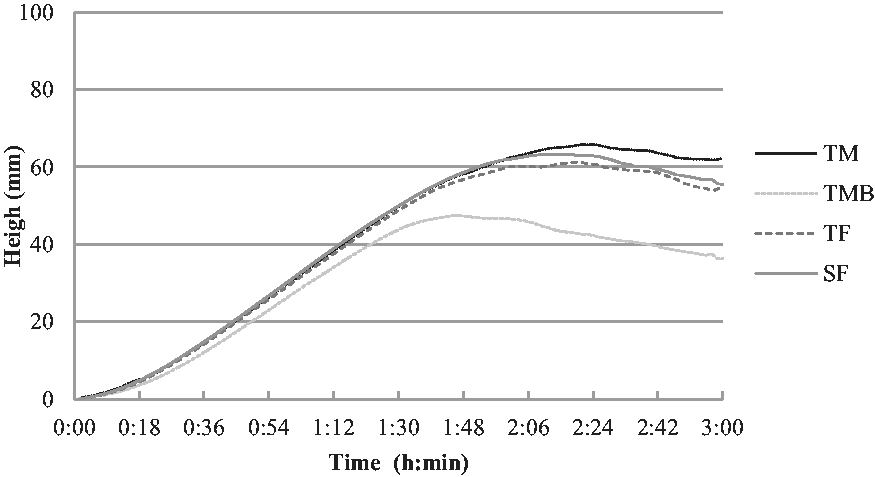
Baking characteristics
Baking characteristics of gluten-free breads (TM: tiger nut milk; TMB: tiger nut milk by-product; TF: tiger nut flour; SF: soya flour)
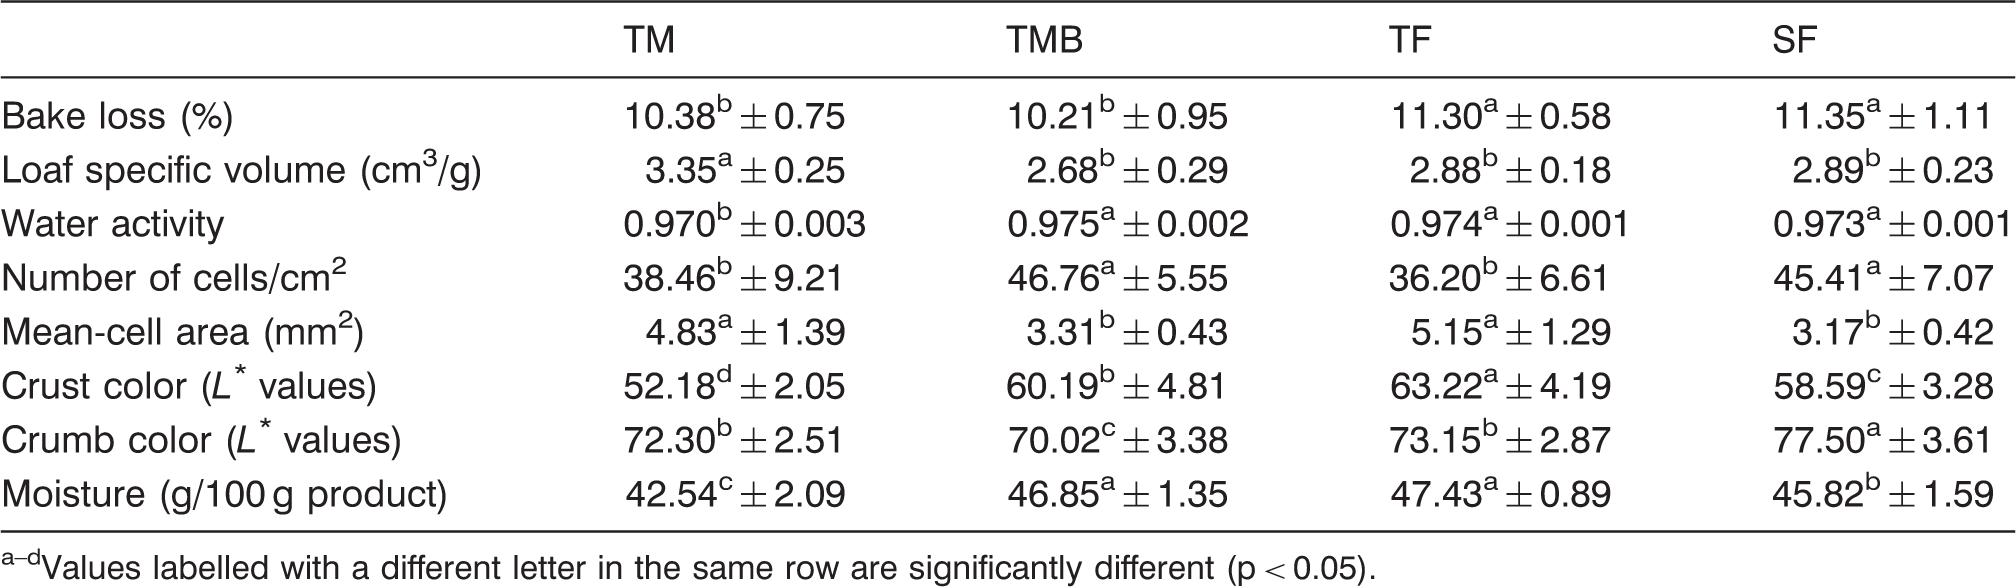
Values labelled with a different letter in the same row are significantly different (p < 0.05).
The bread with the highest loaf specific volume was TM, while no differences were observed among the other formulations (Table 3). This high volume could be explained by the feasible role played by tiger nut amylases during soaking and grinding processes in tiger nut milk production (Figure 1), including first hours after elaboration until refrigeration temperature is reached. These steps are performed with water, which extracts soluble components and activates tiger nut amylases, and so starch would be partially converted to dextrins and sugars during and after tiger nut milk production process. Ejoh et al. (2006) observed a higher free reducing sugar content in tiger nut milk compared with tiger nut tubers, which could be explained by a higher amylase activity in tiger nut milk. Goesaert et al. (2009) suggested that amylase functionality may be related to the reduction of dough viscosity during starch gelatinization, thus prolonging oven rise and resulting in an increased loaf volume.
Gularte et al. (2012) observed a relationship between bread volume and batter consistency. They stated that when batter consistency increased, specific volume of breads also increased, but when the batter was too much consistent, its development was limited and bread-specific volume decreased. This observation agrees with our results as TM batter, with higher consistency than TF and SF (Figure 2), rendered the highest loaf-specific volume (Table 3), while TMB batter, with the highest consistency (Figure 2), rendered the breads with the lowest specific volume (Table 3). Therefore, TMB batter structure was too consistent to allow batter rising during fermentation and baking.
As observed in the digital images (Figure 4), a lower number of cells, but of a larger size, were found in TM and TF crumbs. On the contrary, TMB and SF crumbs had more cells, which were smaller (Table 3). Large cells of TF bread did not involve an increase in bread volume; in contrast, the open structure of TM, due to larger alveolus size, gave the breads with the highest volume. Large cells in breads with high volume have found in other studies (Blanco et al., 2011; Lynch et al., 2009). Schober et al. (2005) observed that the presence of a high amount of sugars, due to increased susceptibility to amylase activity in damaged starch, gave breads with large mean-cell area, small number of cells, and soft crumb, according to TM bread results obtained in our study.
Digital images of gluten-free breads crumb (TM: tiger nut milk; TMB: tiger nut milk by-product; TF: tiger nut flour; SF: soya flour).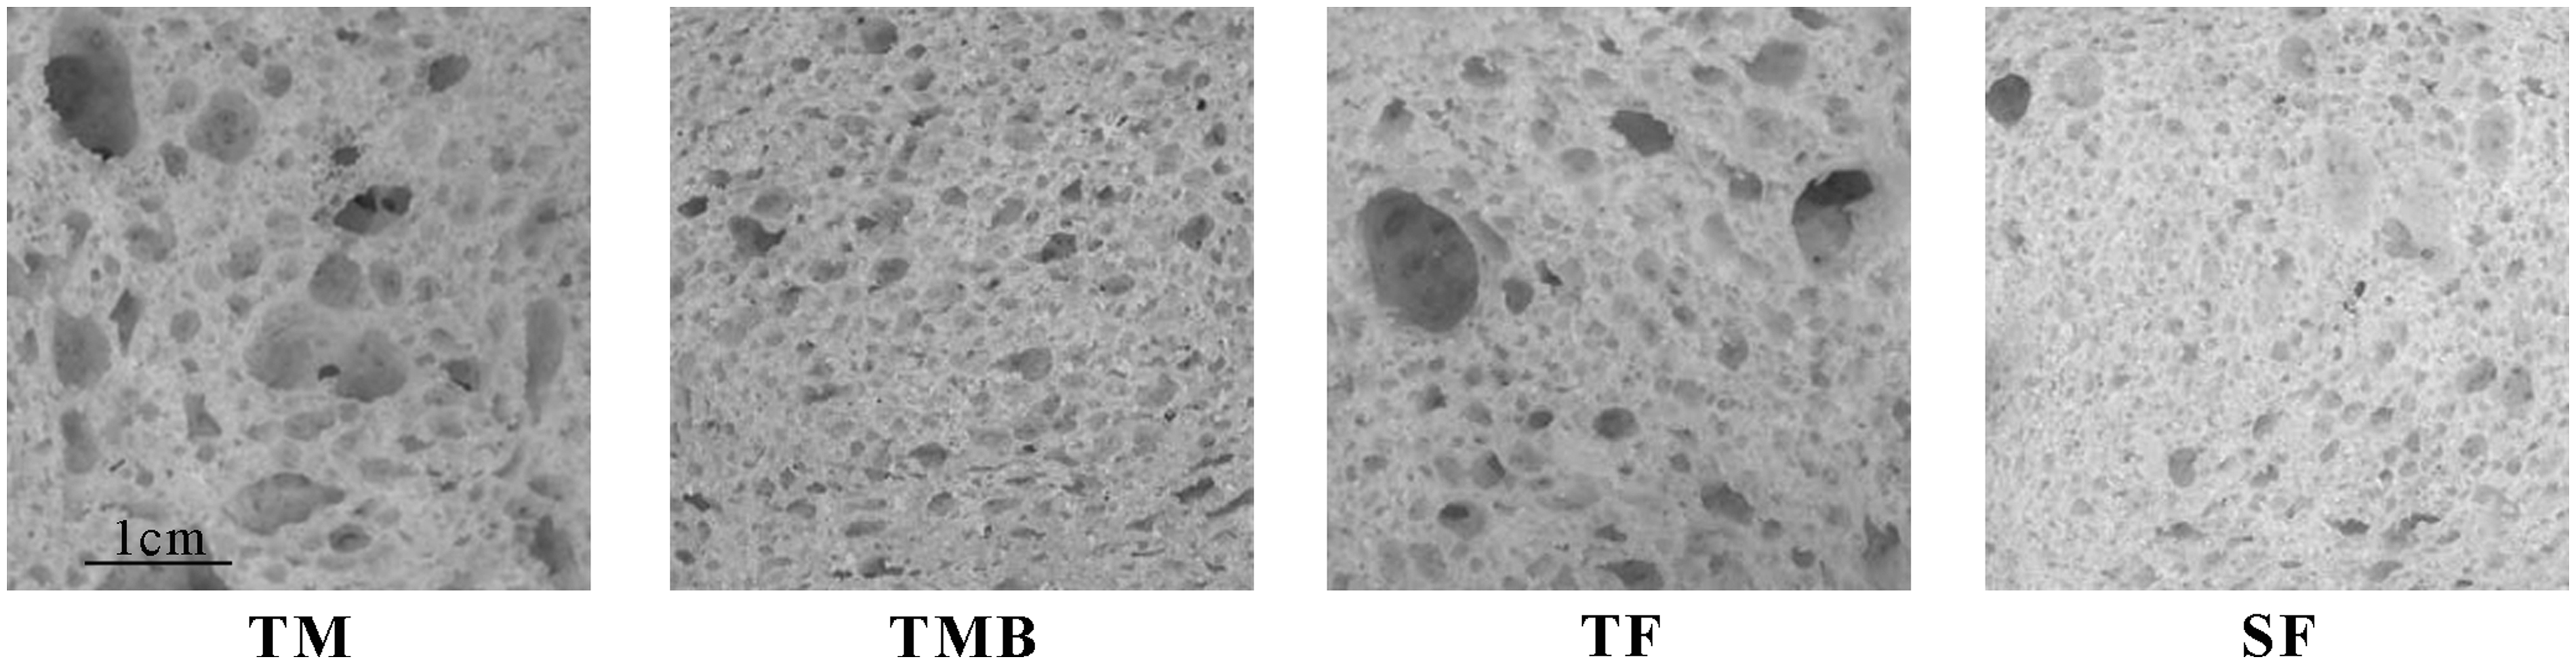
Lightness values of crusts and crumbs are reported in Table 3. The TM bread had the darkest crust while TF had the lightest. The dark crust color of TM bread agrees with its higher content of free sugars and protein, as crust color is a result of sugar caramelization and Maillard browning, which is influenced by the distribution of water and the reaction of reducing sugars and amino acids. Goesaert et al. (2009) reported that amylase activity increases the level of reducing sugars, promoting the formation of Maillard reaction products, which, in their turn intensify bread crust color. Regarding the crumb color, all breads containing tiger nut-derived products presented lower L* values than SF breads. Demirkesen et al. (2011) and Chinma et al. (2010) also observed decrease in crumb lightness due to the addition of tiger nut flour in gluten-free and wheat bread, respectively.
Texture
Texture results of gluten-free breads (TM: tiger nut milk; TMB: tiger nut milk by-product; TF: tiger nut flour; SF: soya flour)
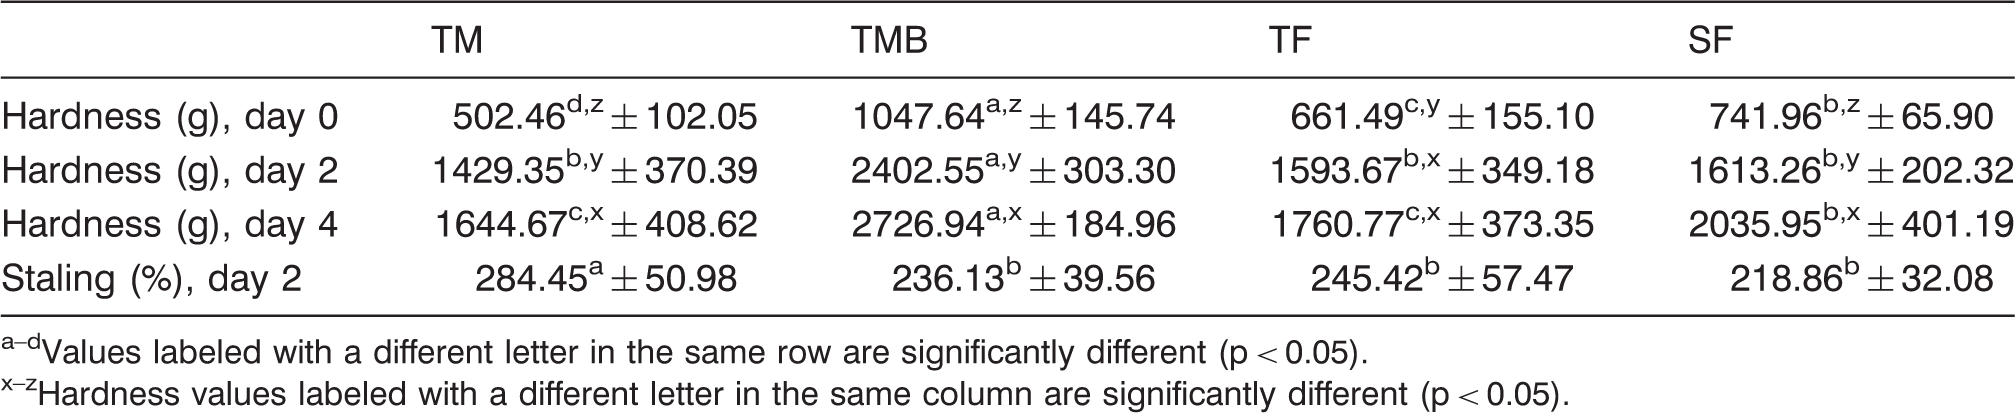
Values labeled with a different letter in the same row are significantly different (p < 0.05).
Hardness values labeled with a different letter in the same column are significantly different (p < 0.05).
Gallagher et al. (2003a) studied the effect of moisture content in gluten-free bread texture and concluded that breads with higher water content had softer crumb. In contrast, in our study, TM bread was the softest although it had the lowest water content (Table 3). Gujral et al. (2003) found a decrease in crumb hardness when α-amylase was added into rice flour gluten-free bread. This observation agrees with our hypothesis of amylase activity in tiger nut milk, as TM crumb was the softest on day 0. Moreover, tiger nut milk provided to TM formulation, the highest lipid content expressed in % of flour weight (Table 1). This could contribute to explain the softest crumb of TM bread on day 0, as lipids can interact with amylose during baking (Pareyt et al., 2011), which is responsible for initial crumb firmness (Goesaert et al., 2005). Furthermore, some authors have found softer breads when loaf specific volume was higher (Gallagher et al., 2003a; Miñarro et al., 2010; Sabanis et al., 2009). In this study, this relationship was clearly observed in TM bread.
Although TM bread had the softest crumb on day 0, it showed the highest staling rate, probably due to its low-water content (Table 3). The second softest bread was TF and suffered less staling than TM. Demirkesen et al. (2011) also observed a decrease in crumb hardness when 5 and 10% of rice flour was substituted by tiger nut flour in gluten-free bread. The TMB bread consistently showed the hardest crumb throughout the analysis, according to its fiber size and content, as previously discussed. Demirkesen et al. (2010) and Leray et al. (2010) observed an increase in crumb hardness when gluten-free bread and wheat bread were enriched with fiber.
Sensory evaluation
Intensity and acceptability values of sensory parameters of gluten-free breads (TM: tiger nut milk; TMB: tiger nut milk by-product; TF: tiger nut flour; SF: soya flour)
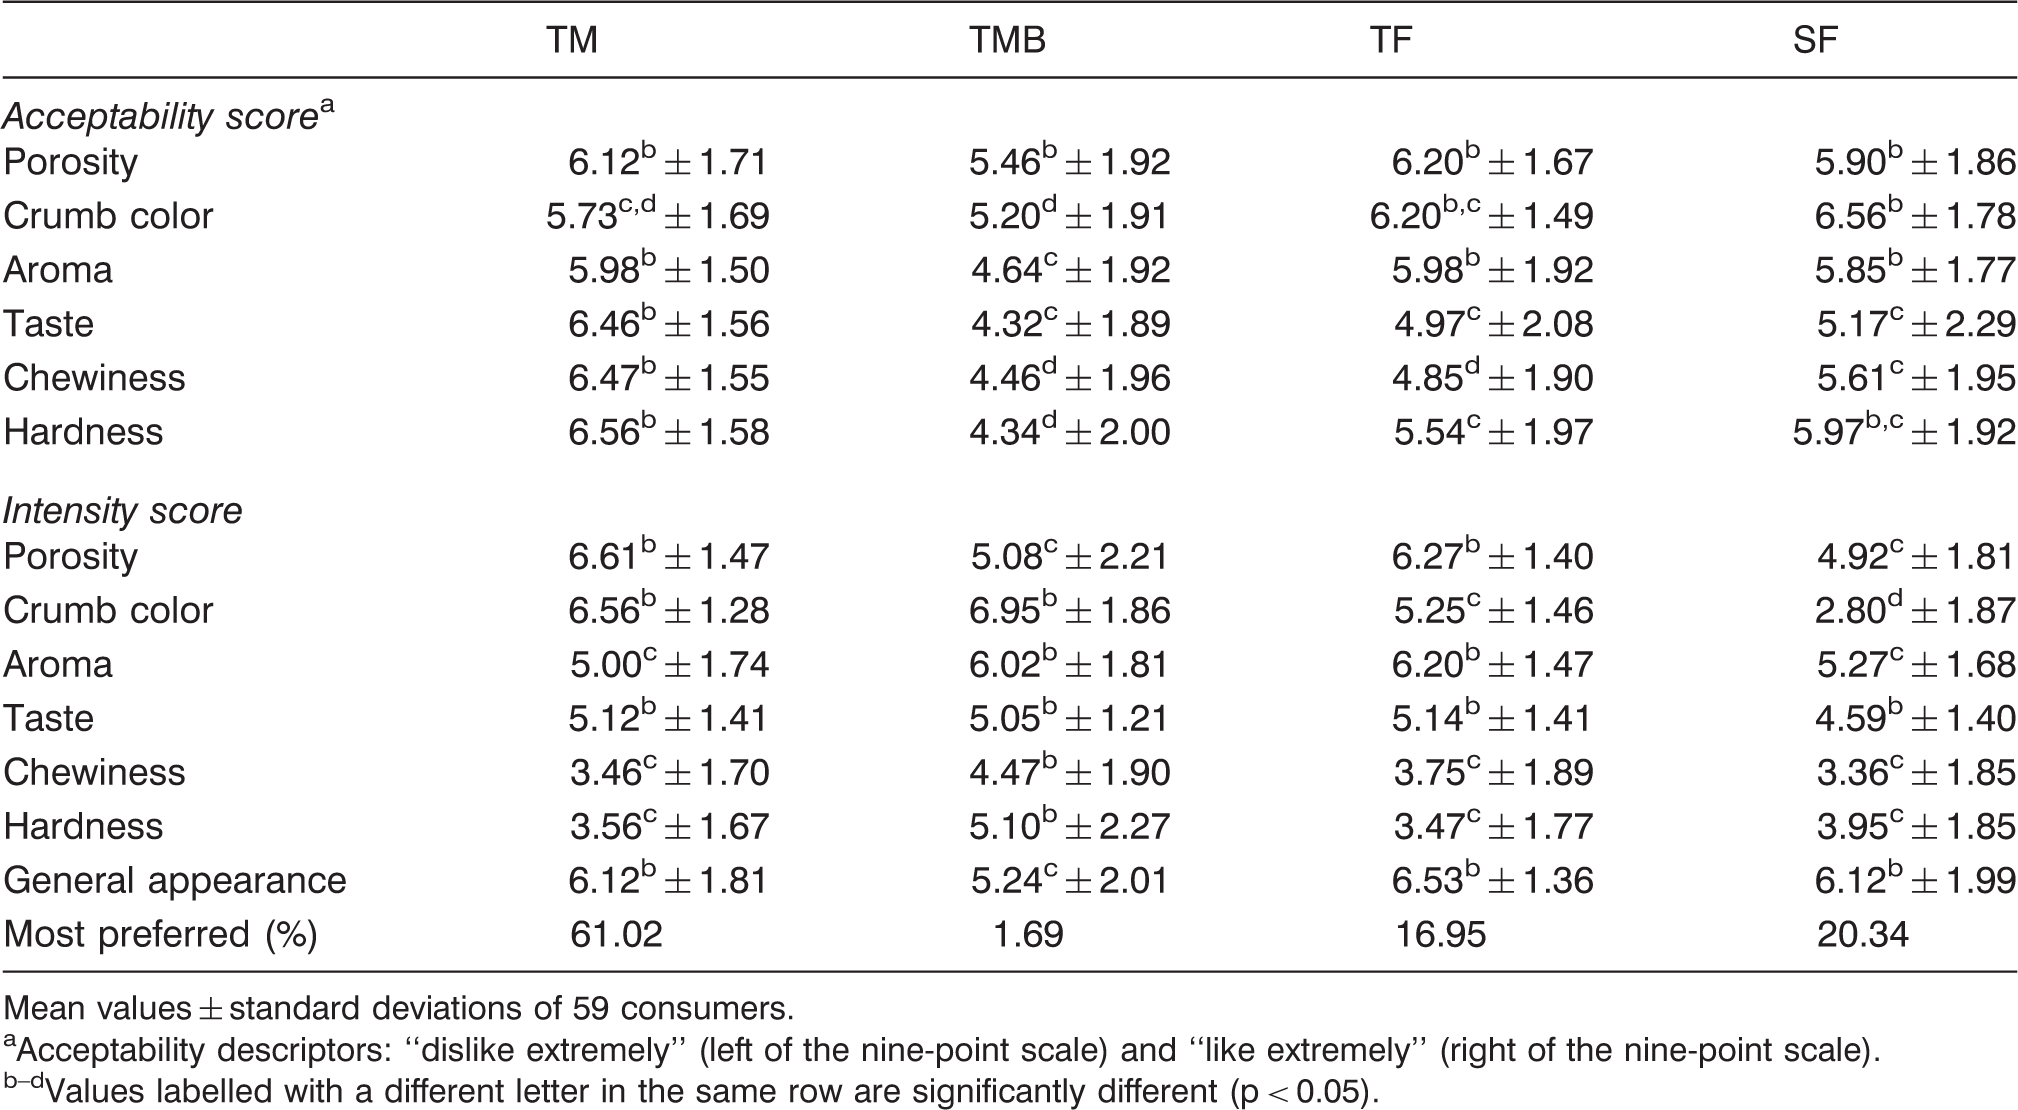
Mean values ± standard deviations of 59 consumers.
Acceptability descriptors: “dislike extremely” (left of the nine-point scale) and “like extremely” (right of the nine-point scale).
Values labelled with a different letter in the same row are significantly different (p < 0.05).
Regarding the intensity results, TM and TF breads obtained the highest score in porosity, in agreement with cell-size results. Consumers classified TMB bread as the hardest and did not detect any differences among other formulations. This indicates that staling, calculated from instrumental analysis results at day 2, had already developed 1 day after baking, when consumer test was performed. Consumers identified SF crumb color as the whitest, in accordance to instrumental measurements. No differences in taste intensity were found, but TMB and TF breads received a higher aroma intensity score.
Conclusions
Gluten-free breads containing tiger nut milk showed better baking (higher specific volume, lower bake loss, and softer crumb) and sensory characteristics (texture and taste) than soya flour breads, due to the sugar, fat, and fiber content that tiger nut milk provided to TM formulation. Tiger nut and soya flours gave similar characteristics to breads, except in color and crumb structure. Tiger nut milk by-product impaired bread quality (darkest color and hardest crumb) due to its fiber size and content. In conclusion, tiger nut milk and tiger nut flour are good alternatives to soya flour for the production of gluten-free breads with increased fiber content and free of allergens.
Footnotes
Acknowledgements
We thank Tigernuts Traders S.L. and Artgelato S.L. for kindly supplying tiger nut flour and tiger nut milk and by-product, respectively.
Funding
This work was supported by the “Ministerio de Educación, Cultura y Deporte” (AP2009-0859).
Conflict of interest
The authors declare that there is no conflict of interest.