
Abstract
The objective of this study was to evaluate the sensory properties and acceptability of pitanga nectar samples prepared with sucrose and different sweeteners (sucralose, aspartame, stevia with 40% rebaudioside A, stevia with 95% rebaudioside A, neotame, and a 2:1 cyclamate/saccharin blend). A total of 13 assessors participated in a quantitative descriptive analysis and evaluated the samples in relation to the descriptor terms. The acceptability test was carried out by 120 fruit juice consumers. The results of the quantitative descriptive analysis of pitanga nectar showed that samples prepared with sucralose, aspartame, and the 2:1 cyclamate/saccharin blend had sensory profiles similar to that of the sample prepared with sucrose. Consumers' most accepted samples were prepared with sucrose, sucralose, aspartame, and neotame. The sweeteners that have the greatest potential to replace sucrose in pitanga nectar are sucralose and aspartame.
Keywords
Introduction
Pitanga (Eugenia uniflora L.), also known as “surinam cherry” or “Brazilian cherry”, is the fruit of a perennial tree of the Myrtaceae family, native to South America. Despite its tropical origin, its cultivation is already widespread in many countries, and it can be found in some Asian countries, United States and Caribbean (Garmus et al., 2014). Pitanga is a fruit with excellent conditions for industrialization due to its high pulp content, pleasant aroma, and exotic flavor (Karwowski et al., 2013). Moreover, it is rich in calcium, phosphorus, flavonoids, carotenoids, vitamin C, and potassium (Silva, 2006; Soares et al., 2004).
Refined sugars, syrups or artificial sweeteners are used to sweeten fruit juice and nectar. However, it is important to consider that the overall increase in obesity has been partly attributed to an overall increase in consumption of refined sugars, such as sucrose and fructose. Artificial sweeteners can provide sweetness without contributing to the food's caloric value, due to their intense levels of sweetness. It is also important to consider the increase in diabetes that places restrictions on the consumption of sugars. Thus, global trends indicate that the consumption of artificial sweeteners is increasing, and foods produced with these sweeteners are constantly being added to the supermarket shelves (Mahar and Duizer, 2007).
Sucralose is a high-intensity sweetener derived from sucrose. Its pleasant sensory profile with no residual flavor, high water solubility, and physicochemical stability allow it to be used in acidic foods and thermally processed products without loss of sweetness (Basu et al., 2013). Humans do not metabolize it; furthermore, sucralose is considered an option for improving quality of life for the diabetic population (Viberg and Fredriksson, 2011).
Aspartame has excellent solubility in water and alcohol, but it is insoluble in fats and oils (Nabors, 2002). Under certain moisture conditions, temperature and pH, hydrolysis can occur resulting in loss of sweetness. Despite suffering hydrolysis with overheating, aspartame is compatible with the thermal treatment used in juices and dairy products (Wells, 1989). Following ingestion, aspartame is metabolized to phenylalanine, aspartic acid, and methanol (Ranney et al., 1976), and its use should be controlled by phenylketonurics.
Stevia is a natural sweetener known for its high sweet diterpene glycosides content (about 4–20% in dried leaves) responsible for the sweet taste (Ghanta et al., 2007). Stevioside is described as a glycoside composed of three glucose molecules bonded to an aglycone. During the 1970s, other compounds were isolated, including rebaudioside with sweetening power higher than stevioside (Barriocanal et al., 2008). In this way, studies allowed the development of new extracts with higher proportions of the rebaudioside A (between 40% and 97%), which provides a better product flavor than the other constituents (Hough, 1996).
Neotame is a strong sweetener, with sweetness for humans ranging from 7000 to 13,000 times greater than sucrose, and can be used to sweeten foods and beverages as well as to modify and enhance the flavor of foods (Flamm et al., 2003). The profile of the sweetness from neotame is similar to that of sucrose. As happens with other sweeteners, the strength of the sweetness of neotame depends on its concentration and the food or beverage to which it will be added (Sedivá et al., 2006).
Cyclamate can be heated to temperatures higher than 500 ℃ without decomposition; it is easily soluble in water, and it may be used as a non-caloric sweetener in many foods including soft drinks, desserts, and processed vegetables (Salminen and Hallikainen, 2002). Its performance is interesting in products derived from fruit due to its ability to enhance fruity flavors and to mask the acidity from certain citric fruits (Nabors, 2002).
In aqueous solutions, saccharin has a little residual bitter taste and residual metallic flavor that limits its use (Newsome, 1993). However, these characteristics can be minimized by the combined use with other sweeteners due to a synergistic capability of masking the residual flavor effect (Hough, 1996; Salminen and Hallikainen, 2002). The main advantage of the combined use of saccharin and cyclamate is to increase the sweetening power of cyclamate, as cyclamate masks the residual flavor of saccharin (Higginbotham, 1983; Nabors, 2002).
According to Amerine et al. (1965), the flavor of a fruit and its juices and nectars is the result of the sum of perceptions resulting from stimulation of the sense ends that are grouped together at the entrance of the alimentary and respiratory tracts, determining the balance of these characteristics in each product. The only way to measure these sensations is by sensory analysis, since the human response cannot be reproduced by any equipment.
The most widely acceptable scientific strategy for sensory quality evaluation takes into account the relationship between two types of data: tests with consumers and trained analytical assessors. The relationship between these makes it possible to determine sensory profiles which are best adapted to the concept of the product quality in the target market, enabling companies to establish control activities, improve quality and develop new products (Elortondo et al., 2007).
According to Resano et al. (2010), matching consumers' needs is a priority in market-oriented companies, and in this sense, consumers' acceptability of a food product is considered to be a trigger for subsequent purchases and, as such, a contributing factor to the company's ultimate success. Trained panelists, on the other hand, assess sensory profile according to the conformity of an array of descriptors to predetermined standards and consequently provide valuable information to the food industry about the characteristics of their products. The combination of consumers' scores on acceptability and trained panelists' assessments on an array of sensory attributes enabled an investigation of the degree of convergence between both groups of tasters in terms of pleasantness intensity and identification of the sensory drivers of consumers' acceptability and their coherence with those of trained panelists' sensory profile assessment.
Two types of preference mapping can be distinguished: external and internal (Carrol, 1972). The former relates consumers' acceptability to sensory, physical and/or chemical data, whereas the latter only uses consumers' acceptability scores to achieve a multidimensional representation of the products (Greenhoff and Macfie, 1994). In other words, the external mapping aims at explaining the sensorial (and/or instrumental) reasons of consumers' preferences (Resano et al., 2010).
In this context, the study of pitanga nectar prepared with sucrose and high-intensity sweeteners is relevant, because the fruit is rich in nutrients and provides conditions for industrialization, and the Brazilian production has great market potential. Using sweeteners instead of sucrose meets the needs of consumers who cannot consume sugars due to metabolic disorders, and of those seeking less caloric food. So, the objective of this study was to determine the sensory profile, consumer acceptability, and their interaction regarding the pitanga nectar prepared with different sweeteners, by sensory methods.
Materials and methods
Materials
The pitanga nectar samples were prepared with unsweetened frozen pulp (Ricaeli™, Cabreúva, Brazil), drinking water, and sweeteners. The sweeteners were: sucrose (União™, São Paulo, Brazil), sucralose (Tovani-Benzaquem™, São Paulo, Brazil), aspartame (All Chemistry do Brasil™, São Paulo, Brazil), stevia 40% rebaudioside A (Clariant™, Suzano, Brasil), stevia 95% rebaudioside A (Tovani-Benzaquem™, São Paulo, Brazil), neotame (Sweetmix™, Sorocaba, Brazil), and a blend (2:1) of cyclamate (Sweetmix™, Sorocaba, Brazil)/saccharin (Pharma Nostra™, Rio de Janeiro, Brazil).
Methods
Samples
Seven pitanga nectar samples were prepared in the Laboratory of Sensory Analysis in the Department of Food and Nutrition at the University of Campinas the day before each test.
The ideal pulp dilution (25% pulp) and ideal sweetness with sucrose (10% sucrose) were previously determined by consumers using a just-about-right scale. The equi-sweet concentrations of sweeteners were also previously determined by assessors, using the magnitude estimation model. Sweetener concentrations to replace sucrose were 0.016% sucralose, 0.0541% aspartame, 0.1% stevia 40% rebaudioside A, 0.1% stevia 95% rebaudioside A, 0.0017% neotame and 0.036% 2:1 cyclamate/saccharin blend. In addition, microbiological analyses were carried out on the pitanga pulp in order to avoid any risk to the healthy tasters (Freitas et al., 2014).
Quantitative descriptive analysis
The samples were presented using a balanced complete block design (Macfie, 1989) in a monadic sequential way, 30 mL at 10 ℃ in disposable plastic glasses, coded with three-digit numbers. The tasters used an unstructured 9-cm scale ranging from “weak” to “strong” or “none” to “strong”, depending on the descriptor term, in the Fizz™ software (version 2.47, Biosystemes, Coutemon, France) in individual booths in the laboratory at 22 ℃. The tasters had available water to drink in order to clean their palate.
Several people were submitted to Wald´s sequential analysis, using triangle tests (Amerine et al., 1965) to select those with high discrimination ability. For these tests, two pitanga nectar samples were used, sweetened with 3.5% and 5% sucrose. These samples presented a significant difference at 0.1% significance level in a paired comparison test.
Fourteen judges were selected using the following parameters: ρ0 = 0.33 (maximum acceptable inability), ρ1 = 0.66 (minimum acceptable ability), α = 0.05 (probability of accepting a candidate without sensory acuity) and β = 0.05 (probability of rejecting a candidate with sensory acuity). To be selected, the tasters had to choose the correct answer in at least seven out of nine tests. When they did not reach this result, they could continue the tests and had to choose the correct answer in at least eight of 12 tests (Augusto et al., 2005; Moraes and Bolini, 2010).
Descriptors and references used for sensory profiling of pitanga nectar sweetened with different sweeteners

Pitanga nectar was prepared with Ricaeli™ pitanga pulp and filtered water in the specified proportions.
After training, tasters were submitted to definitive team selection for quantitative descriptive analysis. They evaluated three pitanga nectar samples in three replicates and were selected based on each taster's discrimination ability, reproducibility of judgments, and agreement with the other members of the group, verified by a two-factor analysis of variance (ANOVA; sample and repetition) for each taster in relation to each attribute (Damásio and Costell, 1991). Tasters with good discrimination ability (p ≤ 0.50), reproducibility of judgments (p > 0.05), and group consensus were selected to compose the panel.
A total of 13 assessors were selected to compose the definitive team and evaluated the seven samples in three replicates. One man and 12 women composed the team. They were between 20 and 30 years old.
Affective testing
The affective testing was conducted with 120 fruit juice consumers, men and women between 18 and 60 years old, using an unstructured 9-cm hedonic scale ranging from “extremely dislike” to “extremely like” for appearance, odor, flavor, texture, and overall impression. The samples were presented in 30 mL at 10 ℃ in disposable plastic glasses, coded with three-digit numbers in individual booths in the laboratory at 22 ℃. They were presented in one session using a balanced complete block design in a monadic sequential way, and the consumers received water between the samples in order to clean their palate (Hough et al., 2006; Stone et al., 2012).
Statistical analysis
Data obtained from the descriptive quantitative analysis were evaluated by two-factor with interaction analysis of variance (ANOVA) and the Tukey's test using the SAS software (version 9.1.2, SAS Institute, Cary, NC). These data were also analyzed by principal component analysis with covariation matrix using the software XLSTAT (Addinsoft, Paris, France). The data from the affective testing were evaluated by ANOVA and the Tukeýs test using the SAS software.
Descriptive information obtained from the trained panel was related to the consumer preference data using partial least squares regression (PLS) (Tenenhaus et al., 2005). An external preference mapping multivariate statistical analysis allowed the generation of a multidimensional sensory affective space formed by the consumers, attributes, and samples. These analyses were carried out using the software XLSTAT.
This research project was submitted to and approved by the Research Ethics Committee from the University of Campinas, CEP n° 1264/2011. Moreover, a Term of Consent containing information about the research was prepared and presented to the tasters.
Results and discussion
Quantitative descriptive analysis
Attribute means for each pitanga nectar sample prepared with different sweeteners in quantitative descriptive analysis
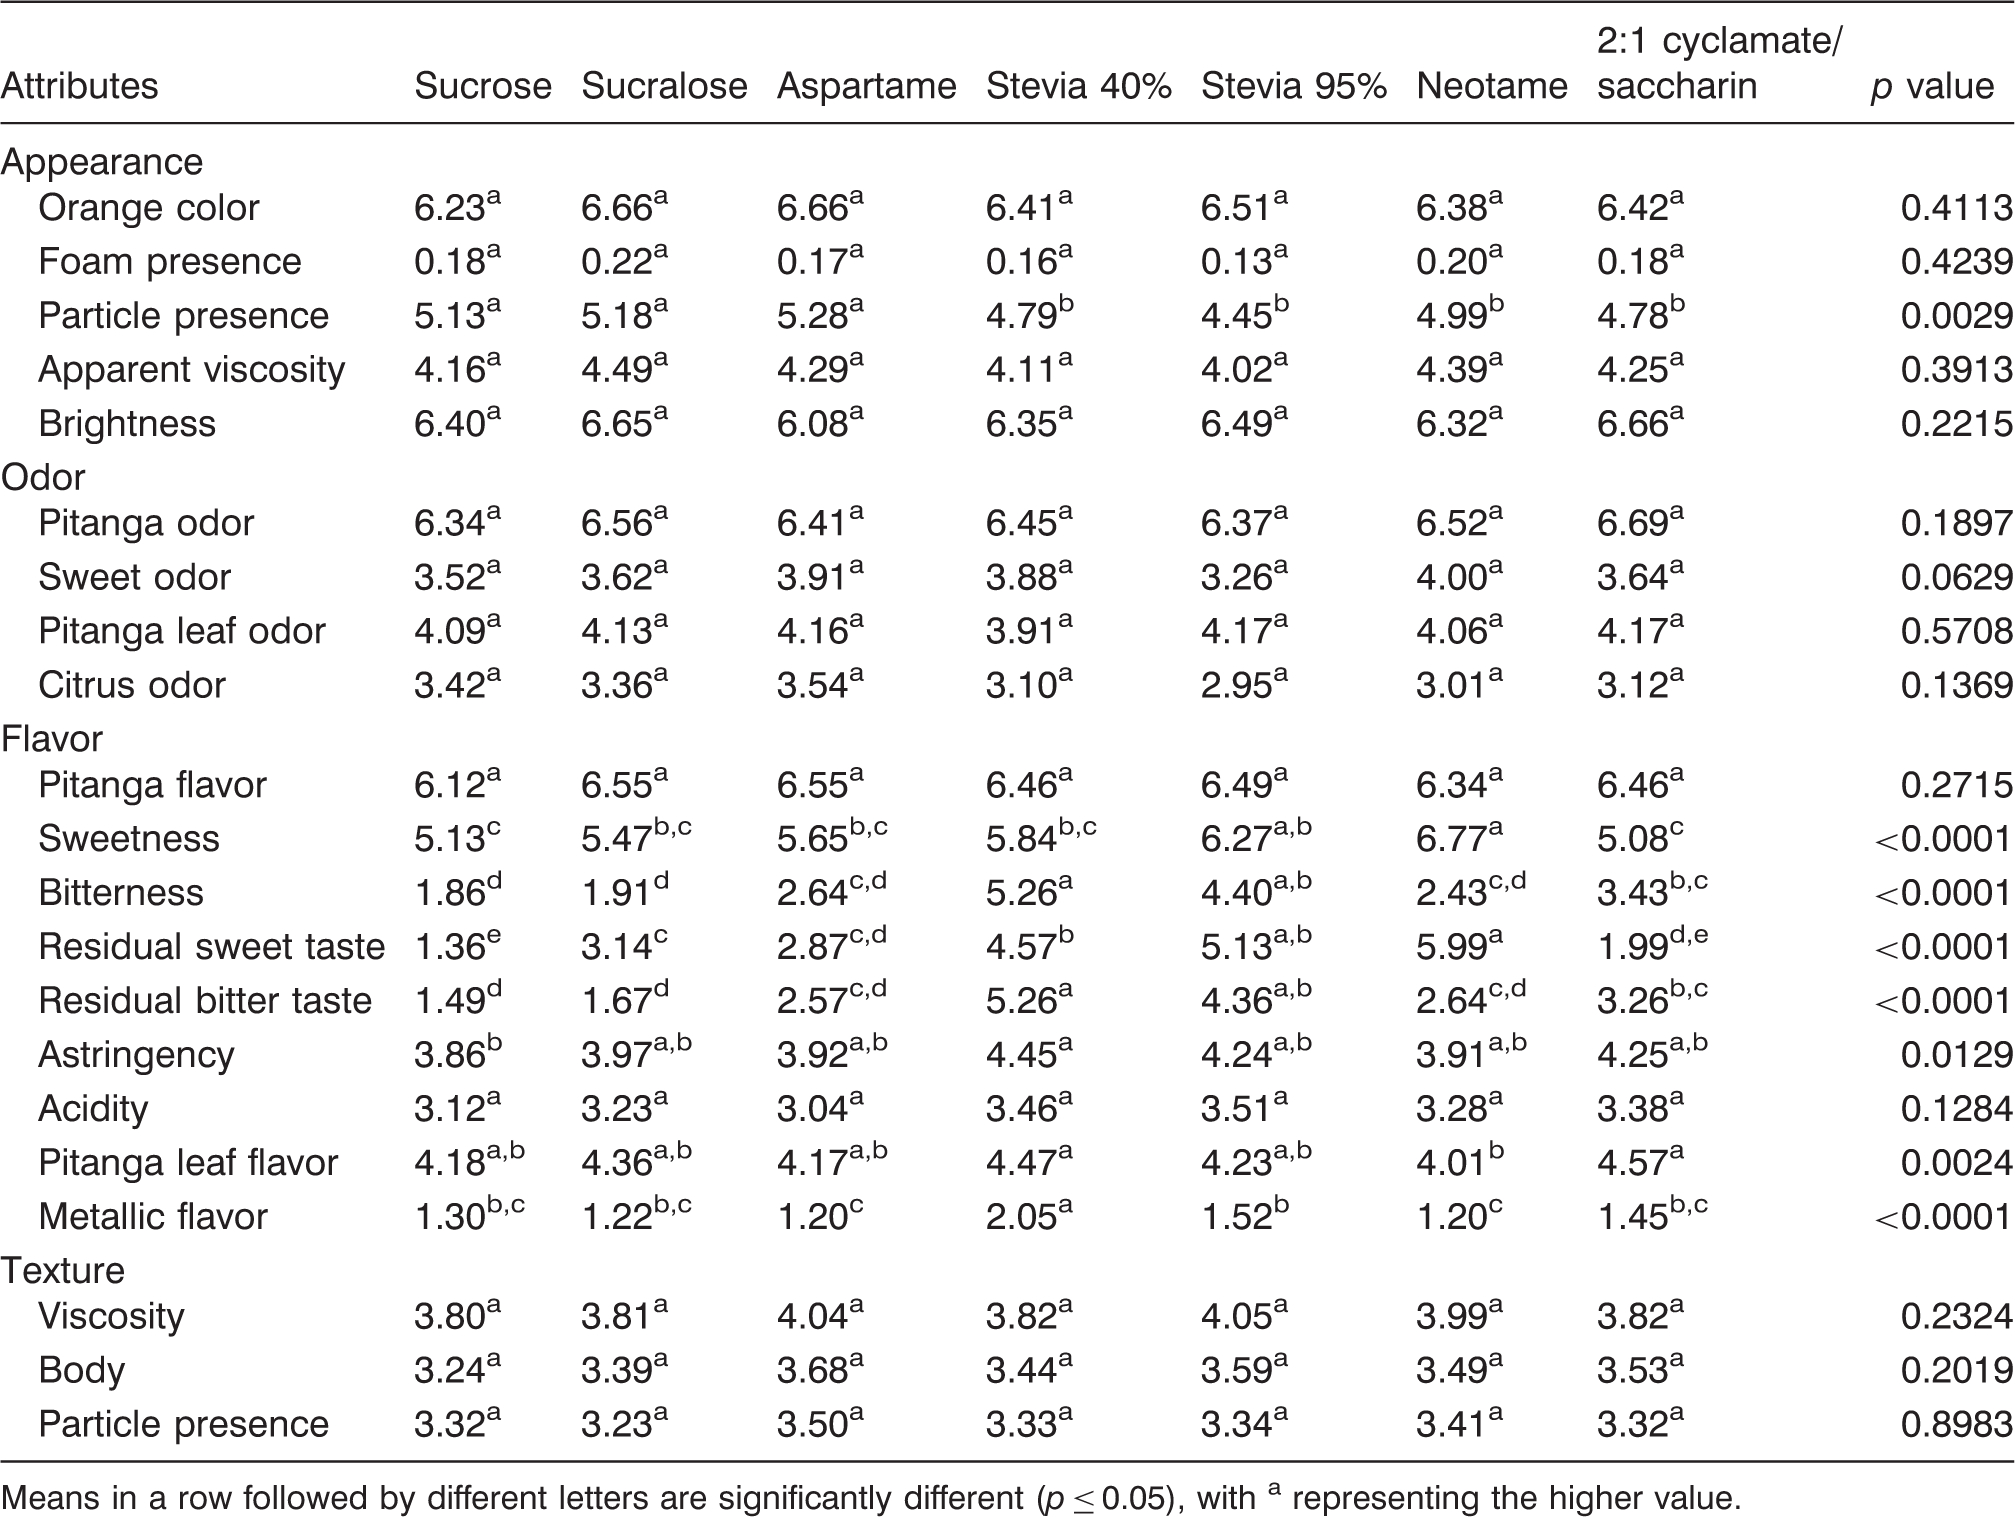
Means in a row followed by different letters are significantly different (p ≤ 0.05), with a representing the higher value.
Differing from the results for pitanga nectar, in a study conducted by Cardoso and Bolini (2008) with peach nectar prepared with different sweeteners, the sample prepared with sucrose had the highest average for apparent viscosity, significantly differing (p ≤ 0.05) from the other samples.
The pitanga nectar samples did not significantly differ (p > 0.05) in the odor attributes, that is, pitanga odor, sweet odor, pitanga leaf odor, and citrus odor. This suggests that the sweeteners used did not affect the odor attributes.
Regarding flavor attributes, the pitanga nectar samples did not significantly differ (p > 0.05) only for the attributes such as pitanga flavor and acidity, suggesting that the sweeteners did not significantly influence these natural pitanga nectar attributes.
Among the pitanga nectar samples, those prepared with neotame and stevia 95% rebaudioside A had the highest averages (p < 0.05) for sweetness and did not significantly differ (p > 0.05) between themselves. However, sweetness of samples with stevia 95% did not significantly differ (p > 0.05) from those with sucralose, aspartame and stevia 40%. On the other hand, those prepared with the 2:1 cyclamate/saccharin blend and sucrose had the lowest averages, and they did not significantly differ (p > 0.05) from the samples with sucralose, aspatame, and stevia 40%.
The pitanga nectar samples prepared with stevia 40% rebaudioside A and stevia 95% rebaudioside A presented the highest averages for bitterness and did not significantly differ (p > 0.05) between themselves, revealing the bitter taste present in these sweeteners. However, the sample with stevia 95% rebaudioside did not significantly differ (p > 0.05) from that with 2:1 cyclamate/saccharin blend that significantly differed (p < 0.05) from that with stevia 40% rebaudioside. This might show a tendency of lower bitterness for stevia 95% rebaudioside compared with 40% rebaudioside. Pitanga nectar samples prepared with sucrose and sucralose showed the lowest averages, and they did not significantly differ (p > 0.05) from those prepared with aspartame and neotame. These values are not null, suggesting that the pitanga nectar had the bitter taste of natural fruit and that sweeteners increased this attribute.
As a comparison, regarding the peach nectar, the sample that presented the highest average for bitterness was also that prepared with stevia (Cardoso and Bolini, 2008). Similar results were found by Umbelino and Bolini (2005) while studying mango juice.
Similar to the sweetness attribute, for the residual sweet taste attribute, the pitanga nectar samples prepared with neotame and stevia 95% rebaudioside A presented the highest averages and did not significantly differ (p > 0.05) between themselves; however, the sample with stevia 95% rebaudioside did not significantly differ (p > 0.05) from that with stevia 40% rebaudioside. The samples prepared with the 2:1 cyclamate/saccharin blend and sucrose had the lowest averages and did not significantly differ (p > 0.05) between themselves; however, the sample with 2:1 cyclamate/saccharin blend did not significantly differ (p > 0.05) from that with aspartame.
Umbelino and Bolini (2005), while studying mango juice, showed that among the samples, the one that presented the highest average for residual sweet taste was prepared with stevia. Considering that these authors did not use neotame in their samples, the results correspond to those found in the present study.
Regarding residual bitter taste, the pitanga nectar samples prepared with stevia 40% rebaudioside A and stevia 95% rebaudioside A had the highest averages and did not significantly differ (p > 0.05) between themselves. Similarly, for the bitterness, the sample with stevia 95% rebaudioside did not significantly differ (p > 0.05) from that with 2:1 cyclamate/saccharin blend that significantly differed (p < 0.05) from that with stevia 40% rebaudioside. Samples prepared with sucrose, sucralose, aspartame, and neotame had the lowest averages and did not significantly differ (p > 0.05) among them, showing that these sweeteners in pitanga nectar have little residual bitter taste that remains in the mouth after swallowing, and it might was provided by little bitter taste naturally presented in pitanga nectar (Table 2).
Similar results were found by Cardoso and Bolini (2008) while studying peach nectar. Umbelino and Bolini (2005), while studying mango juice, also found a higher average for residual bitter taste in the sample prepared with stevia.
It is interesting that, despite the large difference in rebaudioside in the two sweeteners from stevia used to prepare the pitanga nectar, these samples did not differ in the attributes of sweetness, residual sweet taste, bitterness, and residual bitter taste, as expected, once the increase in rebaudioside content could increase the sweetness and decrease the bitterness. This suggests that the characteristic bitter taste of stevia did not cease to be evident due to the higher percentage of rebaudioside, in pitanga nectar. But, a tendency of lower bitterness and residual bitter taste for stevia 95% rebaudioside was noted compared with stevia 40% rebaudioside.
The different sweeteners did not affect the texture attributes significantly, that is, the pitanga nectar samples did not significantly differ (p > 0.05) in the viscosity, body, and particle presence.
The results obtained in the quantitative descriptive analysis were submitted to principal component analysis (Figure 1). The principal component analysis was presented with the principal components 1 and 2 including the attributes that are significantly different (p < 0.05) among the samples. From this graph, it is possible to see which samples were close to each other, and which attributes more likely characterized them.
Principal component analysis graphic for pitanga nectar prepared with different sweeteners, PC1 × PC2 (98.85%).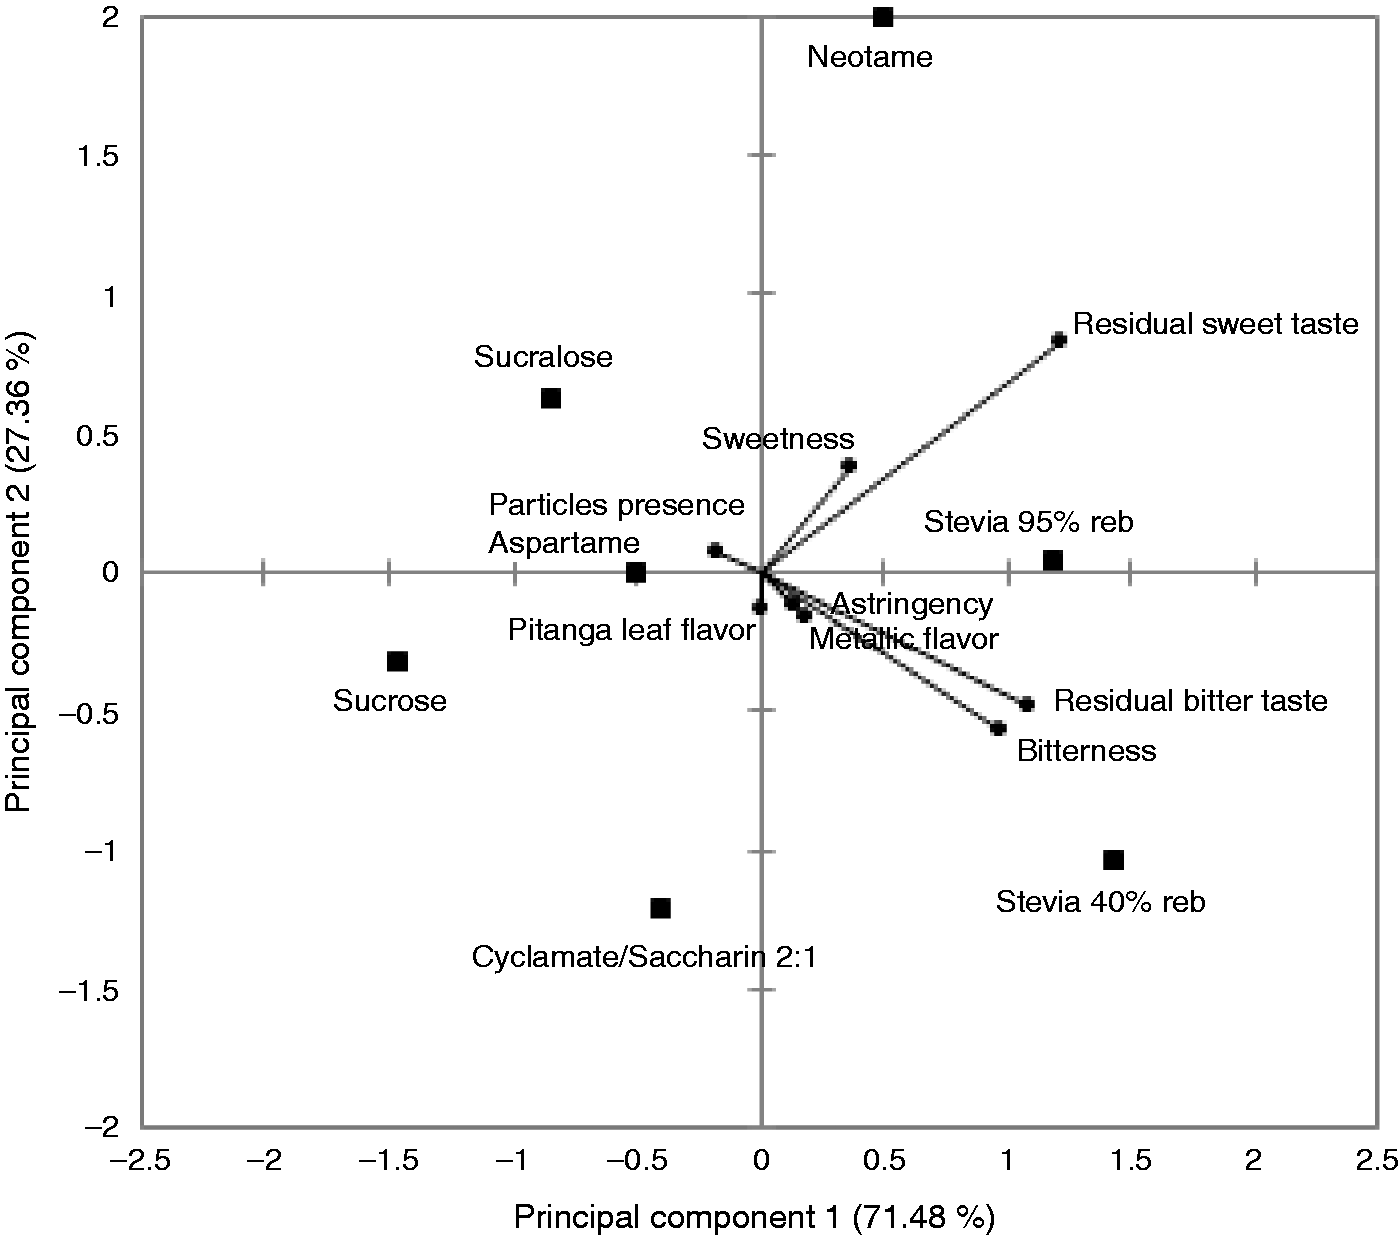
According to Figure 1, the pitanga nectar prepared with sucrose, sucralose, and aspartame are close, suggesting that they had similar sensory profiles. Samples prepared with stevia 40% rebaudioside A and stevia 95% rebaudioside A are close and are characterized by the attributes such as bitterness and residual bitter taste. Furthermore, it was observed that the samples prepared with neotame and stevia 95% rebaudioside A were characterized by the attributes such as sweetness and residual sweet taste.
Affective testing
Attribute means for each pitanga nectar sample prepared with different sweeteners in affective testing
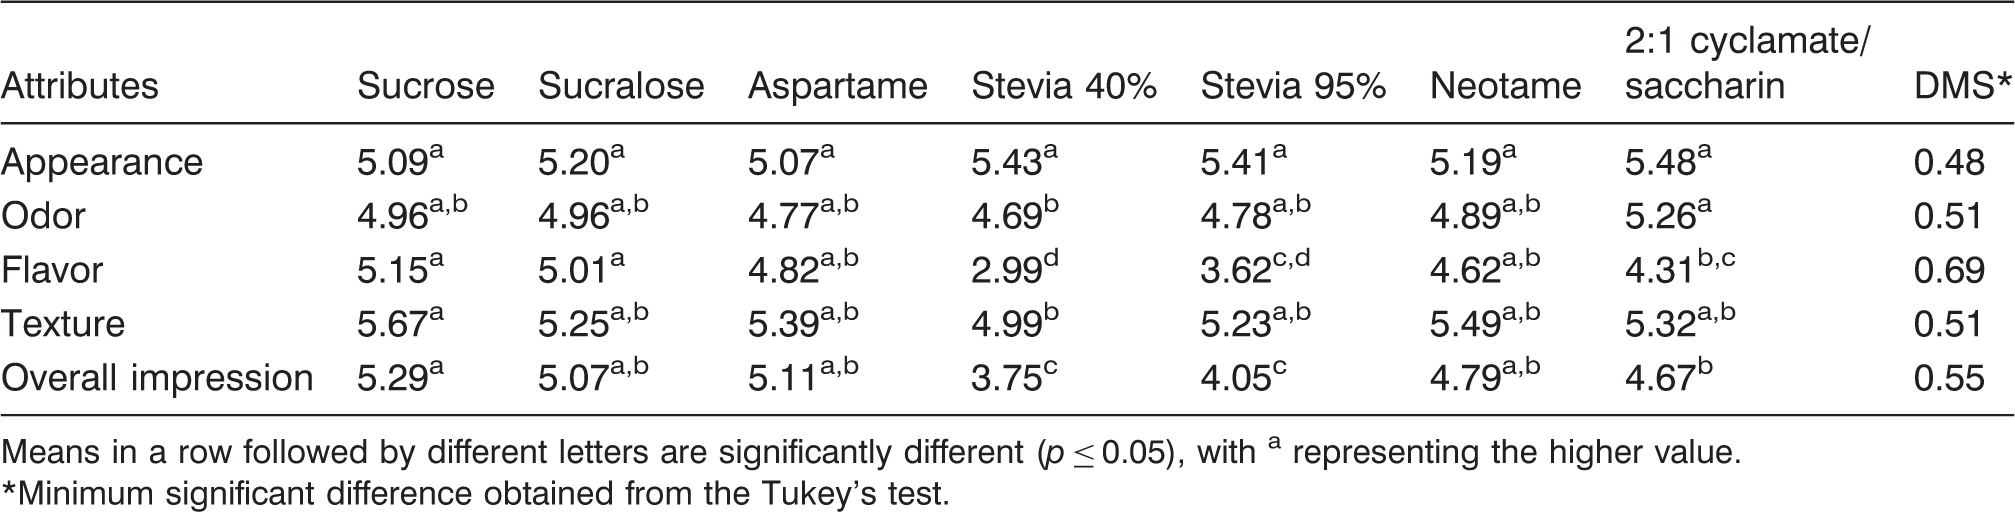
Means in a row followed by different letters are significantly different (p ≤ 0.05), with a representing the higher value.
*Minimum significant difference obtained from the Tukey's test.
Regarding their appearance, the samples did not significantly differ (p > 0.05) among themselves. For acceptance in relation to odor, the samples prepared with the 2:1 cyclamate/saccharin blend, sucrose, sucralose, aspartame, stevia 95% rebaudioside, and neotame had the highest average and did not significantly differ (p > 0.05) between them. However, the samples with sucrose, sucralose, aspartame, stevia 95% rebaudioside, and neotame did not significantly differ (p > 0.05) from the sample with stevia 40% rebaudioside.
Regarding the attribute flavor, the samples prepared with sucrose, sucralose, aspartame, and neotame showed the highest average with no difference between them (p > 0.05). On the other hand, the samples prepared with stevia 40% rebaudioside A and with stevia 95% rebaudioside A had the lowest averages, showing consumers' rejection for these samples, regarding flavor.
As far as the texture is concerned, that is, viscosity and body, the sample prepared with sucrose, sucralose, aspartame, stevia 95% rebaudioside, neotame and 2:1 cyclamate/saccharin blend obtained the highest average with no difference between them (p ≤ 0.05). But, the samples with sucralose, aspartame, stevia 95% rebaudioside, neotame, and 2:1 cyclamate/saccharin blend did not significantly differ (p > 0.05) from the sample with stevia 40% rebaudioside. Finally, regarding overall impression, sucrose, sucralose, aspartame, and neotame samples had the highest acceptance, with no difference between them (p > 0.05); however, sucralose, aspartame, and neotame samples did not significantly differ (p > 0.05) from 2:1 cyclamate/saccharin blend sample.
The external preference mapping was constructed using the data from consumer acceptance for overall impression and the averages of attribute descriptors obtained in the trained assessors' quantitative descriptive analysis. This external preference mapping is shown in Figure 2. Pitanga nectar samples were more likely characterized by the descriptor terms that were close to them, and the consumers were near the samples of their preference.
External preference mapping indicating attributes, positions of consumers, and samples of pitanga nectar prepared with different sweeteners (PC1 x PC2 45.82%). ORC: orange color; FPR: foam presence; PPR: particle presence; AVI: apparent viscosity; BRI: brightness; PIA: pitanga odor; SWA: sweet odor; PLA: pitanga leaf odor; CIA: citrus odor; PIF: pitanga flavor; SWE: sweetness; BIT: bitterness; RST: residual sweet taste; RBT: residual bitter taste; AST: astringency; ACI: acidity; PLF: pitanga leaf flavor; MET: metallic flavor; VIS: viscosity; BOD: body; PAP: particle presence.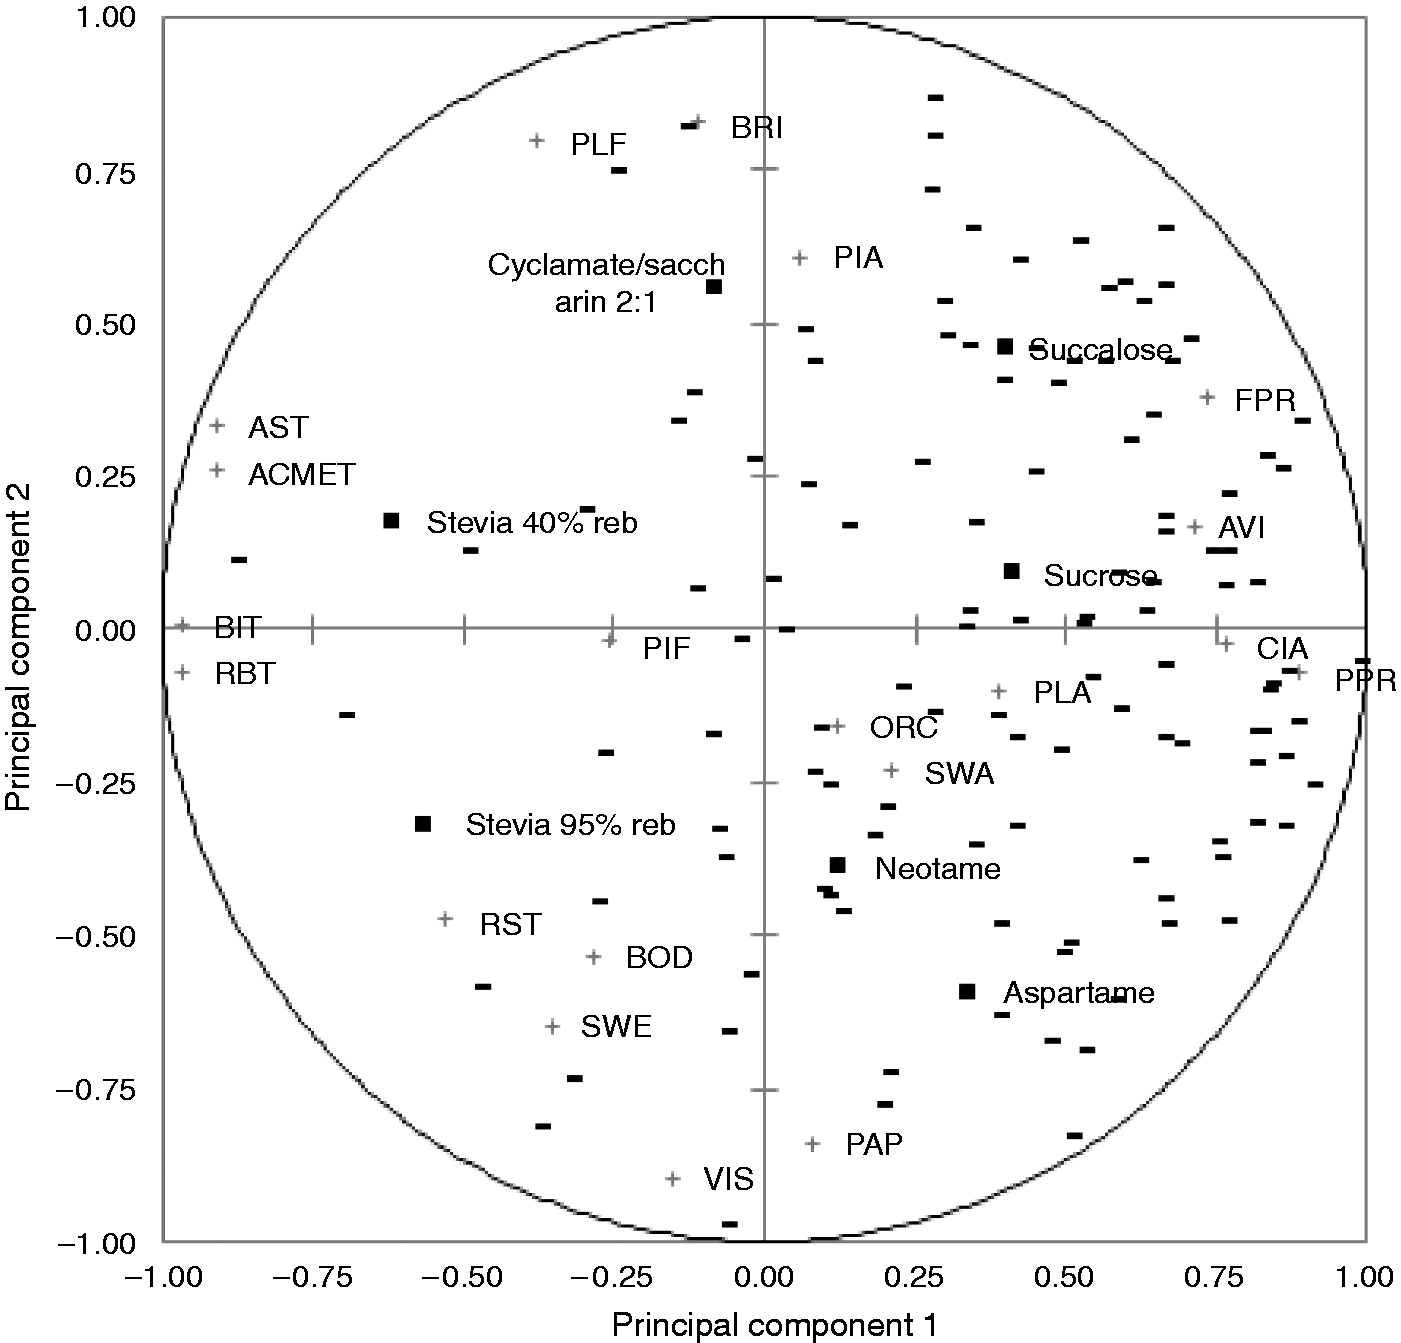
The external preference mapping obtained by principal components 1 and 2 explained 45.82% of the variation between the samples. This value, which was relatively low, can be explained by the consumers’ preference being divided among more than one sample. Indeed, it is possible to see in Table 3 that, in general, consumers did not strongly differentiate samples' overall impression acceptances (no significant difference, p > 0.05, between the samples prepared with sucrose, sucralose, aspartame, and neotame). However, the seven samples are spread out in Figure 2. Therefore, the “general no difference” indicated in Table 3 can be seen in Figure 2 since many consumers are close to the beginnings of principal components 1 and 2, suggesting that they do not contribute to samples' differentiation.
In the external preference mapping (Figure 2), the consumers were located near the sample of their choice, those prepared with sucrose, neotame, sucralose, and aspartame. In addition, these samples were characterized by attributes such as pitanga odor, orange color, and sweet odor. In fact, these samples had the highest averages for overall impression in the Tukey's test (Table 3). The samples prepared with sucrose, sucralose, and aspartame presented similar sensory profiles, and the samples prepared with neotame presented a different sensory profile from them and it was characterized by the attributes of residual sweet taste and sweetness. Thus, it is suggested that different groups of consumers might prefer different samples due to their different sensory profiles.
The samples prepared with stevia 40% rebaudioside A, stevia 95% rebaudioside A and the 2:1 cyclamate/saccharin blend presented results very far from the concentration of tasters, showing that they were rejected. These samples showed the lowest average according to the Tukey's test for overall impression (Table 3). The samples were prepared with stevia 40% rebaudioside and stevia 95% rebaudioside, and were characterized by attributes such as residual bitter taste, residual sweet taste, and metallic flavor.
To visualize which descriptor terms had positive or negative influence on the consumers' decision for overall impression in the acceptance analysis, a PLS regression was performed between the descriptor terms and the averages of overall impression of pitanga nectar samples. The standardized coefficients of the regression are shown in Figure 3. The confidence interval for this regression was 95%.
Standardized coefficients from the regression analysis by partial least squares between the descriptors and the overall impression means for the pitanga nectar samples prepared with different sweeteners. ORC: orange color; FPR: foam presence; PPR: particle presence; AVI: apparent viscosity; BRI: brightness; PIA: pitanga odor; SWA: sweet odor; PLA: pitanga leaf odor; CIA: citrus odor; PIF: pitanga flavor; SWE: sweetness; BIT: bitterness; RST: residual sweet taste; RBT: residual bitter taste; AST: astringency; ACI: acidity; PLF: pitanga leaf flavor; MET: metallic flavor; VIS: viscosity; BOD: body; PAP: particle presence.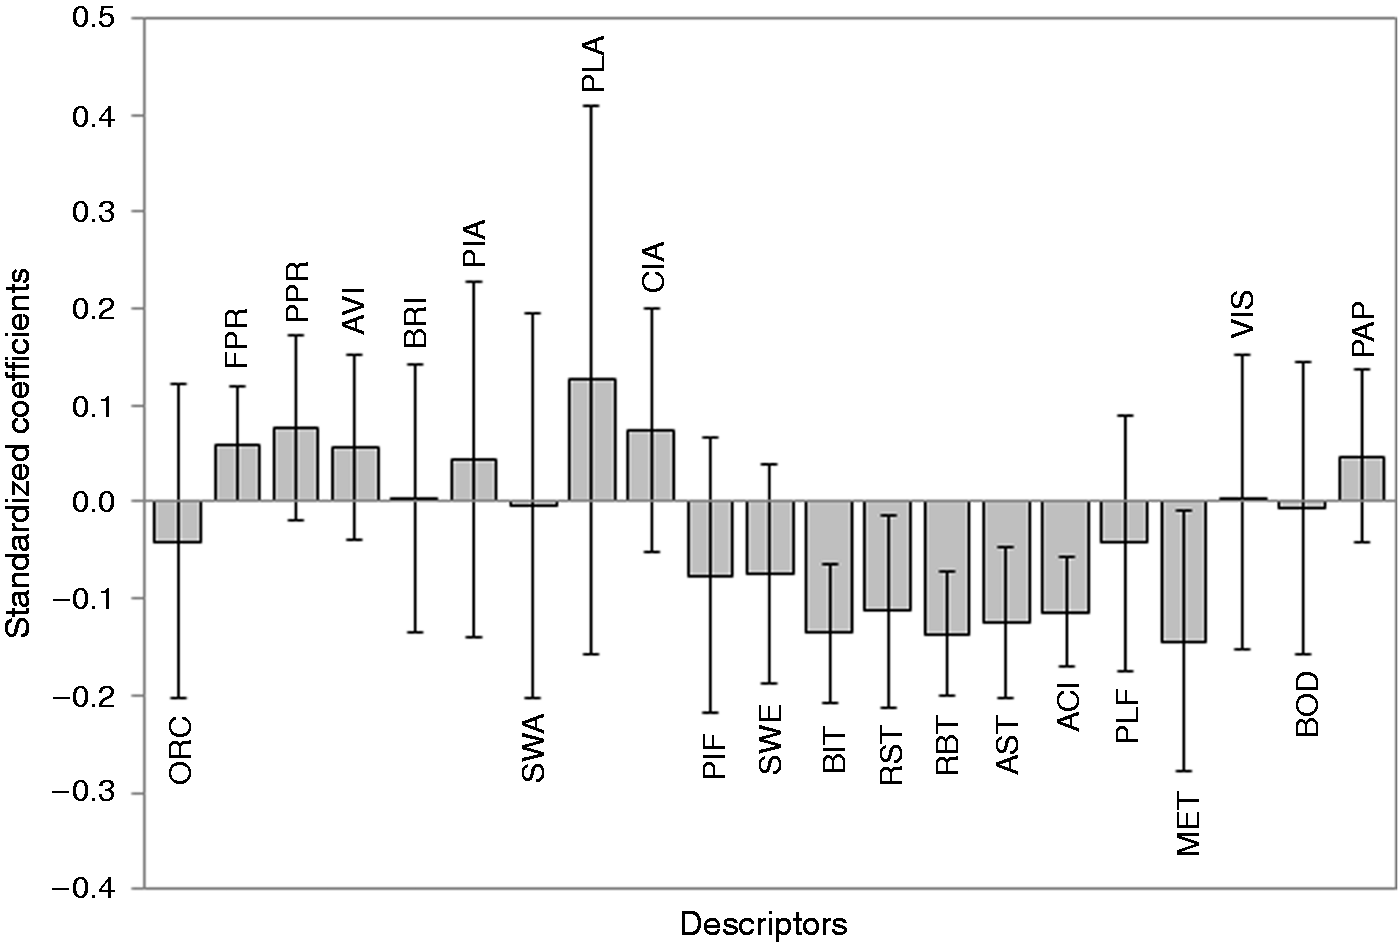
The descriptor terms presented a confidence interval below zero, showing a significant negative influence on the score attributed to the overall impression in the acceptance test. These terms are bitterness, residual sweet taste, residual bitter taste, astringency, acidity, and metallic flavor.
These terms were attributed to the samples prepared with stevia 40% rebaudioside A or stevia 95% rebaudioside A, in accordance with the external preference mapping (Figure 2). This explains the low average these samples obtained in the Tukey's test for the overall impression in the acceptance test (Table 3).
Voorpostel et al. (2014) reported that the purple color and grape flavor had a positive effect on the acceptance of six samples of grape nectar, each one sweetened with one different sweetener, and wine aroma, astringency, bitter taste, and bitter aftertaste adversely affected the sensory acceptance. In the evaluation of mango nectar, the descriptors’ sweet aftertaste and bitter aftertaste negatively influenced the acceptance after 120 days of storage time (Cadena et al., 2013).
Attributes such as bitterness and residual flavors are undesirable in fruit nectar, because they can reduce the perception of fruit flavor, mischaracterizing the product (Brito and Bolini, 2009). One way to reduce these undesirable effects would be by using sweeteners which are responsible for high values of these attributes in synergy with other sweeteners. One example is the already known synergic effects in the use of cyclamate/saccharin blend, which decreases the residual bitter taste and the metallic flavor of saccharin (Hough, 1996; Salminen and Hallikainen, 2002). This effect might be tested with stevia and other sweeteners in order to observe the resultant profile. For acerola nectar, a solution to reduce the bitterness and to increase the acceptability of samples sweetened with stevia extracts was the use of extracts with rebaudioside higher levels, according to Dutra and Bolini (2013). The authors reported that acerola nectar samples sweetened with stevia containing higher levels of rebaudioside were more accepted than the sample sweetened with stevia extract with 40% rebaudioside. For pitanga nectar this difference was not significant; however, a tendency could be observed, highlighting the necessity to study the sweeteners in different products.
Conclusions
The pitanga nectar samples prepared with sucralose, aspartame, and the 2:1 cyclamate/saccharin blend had sensory profiles similar to that of the sample prepared with sucrose. The attributes that further differentiated the samples were: sweetness, residual sweet taste, bitterness, and residual bitter taste. The sample prepared with neotame stood out for the attributes of sweetness and residual sweet taste, and samples prepared with stevias stood out for the attributes of bitterness and residual bitter taste.
Consumers' most accepted samples were prepared with sucrose, sucralose, aspartame, and neotame. The descriptor terms which showed negative influence on the acceptance test were: residual sweet taste, bitterness, residual bitter taste, astringency, acidity, and metallic flavor.
Footnotes
Acknowledgments
The authors acknowledge the generous cooperation of the participating tasters and assessors.
Declaration of conflicting interests
The author(s) declared no potential conflicts of interest with respect to the research, authorship, and/or publication of this article.
Funding
The author(s) disclosed receipt of the following financial support for the research, authorship, and/or publication of this article: the Conselho Nacional de Desenvolvimento Científico e Tecnológico—CNPq—Brazil.