
Abstract
An intermittent microwave convective drying method combined with a real-time computer vision technique was employed to detect the effect of drying parameters on color properties of apple slices. The experiments were performed at air temperature of 40 to 80℃, air velocities of 1–2 m/s, microwave powers of 200–600 W, and pulse ratios (PRs) of 2–6. Drying rate and drying time varied from 0.014 to 0.000001 min−1 and 27 to 244 min, respectively. The normalized lightness values had ascending and descending parabolic trends with decrease in product moisture content. With descending dimensionless moisture content, redness, yellowness, color change, hue angle, and chroma were enlarged. The normalized redness values changed from −4 to 3. Models relating drying parameters with drying time, drying rate, and lightness were obtained and found to be significant (P < 0.01). Results indicated that microwave power and PRs had more influence on lightness and color change than other parameters.
Keywords
Introduction
Apple is the fourth largest horticultural product grown worldwide (Forsline et al., 2003). Antioxidants are abundant in apples. One of the oldest methods of preserving food is drying (Ertekin and Yaldiz, 2004). The method of using hot air to dry food is the oldest and most extensively used drying method. The disadvantage of this technique is its high-energy consumption and resultant low product quality. Hence, finding a fast, safe, and controllable drying method is needed (Kavak Akpinar et al., 2005; Motevali et al., 2011). The application of microwave energy can be a good alternative to overcome the existing problems with conventional drying methods (Vadivambal and Jayas, 2007; Wang et al., 2004). However, the major drawback associated with microwave heating is the uneven temperature and moisture distribution, resulting in hot and cold spots in the heated product. One of the possible solutions to reduce non-uniformity is to employ microwave intermittently (Gunasekaran and Yang, 2007). On the other hand, if microwave power is not properly applied, a low-quality product is obtained. Wang et al. (2004) found that it is better to combine microwave drying with other drying methods, such as convective hot-air, vacuum, or freeze drying to achieve more uniform, fast, and effective drying without any loss of quality.
Intermittent microwave convective air drying (IMWC) has been successfully used for a limited number of agricultural products such as potato and carrot (Chua and Chou, 2005), sage leaves (Eştürk, 2012), red pepper (Soysal et al., 2009b), dill (Eştürk and Soysal, 2010), apple (Aghilinategh et al., 2015), and oregano (Soysal et al., 2009a). Color is the most important factor of dried food for quality evaluation and consumer acceptability (Bal et al., 2011) since changes may occur during drying which make the food taste unpleasant, and color can be an indicator of these undesirable changes. Traditionally, color was measured by quantitation of pigments, transmitted light, or a colorimeter. These methods were destructive and time-consuming (Fernandez et al., 2005). The application of computer vision systems (CVSs) to determine the color of dried food has been enhanced in recent years (Blasco et al., 2003; Fathi et al., 2011; Mohebbi et al., 2009; Zenoozian and Devahastin, 2009). CVSs have a number of advantages over traditional inspection methods; they can be used in an online set-up, they are more accurate, faster, and consistent than manual inspection, and they can be employed for measuring color and morphology (Fernandez et al., 2005). There are few studies reported about the online color monitoring of food during convective drying with a CVS (Hosseinpour et al., 2013; Martynenko, 2006; Nadian et al., 2015). On the other hand, due to the cumulative effects of microwaves, samples exposed to microwave drying reach a high temperature, and since color degradation is dependent on temperature, samples cannot be removed from the dryer to be photographed. The objective of this work is two-fold: first, a CVS to study online monitoring of color properties of apple slices including lightness (L*), greenness/redness (a*), blueness/yellowness (b*), color changes (ΔE), chroma (C), and hue angle (H°) during intermittent microwave convective drying (IMWC) is developed, and second, the influence of air temperature, air velocity, microwave power, and PR on color is modeled.
Materials and methods
Drying set-up
The convective air drying system used in this work is a modified version of that designed by Hosseinpour et al. (2011) in that a microwave device was added (Figure 1). A 2465 MHz domestic microwave oven (Samsung, OM75P; Samsung Electronics Inc., Suwon, South Korea) with a nominal power of 0–1100 W, and cavity dimensions of 300 (width) × 380 (depth) × 260 (height) mm was modified and developed. The microwave device consisted of a magnetron, a high voltage (H.V.) transformer, a diode, and a H.V. capacitor. The power supply was equipped with a time controller to apply integral cycle control (on/off). The power was either 100% or 0% of its rating during “on” and “off” duty cycles, respectively. On and off times were on the order of seconds. Also, a modified power controller (Autonics, SPC1-35-E, Busan, South Korea) was added to the control unit in order to control the power and the pulse ratio of the microwave. The programmable logic controller (PLC), MATLAB m. file, and human-machine interface (HMI) were modified based on intermittent convective microwave drying.
Experimental microwave hot air dryer: 1. fan, 2. preheating element, 3. heating elements, 4. straightener, 5. medium velocity sensor, 6. relative humidity and temperature sensors, 7. temperature sensor, 8. digital color camera, 9. microwave device, 10. platform, 11. load cell, 12. control unit, 13. outside temperature sensor, 14. HMI, 15. computer, 16. monitor, and 17. keyboard.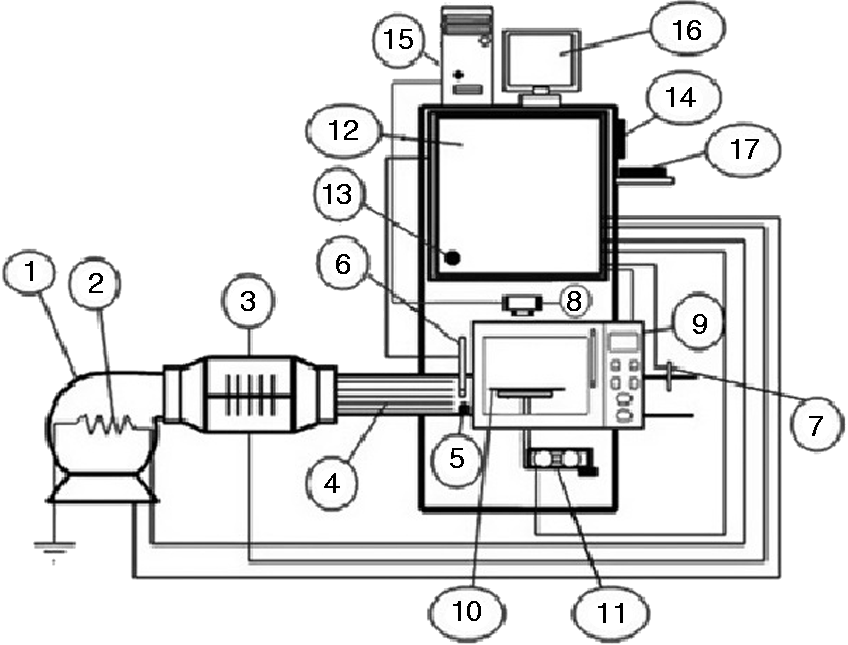
Drying procedure
Design matrix processed for the IMWC experiments
The experiments were stopped when the moisture content (X/X0) reached 0.1. The weight and top view image of the samples were recorded at 1 min intervals in order to estimate drying rate and color differences during drying.
Image analysis
According to Fernandez et al. (2005), image processing strongly depends on computer technology and the mathematical algorithms used to process the data, and it involves the several stages. These are briefly outlined in the following sections.
Image acquisition
The CVS was composed of a webcam, illumination chamber, computer hardware, and a program written in Matlab 2014a. Samples were illuminated using three 21 × 5050 SMD white light lamps. The lamps were positioned on the upper part of the drying tray and door of the microwave at an angle of 45° to the sample tray. The sample tray was made of glass and painted with black color. The webcam was located vertically over the tray at a distance of 40 cm. The angle between the camera lens and the lighting source axis was approximately 45°. The webcam was connected to the PC (Intel Pentium 4, 3.06 GHz, 512 MB RAM, 200 GB hard disk) via a USB interface. Images were captured at resolution of 2000 × 1600 pixels and were saved in the .JPG format.
Image segmentation
The goal of segmentation is to separate the object(s) of interest from the background and other objects not of interest (Da Fontoura Costa and Cesar Jr. 2010). The images were captured in the RGB channel (Figure 2a). The segmentation process followed these steps: (1) a median filter was applied to the images to remove the noise; (2) each color image was converted into a binary (0, 1) image per the threshold technique used by Otsu (1975); (3) small holes within the object of interest which caused noise were filled by applying a closing operator; (4) erosion and dilation were carried out by employing a disk with radius of 10 as the structural element; and (5) masking of the binary image with the original color image was performed (Gonzalez and Woods, 2002). All of segmentation processes were automatically performed using a written program in MATLAB 2014a software (Figure 2).
Segmentation processes: (a) original picture, (b) image in sRGB space, and (c) image in L*a*b*space.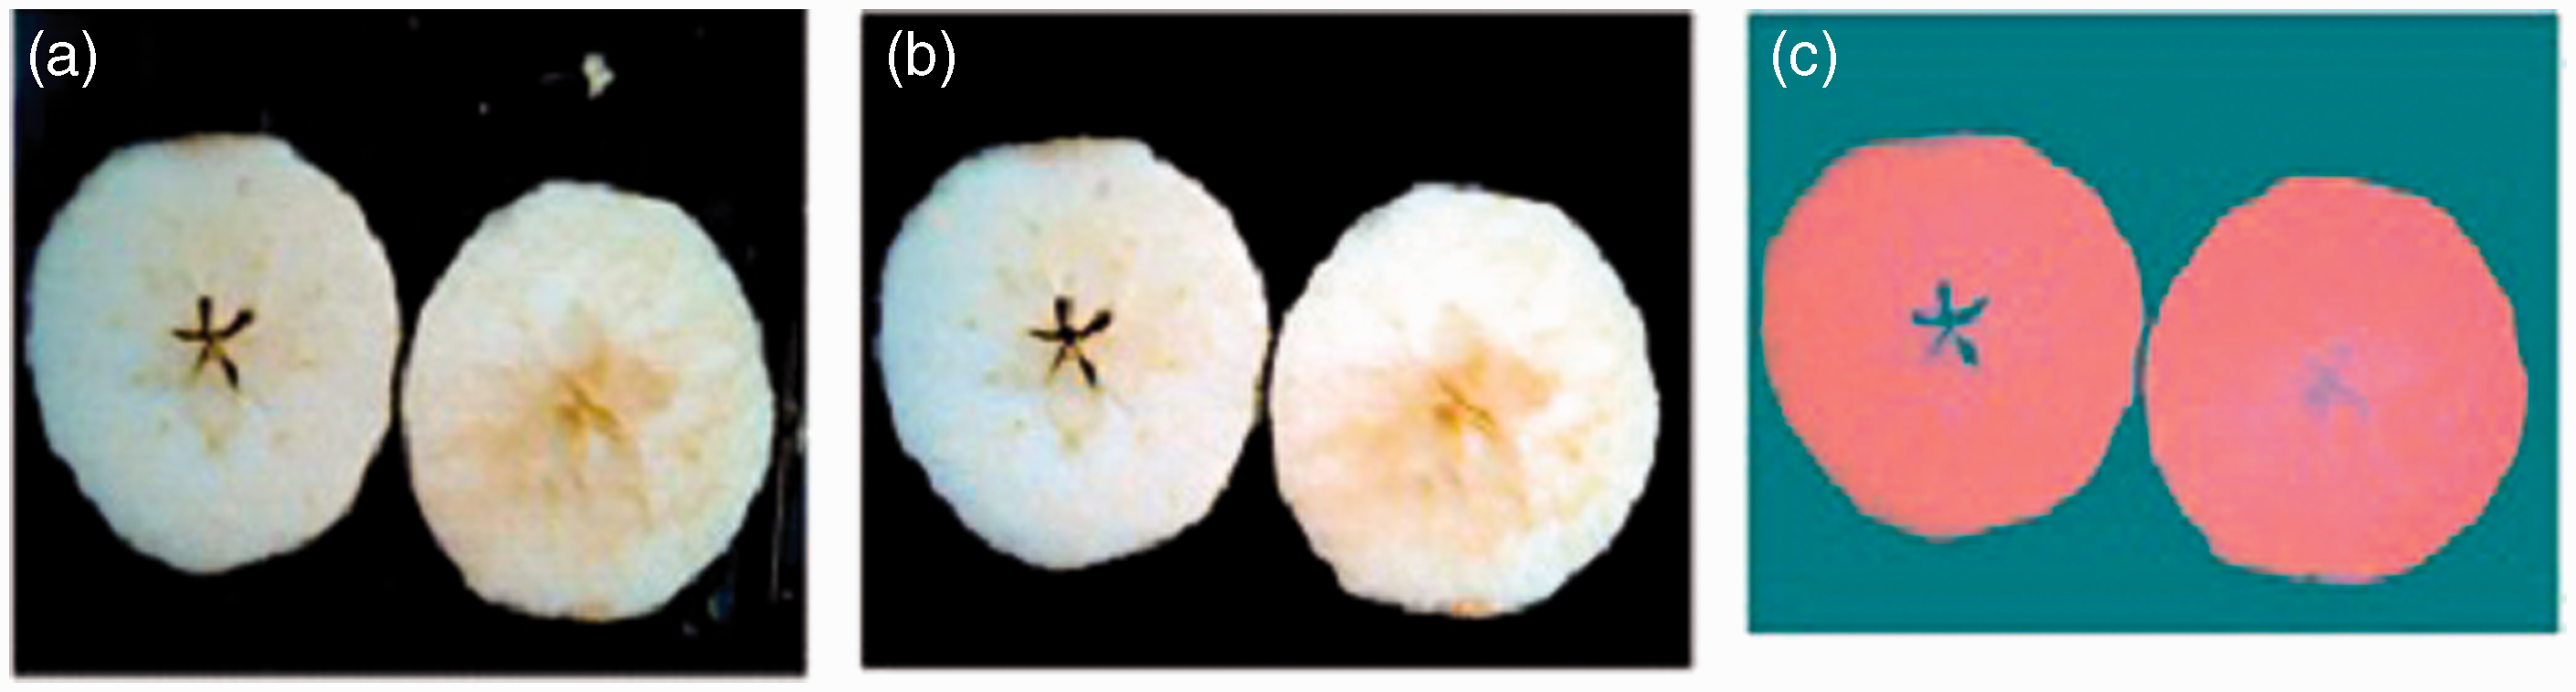
Transformation of image from RGB space into CIE L*a*b*
The color space coordinate values, L*a*b*, were proposed by Mendoza et al. (2006) as the best color space for quantification of color in food materials. The complete transformation from nonlinear RGB values to L*a*b* values were conducted in three steps:
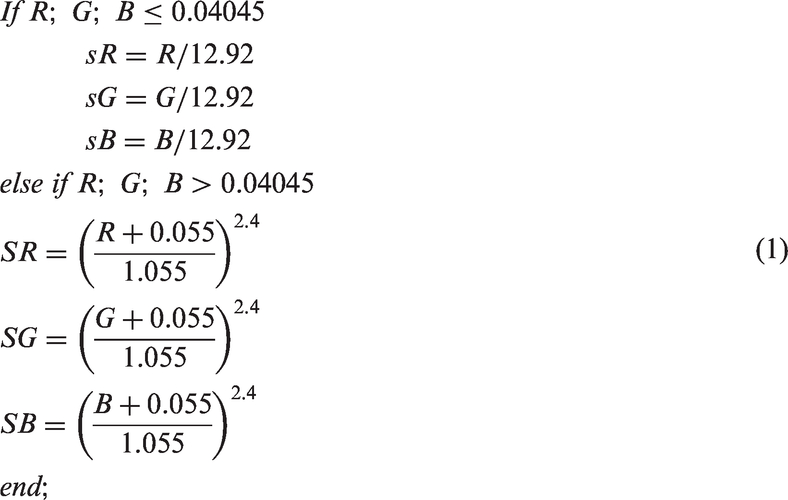
The nonlinear RGB values are transformed to linear sRGB values by the following commands
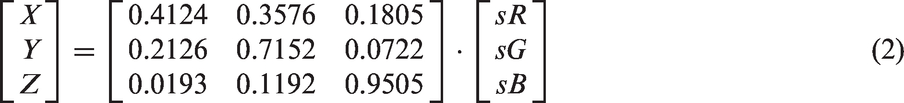
Then, using the recommended coefficients by the Rec. ITU-R BT. 709-5 (Itu 2002), sRGB values (Figure 2b) are mapped to the CIE XYZ system by
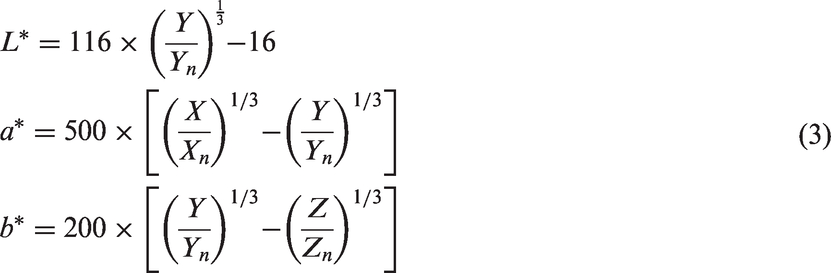
To convert standard XYZ values into CIE LAB (or CIE L*a*b*) color space (Colorimetry 1976), the ratios Y/Yn, X/Xn, and Z/Zn were computed, where Xn , Yn, and Zn (95.04; 100; 108.88) represent the X, Y, and Z values of the European Broadcasting Union with reference white at D65 illumination (Nobbs and Connolly, 2000). Since the three ratios were larger than 0.008856, a transformation was carried out (Figure 2c) using the following equations
Color feature extraction
The average values of L*, a*, and b* were computed for all pixels in images at every time. To increase the uniformity between different images, the L*, a*, and b* values were normalized by computing the ratio of the current values to the corresponding primary values (Niamnuy et al., 2008). L*, a*, and b* are Cartesian coordinates that can be used to calculate the polar coordinates L*H*C. H* (hue angle) which are used to distinguish color in food and chroma (C) which shows the degree of color saturation and is proportional to the intensity of the color, as defined by equations (4) and (5). Finally, the color change (ΔE) was considered as the feature for the whole color change evaluation, between the dried and the fresh sample (equation (6)) (Guiné and Barroca, 2012)


Statistical analysis
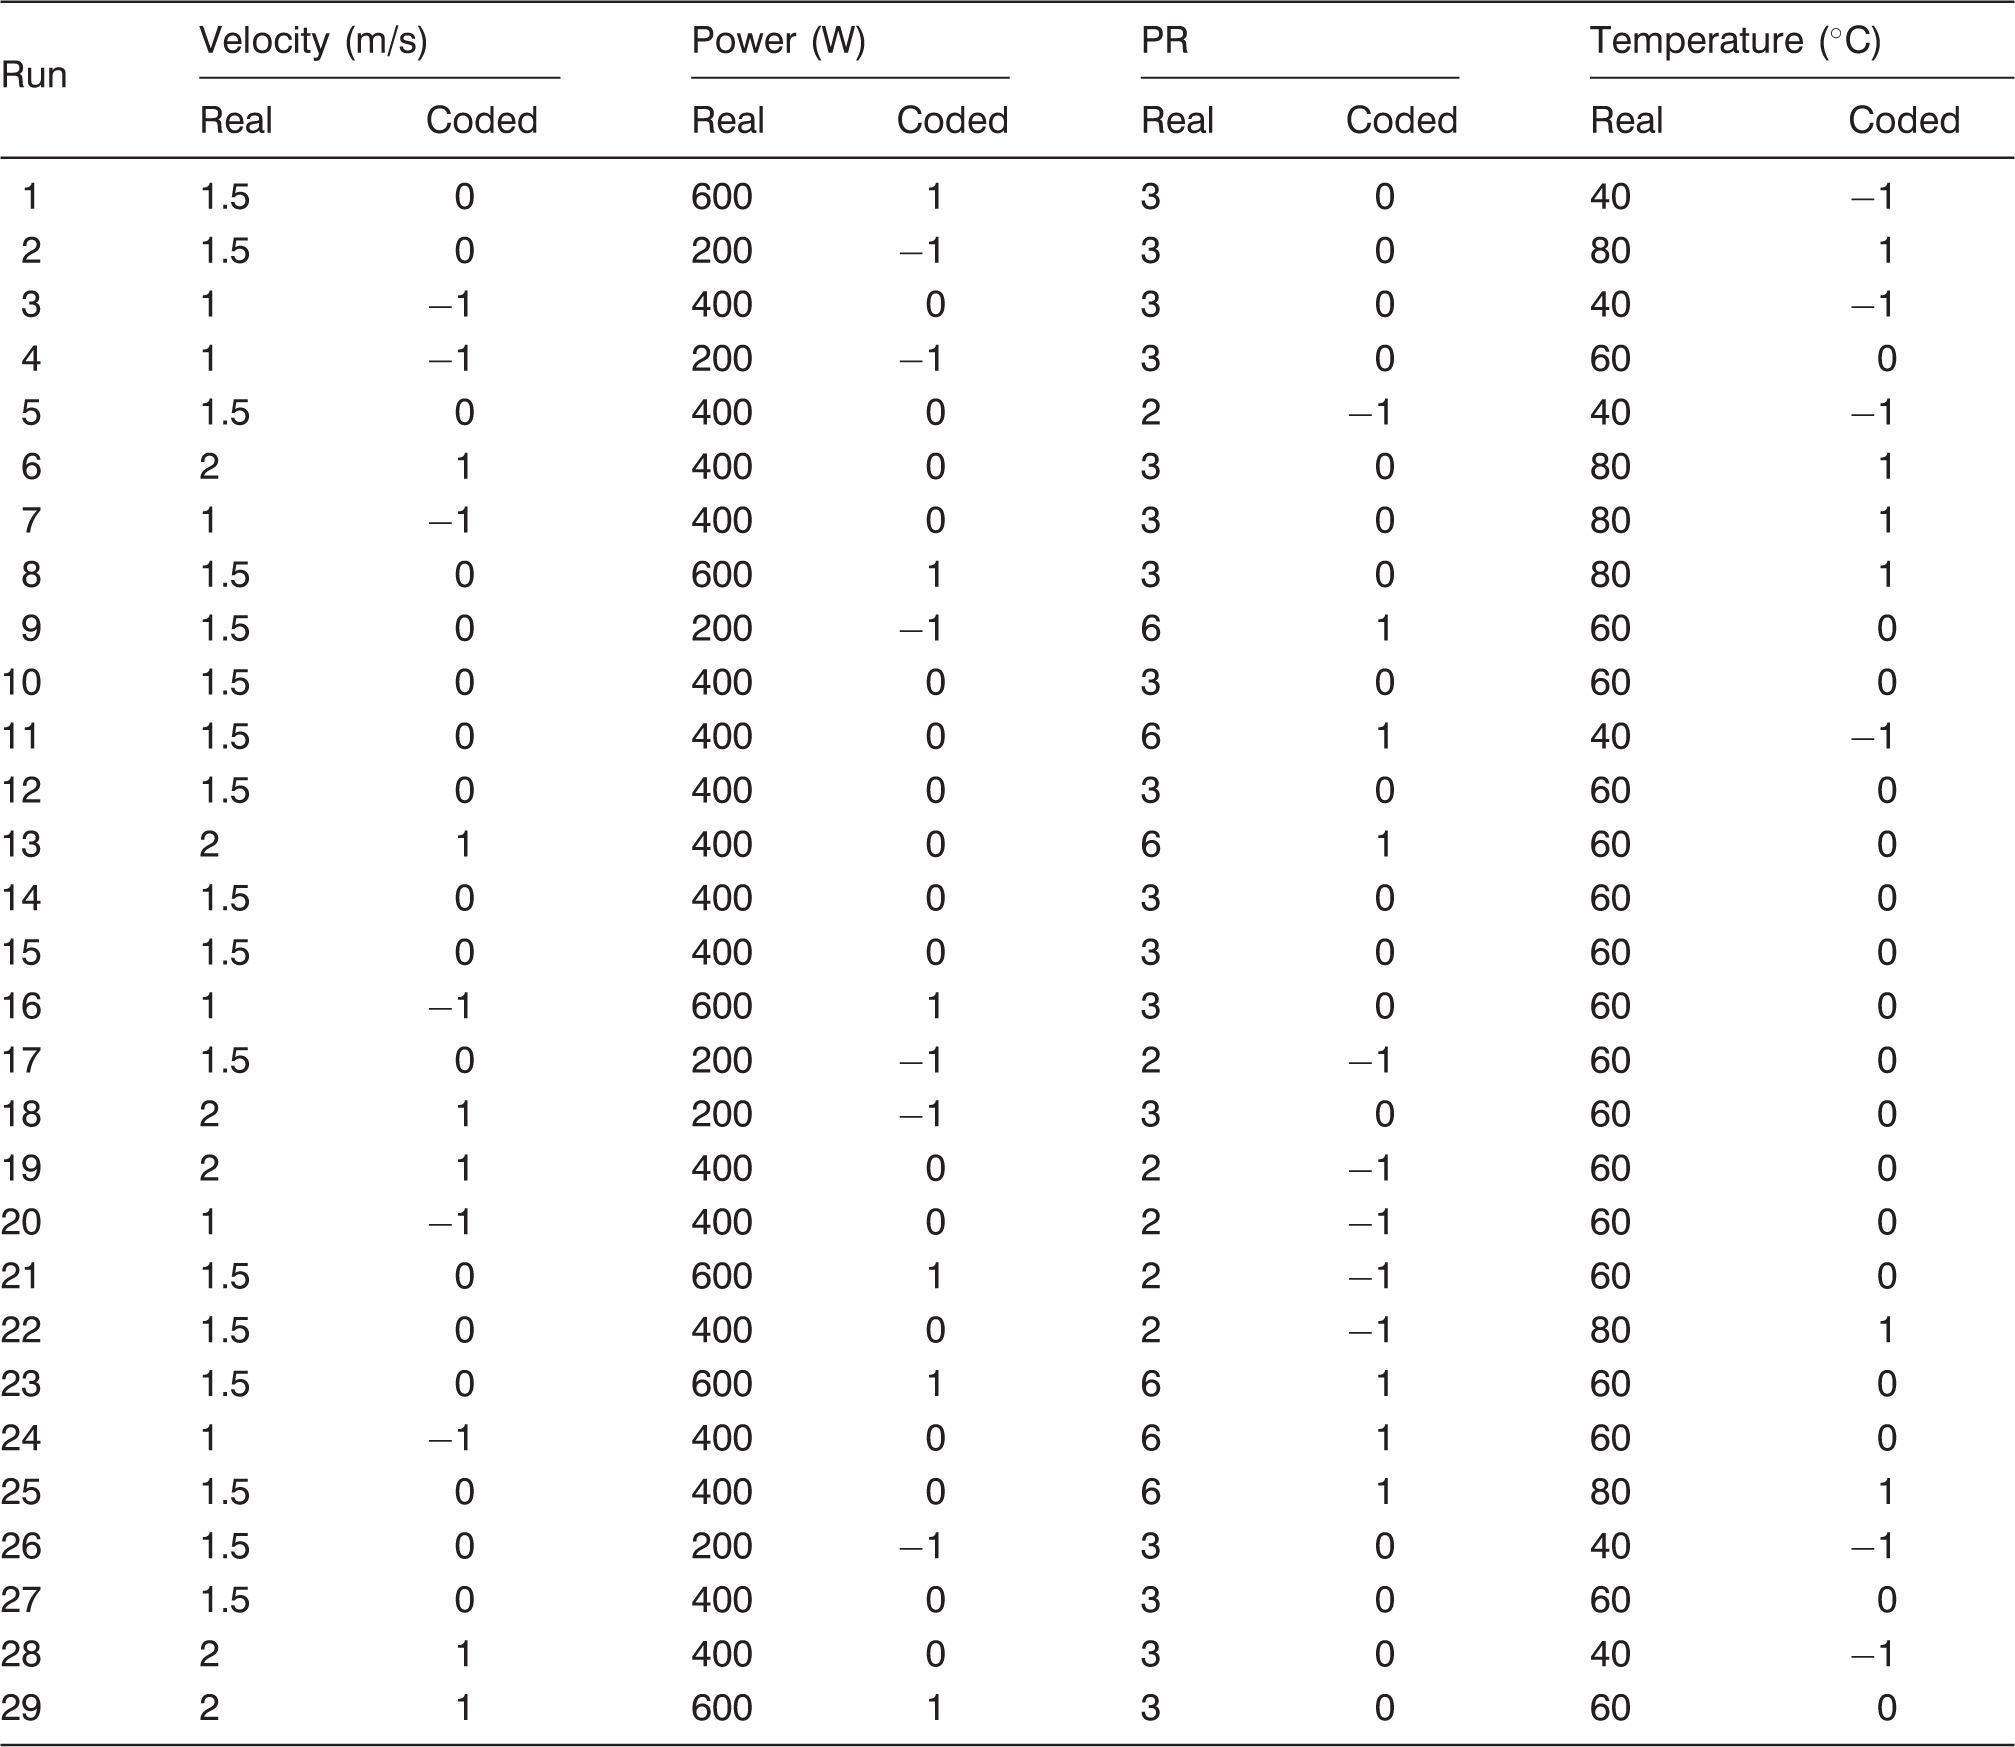
Response Surface Methodology (RSM) was used to investigate the effects of the process variables, i.e. microwave power, temperature, PR, and velocity, on the color features during the drying of apple slices by applying Design-Expert Software 8.0.7.1. A power law transformation was performed on the data. To determine the best model, i.e. that which is able to predict the responses of data for each color property, the residual error between the experimental and the predicted responses must be minimized. Furthermore, the capability of the model is explored by the inspection of residuals employing the normal probability plots of the residuals and the plots of the residuals versus the predicted responses. The experimental data were fitted into the proposed models or a reduced form (stepwise model) in order to improve the accuracy of models. A Box-Behnken design was applied to perform the tests. Three levels of each variable were chosen for the trials, including the central point and two axial points.
Results and discussion
Drying kinetics
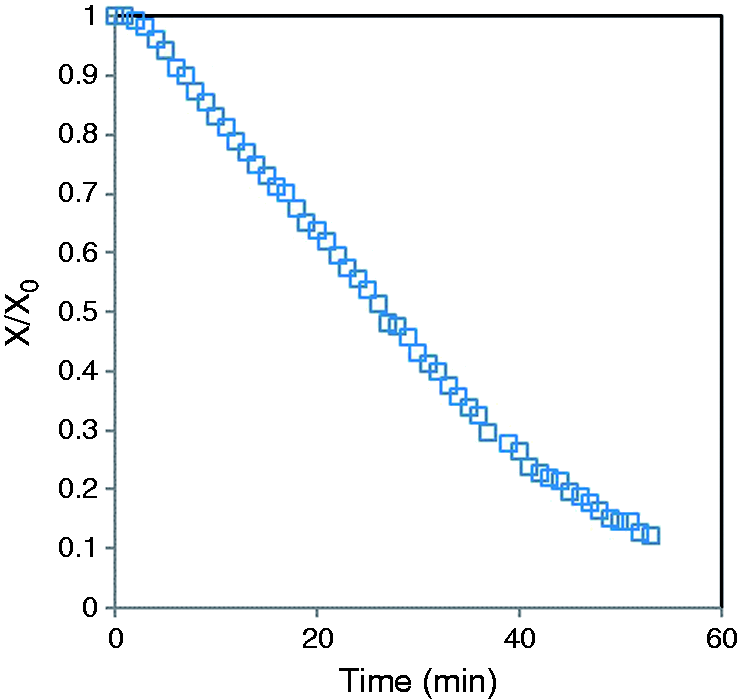
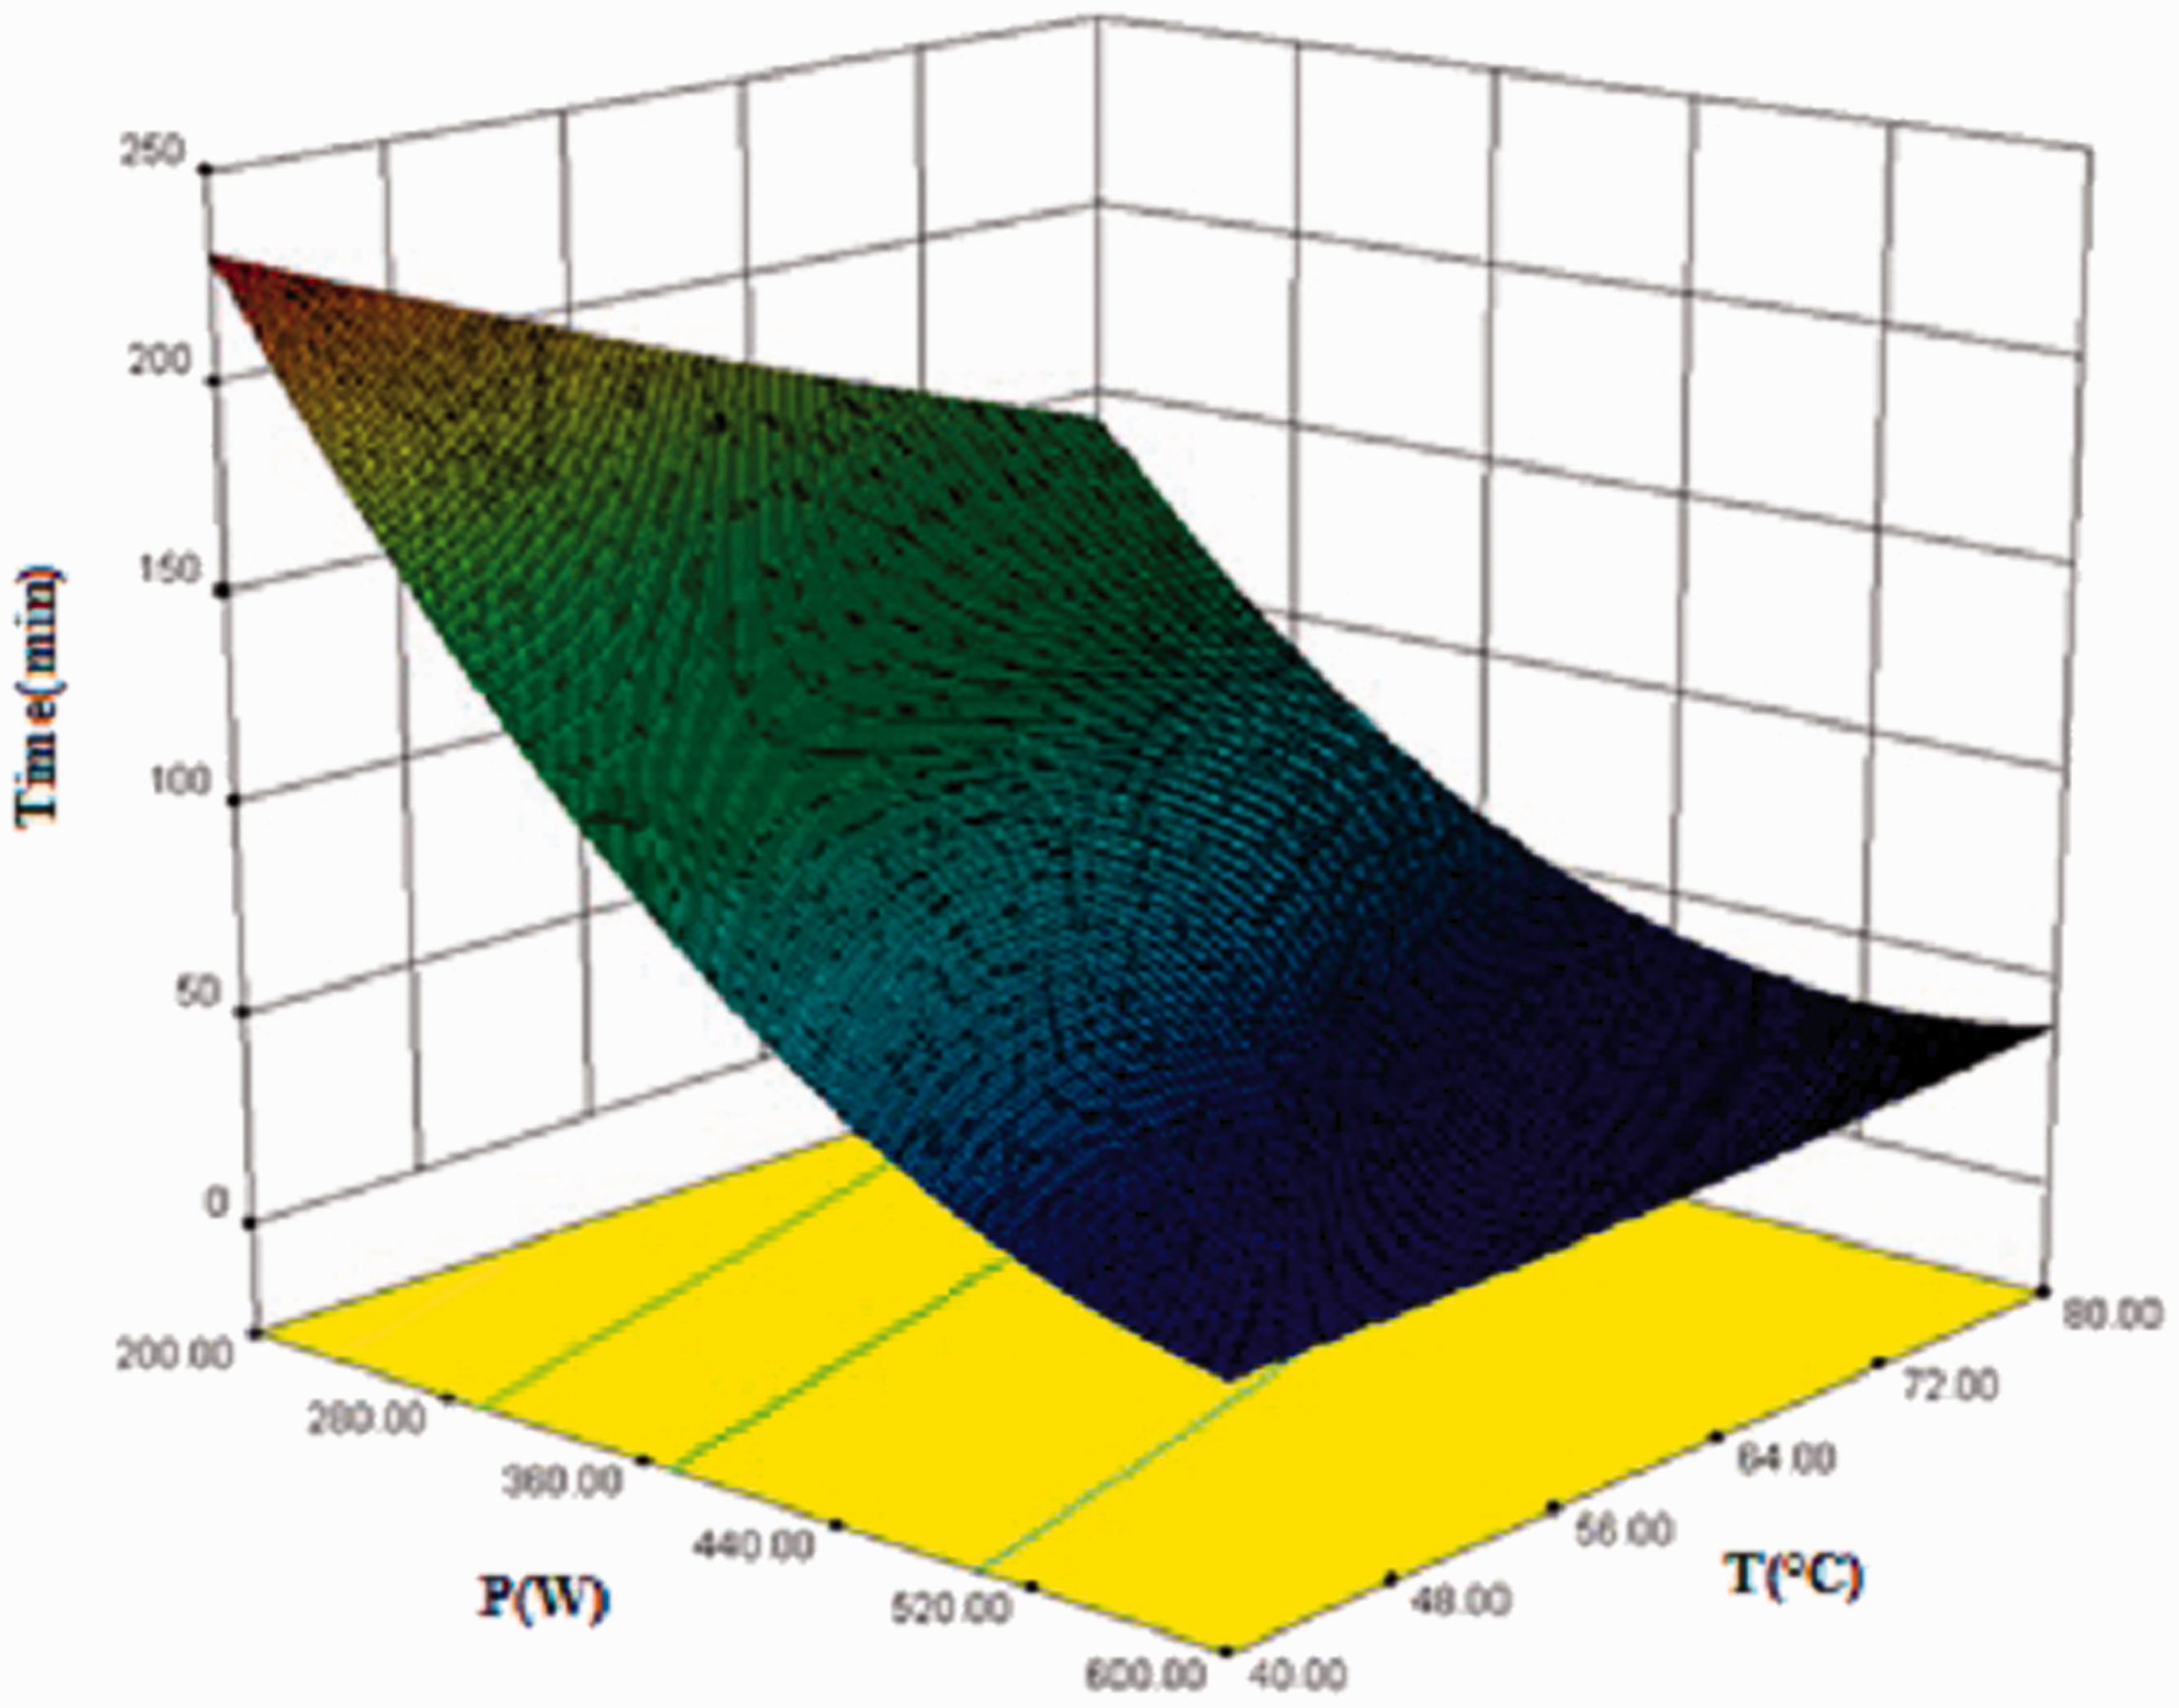
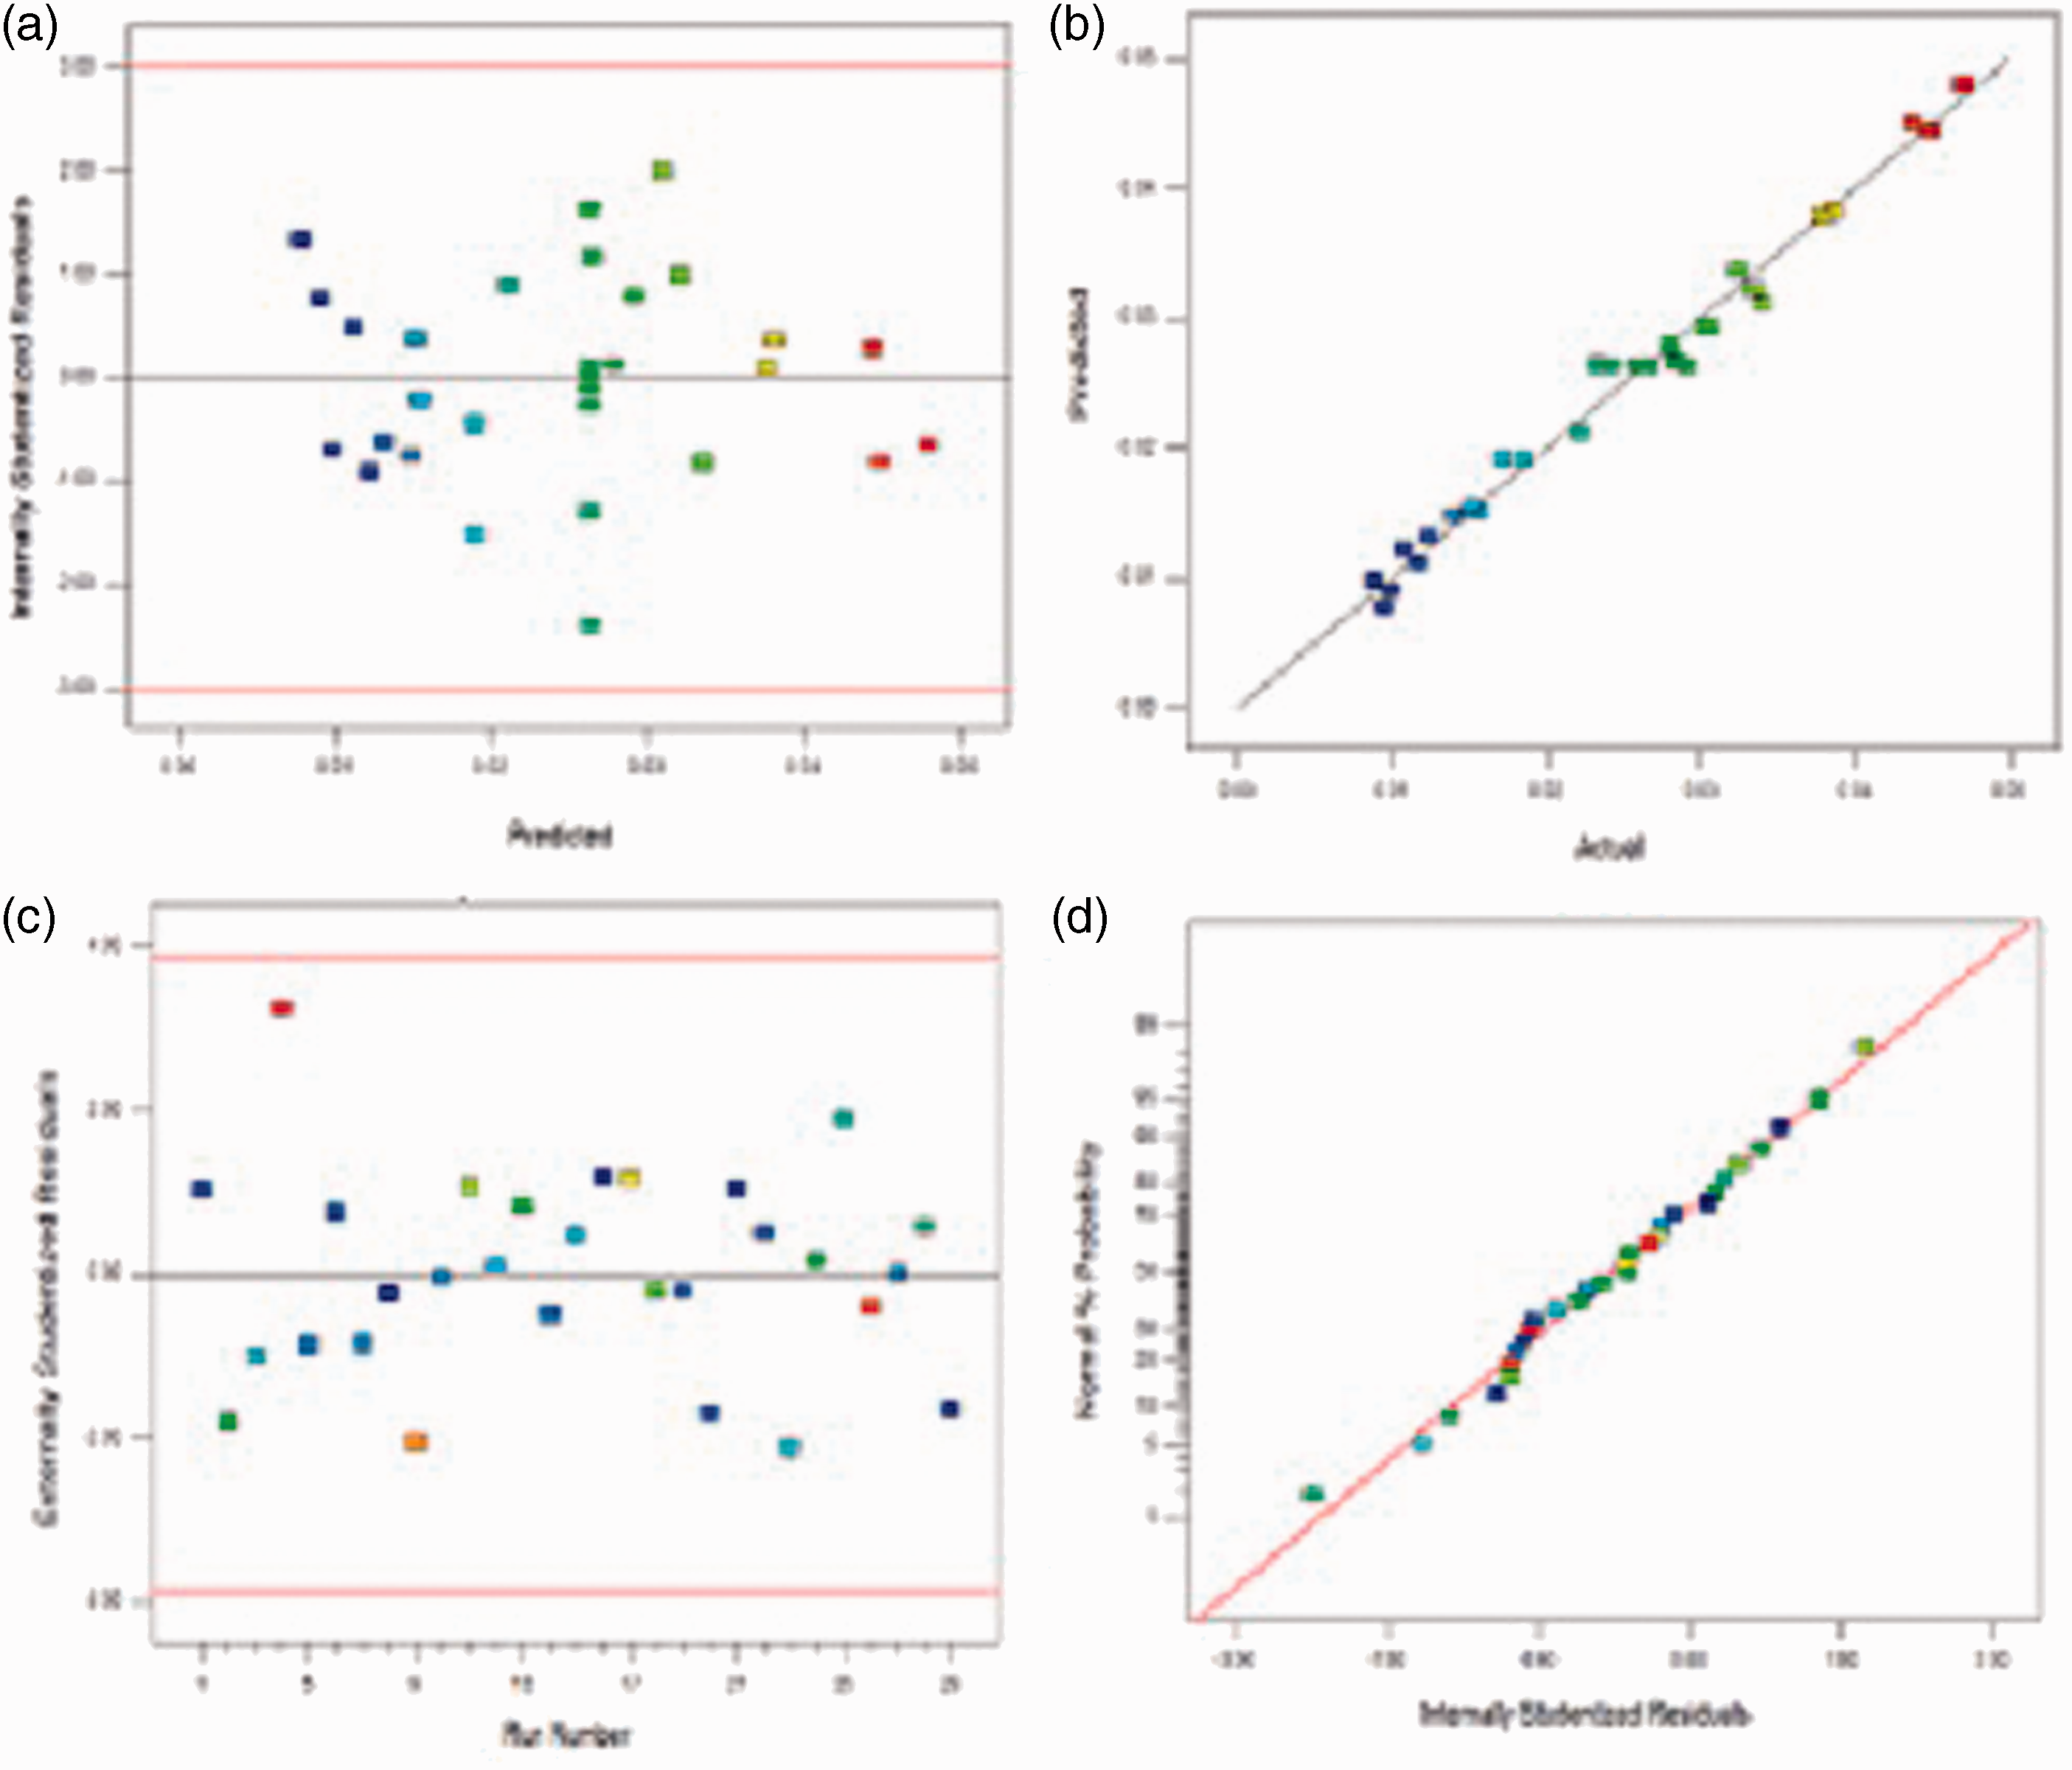
An example of the drying curves of the dried apple slices is shown in Figure 3. The dimensionless moisture content (X/X0) of the samples was continuously decreased by time increments. Microwave power, temperature, PR, and PR-microwave power interaction influenced the drying time values significantly (P < 0.05). The drying time lowered considerably with the upsurge in microwave power (Figure 4). At low power, with increasing of temperature, time diminished considerably. Statistical analysis of the experimental data yielded a model with an R2 of 0.97 for predicting time consumption, which is considered to be significant (P < 0.01) (equation (7)). Plots are shown in Figure 5 which indicates that the model provides the hypothesis of the analysis of variance (ANOVA) well.
Drying curve for apple slices dried with P: 400 W, PR: 2, velocity: 1 m/s, and T: 60℃. The interaction of temperature and microwave power on drying time. Statistics plots: (a) internally studentized residual residuals vs. predicted, (b) externally studentized residual (outlier t, R-Student), (c) actual vs. predicted, and (d) normal probability.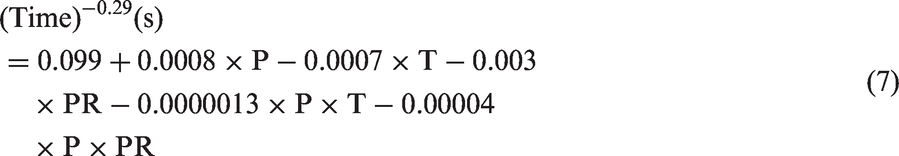
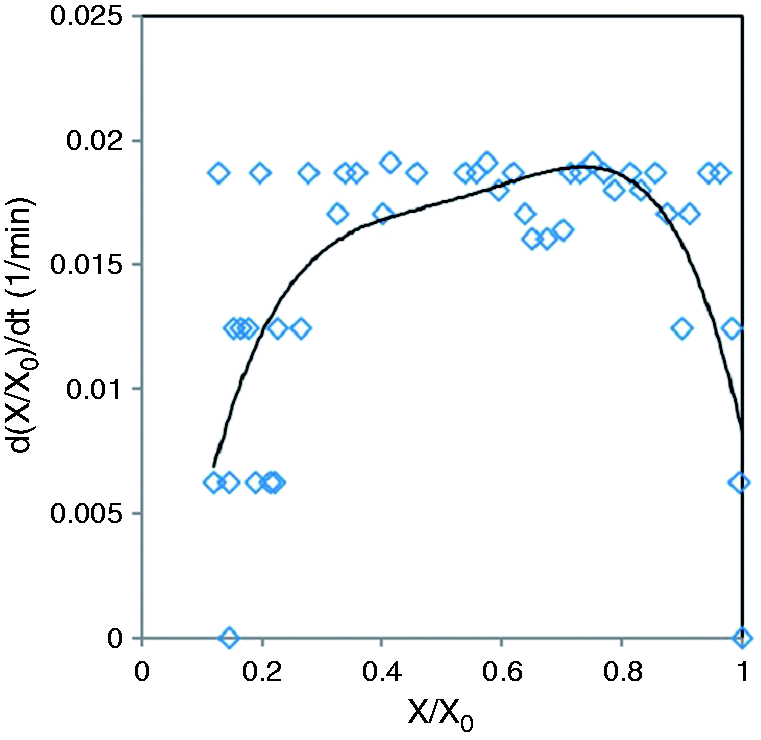
A trend which was upward, constant, and downward is seen in the plot of drying rate (DR) (Figure 6.). At the beginning of drying, high microwave energy was absorbed by the samples due to its high number of dipole molecules, and then the absorbed microwave energy was conversed to thermal energy and thus the drying rate increased (McLoughlin et al., 2003). Due to mass transfer by capillary forces, a constant drying rate was observed (Perré and May, 2007). The constant drying rate period increased with increase of PR, because the power off time supplies redistribution of temperature and moisture in the samples (Beaudry et al., 2003). The downward drying rate trend, created by reduction in moisture content resulting in low microwave energy, was absorbed by the sample (Feng et al., 2002). Similar drying curves were reported for intermittent microwave-convective air drying of red pepper (Soysal et al., 2009b), sage leaves (Eştürk, 2012), oregano (Soysal et al., 2009a), and dill (Eştürk and Soysal, 2010). A significant model (P < 0.01) can explain the relationship between drying rate and drying parameters with a regression coefficient 0.97 (equation (8)).
Drying rate curve for apple slices dried with P: 400 W, PR: 2, velocity: 1 m/s, and T: 60℃.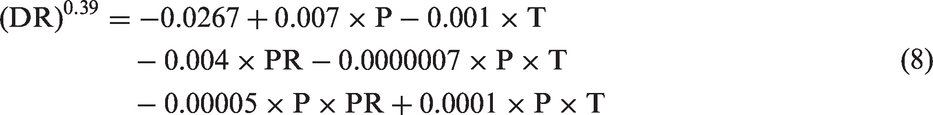
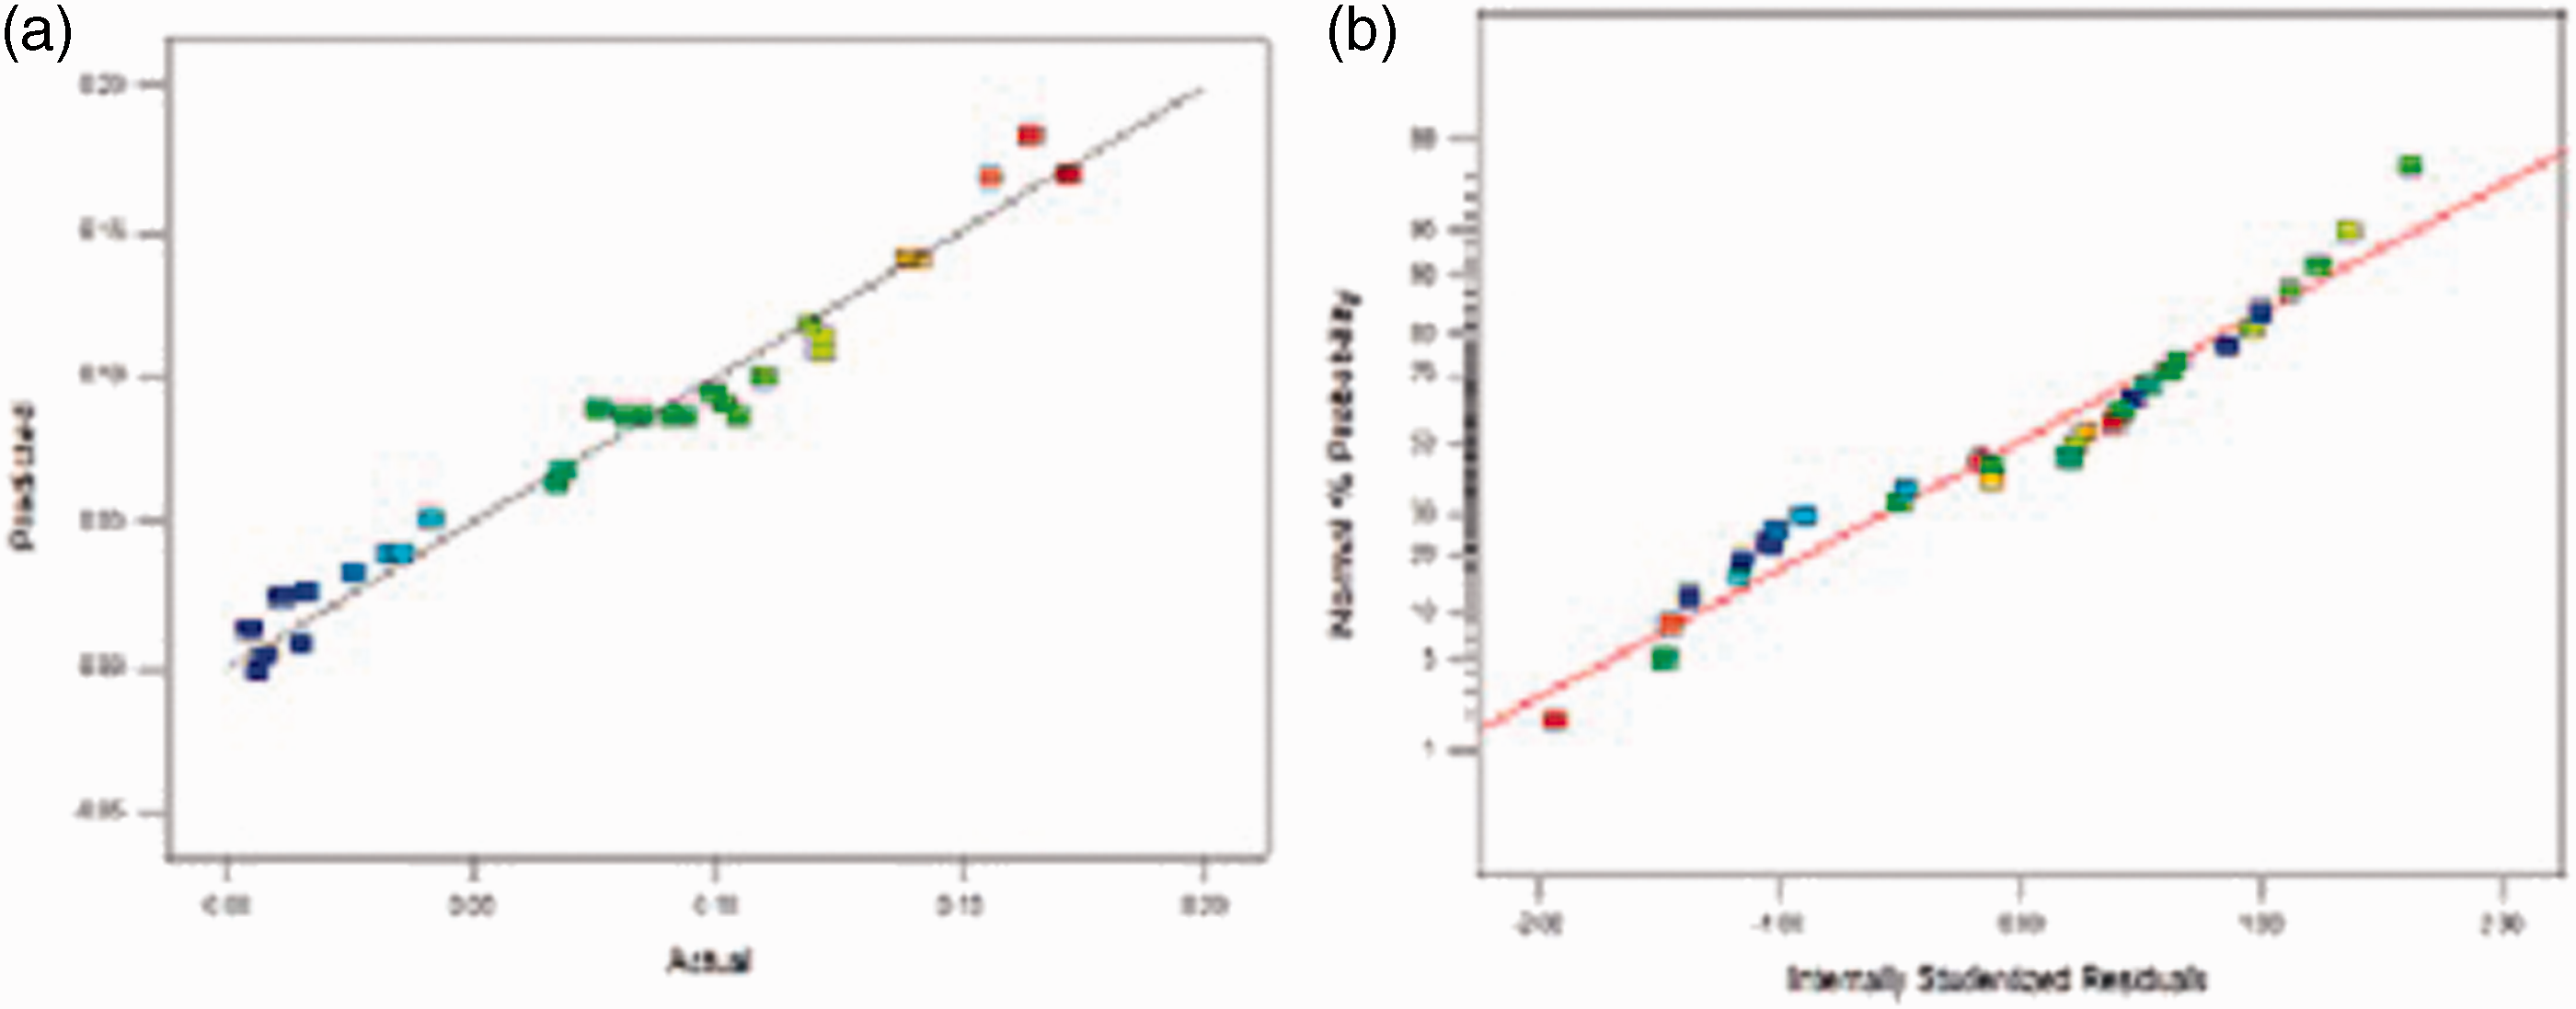
Microwave power, PR, temperature, and interaction of microwave power–PR had crucial effects on the drying rate. There was a good correlation between increased drying rate and power density (Figure 7). At high power, with increase of PR, drying rate diminished considerably. Also, Figure 8 confirms the suitability of the presented model for drying rate prediction.
The interaction of PR and microwave power on drying rate. Statistics plots: (a) actual vs. predicted and (b) normal probability.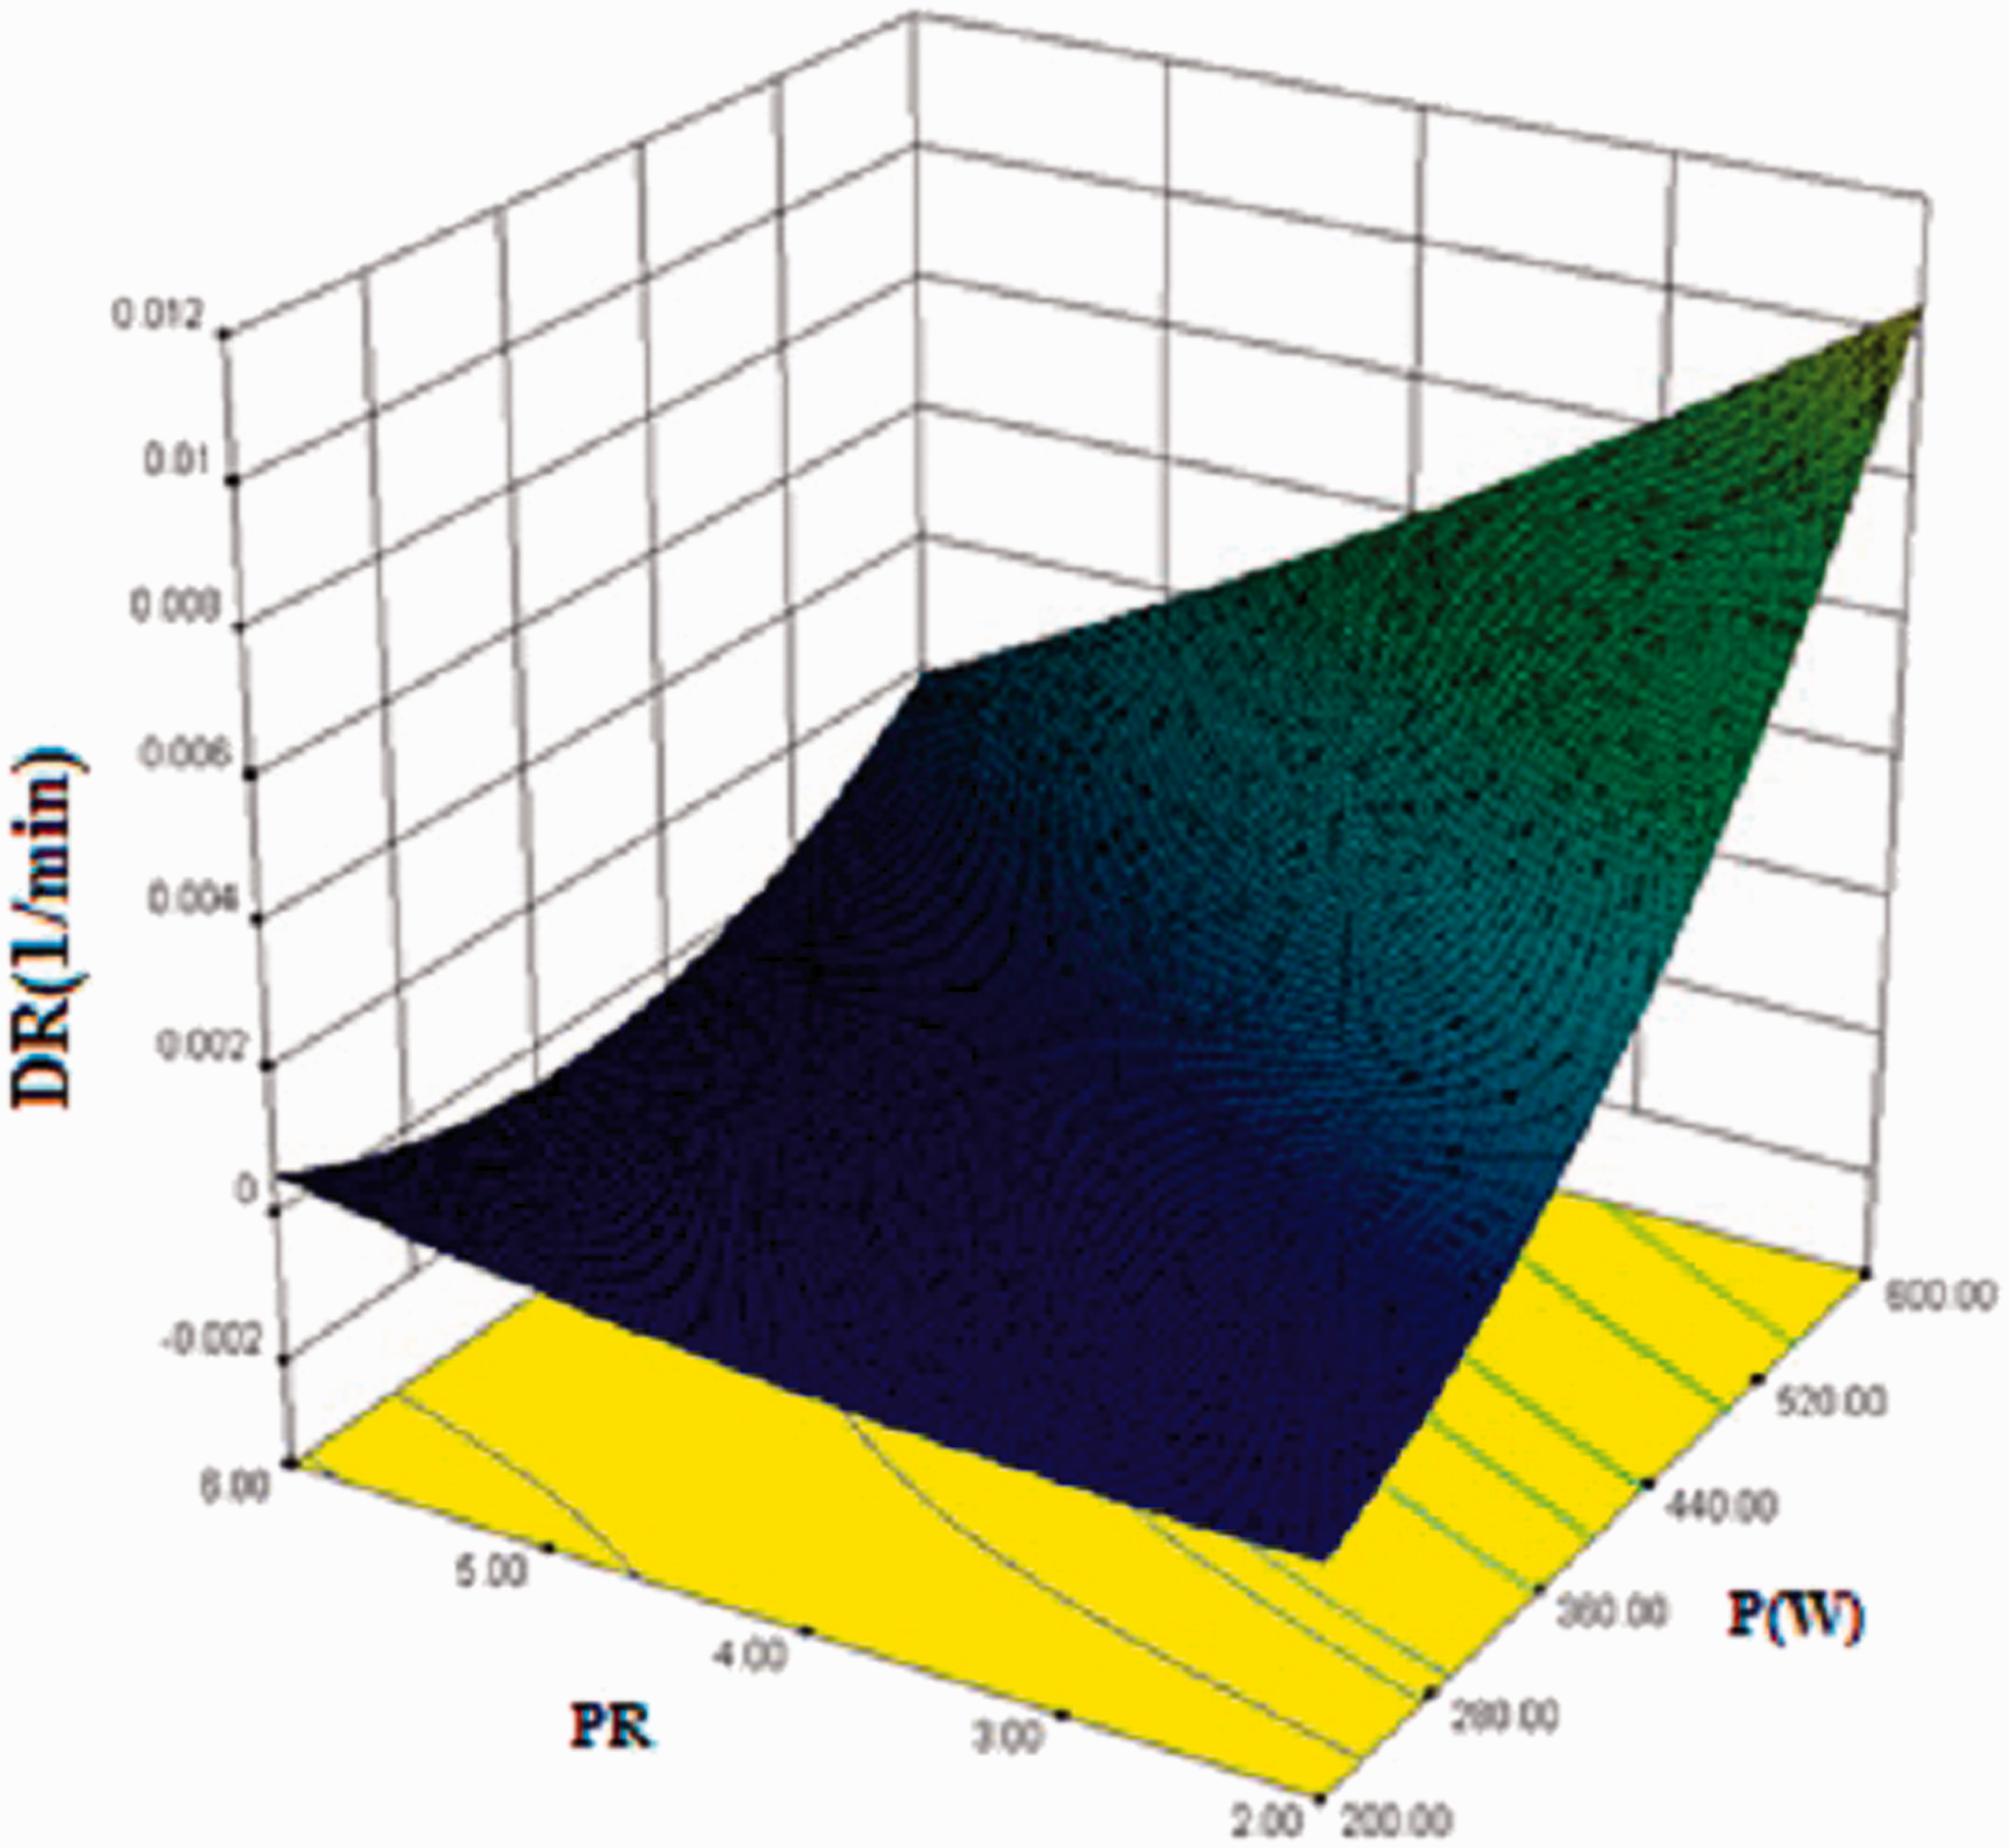
Normalized Lightness (L*/L*0)
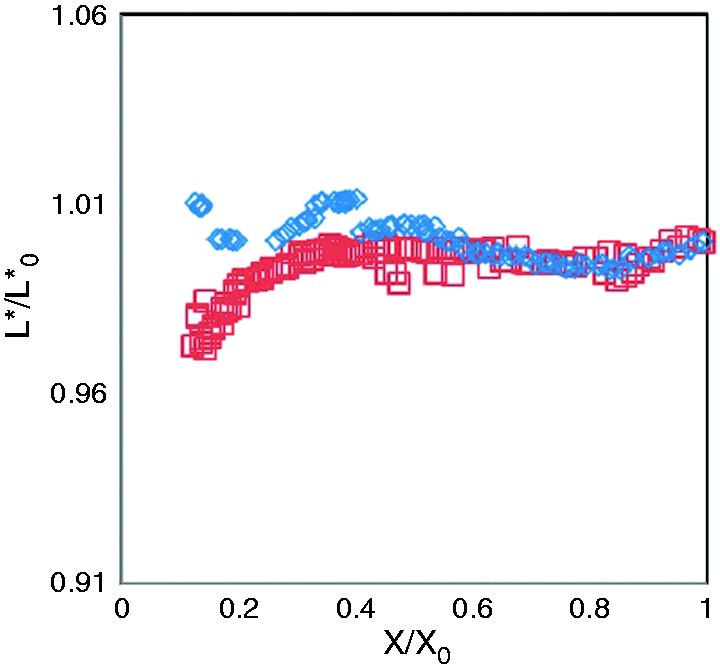
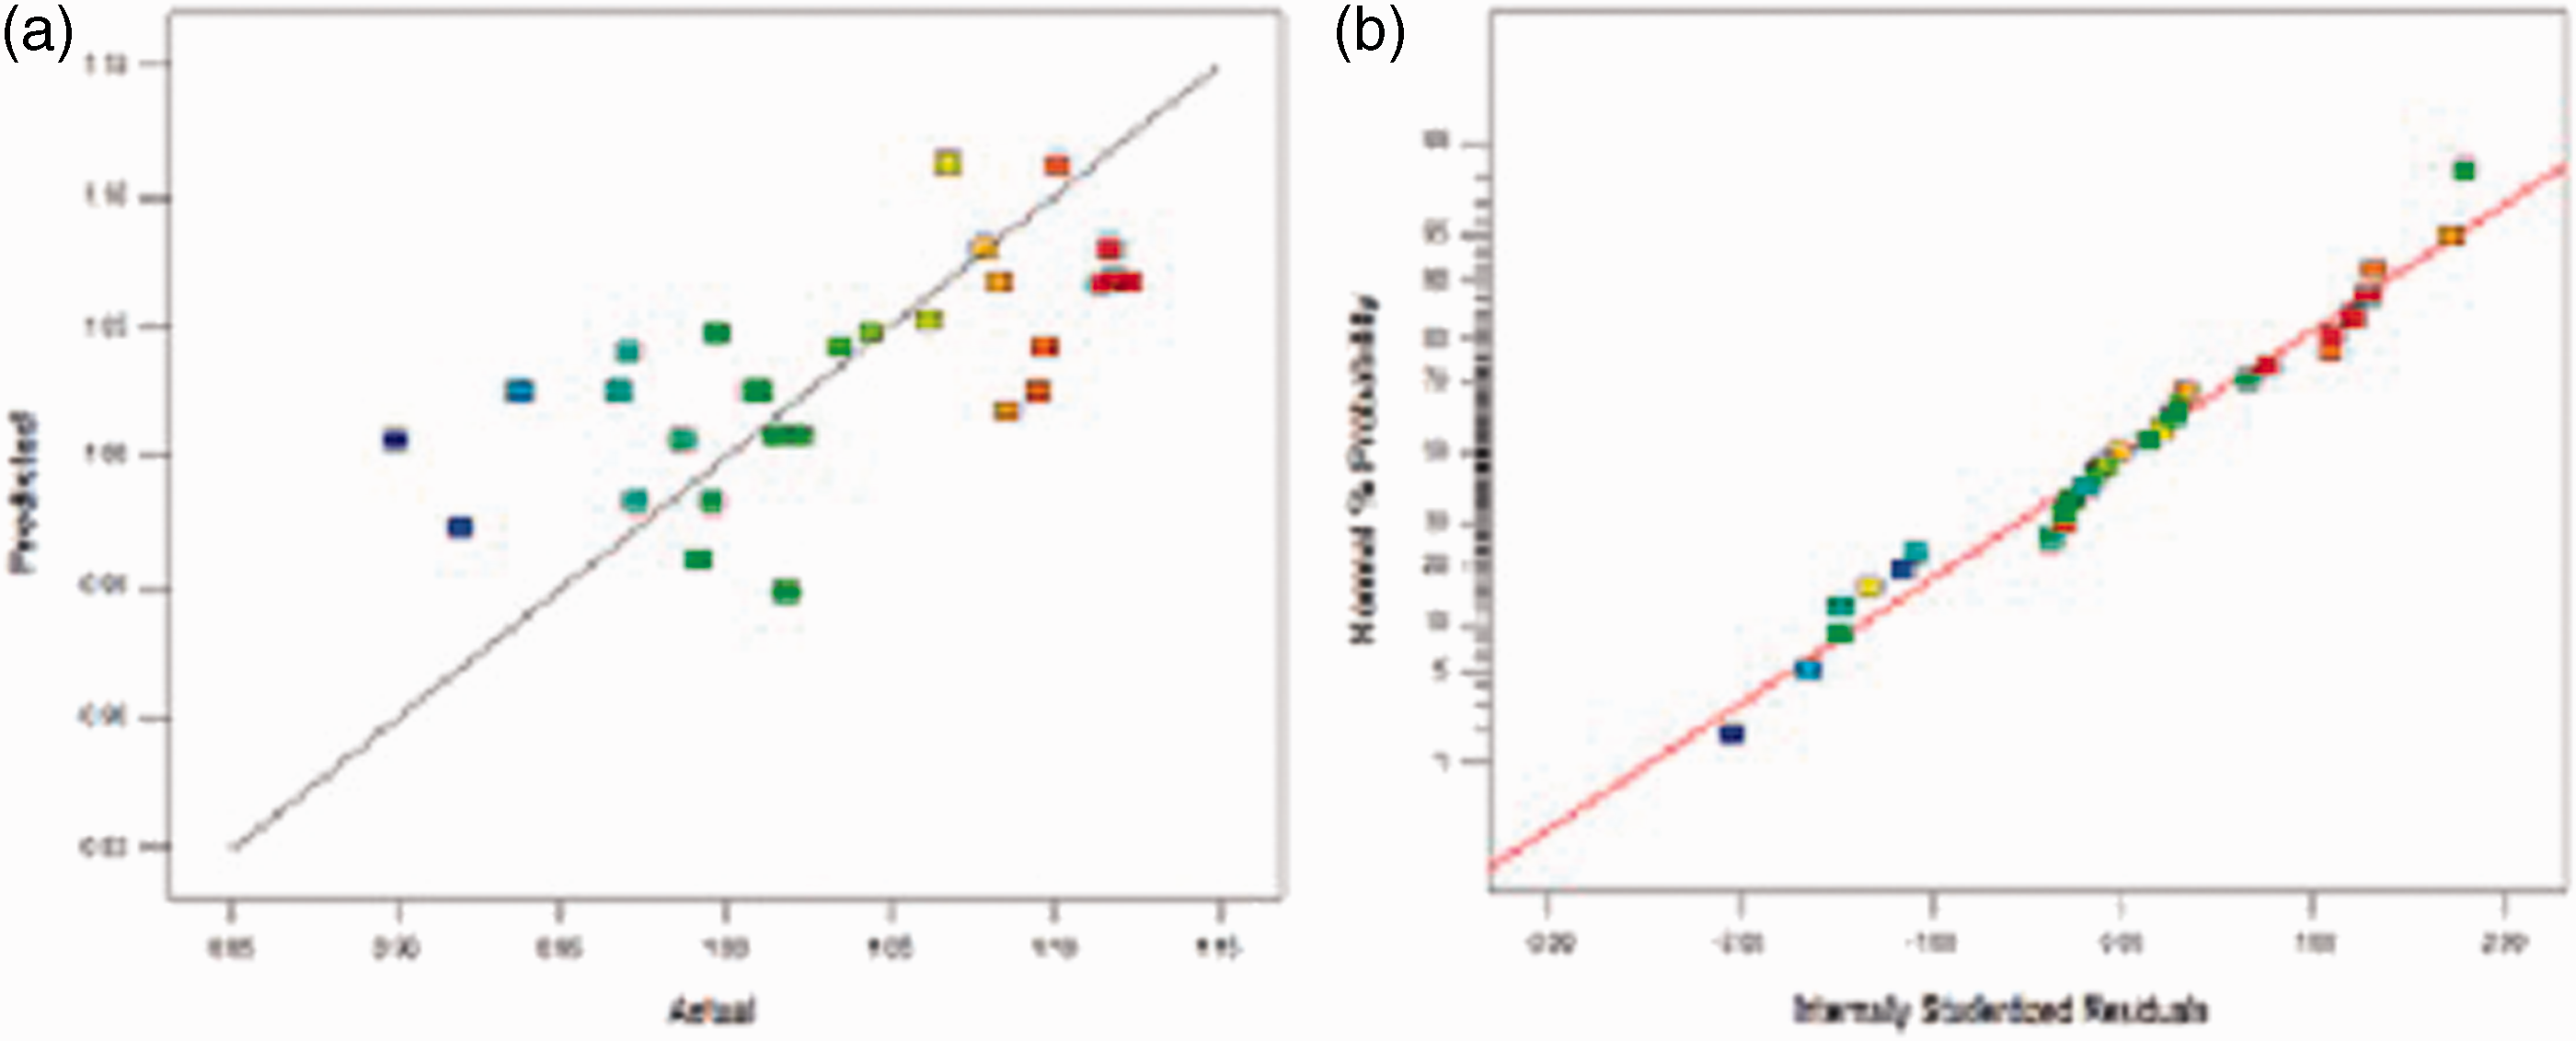
Typical L*/L0* curves of dried apple slices are shown in Figure 9. It is clear from Figure 9 that the normalized lightness values had an ascending (A) and descending (B) parabolic trend with product moisture content. An ascending trend was observed in treatments with a power range of 200–400 W and a temperature range f40–60℃, while in treatments with a high power (400–600 W) and high temperature (60–80℃), a descending trend was observed. In the initial stage of the drying process at the two set treatments, due to the non-enzymatic browning reactions, the color of the samples became darker by rapid evaporation of intracellular free water down to a moisture ratio of 0.8 (Niamnuy et al., 2007). In addition, the sample lightness increased dramatically after the samples reached the moisture ratio of 0.8 toward to the end of drying process in (A). It could be attributed to a decrease in the formation of brown pigment (Baini and Langrish, 2009) and a termination in the non-enzymatic browning due to low moisture content of samples during the falling rate period. Furthermore, the product lightness dramatically decreased after reaching the moisture ratio of 0.8 toward to the end of drying process in (B). Since non-enzymatic browning is not independent of temperature, it is expected that the dried samples with the high power and air temperature showed a greater non-enzymatic browning. This result was in agreement with Steed et al. (2008) for sweet potato and De Ancos et al. (1999) for papaya puree, but in contrast with the results of De Ancos et al. (1999) for strawberry and kiwi. PR and microwave power influenced the L*/L0* values significantly (P < 0.05), but temperature and air velocity had no effect (P > 0.05) on the L*/L0* values of apple slices. With increasing microwave power and PR, normalized lightness reduced due to increasing non-enzymatic browning and drying time, respectively. In other words, incremental drying time provided a sufficient time for the creation of the Maillard reaction products (Nadian et al., 2015). Statistical analysis of the experimental data yielded a model with R2 = 0.86, which is considered to be significant (P < 0.01), for predicting lightness according to microwave power, temperature, and PR (equation (9)) (Figure 10)
Typical lightness curve for apple slices. Statistics plots: (a) actual vs. predicted and (b) normal probability.
Normalized redness (a*/a*0)
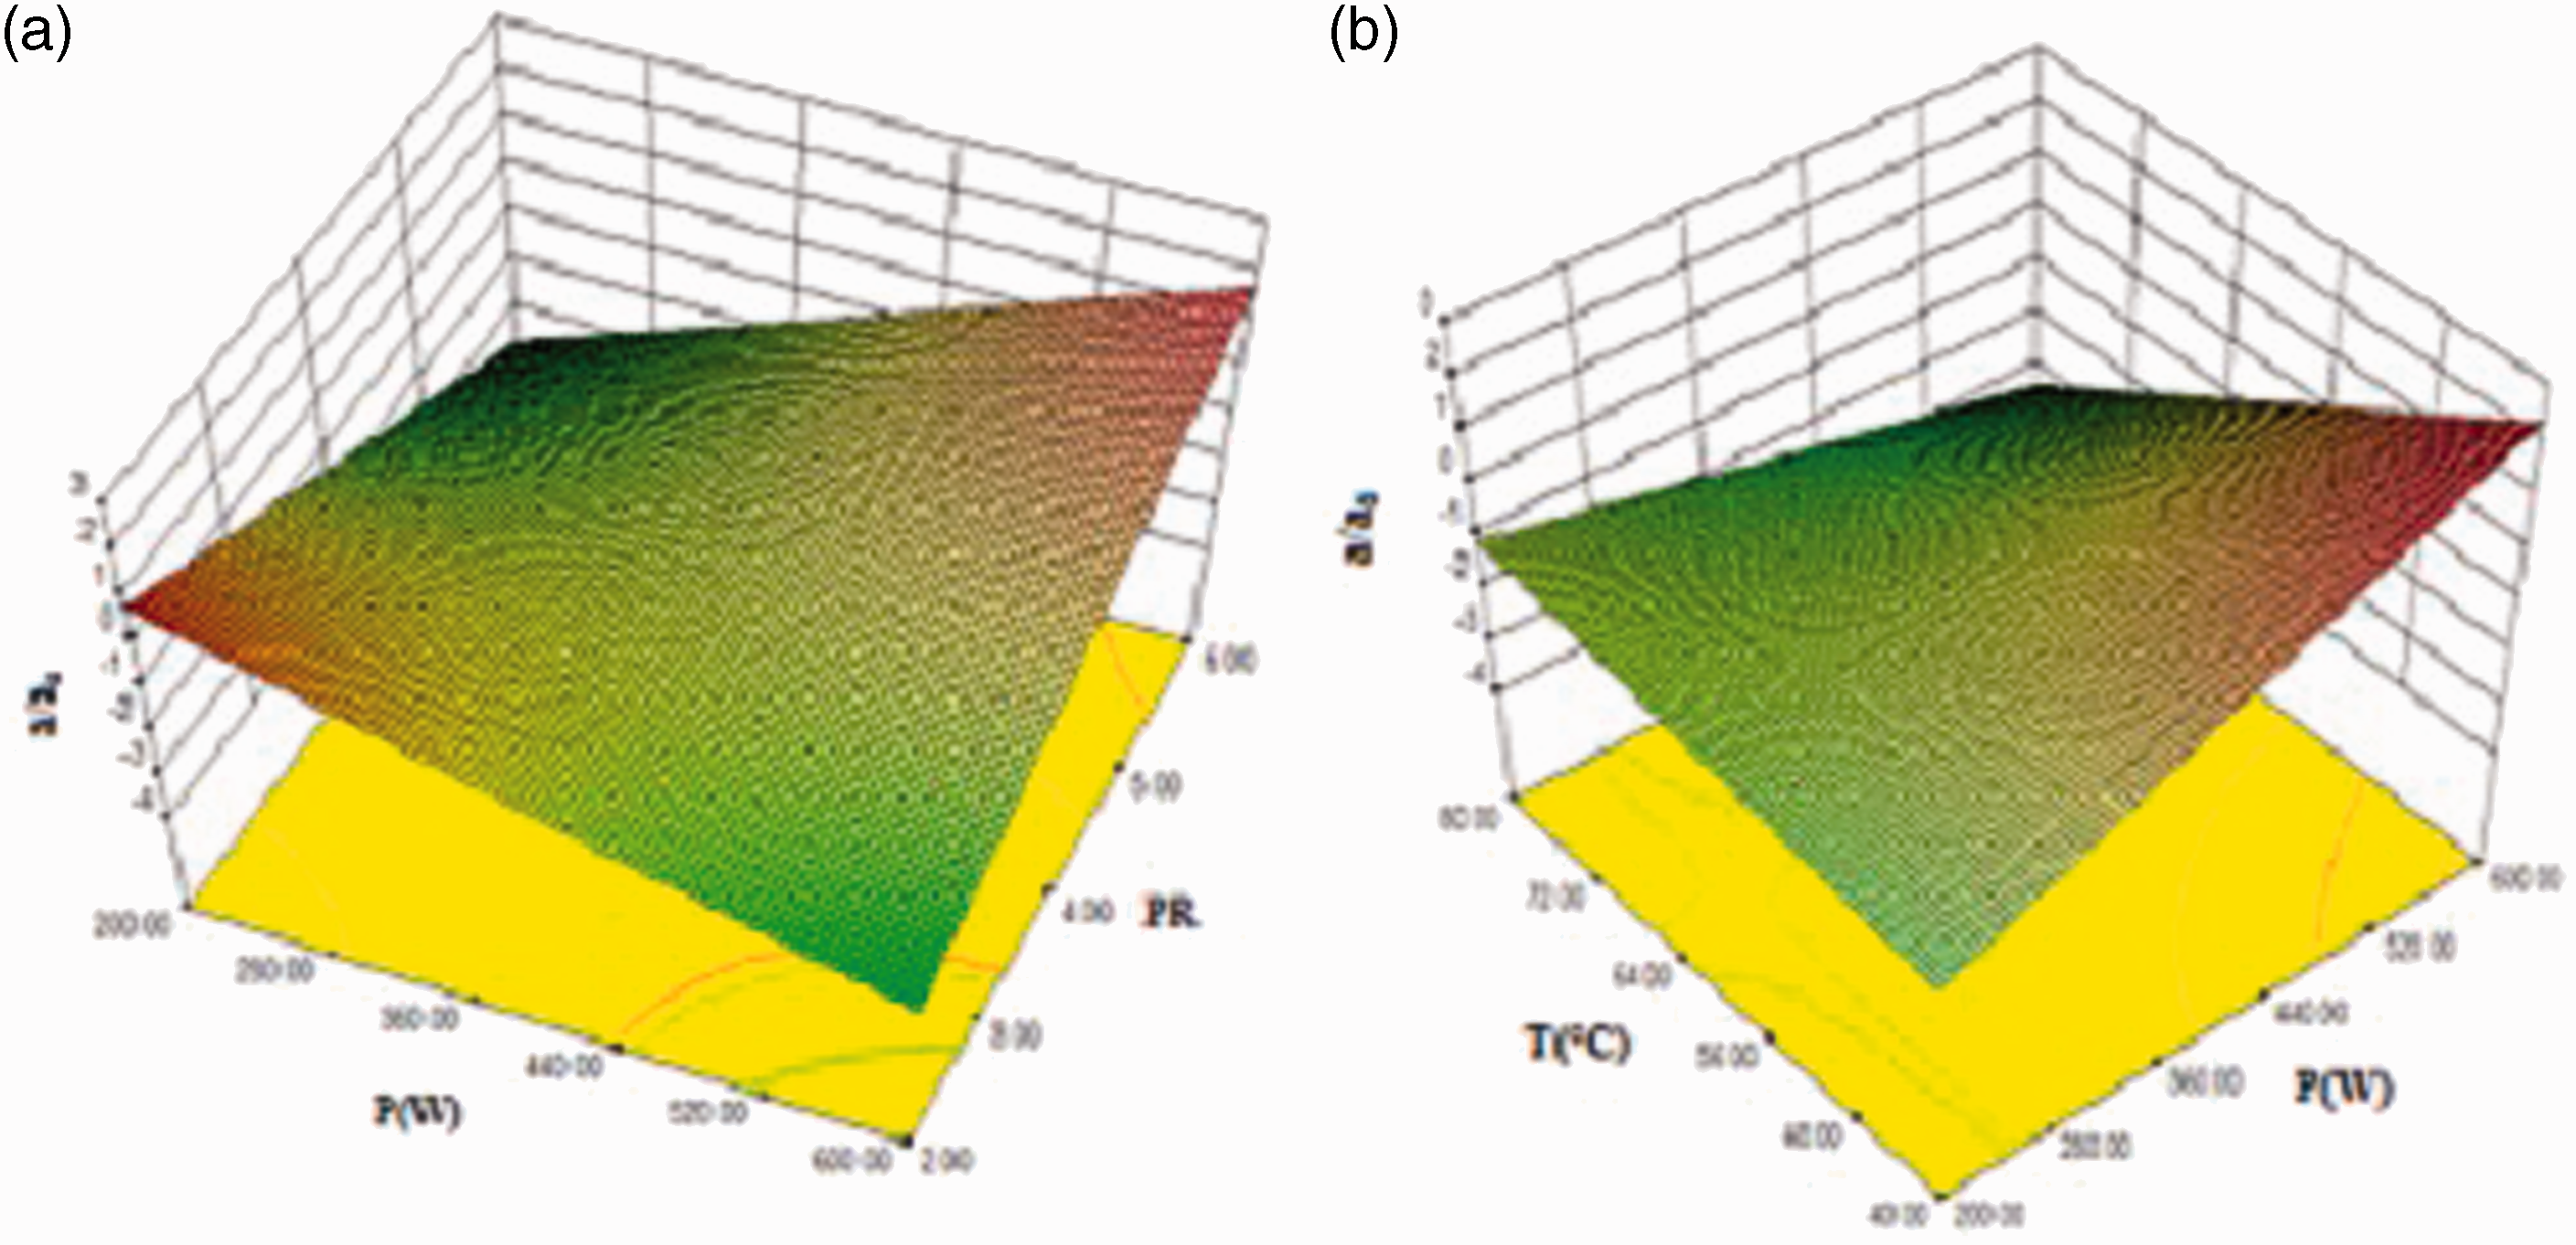
Chlorophyll, carotenoids, and anthocyanin concentration are important indices for determining the color of apple (Van den Berg et al., 2000). Initial values were negative, but during intermittent microwave drying, a reduction in greenness and an increase of redness were observed (Figure 11). It is clear from Figure 11 that the normalized redness values had an upward parabolic trend with decreasing product moisture content. This variation in color could be attributed to non-enzymatic Maillard browning reactions and formation of brown pigments during drying. Also, according to Contreras et al. (2008) and Niamnuy et al. (2007) carotenoids and anthocyanin concentration are responsible for the red color change of food materials during thermal processing. This increase in anthocyanin content observed in some microwave-treated samples could be interpreted by a more effective extraction of these compositions from the tissue due to cellular breakdown produced by microwave heating with high power or a long period of exposure to microwaves. Wrolstad et al. (1980) reported a similar result regarding the increase of anthocyanin in the microwave blanching of strawberry. Krokida et al. (2001) and Fernandez et al. (2005) during convective drying of apple slices and Quan et al. (2014) during microwave drying of chips potato found that the redness rose with the passage of drying time and reducing moisture content. Microwave power, PR, and air velocity did not have any effect on redness (p > 0.05) but the effect of temperature, power-PR and power-temperature interactions were significant (p < 0.05). The highest redness in treatments was observed with a power of 600 W and a PR of 6, a temperature of 60℃, and a velocity of 1.5 m/s, as well as a power of 600 W, PR of 3, temperature of 40℃, and velocity of 1.5 m/s (Figure 12).
Typical redness curve for apple slices. Normalized redness interactions: (a) PR and microwave power; (b) microwave power and temperature.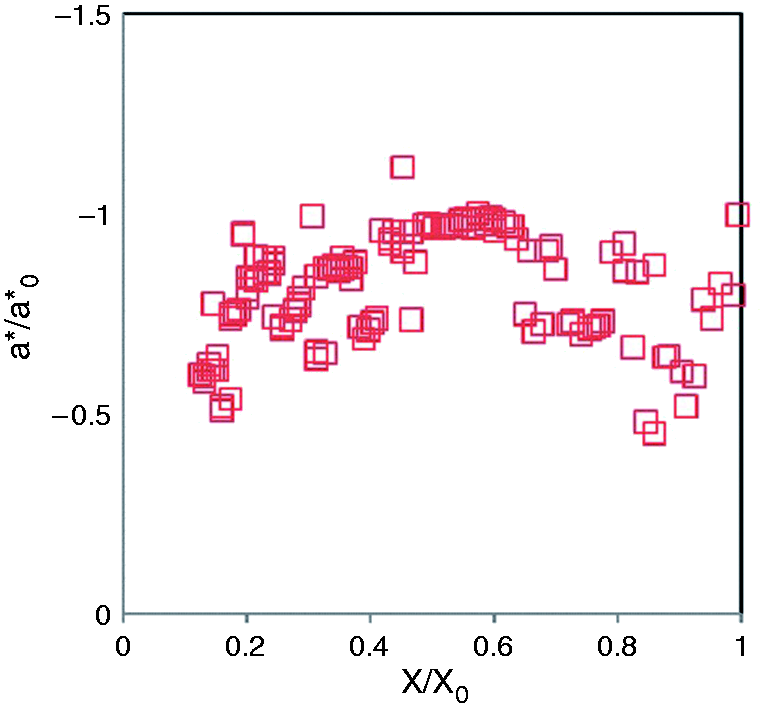
Normalized yellowness (b*/b*0)
The yellowness (b*/b*0) increased (P < 0.05) with decreasing X/X0 (Figure 13). This variation in yellowness could be attributed to non-enzymatic Maillard browning reactions and the formation of brown pigments in the apple slices during the drying process. Moreover, the amount of carotenoids in the apple slices increased due to the moisture evaporation and subsequent shrinkage of the products (Nadian et al., 2015).This effect changed the color of the samples to near the yellowish region. Power, temperature, PR, and velocity had no influence on yellowness (P > 0.05), and no significant model was derived between yellowness and the drying parameters. In addition, Krokida et al. (2001), Nadian et al. (2015), and Fernandez et al. (2005) for apple and De Ancos et al. (1999) for papaya noted an increase in b* values.
Typical normalized yellowness curve for apple slices.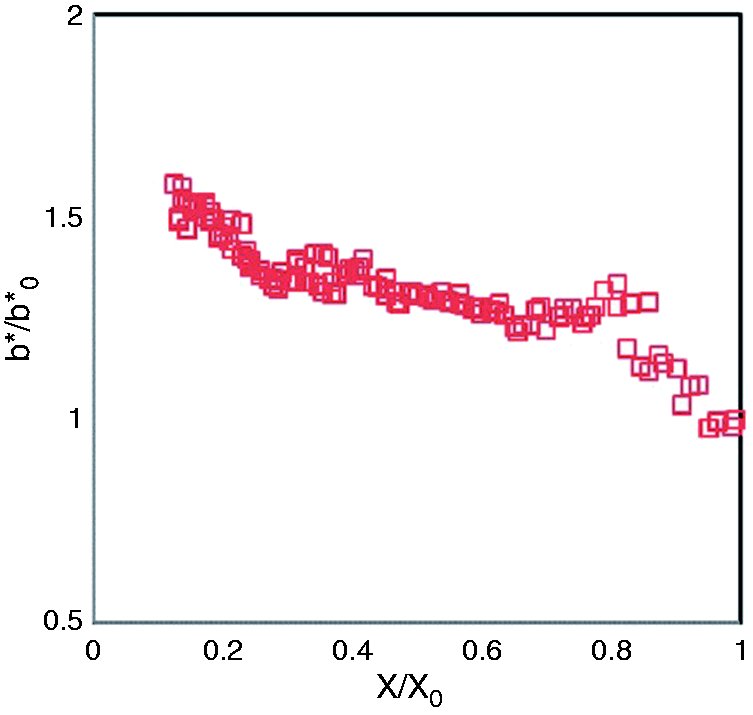
Total color difference (ΔE)
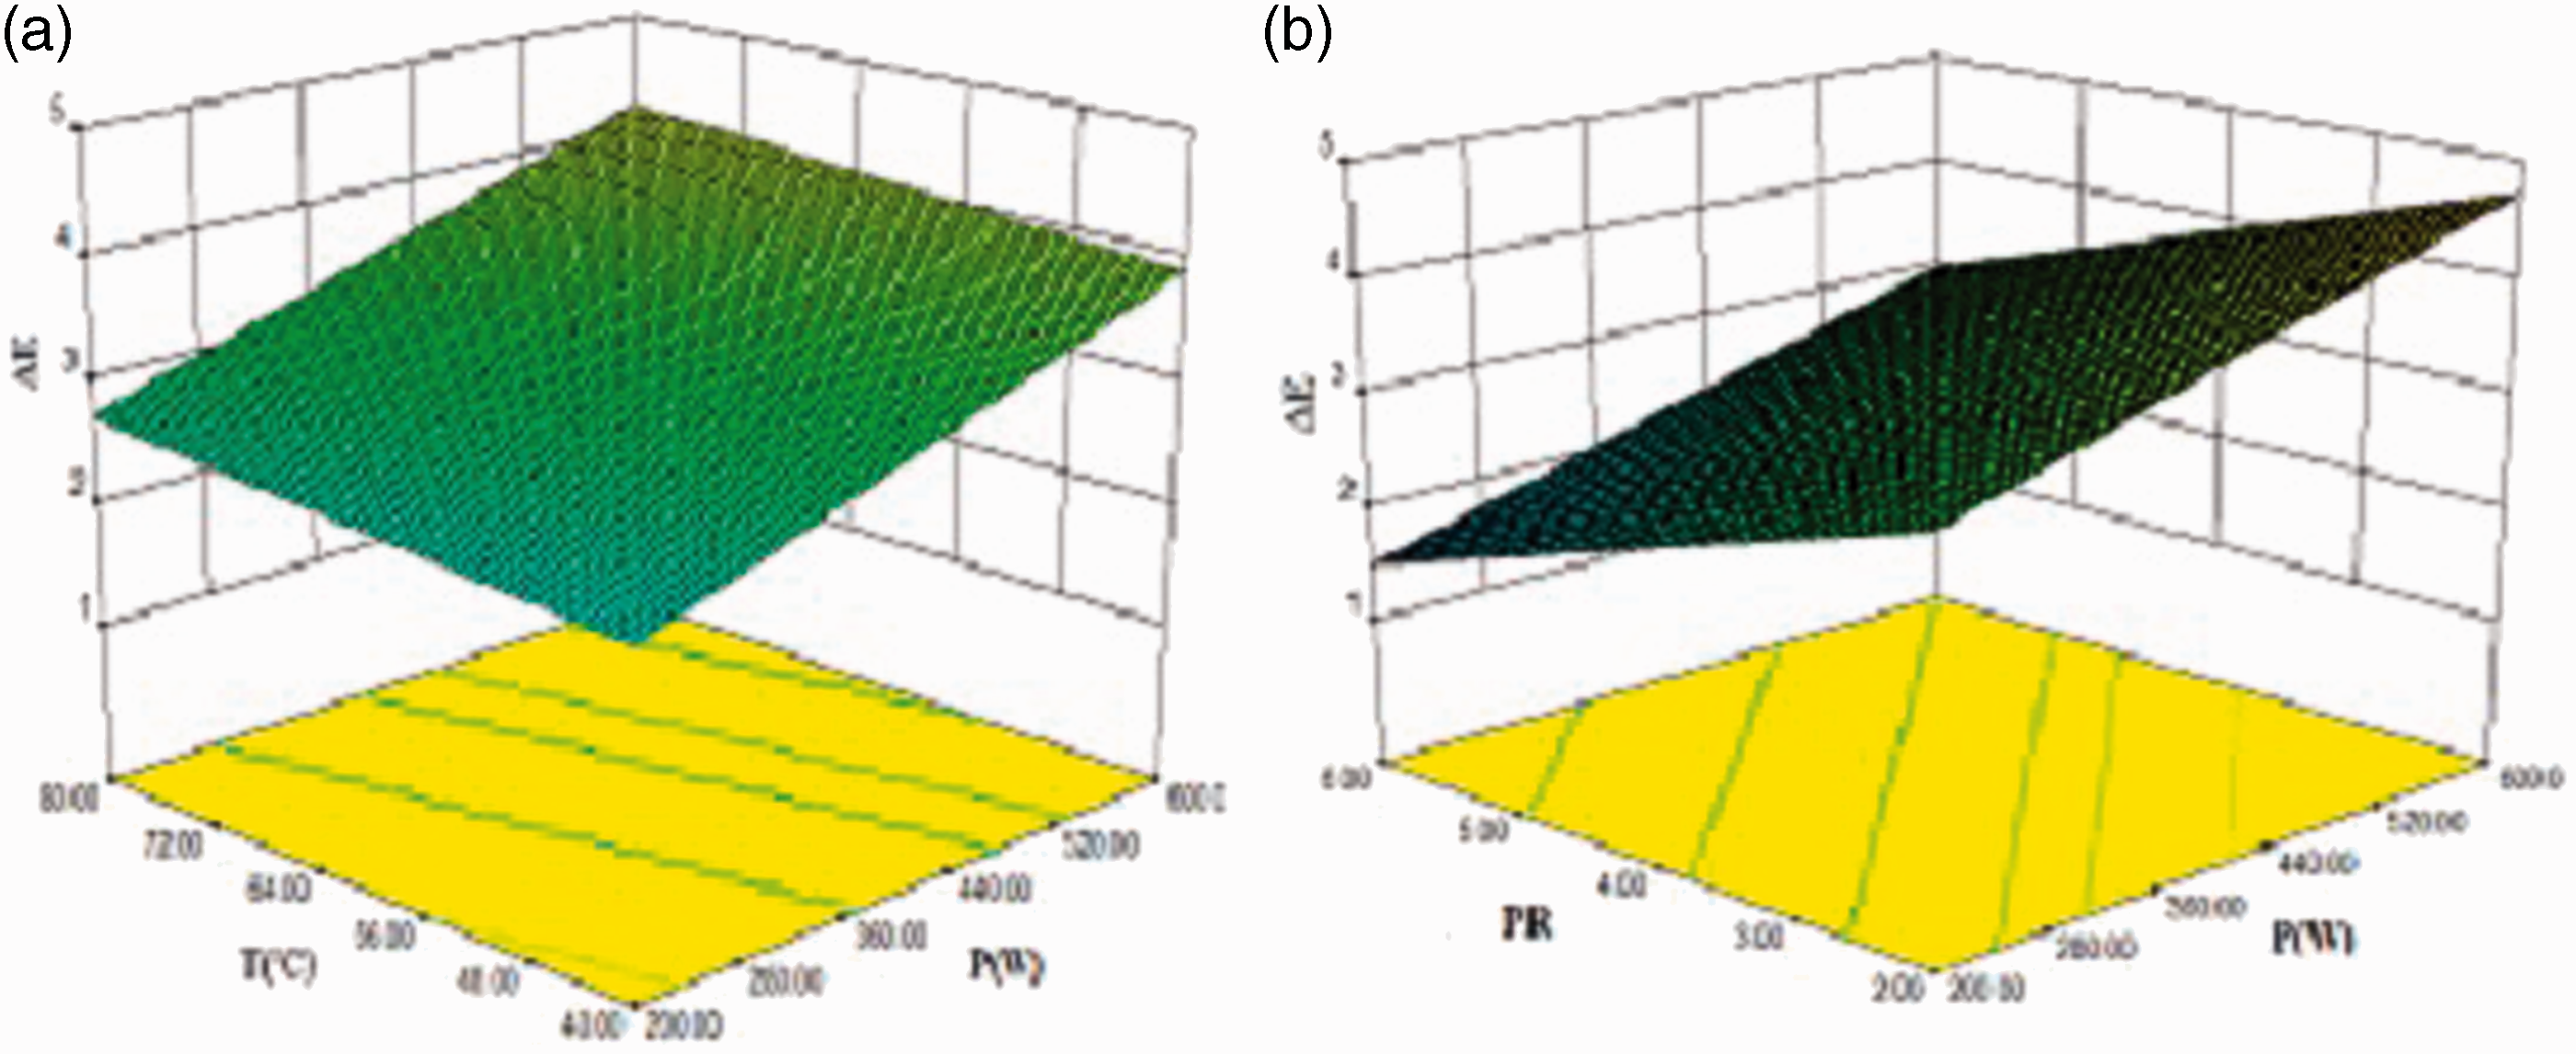
It is shown in Figure 14 that with a decline in X/X0, color change increases. Also, Nadian et al. (2015) found that the color change increased with passage of drying time and reducing moisture content during convective drying of apple slices. PR and microwave power had a considerable effect (p < 0.05) on the color change. With increasing power and temperature, color change increased while with increment PR, the color change declined (Figure 15). It was found that treatment with the lowest power setting, air temperature, PR, and velocity of 1.5 m/s had the least color change. These results are in agreement with the measured color changes with colorimeter in an IMWD dryer (Aghilinategh et al., 2015). This trend may be due to the principal reduction in Maillard reaction (Kaur and Singh, 2014). Sharma and Prasad (2006) also observed that dried garlic was darker when higher air temperatures and microwave power levels were applied during microwave-assisted drying. Also, De Ancos et al. (1999) observed an incremental color change with increasing power of microwave for kiwi and strawberry.
Typical color change curve for apple slices. Color change interactions: (a) microwave power and temperature, and (b) PR and microwave power.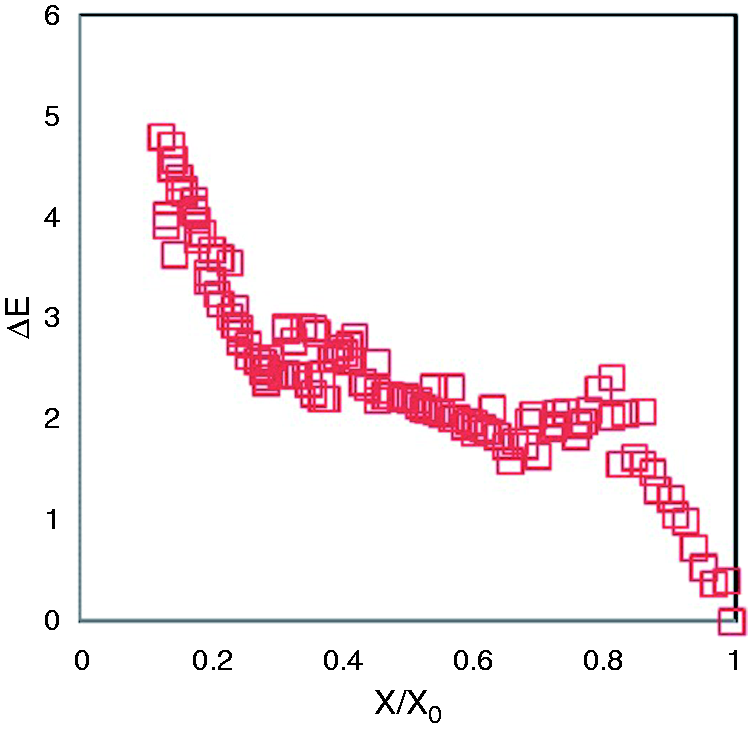
Normalized chroma (C/C0)
The C/C0 increased during intermittent convective microwave drying (Figure 16). This could be explained due to the Maillard reaction (Niamnuy et al., 2008) and sample shrinkage that caused the increase in carotenoid concentration (Contreras et al., 2008; Niamnuy et al., 2008). Also, chroma value enlarged during microwave drying in the work of Krokida et al. (2001) for apple. The final chroma value varied from 0.6 to 2.4. This indicates that the color intensity intensified during drying; however, the drying parameters had no impact on chroma value (P > 0.05).
Typical normalized chroma curve for apple slices.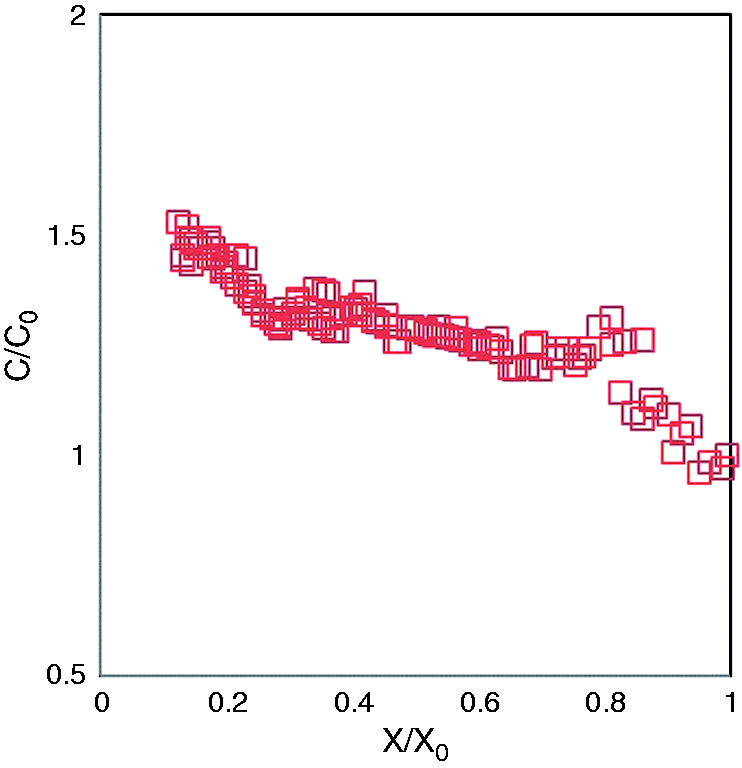
Normalized hue angle (H°/H°0)
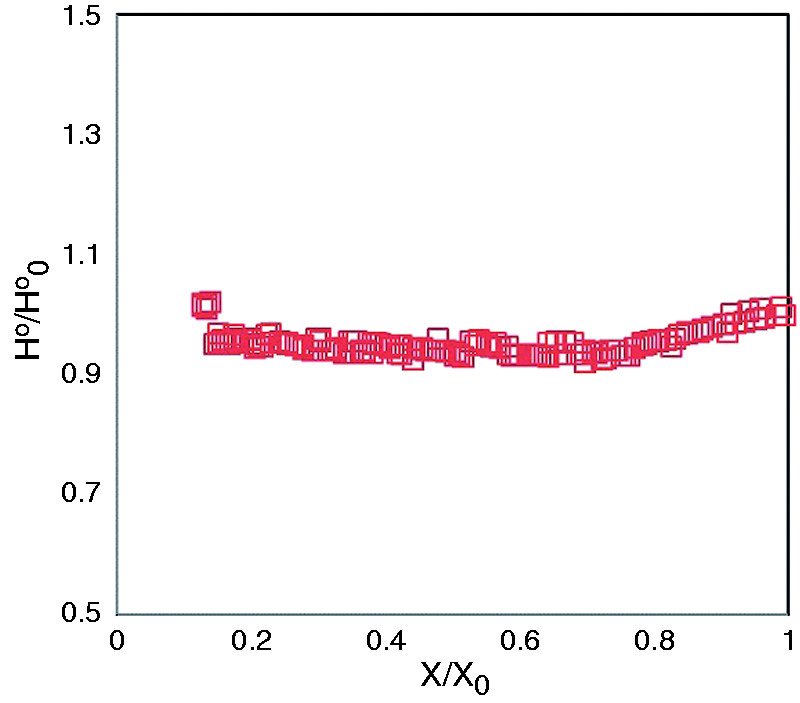
Microwave power, air velocity, and PR had no effect (P > 0.05) on hue angle, but temperature had a significant effect (p < 0.05). Therefore, hue angle with increment temperature and PR decreased and increased, respectively (Figure 17). Hue angle (Figure 18) enlarged during intermittent convective microwave drying, which indicates the apple samples lose their greenness (hue angle > 90°) and turn orange-red (hue angle < 90°). This result is in agreement with the findings of previous researchers for papaya, kiwi, and strawberry (De Ancos et al., 1999).
The interaction of PR and temperature on normalized hue angle. Typical normalized hue angle curve for apple slices.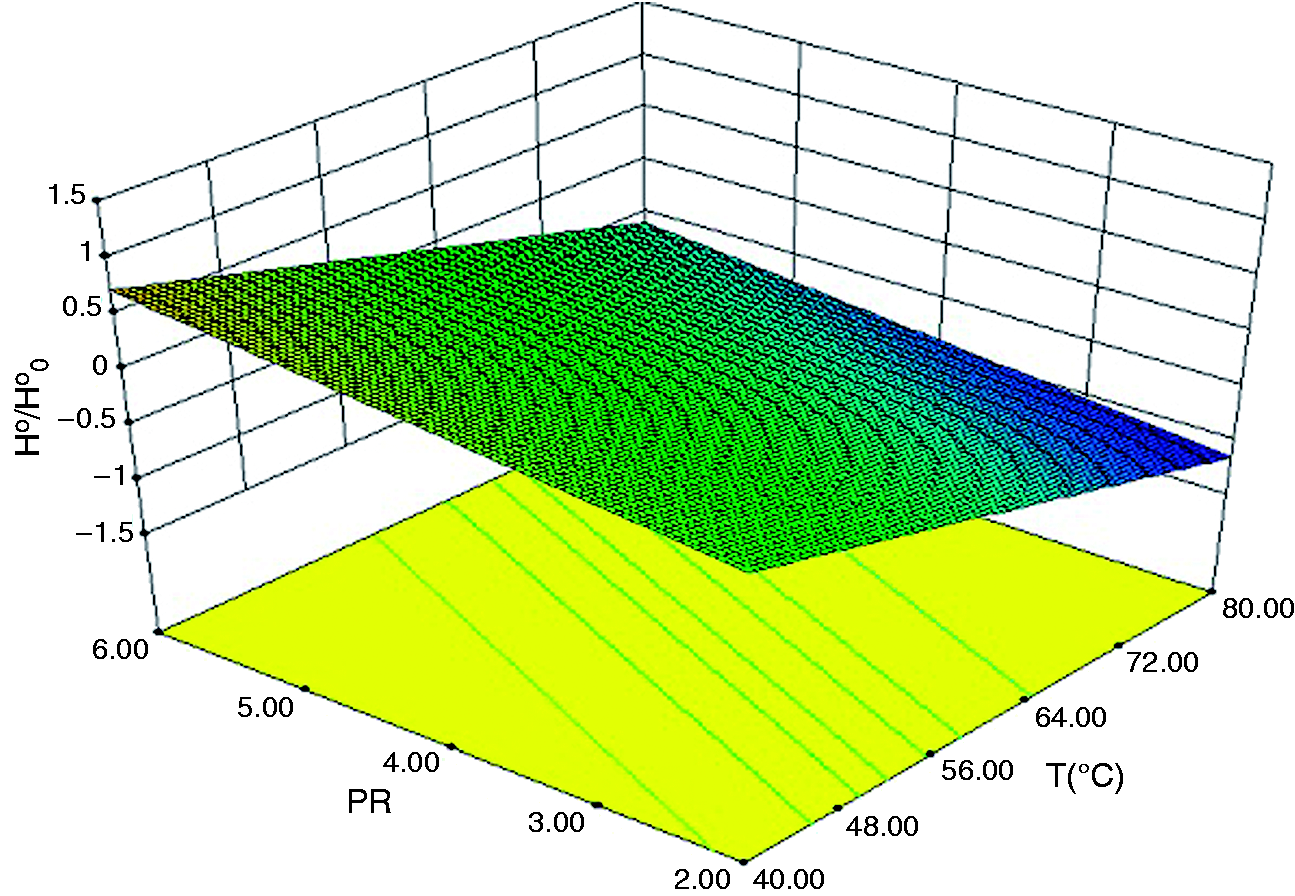
Conclusions
In this study, considerable changes in color properties of apple slices during real-time monitoring were observed. These changes were quantified by an image processing technique. Air velocity is not an important parameter during intermittent convective microwave drying since it did not show any effect on color properties. Drying parameters had no significant effect on yellowness and chroma values. With increasing of pulse ratio (PR), drying rate, hue angle, color change, and lightness were all diminished. The final chroma value varied from 0.6 to 2.4. Highest redness in treatments was observed with a power of 600 W, a PR of 6, a temperature of 60℃, and an air velocity of 1.5 m/s, as well as a power of 600 W, a PR of 3, a temperature of 40℃, and an air velocity of 1.5 m/s.
Footnotes
Declaration of conflicting interests
The author(s) declared no potential conflicts of interest with respect to the research, authorship, and/or publication of this article.
Funding
The author(s) received no financial support for the research, authorship, and/or publication of this article.