
Abstract
Low-fat meat products could be excellent carriers for plant sterols, known for their cholesterol-lowering properties. In this study, we developed a protocol for the manufacture of a deli-style turkey enriched with plant sterols (S) at a level sufficient to deliver the maximum plant sterols amount recommended for cholesterol reduction by the European Food Safety Authority (3 g of plant sterols per day) in a 70 g portion. We investigated the stability of the plant sterols and the effects of their addition on the product quality. Plant sterols remained stable during the seven-day storage period. The addition of plant sterols significantly affected some texture parameters, shear force, lipid oxidation, L values and water-holding capacity compared with control (C). Sensory analysis was carried out by an untrained panel (32) using the difference-from-control test between C and S samples to evaluate first the extent of the overall sensory difference and then the extent of sensory difference on colour, texture and flavour. Results indicated that panellists considered the intensity of the difference between C and S samples to be ‘small’. Plant sterols could be used as a potential health-promoting meat ingredient with no effect on plant sterol stability but with some effects on texture and sensory characteristics.
Introduction
Consumption of foods enriched with plant sterols is a well-established approach to reducing circulating total cholesterol (TC) and low-density lipoprotein-cholesterol (LDL-C) (Catapano et al., 2011), which are the contributory factors to cardiovascular disease (CVD). CVD causes more deaths among Europeans than any other condition, and in many countries still causes more than twice as many deaths as cancer (Nichols et al., 2014). The overall annual economic cost of CVD in the European Union (EU) is estimated to be €192 billion in direct and indirect healthcare costs (Allender et al., 2008). Although the displacement of cholesterol from mixed micelles and therefore the inhibition of cholesterol absorption in the intestine was originally the only known mechanism by which plant sterols reduce cholesterol, plant sterols seem to also act at a cellular and transporter level, while other mechanisms of action are still presently being investigated (De Smet et al., 2012). Since 2012, plant sterols have been included by the European Food Safety Authority (EFSA) in the EU Register of Nutrition and Health Claims, which permits the following health claim: ‘Plant sterols have been shown to lower/reduce blood cholesterol. High cholesterol is a risk factor in the development of coronary heart disease’. The conditions of use of the claim state that ‘the beneficial effect is obtained with a daily intake of 1.5–3 g plant sterols/stanols’ (EFSA, 2012).
There are 10 food categories currently approved for plant sterol use by EFSA including yellow fat spreads, milk-type products, fermented milk-type products (e.g. yoghurts), milk-based fruit drinks, soya drinks, cheese-type products, salad dressings, spice sauces, rye bread and rice drinks (EFSA, 2008). In order for other food categories with plant sterols to be commercialised, a novel food authorisation (according to regulation 258/97/EC) is needed. However, a novel food may also be marketed through a simplified procedure called ‘notification’ if the ‘substantial equivalence’ of the new product has been proven by a ‘national competent food authority’ (EFSA, 2008). This is the case for plant sterol-enriched fruit juices, which are still awaiting approval (EFSA, 2008). On the other hand, plant stanols, which are associated with the same EFSA cholesterol-lowering health claim as plant sterols, are not subject to the same legislation as plant sterols and their use in foods is not restricted (Grasso et al., 2014).
Low fat cholesterol-lowering meat products could be considerably more nutritious than the currently marketed cholesterol-lowering spreads, which when used as directed (three times per day), add 10.5–22.8 g extra fat per day (Benecol, 2015; Flora Pro.active, 2015) but few other nutrients. Meat products could be excellent carriers for plant sterols since they appeal to a wide range of consumers, they are versatile (e.g. minimally processed to comminuted products) and they intrinsically contain high-quality nutrients (proteins, vitamins and minerals). Functional meat products may also represent an opportunity for the meat industry to improve the overall negative and unhealthy perception that consumers often have of processed meats (Grasso et al., 2014). However, to date there has been little investigation on the incorporation of plant sterols into meat products (Matvienko et al., 2002; Tapola et al., 2004) and none with regard to how their incorporation may affect the quality of the final product. Turkey breast meat is low in fat (0.8%) and cholesterol (53 mg/100 g) (USDA, 2015) compared with other meats, and while its relatively high content of unsaturated fatty acids (Komprda et al., 2003) renders it more susceptible to oxidative deterioration than other meats (Tang et al., 2005), its overall characteristics make it a particularly attractive carrier for the incorporation of health-enhancing ingredients such as plant sterols. The aim of the present study was to develop a protocol for the manufacture of a turkey product enriched with plant sterols (S) at sufficient concentration to deliver the maximum plant sterol amount recommended for cholesterol reduction by the EFSA (3 g of plant sterols per day) in a 70 g turkey portion. A number of quality characteristics were assessed, including composition, pH, water holding capacity (WHC), cook loss, texture profile, sensory difference-from-control test, plant sterol content, lipid oxidation and colour against a control (C) plant sterol-free recipe.
Materials and methods
Materials
Fresh turkey breast meat was supplied by Dawn Farm Foods, Naas, Co. Kildare, Ireland. The meat was vacuum packed and frozen until required for the turkey manufacture. Plant sterol powder (90% purity) from soy bean was supplied by HSF Biotech (Xi’an, China). According to manufacturer’s specification, the plant sterol mixture contained 42 g/100 g β-sitosterol, 24 g/100 g campesterol, 24 g/100 g stigmasterol and 2 g/100 g of another minor plant sterol (brassicasterol). It also contained mixed tocopherols (0.5%), moisture (0.5%) and food-grade silica. The internal standard (IS) 5α-cholestan-3β-ol (purity of 98%) was purchased from Sigma-Aldrich Co. (St. Louis, MO, USA).
Cooked turkey formulation and processing
Ingredients used in the manufacture of C and S turkey
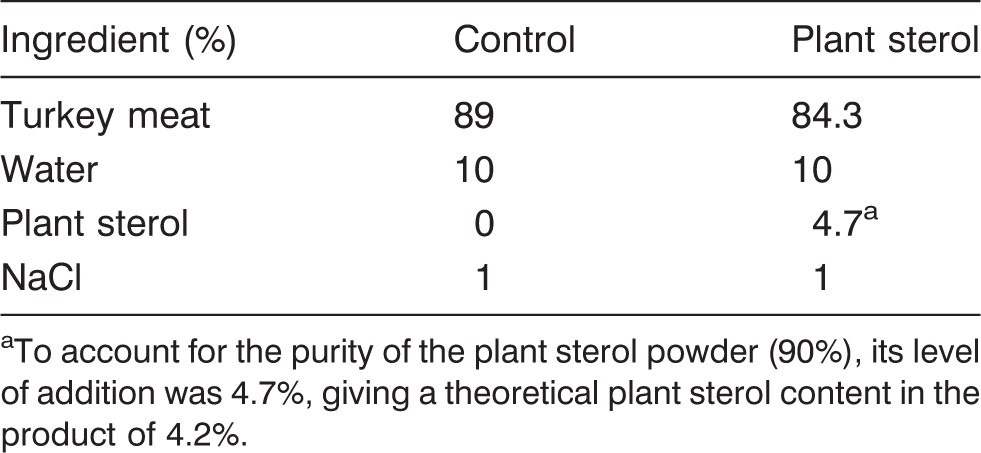
To account for the purity of the plant sterol powder (90%), its level of addition was 4.7%, giving a theoretical plant sterol content in the product of 4.2%.
Plant sterol addition of 4.7% (4.2% accounting for plant sterol powder purity) was decided upon in order to allow portion control, therefore to deliver the maximum plant sterol amount recommended as ‘beneficial’ by the EFSA (3 g of plant sterols per day) in a 70 g turkey portion. Preliminary tests concentrated on the type of plant sterol to use and on the NaCl and water contents to add. Regarding the type of plant sterol, the possibility of using water dispersible plant sterol formulations, plant sterol paste formulations or plant sterol powders with different granulometry, in order to maximise plant sterol dispersion in the meat matrix, was explored; 1% NaCl and 10% water additions were decided after consultations with industry partners and quality assessments of preliminary kitchen trial batches made with increasing levels of NaCl and water.
Prior to product manufacture, turkey breast meat was thawed at 4 ℃ for 12 h and then minced with a 9 mm plate mincer (La Minerva, Bologna, Italy). The minced turkey was mixed with the other ingredients (water, plant sterol and NaCl) in a Hobart A120 mixer (Hobart UK, London). For both C and S formulations, NaCl and water were added after 30 s of mixing, and for the S formulation plant, sterol powder was added after 5.5 min. The total mixing time for both formulations was 15 min.
The mixture (530 ± 10 g) was filled into a 9 cm diameter plastic casing (Fispak, Dublin, Ireland) using a sausage stuffer (Kenwood KM800 with AT950 attachment) and sealed with plastic ties. Samples were cooked in a water bath set at 77 ℃ until the internal temperature had reached 72 ℃ for 2 min (approximately 1 h and 10 min). The temperature was measured with a Whatman type-k thermocouple (GE Healthcare Ltd, Buckinghamshire, England) inserted into the centre of the turkey roll. Immediately after cooking, the meat was cooled by immersion in an ice bath and then refrigerated at 4 ℃. The meat was cut into 5 mm slices, using a meat slicer (Medoc, Logroño, Spain). The slices were then placed on polyethylene terephthalate (PET) trays and immediately covered with catering cling film (O2 transmission 2000 cm3 m−2 day−1 bar−1). Samples were taken immediately (day 0) and during shelf life (on days 2, 4 and 7 of storage in a refrigerator at 4 ℃) for measurement of colour, lipid oxidation, moisture and plant sterol content. WHC, pH, cook loss, texture profile and sensory difference-from-control test were assessed on the freshly cooked samples at day 0. On day 0, samples for fat, ash and protein determination were frozen for analysis at a later stage. The full experiment was carried out on three occasions. Two turkey rolls (one C and one S) were manufactured on each occasion.
Compositional analysis and pH measurement
Moisture, ash, fat and protein contents of the cooked turkey samples were analysed according to the AOAC official methods 950.46, 920.153, 991.36 and 981.10, respectively (Soderberg, 1995) and expressed as a percentage of the total composition of the turkey. A Hanna pH meter HI120 (Leighton Buzzard, Bedfordshire, England) was used to measure the pH of 1 g samples of meat homogenised in 9 ml of distilled water using an Ultra Turrax T25 (Janke & Kunkel IKA-Labortechnik).
Measurement of lipid oxidation
Lipid oxidation in cooked turkey was measured immediately after slicing (day 0) and then on days 2, 4 and 7 of aerobic refrigerated storage. The aerobic storage was adopted: (1) to simulate a real-life shelf-life situation, as consumers would do in their homes, rather than a retail storage setting; (2) to highlight the possible effects of plant sterols on oxidation in a shorter time period, in contrast to storage in vacuum or modified atmosphere packaging. The 2-thiobarbituric acid test of Buege and Aust (1978) was used to determine the extent of oxidative rancidity. Results were expressed as 2-thiobarbituric acid reactive substances (TBARS), in mg of malonaldehyde (MDA)/kg meat. Triplicate determinations were conducted on each sample and results were adjusted according to the meat content.
Texture profile analysis
Texture profile analysis (TPA) was carried out on day 0 using an Instron universal testing machine (Model No. 5544, Instron Corporation, High Wycombe, England) fitted with a 500 N load cell and the data were interpreted using the Merlin software package (Version 2019). The cooked turkey rolls were cut into 2 cm thick slices and samples for analysis (diameter 2 cm and height 2 cm) were prepared using a cork borer. The meat sections were covered with cling film to prevent water evaporation and allowed to equilibrate to room temperature (25 ℃) for about 30 min. The cross head speed was set at 50 mm min−1 and, following removal of the cling film, the cores were axially compressed to 50% of their original height in a double compression cycle using a 50 mm diameter metallic plate. Attributes analysed were hardness 1 (peak force during the first compression cycle [N]), hardness 2 (peak force during the second compression cycle [N]), cohesiveness (ratio of the positive force area during the second compression to that during the first compression curve [A2/A1, dimensionless]), springiness (distance the sample recovers after the first compression [mm]) and chewiness (hardness 1 × cohesiveness × springiness [N × mm]) (Honikel, 1998). The shear force (N) was measured with the Kramer multi-bladed cell (10 blades, 7 cm wide and 0.3 cm thick) on 5 mm thick rectangular samples (45 mm × 30 mm). The multiple blades and cell were attached to an Instron universal testing machine (Model No. 4301, Instron Corporation, High Wycombe, England). The cross head speed was set at 200 mm/min, the chart speed was 50 mm/ min, and the full scale load was 100 kg. Six measurements per treatment were made.
Colour
A Minolta colour meter (model CR300, Minolta Camera Co. Ltd, Osaka, Japan) was used to measure CIE colour coordinates ‘L*’ (lightness), ‘a*’ (redness/greenness) and ‘b*’ (yellowness/blueness). Six measurements were taken on non-overlapping zones of the turkey slices. The measurements were taken immediately after cutting the turkey (day 0) and then on days 2, 4 and 7 of refrigerated storage. Total colour difference (ΔE) was calculated using the following equation (Francis and Clydesdale, 1975):

WHC and cook loss
WHC was measured in triplicate on the freshly cooked sample using a modified centrifuge method (Drummond and Sun, 2006) in which samples of 1.3 ± 0.2 g were wrapped in cheese cloth and centrifuged in 50 ml centrifuge tubes (containing absorbent cotton wool) for 10 min at 1000 r/min. WHC (%) was calculated as the water retained in the sample after centrifugation (ma) divided by the initial core weight (mb). The following equation from Drummond and Sun (2006) was used:

The cook loss was determined by subtracting post-cook weight from pre-cook weight and dividing the result by pre-cook weight and was expressed on a percentage basis.
Determination of plant sterol content
Plant sterol content was determined in accordance with Grasso et al. (2015), on 0.5 g cooked turkey samples and using 5α-cholestan-3β-ol as IS (50 mg/ml).
Sensory analysis
Sensory evaluation was carried out using a difference-from-control test. Untrained panellists (32 post graduate students and staff of the School of Agriculture and Food Science at University College Dublin) were recruited. The sensory analysis was performed on the freshly cooked and chilled (4 ℃) turkey slices (2 mm thick). The difference-from-control test was carried out in a sensory analysis suite equipped with individual testing booths and controlled lighting to neutralise any possible differences in colour or appearance of the meat. Panellists were provided with still mineral water to cleanse the palate between samples.
The difference-from-control test method was used to detect and quantify the difference between an identified control/reference sample (C) and a coded sample, which was either a blind C or S sample (Meilgaard et al., 2007). For the test, each subject was simultaneously given a sample (C) labelled as ‘control’ plus one test sample labelled with a random 3-digit code. Subjects were told that the test sample might be the same as control. The test was designed such that all subjects assessed both sample combinations (C-C and C-S) and presentation order was randomised for each panellist. The C-C (blind control) was a duplicate presentation of a control sample and served as an experimental control for noise. It represents the degree of heterogeneity in the samples (Kemp et al., 2011) and is also a measure of the so-called ‘placebo’ effect, which is the numerical effect of simply asking the ‘difference’ question when in fact no difference exists (Meilgaard et al., 2007).
Subjects were initially asked to rate the size of the overall sensory difference between control and test sample on the difference scale given, where 0 = no difference, 1 = very small difference, 2 = small difference, 3 = moderate difference, 4 = large difference, 5 = very large difference and 6 = extreme difference. If no difference was found (0 = no difference), the panellist reached the end of the test. However, if an overall sensory difference was detected (between 1 = very small difference and 6 = extreme difference), subjects were asked to specifically indicate the degree of the sensory difference between samples on colour, texture and flavour using similar difference scales.
Statistical analysis
In order to determine significant differences (P < 0.05) between C and S turkey, experimental data of the three replicates were compared by one-way analyses of variance (ANOVA) and t tests. Two-way ANOVA and Tukey’s tests were used to determine significant differences (P < 0.05) among different formulations and storage times. The statistical software used was SPSS version 20 (SPSS Inc. Chicago, IL, USA).
Results and discussion
Proximate analysis and pH
Proximate composition and pH of cooked S and C turkey
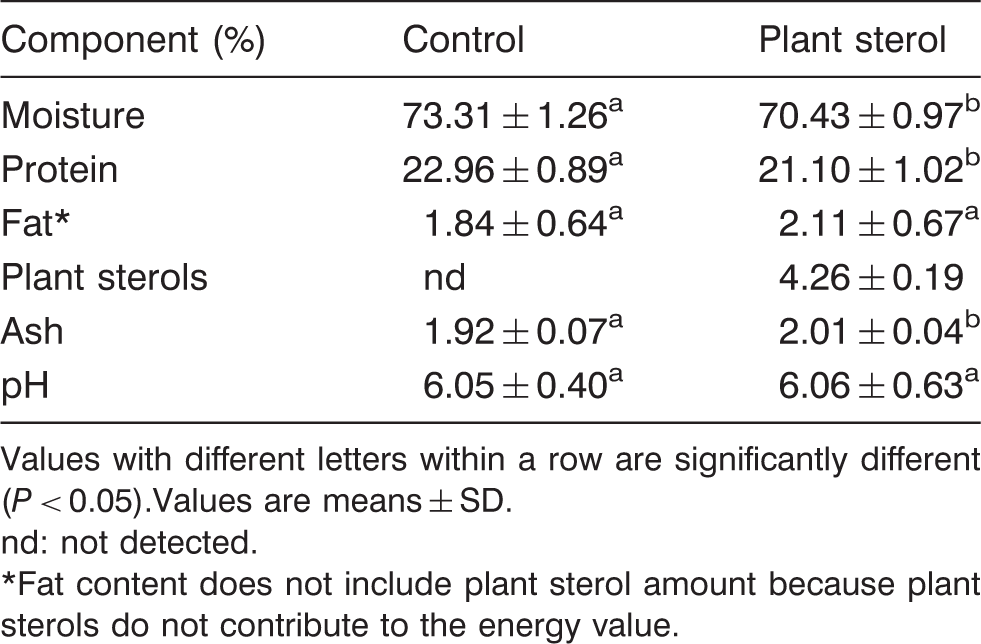
Values with different letters within a row are significantly different (P < 0.05).Values are means ± SD.
nd: not detected.
*Fat content does not include plant sterol amount because plant sterols do not contribute to the energy value.
Moisture, protein and ash were significantly different between the two formulations (P ≤ 0.003), while there was no significant difference in fat content (P = 0.400). In order to calculate the fat content of the S samples, from the overall fat value obtained by Soxhlet analysis, the plant sterol content quantified by gas chromotography (GC) was subtracted. In the S samples, as expected due to the addition of the plant sterol powder, moisture and protein contents were lower and ash was higher. In both C and S samples, fat and protein content was comparable with that of commercial deli-style turkey (around 1–2% fat and 20–24% protein) (Tesco Ireland, 2015). No difference in pH between the C and S samples was noted (P = 0.909).
TBARS
The levels of TBARS in cooked S and C turkey are presented in Figure 1. The overall development of oxidation in the S samples was slightly reduced compared with the C samples for the duration of storage (P = 0.0001). The lower values may possibly be due to the lower meat content of the S samples and consequently the reduced availability of substrate for oxidation or to the presence of antioxidant tocopherols in the plant sterol powder.
Lipid oxidation (TBARS) in cooked S and C turkey during refrigerated storage over a seven-day storage period. Significant differences (P ≤ 0.05) are denoted by different letters. Errors bars indicate SD.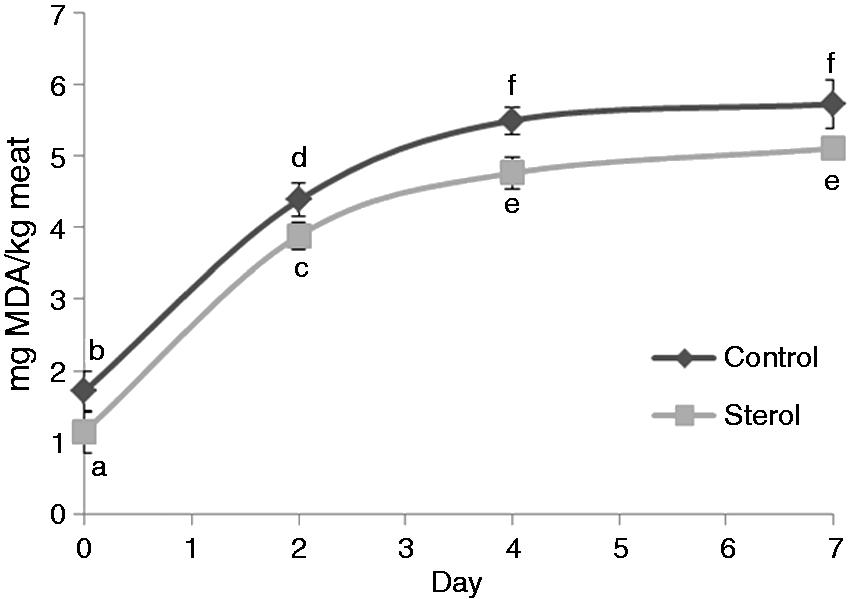
TBARS increased as storage time progressed regardless of the treatment (P = 0.0001; Figure 1) and the levels reported here fall within the range of those reported elsewhere by Tang et al. (2005). The time × treatment interaction was non-significant (P = 0.305), revealing similar rates of lipid oxidation between the treatments across the seven days of storage.
Lipid oxidation derived off-flavour in cooked turkey breast has been shown to be detectable at a TBARS level of around 1.5 mg MDA/kg meat (Brunton et al., 2000). On day 0, C samples had a mean value of 1.7 mg MDA/kg meat, while S samples had a mean value of 1.1 mg MDA/kg meat. According to Brunton et al. (2000), the S samples would be below the minimum off-flavour detection threshold. Tang et al. (2005) conducted sensory tests on cooked turkey with similar characteristics to that manufactured in the present study and found that the flavour of three-day-stored meat with significant oxidation levels (4.6–5.5 mg MDA/kg) was still quite acceptable. Our C and S samples after four days of storage had comparable oxidation levels (4.8–5.5 mg MDA/kg). The limiting point at which poultry meat products can be rejected due to lipid oxidation is difficult to ascertain, because sensory perceptions depend on personal thresholds (Guerrero-Legarreta and Hui, 2010).
TPA
Textural properties of cooked C and S turkey as measured using TPA and Kramer multi-bladed cell
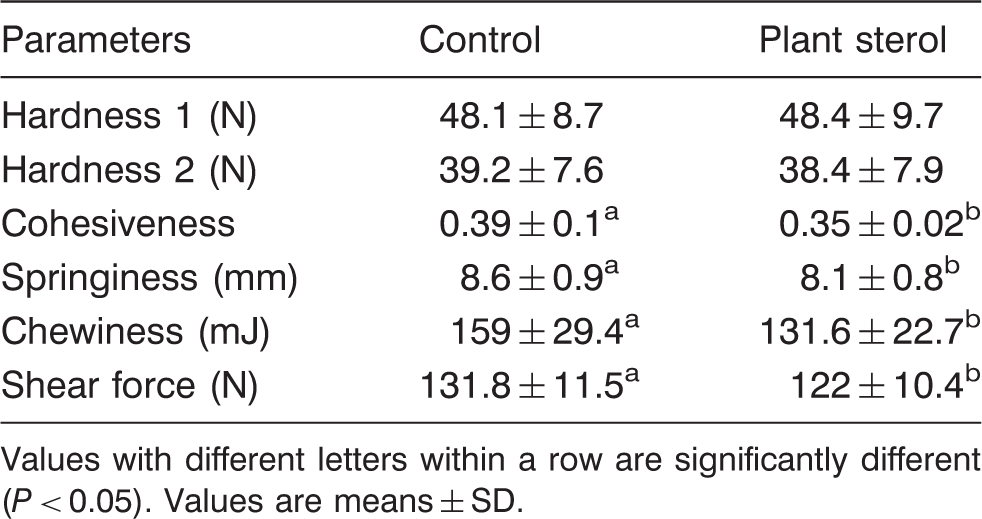
Values with different letters within a row are significantly different (P < 0.05). Values are means ± SD.
No significant differences were found between S and C turkey with regard to hardness 1 and hardness 2 (Table 3). However, cohesiveness (P = 0.0001), springiness (P = 0.029), chewiness (P = 0.004) and shear force (P = 0.011) were significantly lower in S turkey. Since all of these parameters were lower in the S turkey, this observation most likely indicates that the addition of the plant sterol had an impact on the binding of the meat matrix during manufacture. However, the slightly different moisture and protein content between C and S samples (Table 2) might have also had an effect on the texture. Many studies have evaluated the effect of the addition of functional ingredients on the texture of cooked processed meats (Fernández-Ginés et al., 2005), but to the best of our knowledge no studies have focused on plant sterols. The instrumentally measured differences in texture observed in the present study do appear to affect the sensory characteristics of the turkey as discussed in the sensory analysis section.
Colour
Instrument colour parameters (‘L*’, ‘a*’, ‘b*’ and ΔE) of cooked S and C turkey are presented in Figure 2. ‘L*’ values for the S turkey were significantly higher immediately after manufacture and throughout storage (P = 0.002; Figure 2), indicating that the plant sterol containing samples were lighter in colour than C samples throughout shelf life. This is most likely a result of the addition of the white plant sterol powder (‘L*’ = 100.17, ‘a*’ = −0.52, ‘b*’ = 1.11) into the meat matrix. The ‘b*’ values were not significantly different between the two formulations, while the ‘a*’ values were significantly different between the two formulations on day 0 (P = 0.0001) but not thereafter. There was also a significant effect of time on the parameters ‘a*’, ‘b*’ and ‘L*’ (P ≤ 0.0001; Figure 2): ‘a*’ decreased as storage time progressed, while ‘b*’ and ‘L*’ increased slightly. The time × treatment interaction was non-significant (P ≤ 0.089), indicating that ‘a*’, ‘b*’ and ‘L*’ for the two formulations did not differ in their responses over time.
Colour parameters (L*, a*, b* and ΔE) in cooked S and C turkey during refrigerated storage over a seven-day period. Significant differences (P ≤ 0.05) are denoted by different letters. Errors bars indicate SD.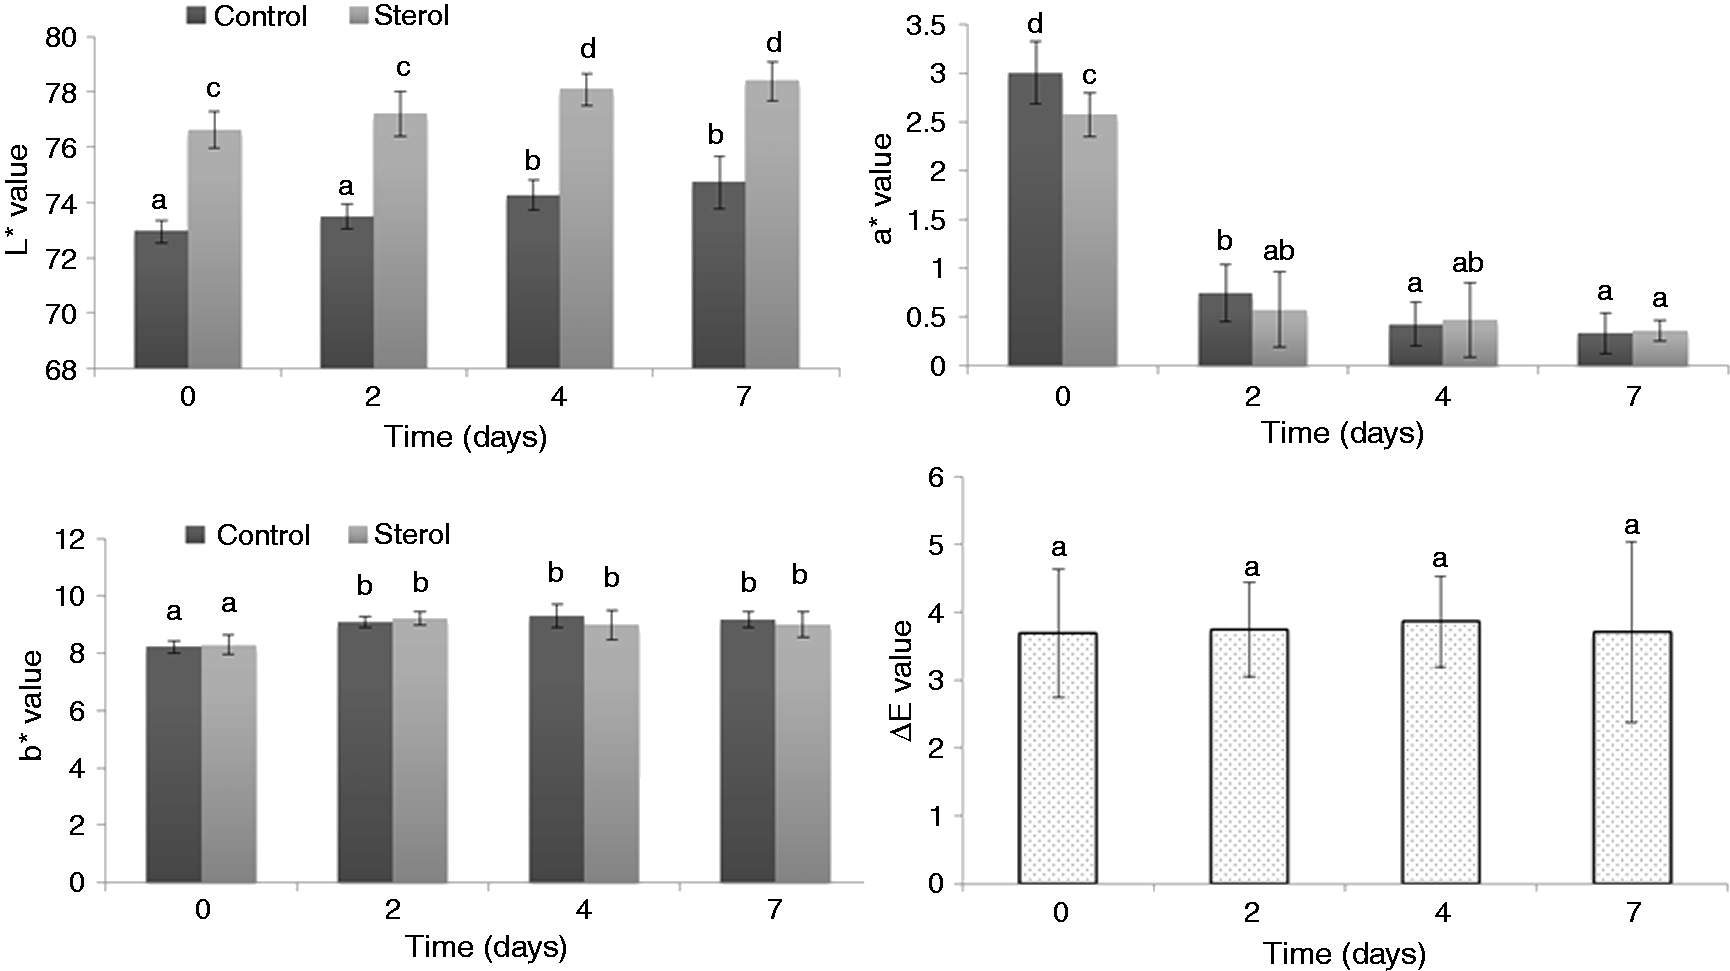
The perception of the colour difference ΔE varies according to the observed colour and the sensitivity of the human eye. According to DrLange (1999), differences in perceivable colour can be analytically classified as ‘very distinct’ (ΔE > 3), ‘distinct’ (1.5 < ΔE < 3) and ‘small difference’ (ΔE < 1.5). In the present study, ΔE values between C and S were greater than 3 and thus the difference in colour can be classified as ‘very distinct’ across shelf life: day 0 (3.7 ± 0.9), day 2 (3.7 ± 0.7), day 4 (3.9 ± 0.7) and day 7 (3.7 ± 1.3).
WHC and cook loss
The water content of a meat product affects the final yield (loss of water implies financial loss) and product quality (i.e. changes in WHC can affect appearance, juiciness and tenderness), making it an essential quality parameter (Cheng and Sun, 2008). In the current study, the losses during cooking of C and S turkey were 5.4 ± 0.7% and 6.3 ± 1.2%, respectively. While the difference between the cook loss values was statistically non-significant (P ≥ 0.05), the slightly lower yield of the S turkey during large-scale production could be commercially significant. Also, the moisture content of the final product was significantly lower in the S formulation (P = 0.0001) (Table 2).
WHC was significantly higher (P = 0.021) for S (94.0 ± 1.8%) compared with C (91.6 ± 2.1%). These results indicate that the juiciness of the turkey has been affected by the plant sterol addition. The ability of the S samples to hold a greater percentage of moisture after centrifugation might be due to the fact that the S samples contained less meat to begin with (Table 1) and therefore contained less water than the C samples.
Plant sterol content
The effect of storage on the plant sterol content of S turkey
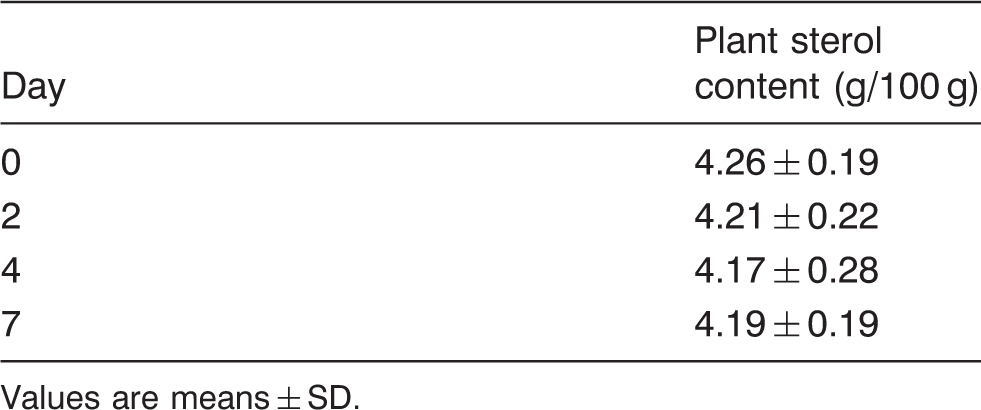
Values are means ± SD.
It is essential that the bioactive compound added to the functional food matrix maintains its original chemical structure and consequent functionality during the entire shelf-life period (Botelho et al., 2014). As is evident from the table, plant sterols were retained and were present at the level required for the cholesterol reduction claim. Plant sterol content did not significantly vary during the seven-day shelf-life study (P = 0.719; Table 4) and was present in the S product at, on average, 4.2%. Like all unsaturated lipids, sterols are prone to oxidation, forming a group of compounds called phytosterol oxidation products (POPs) by auto-oxidation (initiated by heating and storage) and/or photo-oxidation (initiated by exposure to sunlight, artificial UV light or irradiation) (Ryan et al., 2009). Thus, even though the level of plant sterol oxidation encountered is usually low (<2% of the original plant sterol content) (Botelho et al., 2014) and the biological effects of POPs are still unclear and contradictory, it is known that POPs are structurally similar to cholesterol oxidation products (COPs), compounds implicated in the initiation and progression of diseases such as atherosclerosis, neurodegenerative processes and diabetes (García-Llatas and Rodríguez-Estrada, 2011). POPs and COPs were not measured in this study and it is possible that plant sterols and/or cholesterol underwent oxidation during preparation, processing and/or storage of this enriched meat product, although possible POPs formation was not reflected in a reduction of plant sterols levels. Botelho et al. (2014) recently evaluated the plant sterol content of plant sterol-enriched chocolate samples at the beginning and after 150 days of storage at 30 ℃. Similar to our study, the plant sterol values observed at the end of shelf life were not significantly different to the values found at the beginning.
Another study in accordance with this research is by Gonzalez-Larena et al. (2012), where no loss in total plant sterol content was noted during the six-month storage of three plant sterol-enriched functional beverages kept at three different storage temperatures (4, 24, and 37 ℃). The beverages were skimmed milk with fruit juice and plant sterols, fruit juice and plant sterols, and skimmed milk with plant sterols.
Rudzińska et al. (2014) carried out a study on the stability of plant sterols in plant sterol-enriched margarines and found that during the 18-week storage, 20% of the total plant sterols was lost during refrigerated storage (4 ℃) and 31% during storage at 20 ℃. These results are in contrast to our results, but the difference may be due to the high unsaturated fatty acid content of the margarines (80% of total fatty acids). The authors monitored the stability of the fatty acids in the margarine and found that an increase in the storage time was accompanied by a decrease in the amount of polyunsaturated fatty acids. A similar free radical-mediated oxidation mechanism for fatty acids and plant sterols suggests that free radicals may stimulate oxidative degradation of both plant sterols and fatty acids (Dutta, 2004). In contrast, our S turkey contained small amounts of fat (∼2%) and in Botelho’s work, the chocolate contained high levels of fats (∼33%) but ∼50% of these were in the saturated form; therefore, in both cases, oxidative degradation may have been less likely to occur. In the present study, the presence of 0.5% tocopherol in the plant sterol powder may also have offered protection against plant sterol oxidation.
Menéndez-Carreño et al. (2008) found that the highest loss of sterols in plant sterol-enriched milk (60% of the total amount) was caused by severe heat treatment (2 min in a microwave oven at 900 W or 15 min of electrical heating at 90 ℃), while with usual heating conditions (1.5 min in a microwave oven at 900 W) the sterol loss was 30% of the total amount, but the plant sterol content was maintained at physiologically active values (301 mg/100 g of milk). The authors also found that an oven treatment for 24 h at 65 ℃, (equivalent to 1 month of storage at room temperature) reduced the plant sterol content by only 4%.
Different studies show that the stability of plant sterol-enriched foods towards oxidative processes is influenced by several factors, among them the type of plant sterols used (free or esterified) (Gonzalez-Larena et al., 2011), the temperature reached during processing, storage or domestic re-heating (Menéndez-Carreño et al., 2008) and the food matrix to which the sterols are added (fat content of the matrix and its degree of saturation) (Botelho et al., 2014).
Sensory analysis
Tests carried out on C and S samples aimed to investigate if untrained panellists could detect a difference between the two formulations and the extent of this difference.
The results of the difference-from-control test are summarised in Figure 3. S samples were considered significantly different from C in all parameters considered (overall difference, colour, texture and flavour) (P ≤ 0.0001). If the ‘placebo’ effect is removed, and therefore the average S samples scores minus the average C samples scores are considered, overall S samples were considered different from C by less than 2 scale units in all parameters considered. This indicates that overall the panellists considered S samples to be quite similar to C samples. In particular, while the overall sensory difference between S and C samples was considered to be on average 1.8 (close to ‘small difference’), the specific sensory differences between C and S samples on colour, texture and flavour were considered 1.4, 1.6 and 1.8, respectively. These results show that S and C samples were considered to differ mostly on flavour (1.8 = close to ‘small difference’), while for texture and colour the intensity of difference was slightly lower (1.6 and 1.4 are between ‘very small difference’ and ‘small difference’). Therefore, the plant sterol addition had an overall effect on the sensory quality of the product, while specifically the flavour, texture and colour were affected to a different extent by the plant sterol addition.
Difference from control test on sensory parameters (overall difference, colour, texture and flavour) for cooked S and C deli-style turkey slices. Errors bars indicate SE. **** P ≤ 0.0001.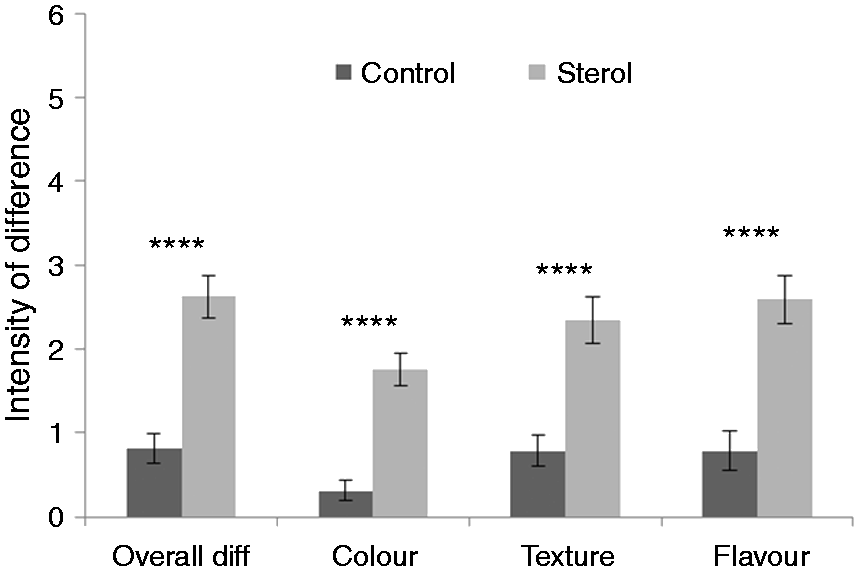
Conclusions
In this study, a plant sterol-enriched turkey product was developed. The plant sterol concentration in the final product was above the minimum level required by EFSA for a health claim on cholesterol reduction. The plant sterol addition affected the texture, oxidative stability and sensory difference-from-control test of the final product. The European legislation does not currently permit the sale of plant sterol-enriched meat products with a health claim; a novel food authorisation or a simplified ‘notification’ is required. However, plant stanols, which are associated with the same EFSA cholesterol-lowering health claim as plant sterols, are not subject to the same legislation as plant sterols and their use in foods is not restricted. Thus, plant stanol-enriched meat products could potentially enter the cholesterol-lowering food market without the need to undergo the lengthy novel food authorisation process for plant sterol inclusion in meat products (Grasso et al., 2014). While there is potential for the development of a cholesterol-lowering functional meat product that could have a favourable impact on consumer health, future work could focus on exploring the sensory characteristics and acceptability of this product.
Footnotes
Declaration of conflicting interests
The author(s) declared no potential conflicts of interest with respect to the research, authorship, and/or publication of this article.
Funding
The author(s) disclosed receipt of the following financial support for the research, authorship, and/or publication of this article: The financial support of Food Institutional Research Measure of the Irish Department of Agriculture, Food and the Marine (project 11/F/035) is gratefully acknowledged.