
Abstract
The objective of this study was to evaluate the effect of the incorporation of different microalgae on physicochemical and textural properties of bread. Four species of microalgae Isochrysis galbana, Tetraselmis suecica, Scenedesmus almeriensis, and Nannochloropsis gaditana were used in this study. Properties such as water activity, pH, microbiological counts, viscosity, and color were analyzed to determine the effect of microalgae addition on sourdough. The technological quality of breads was analyzed in terms of physicochemical properties, color, texture profile, and porosity. The main effect of microalgae addition was changes in bread color, crust, and crumb that implies an increase of browning and an evolution to more green-yellow tonalities. The textural parameters of breads such as hardness, chewiness, and resilience are not modified by microalgae addition.
Keywords
Introduction
Bread is the most frequently consumed bakery product in many countries. In recent years, different healthy ingredients have been used in the production of bread to enhance its nutritional profile or to confer functional properties. Microalgae have received increasing attention because they represent one of the most promising sources of compounds with biological activity that could be used as functional ingredients (Buono et al., 2014; Da Silva Vaz et al., 2016; Pulz and Gross, 2004). Their balanced chemical composition (good quality proteins, balanced fatty acid profiles, vitamins, antioxidants, and minerals) and their interesting attributes can be applied in the formulation of novel food products (Da Silva Vaz et al., 2016; Spolaore et al., 2006).
Microalgae are photosynthetic microorganisms with an important role as primary producers in most aquatic food webs. They are characterized by a high diversity and are potentially a great source of natural compounds for several biotechnological and therapeutic applications (Borowitzka, 2013; Guedes et al., 2013; Raja et al., 2008). In fact, they convert inorganic substances into organic matter rich in lipids, proteins, carbohydrates, and other molecules. Because of their high nutritional value, microalgae have been widely used in aquaculture as food for molluscs, zooplankton, and early life stages of crustaceans and small fishes (Hemaiswarja et al., 2011). On the other hand, microalgae are considered as one of the prospective biological species for producing biofuel (Brennan and Owende, 2010). Among microalgae, the species Isochrysis galbana (Ig) is known to have good nutritional quality and has received increasing interest in aquaculture mainly due to its polyunsaturated fatty acid (PUFA) content (Liu and Lin, 2001; Sánchez et al., 2000; Yoshioka et al., 2012). It also has beneficial effects on human health and provides a good source of fish oil substitution in the human diet (Batista et al., 2013; Yu et al., 2010). In addition, Ig showed promising curative effects inducing weight loss, decreased glucose, triacylglycerol, and cholesterol levels in diabetic rats (Nuño et al., 2013). Cultivation of Ig has also been suggested for biodiesel production (Sánchez et al., 2013). Tetraselmis suecica (Ts) is a marine-based microalgae and is known to be able to tolerate salinity of 25–35%. The microalgae species has a relatively high lipid concentration compared to other microalgae species. Tolerance to high salinity, high specific growth rate, and lipid content of Ts makes it a good candidate for biofuel production (Zainan et al., 2015). The microalgae Scenedesmus almeriensis (Sa) was isolated in Almería (Spain). Some remarkable characteristics of this species are its high lutein (0.53% dry mass (DM)) and carotenoid (0.69% DM) content, which make Sa an interesting alternative for the production of carotenoids (Sánchez et al., 2008), the high productivity (3.6 mg l−1 day−1), and its tolerance to a wide range of environmental growth conditions. From a nutritional point of view, furthermore, this species presents considerable protein content (49.4% crude protein on DM basis) and a fatty acid profile with substantial amounts of linolenic acid, 18:3n3 (Sánchez et al., 2008). The high protein content, together with remarkable productivity, turns Sa biomass into a potential protein ingredient. Nannochloropsis gaditana (Ng) is found in a wide range of temperature and irradiance conditions in natural environments, with high pigment contents (carotenoids), thus suggesting that this microalgae is able to regulate its photosynthetic apparatus as a function of culture conditions (Camacho-Rodríguez et al., 2015; Lubián et al., 2000). Carotenoids have antioxidant properties and are therefore used in food and health preservation (Cerón et al., 2007). Ng is also appreciated for its ability to accumulate proteins, lipids (Fábregas et al., 2002), and PUFAs (Camacho-Rodríguez et al., 2015). The microalgae used in this work (Ig, Ts, Sa, and Ng) are not recognized as GRAS at the moment.
Then, the use of natural ingredients as microalgae exhibiting functional properties, providing specific health benefits, beyond traditional nutrients, is a very attractive way to design new food products, with an important market niche of the healthier foods, growing exponentially. One of the main issues regarding the application of functional ingredients in novel food products is their stability and resistance to severe processing conditions (e.g. high temperatures in bread production). So far, little research has been carried out regarding the effects of whole microalgae incorporation in flour-based products. Gouveia et al. (2007, 2008) studied the use of Chlorella vulgaris as coloring source in traditional butter cookies and the use of Ig as source of PUFA in traditional biscuits. Rodríguez De Marco et al. (2014) use spirulina biomass to enhance the nutritional profile of bread wheat pasta. Ketabi et al. (2008) analyzed the effect of microalgae exopolysaccharides in rheological properties of sourdoughs.
The aim of this work was to use four different microalgae biomass (Ig, Ts, Sa, and Ng) as new functional ingredients to evaluate how the addition of microalgae to bread dough affected the technological quality of this product.
Materials and methods
Materials
Ig, Ts, Sa, and Ng used in this study (Figure 1) were provided by Universidad de Almeria (Department of Chemical Engineering, University of Almería, Almería, Spain). The microalgae were obtained from the Marine Culture Collection of the Institute of Marine Sciences of Andalucía (CSIC, Cádiz, Spain) and produced in an industrial size outdoor tubular photobioreactor, in continuous mode on Almería (Spain). The biomass was daily harvested by centrifugation, then being freeze-dried and stored at 18 ℃. The content of protein, carbohydrates, and lipids (P/C/L) in percentage for freeze-dried microalgae used was 53/13.5/13 for Ig, 37.6/31.6/6.7 for Ts, 48.3/38.3/10 for Sa, and 52/12/28 for Ng. Freeze-drying biomass was used as raw material (Acién et al., 2012). The level considered of its use in sourdoughs was 1.5% to obtain a final level of 0.6 g of microalgae in 150 g of bread. C. vulgaris and Arthrospira platensis (spirulina) were taken as reference to define this level of use because they are recognized as GRAS as an ingredient in food in a level of use of 1.35 g (dairy intake) for Chlorella and 0.5–3 g serving−1 for spirulina (USFDA, 2011, 2012).
Micrographs of microalgae used. (a) Isochrysis galbana (Ig), (b) Tetraselmis suecica (Ts), (c) Scenedesmus almeriensis (Sa), and (d) Nannochloropsis gaditana (Ng).
Wheat flour (Haricecu type H) was provided by Harinera Segorbina S.L. (Castellón, Spain). The alveographic parameters were W 110 ± 18 and P/L 0.2 ± 0.1. Salted water (Mediterranea Agua de Mar) was provided by Marevendis Agua de Mar S.L. (Alicante, Spain). It is a commercial solution of purified and sterilized seawater with a 5% salt content (86% NaCl and 14% other minerals).
Sourdough and bread preparation
A local master baker (Horno San Bartolomé, Valencia, Spain) provided sourdough starter. This starter was made with water and apple 50% and flour 50% and spontaneously fermented. Five sourdoughs were prepared, one without microalgae (control) and four with 7.5 g of microalgae (Ig, Ts, Sa, or Ng) added in 500 g of sourdough starter (1.5% w/w). The mix was stored 24 h at 8 ℃ and 80% relative humidity. Apart from the first fermentation, the operation named “back-slopping” (or “refreshment”), consisting in the inoculation of flour and water with an aliquot of previously fermented dough, is repeated before each fermentation step (De Vuyst et al., 2009). After 24 h, sourdoughs were tempered 2 h at 25 ℃ and fed with water and flour (15 g of both) to raise its activity. This mix was used to study the characteristics of sourdough with microalgae. For bread elaboration, 40 g of each sourdough were mixed with 100 g of wheat flour and 50 g of salted water with a spiral mixer (Kenwood Classic Chef KM331, Kenwood Limited, New Lane, UK) during 10 min. This dough (190 g) was shaped into loaves (63 g) and left to ferment at 9 ℃ during 20 h (slow fermentation) at 75% relative humidity. After, doughs were maintained at room temperature (25 ℃) during 2 h and 75% relative humidity. Finally, the leavened products were baked in rectangular molds (11 cm long, 6 cm wide, 3 cm height) at 210 ℃ during 25 min in an oven steamer (Convotherm OES 6.06 mini CC, Convotherm Elektrogeräte GMBH, Eglfing, Germany) and cooled. Three breads for each formulation were obtained with this process. The process was replicated as necessary to obtain enough samples to analyze the different parameters considered in this study.
Physicochemical analysis
The moisture content was determined by vacuum oven drying at 70 ℃ until constant weight (AOAC, 1997). For determination of pH, 10 g of bread sample was homogenized in 90 ml distilled water in the ratio 1:9 (w/v) using laboratory warring blender. The measurement of pH in sourdough was made directly on a sample of 100 ml. The pH was measured using a Consort C830 pH-meter (Consort n.v. Parklaan, Turnhout, Belgium) by inserting the electrode into the homogenates (AOAC, 1995). Water activity was determined using an AquaLab Dewpoint Water Activity Meter 4TE (Decagon Devices, Inc., Pullman, USA) (AOAC, 1998). Viscosity was measured with a rotational viscometer Fungilab Alpha L Smart Series (Fungilab S.A., Barcelona, Spain) and results were expressed in cP. Measurements were taken at 20 ℃ using a spindle L4 at constant rate of 12 r min−1. Total titratable acidity (TTA) was determined using an automatic titrator Metrohm 902 (Gomensoro S.A., Madrid, Spain) after homogenization of 10 g of bread with 190 ml of distilled water and expressed as the amount (ml) of 0.1 M NaOH per gram of sample needed to reach the value of pH of 8.5. Samples were analyzed by triplicate.
Microbiological analysis
Microbiological counts of fermented sourdoughs were determined. Ten grams of sample were homogenized with 90 ml of sterile peptone water (1% (w/v) of peptone and 0.9% (w/v) of NaCl) solution. Total aerobic mesophilic bacteria (TAMB) counts were determined using plate count agar (PCA, Scharlau, Barcelona, Spain), after incubating for 48 h at 30 ℃ (ISO, 2013). Lactic acid bacteria (LAB) were determined on De Man Rogosa Sharpe agar (Scharlau, Barcelona, Spain) after incubation at 30 ℃ for 48 h (ISO, 1998). Cell densities of yeasts and molds were estimated on glucosed Sabouraud medium (Scharlau, Barcelona, Spain) after incubation at 25 ℃ for five days (ISO, 1987).
Color
Color was measured using a Minolta CM3600d colorimeter (Minolta Corp., Ramsey, NY, USA). The instrument was calibrated against a ceramic reference, illuminant C, before use. Results were given in the CIELab system for illuminant D65 and a 10° angle of vision (CIE, 1986). Registered parameters were L* (brightness: L* = 0 (black), L* = 100 (white)), a* (−a* = greenness, +a* = redness), and b* (−b* = blueness, +b* = yellowness). Also for sourdough and breads, the total color difference (ΔE) between samples with microalgae and control was calculated. For bread samples, the browning index (BI) in crust and crumb was calculated


For sourdough color, four doughs were measured in three different points for each formulation. For crust and crumb color, four breads of each formulation were measured in three different points.
Textural properties
Texture profile analysis (TPA) was performed in bread slices (25 mm thin) without crust using a TA-XTPlus Texture Analyzer (Stable Micro Systems Ltd, Godalming, UK) and software Texture Exponent Lite 32 (version 4.0.8.0). The samples were placed on the base plate of the analyzer with a cylindrical aluminum probe (SMS P/75, 7.5 cm in diameter) using a 50 kg load cell. The crosshead speed was 1.7 mm s−1, with a rest period of 15 s between cycles, and the deformation was 40% of the original length (Jekle and Becker, 2012). Six textural parameters were determined from each curve: hardness, adhesiveness, springiness, cohesiveness, chewiness, and resilience (Bourne, 1978). Six different breads for each formulation were used.
Crumb porosity
Breads baked with different microalgae were cut into slices vertically. The slices were placed over the glass of a scanner (HP Officejet 4636, USA) having a resolution of 300 dpi. The scanned image was analyzed using the software Image J (http://rsb.info.nih.gov/ij/; Abramoff et al., 2004; Braadbaart and Van Bergen, 2005) that uses the contrast between the two phases (pores and solid part) in the image. The scanned color image is first converted to gray scale. Using bars of known lengths, pixel values are converted into distance units. The largest possible rectangular cross-section of the bread slices was cropped. After adjusting the threshold, pore area as fraction of total area was determined using the software (Datta et al., 2007). Six samples were analyzed for each formulation.
Statistical analysis
The effect of the different treatments on several variables was obtained by analysis of variance, one-way ANOVA using the statistical package Statgraphics Centurion XVI ver. 16.2.04 (StatPoint Technologies Inc., Virginia, USA). In those cases where the effect was significant (p < 0.05) the mean values were compared using Multiple Range Tests and Fisher’s least significant difference procedure at 95% confidence level (p < 0.05).
Results and discussion
Sourdough properties
Sourdough CIE L*a*b* coordinates, total difference of color (ΔE), aw, and pH values for samples with microalgae; Isochrysis galbana (Ig), Tetraselmis suecica (Ts), Scenedesmus almeriensis (Sa) and Nannochloropsis gaditana (Ng) and control. Lightness (L*), green-red chromaticity (a*), blue-yellow chromaticity (b*) (Medium values of 12 replicates for color parameters and three replicates for aw and pH).
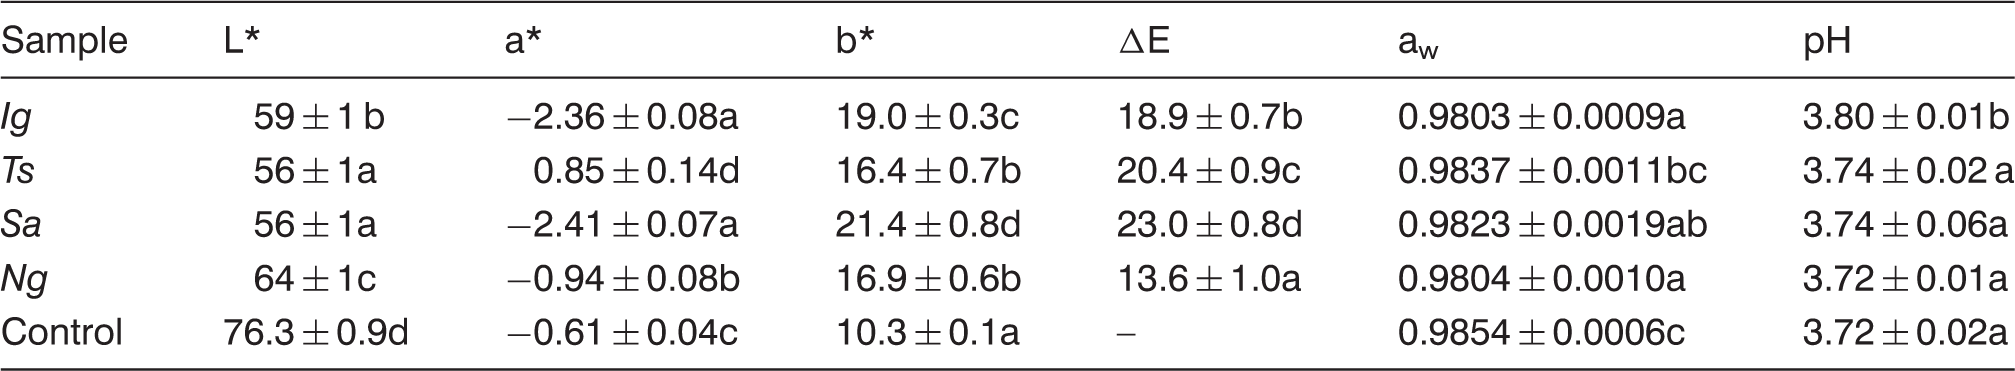
Note: Characters (letters) indicate the effect of microalgae addition. Values in the same column for each formulation with the same letter are not statistically different according to the Tukey’s test (p < 0.05).
Figure 2 shows apparent viscosity of sourdoughs. In general, the addition of microalgae increases viscosity of sourdough. The great increase was obtained with the addition of Ig. Adesanya et al. (2012) studying rheological properties of microalgae for the production of biofuels showed that even at low concentrations microalgae interaction plays a role in terms of viscosity enhancement. This is an effect to take into account because an excessive increase of viscosity in the sourdough can affect the characteristics of foam structure in the dough.
Sourdough viscosity of samples with different microalgae. Isochrysis galbana (Ig), Tetraselmis suecica (Ts), Scenedesmus almeriensis (Sa), and Nannochloropsis gaditana (Ng).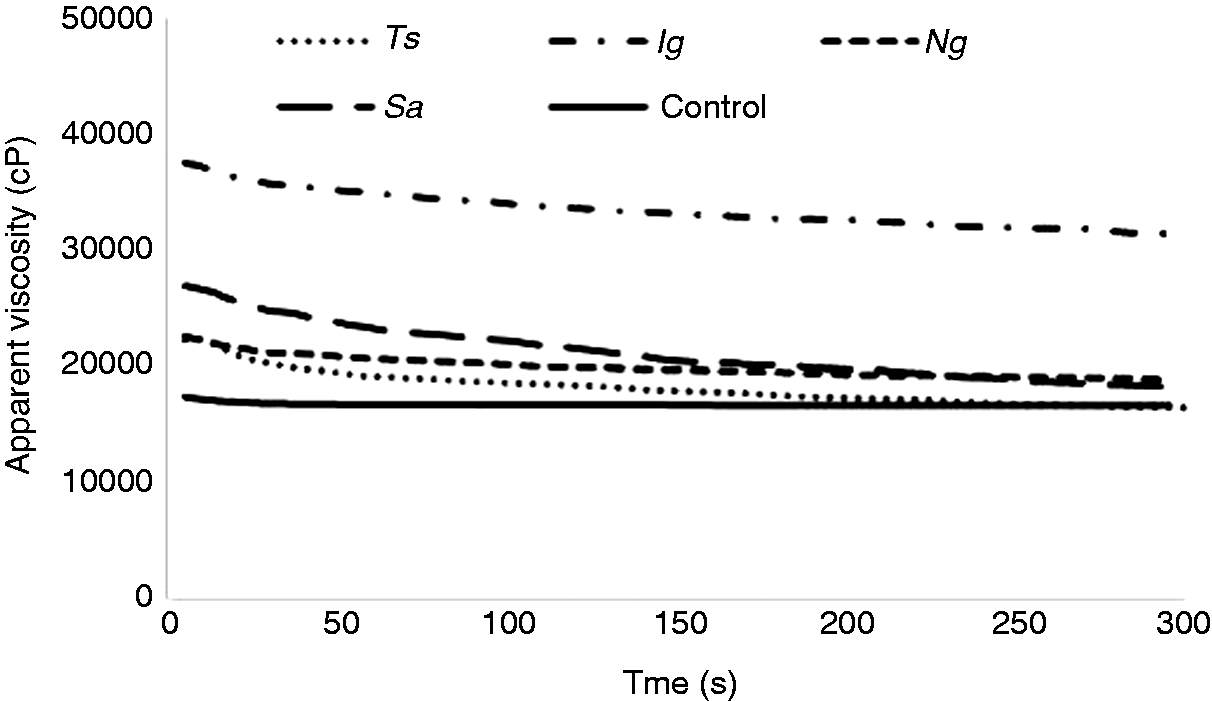
The results of the microbiological counts of the sourdoughs are reported in Figure 3. The total bacterial counts of the samples showed significant differences (p < 0.05) and ranged from 1.5 × 10⁷ CFU g−1 (control) to 6.3 × 10⁷ CFU g−1 (Sa). These results indicated a lighter increase of TAMB in the samples with microalgae. However, levels of TAMB were similar than observed in other studies (Gül et al., 2005; M’hir et al., 2007; Şimşek et al., 2006). Molds and yeast counts showed significant differences (p < 0.05) between the different samples analyzed. The reached values oscillated between 5.0 × 10⁶ CFU g−1 for sourdoughs with Ng to 7.9 × 10⁶ CFU g−1 for control and samples with Ig. Similar counts of these microorganisms have been show in other studies (Gül et al., 2005; Şimşek et al., 2006). The values of LAB counts ranged between 3.9 × 10⁸ and 1.0 × 10⁹ CFU g−1 and the sourdoughs with Ts and Sa showed higher values of LAB counts. As a rule, LAB is the predominant microorganisms and in many cases, yeasts are present in significant numbers (Vogel et al., 1996, 1999). LAB and yeasts are often associated in sourdough. The LAB/yeasts ratio generally varied between 10:1 and 100:1 (Gobbetti et al., 1994; Ottogalli et al., 1996; Pepe et al., 2004). In this study, the ratio was between 100/0.63 in the samples with Ts and Sa and 100/2 with control. In the case of samples with Ng this relation was 100/1. It is generally considered that the optimal ratio should be about 100:1 for optimal leavening and acidification activities (Rehman et al., 2006).
Microbiological counts of the sourdoughs. Isochrysis galbana (Ig), Tetraselmis suecica (Ts), Scenedesmus almeriensis (Sa), and Nannochloropsis gaditana (Ng). Characters (letters) indicate the effect of microalgae addition in each parameter and the same letters are not statistically different according to the Tukey’s test (p < 0.05).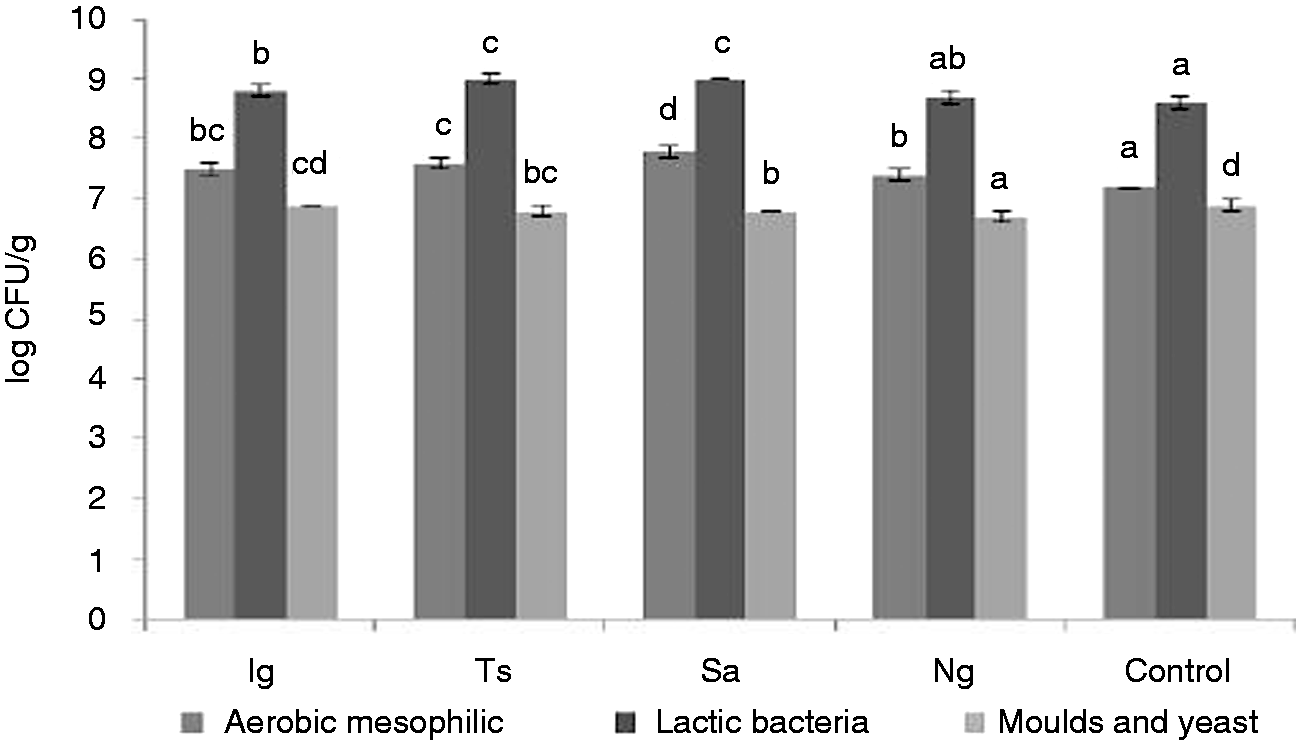
In good bakery practice, the levels of LAB and yeasts should be of 108–109 CFU g−1 and 106–107 CFU g−1 for acidification and leavening action of dough, respectively (De Vuyst and Neysens, 2005; Rehman et al., 2006).
The incubation of sourdough at low temperature (8 ℃) can significantly limit the growth of many LAB species (De Vuyst and Neysens, 2005; Rizello et al., 2016). Furthermore, as already observed (Corsetti and Settanni, 2007), the ratio between yeast and LAB populations in sourdough is greatly affected by temperature. Changes in color are the most significant effect of microalgae addition in sourdoughs. The analysis of L* (Table 1) shows that lightness decreased significantly (p < 0.05) with microalgae addition, which means that the addition of microalgae biomass resulted in darker sourdoughs. However, differences (p < 0.05) are found between microalgae been Ng the ones that provide more light sourdoughs and Ts and Sa the ones that provide more dark samples. The evaluation of a* parameter shows that microalgae, except Ts, significantly (p < 0.05) increase the sourdough’s green color (negative a* values) and the yellow tonality (b*) (Table 1). The ΔE values show perceivable color differences (ΔE > 3) with control for all sourdoughs with microalgae. In spite of that, the addition of the microalgae to the sourdough implies darker sourdough with an increase of yellow-green tonality.
Physicochemical properties of bread
Bread aw, moisture, pH, and total titratable acidity (TTA) values for samples with microalgae; Isochrysis galbana (Ig), Tetraselmis suecica (Ts), Scenedesmus almeriensis (Sa) and Nannochloropsis gaditana (Ng) and control (medium values of three replicates).
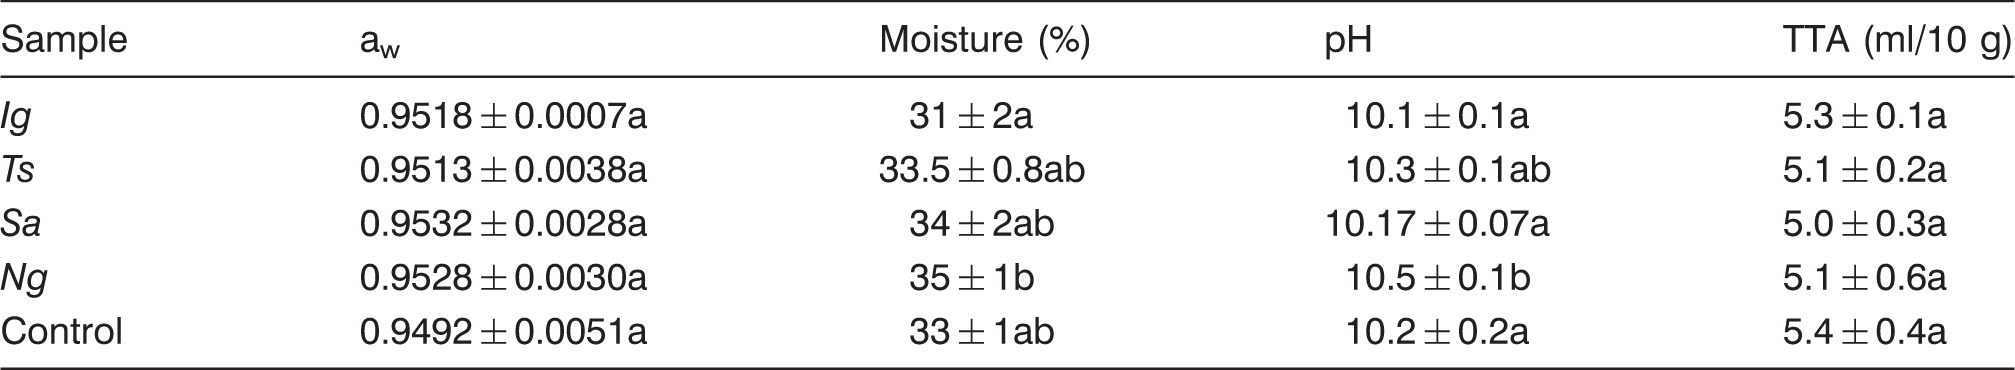
Note: Characters (letters) indicate the effect of microalgae addition. Values in the same column for each formulation with the same letter are not statistically different according to the Tukey’s test (p < 0.05).
Bread color
Browning index (BI), total difference of color (ΔE), and CIE L*a*b* coordinates for crust and crumb bread samples with microalgae; Isochrysis galbana (Ig), Tetraselmis suecica (Ts), Scenedesmus almeriensis (Sa) and Nannochloropsis gaditana (Ng) and control. Lightness (L*), green-red chromaticity (a*), blue-yellow chromaticity (b*) (medium values of 12 replicates).
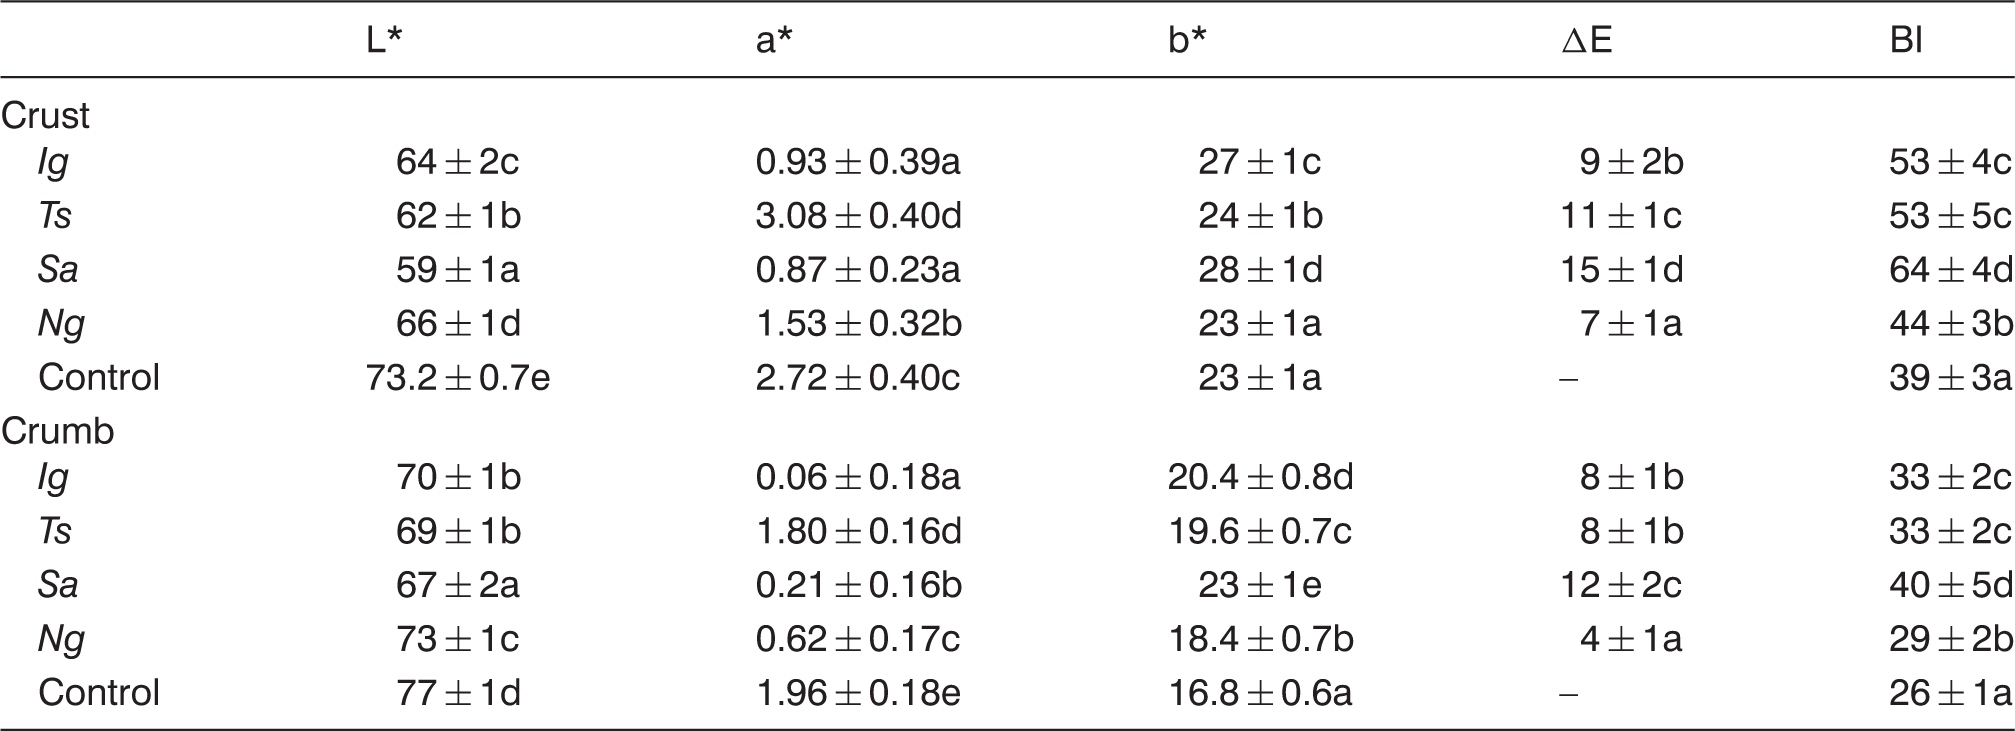
Note: Characters (letters) indicate the effect of microalgae addition. Values in the same column for each formulation with the same letter are not statistically different according to the Tukey’s test (p < 0.05).
Structural properties of bread
Crumb texture profile parameters of bread with microalgae; Isochrysis galbana (Ig), Tetraselmis suecica (Ts), Scenedesmus almeriensis (Sa) and Nannochloropsis gaditana (Ng) and control (Medium values of six replicates).
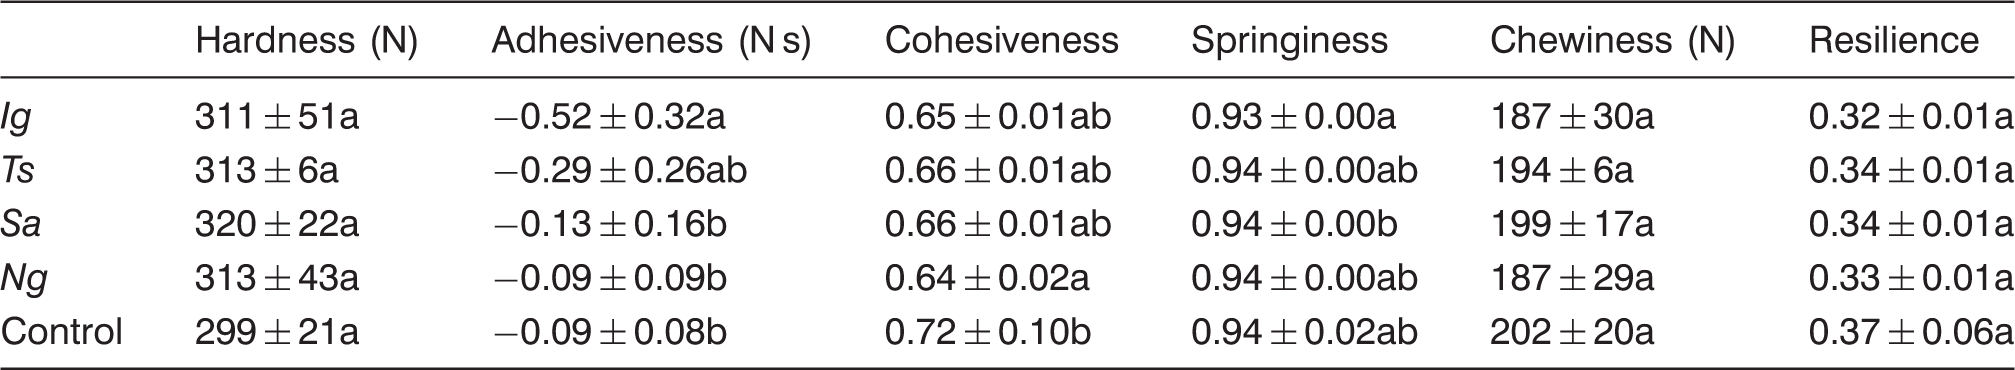
Note: Characters (letters) indicate the effect of microalgae addition. Values in the same column for each formulation with the same letter are not statistically different according to the Tukey’s test (p < 0.05).
Crumb cohesiveness reflects internal cohesion of the material. Bread with high cohesiveness is desirable because it forms a bolus, rather than disintegrates during mastication whereas low cohesiveness indicates increased susceptibility of the bread to fracture or crumble. Crumb elasticity is described by springiness and resilience (Bourne, 2002). A reduction in resilience or springiness characterizes loss of elasticity. Resilience is defined as the ratio of the area under the curve of the second half of the first cycle (upward stroke) to the first half (downward stroke) (Moore et al., 2004). On the other hand, springiness refers to the distance that the food recovers its height during the time that elapses between the end of the first bite (or compression) and the start of the second bite (Bourne, 2002). Since springiness is time dependent, its value is dependent on the time interval between the compression cycles. It is therefore obvious that breads can recover their springiness completely (i.e. 100%) if the time interval between the compression cycles is sufficiently long. However, this point of view is irrelevant under practical conditions because an adult makes about 1 chew s−1 (Bourne, 2002), which is considerably lower than the 5 s used in our texture profile analysis study. Changes in crumb chewiness reflected the changes in firmness, cohesiveness, and springiness because chewiness is a product of the three texture parameters (Bourne, 2002). Crumb chewiness reflects the energy required to masticate food to a state ready for swallowing. Chewy foods tend to remain in the mouth without rapidly breaking up or dissolving (Bourne, 2002). Adhesiveness is not a desired crumb attribute because its sensory equivalent is an undesirable moist and sticky crumb.
Crumb porosity of different breads with microalgae and control is shown in Figure 4. The obtained values of porosity were 16 ± 5% for Is, 19 ± 3% for Ts, 18 ± 4% for Sa, 14 ± 1% for Ng, and 12 ± 4% for control samples. There is no significant change in porosity (p > 0.05) comparing with the control porosity measured as percentage of surface space occupied by holes by surface unit. Porosity is caused by the production of the CO2 gas by yeast and some heterofermentative LAB. The CO2 content increases during fermentation as the pH drops (Farnworth, 2003). In the samples with microalgae, the gas was released in the same way than in control samples.
Crumb porosity of different breads with microalgae. (a) Isochrysis galbana (Ig), (b) Tetraselmis suecica (Ts), (c) Scenedesmus almeriensis (Sa), (d) Nannochloropsis gaditana (Ng), and (e) control.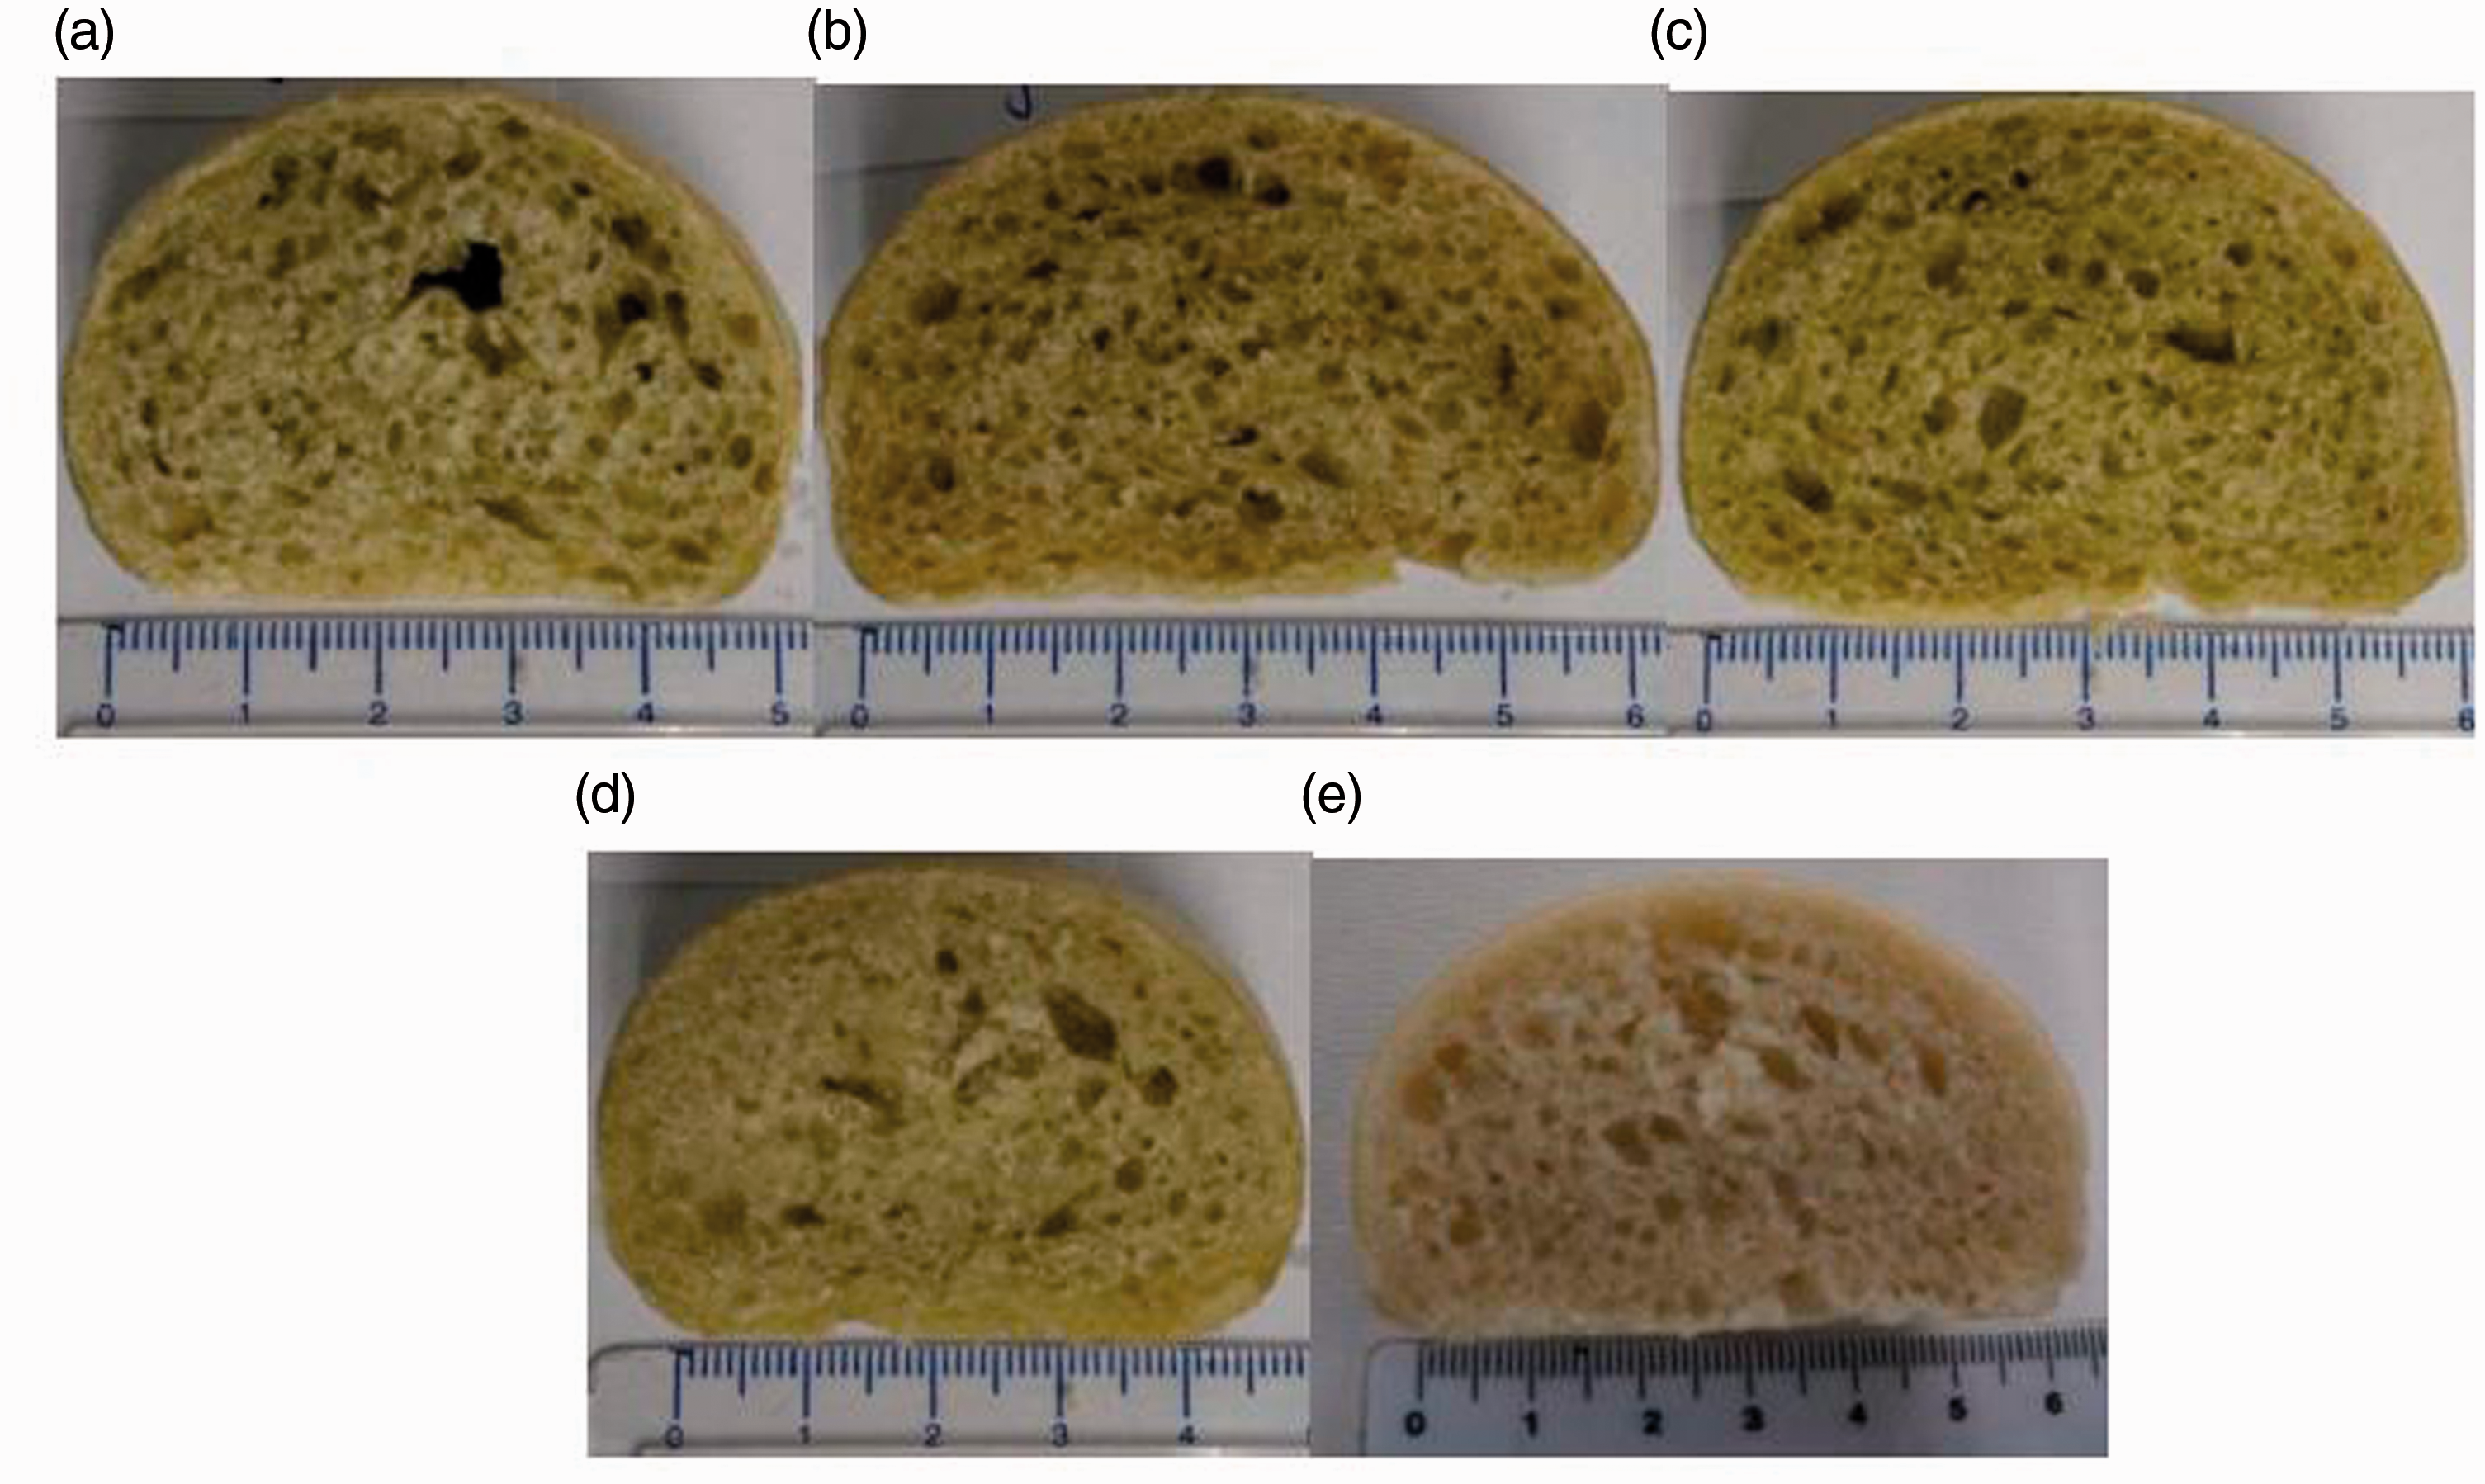
Conclusions
Microalgae represent a new ingredient in bread formulation as source of important natural compounds for human nutrition. Under conditions used in this study, their incorporation in bread formulation did not modify significantly physicochemical properties or microbiological counts of the sourdough. In general, addition of microalgae implies changes in color of bread related with a decrease of a* (redness) and an increase of b* (yellowness). These changes are related with the content of pigments in microalgae. The textural parameters of breads such as hardness, chewiness, and resilience are not modified by microalgae addition.
Footnotes
Acknowledgment
We thank Jesús Machi for their technical assistance with bread formulation.
Authors’ contribution
JMM, PGS, and JPM designed the experiments and discussed the results; IFL and PGS performed the experiments and summarized the results; JMM, PGS, JPM, and IFL contributed to analysis and interpretation of data, drafting the article, and revising it.
Declaration of conflicting interests
The author(s) declared no potential conflicts of interest with respect to the research, authorship, and/or publication of this article.
Funding
The author(s) received no financial support for the research, authorship, and/or publication of this article.