






Abstract
Tarhana is a traditional food produced by fermentation of a dough prepared by mixing wheat flour, yoghurt, tomato, paprika, onion and mint. The fermentation of mixture of natural products gives the tarhana an aromatized desired food characteristic. Therefore, we aimed to determine the effects of fermentation time at home and commercial scale on the aromatic volatile profile of tarhana. In this respect, nine different tarhana dough samples were prepared at home and commercial scale and analysed for volatile and organic acid composition during fermentation which were then evaluated by principal component analysis. In all dough samples, the lactic, succinic and acetic acids were the most produced organic acids while the amounts of ketones decreased, and the alcohols, in particular the esters, increased within fermentation. Particularly, ethyl-lactate and ethyl-acetate increased significantly as well as ethyl-caprylate, ethyl-capronate and ethyl-hexanote responsible for fruity and flower flavour were also accumulated. Tarhana doughs were clustered in two main groups after five days of fermentation with principal component analysis and these clusters remained stable until the end of fermentation. As a conclusion, fermentation time determines the desirable tarhana by ensuring the formation of aromatic volatiles particularly esters. It is necessary to ferment tarhana for at least five days in order to obtain typical aromatic properties.
Introduction
Traditional fermented foods are precious resource for providing inexpensive, practical and convenient nutrients in the modern world where famine threatens. Fermentation in particular enhances the nutritional value of the foods as well as effects aromatic characteristic in a natural way (Kabak and Dobson, 2011). In this sense, tarhana is a traditional fermented food, which is produced by mixing wheat flour, yoghurt, sourdough and various vegetables and spices (tomato, paprika, onion, mint, salt, etc.), then drying and grinding after the fermentation. In this process, fermentation is the main and critical step in the production where many biochemical reactions occurred. It has been assumed that the microbial activities in high nutritional composition may be responsible for the desirable aromatic property in tarhana which is consumed as an indigeneous instant soup by both adults and infants (Dağlıoğlu, 2000, Kabak and Dobson, 2011).
The major microbial constituents in tarhana fermentation are lactic acid bacteria (LAB) and yeast. This microflora produces the majority of the organic acid and alcoholic compounds in the tarhana dough. In addition, these microorganisms contribute to the development of the aroma by synthesizing minor acids and aldehydes in fermentation or through the effects of their proteolytic, lipolytic and amylolitic enzymes. The physical and chemical characteristics, the microbiological quality, nutritional value and microbial flora of tarhana have already been documented (Dağlıoğlu, 2000; Koca et al., 2002; Özel, 2012; Şimşek et al., 2012; Temiz and Pirkul, 1990). However, the formation of the volatiles during the fermentation that contribute to the characteristic taste and flavour of tarhana has not been highlighted.
There is a clear relationship between fermentation and the formation of volatiles in fermented foods. However, the concentration of volatiles varies during fermentation. For instance, acetoin, ethanol and acetaldehyde are the main flavouring agents in kefir (Güzel-Seydim et al., 2000). During the fermentation of sausages, the levels of propanal, pentanal, hexanal, ethyl 3-methyl butanoate, 1-octen-3-ol, 3-methyl butanoic acid, 2-methyl propanoic acid, ethyl hexanoate and nonanal increase (Olivares et al., 2009). Fermentation has been found to give a desirable flavour to sourdough – more so than to chemically acidified bread (Kirchhoff and Schieberle 2001; Rothe and Ruttloff 1983). Aldehydes, alcohols, ketones and carboxylic acids could be produced by the microbiota associated with sourdough during fermentation. Czerny and Schieberle (2002) reported that acetic acid, butanoic acid, phenylacetic acid, 2-methylbutanoic acid, 3-methylbutanoic acid and pentanoic acid increased during sourdough fermentation. In the production of kenkey (an African fermented food like a sourdough dumpling), pentanal, 2,4-decadienal (E,E), ethanol, 1-hexanol, benzaldehyde 2-decenal, 3-methyl-butanol, 3-methyl-3-butenol, propanol, 1-octanol, ethyl acetate, acetic acid, hexanoic acid and octanoic acid were found to increase after three days of fermentation of the maize (Annan et al., 2003).
The aroma-active volatiles of tarhana were only determined in sun-dried and vacuum-dried samples to determine the effect of the drying methods (Göçmen et al., 2014). In this study, 41 and 23 aroma-active components were detected in vacuum-dried and sun-dried tarhana samples. Most of these volatiles were aldehydes, esters, ketones, alcohols, terpenes, furan, phenols, sulphur compounds and acids. However, the volatile changes during fermentation in tarhana were not investigated. In this respect, the aim of this study was to determine the volatile aromatic compounds (VACs) and organic acid compounds (OACs) at different fermentation times of homemade and commercially made tarhana (HMT and CMT).
Materials and methods
Materials
Tarhana dough samples were obtained from five different homes that traditionally make tarhana (doughs A, B, C, D, E) and four different plants (doughs F, G, H, K) at six different fermentation stages (days 0, 1, 3, 5, 10 and 15). The workflow of both HMT and CMT tarhana production is shown in Figure 1. The materials used for tarhana production were supplied form the local markets. The tarhana dough samples were kept at −80 ℃ until they were analysed at the fermentation days on which they were provided.
The production steps of tarhana.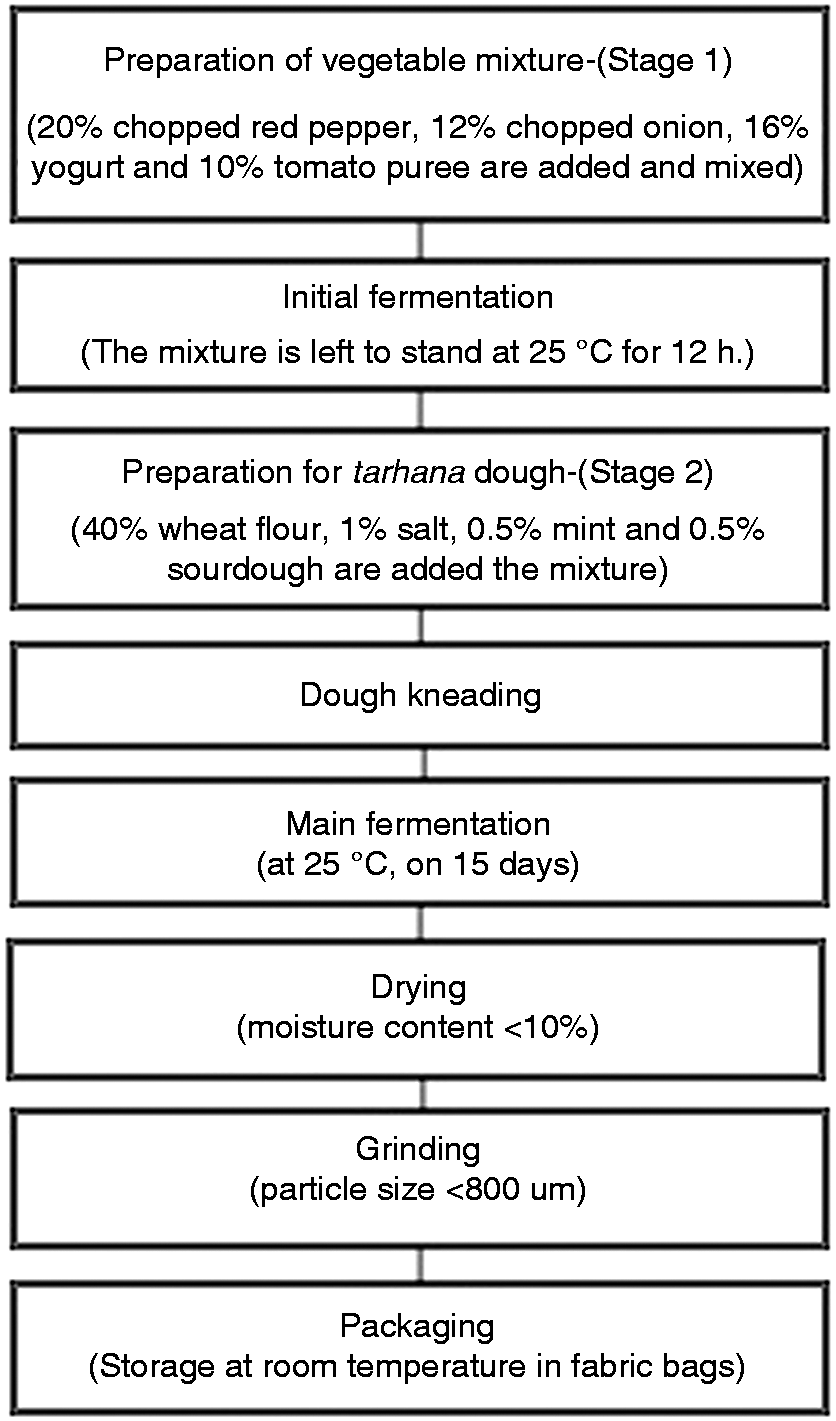
Methods
The acidity and pH analysis
The acidity values of the dough samples were determined according to the Turkish Standards (TS 2282), and the acidity of tarhana sample was expressed in terms of the extraction with 67% ethanol from the dough samples after NaOH titration (Anonymous, 1981). The acidity of tarhana dough samples was measured as acid equivalents S° (mL NaOH per g dough). A 10 g tarhana sample was homogenized with 50 mL of 67% neutralized ethanol. Then, the mixture was filtered and finally titrated with 0.1 M NaOH. The spent NaOH amount was multiplied by 5 to reach the acidity value of the tarhana dough samples.
The pH value of the dough samples was determined as follows: 25 mL of distilled water was added to a 5-g sample and homogenized using a mixer (Guangzhou Youjia Machinery Co., Ltd, HS-50A, Daihan, Korea). Distilled H2O (dH2O) was added to make a homogenous mixture of 50 mL, and the pH values were measured using a pH meter (Eutech Instruments Pte Ltd, Singapore).
The OACs analysis
The OACs were determined using high pressure liquid chromatography (HPLC) system. To extract the OACs from the tarhana samples, 10 g of samples were diluted in dH2O and homogenized for 180 s; 10 mL of homogenate was mixed with 5 mL of 0.1 mmol/L HCIO4 solution and centrifuged at 4000g for 15 min. Afterwards the pH of the supernatant was adjusted to 3 with 1 mmol/L HCIO4 and the total volume was completed to 25 mL using dH2O. The prepared extract (5 mL) passed through the solid phase extraction column (GracePureTM SPE Cation-X, Maryland, ABD). Finally, elution was loaded to HPLC (Shimadzu Corp., Kyoto, Japan) equipped with SPD-M 20A PDA detector and Shim-pack ODS-3 column (150 × 4.6 mm, Shimadzu Corp., Kyoto, Japan). The samples were run on HPLC system with 0.7 mL/min using mobile phase (0.013 mol/L H2SO4), and then the peaks were monitored at 210–280 nm. To calculate the organic acid concentrations in dough samples, the standard solutions of lactic, acetic, succinic, fumaric and formic acids (Sigma, ABD) were prepared to give concentrations between 1 and 5000 ppm and run on HPLC (r2 = 0.9985) (Özdemir et al., 2018).
The VACs analysis
VACs were determined using a modified method conducted by Plessas et al. (2008) using headspace sampling through solid-phase microextraction (SPME) using gas chromatography-mass spectroscopy (GC-MS). For each SPME analysis, 2 g of tarhana sample was put into a 20 mL vial and the SPME injector was inserted through the vial septum. The vial was then submerged into a 55 ℃ water bath and the SPME fibres (2 cm, 50/30 mm DVB/Carboxen/PDMS Stable Flex Supelco, Bellefonte, PA, USA) were subjected to headspace analysis for 55 min.
After the extraction process was completed, the fibre was placed in the gas chromotography injection chamber that was set to 250 ℃ for 10 min in splitless mode for thermal desorption of the volatile materials. Stabilwax columns (60 m, 0.32 mm id. 0.25 µm film thickness; Restek, USA) were used in the analysis of volatiles. Samples were run at GC-MS as follows: hold at 40 ℃ for 1 min, increase 7 ℃/min to 100 ℃ and hold for 5 min, increase 4 ℃/min to 130 ℃ and hold for 1 min, increase 2 ℃/min to 180 ℃ and hold for 1 min, increase 15 ℃/min to 250 ℃ and hold for 4 min. Helium at a flow rate of 3 mL/min was used as the carrier gas. The volatile peaks were identified using the libraries of National Institute of Standards and Technology, Wiley (Wiley Registry of Mass Spectral Data, 7th edition,) and FFNSC (Flavour and Fragrance Natural and Synthetic Compounds). The analysis system was validated using 4-methyl-2-pentanol as internal standards and the retention index (RI) was calculated as 976.
Statistical and model analysis
The differences between dough samples on different fermentation days were evaluated statistically using one-way analysis of variance, followed by Duncan's test. Analyses were carried out to a significance level of p < 0.05, using the software program SPSS (SPSS Inc., Chicago, IL, USA). Moreover, principal component analysis (PCA) (R-3.1.1) was performed to visualize possible relationships within the data matrix of volatiles and dough samples for each fermentation day. The eigenvalues of the correlation matrix, indicating the percentage of variability exhibited by each component, were shown on a screen plot.
Results and discussion
Acidity and pH values of HMT and CMT doughs during fermentation
The pH and acidity values of homemade and commercially made tarhana (HMT and CMT) doughs during the fermentation.
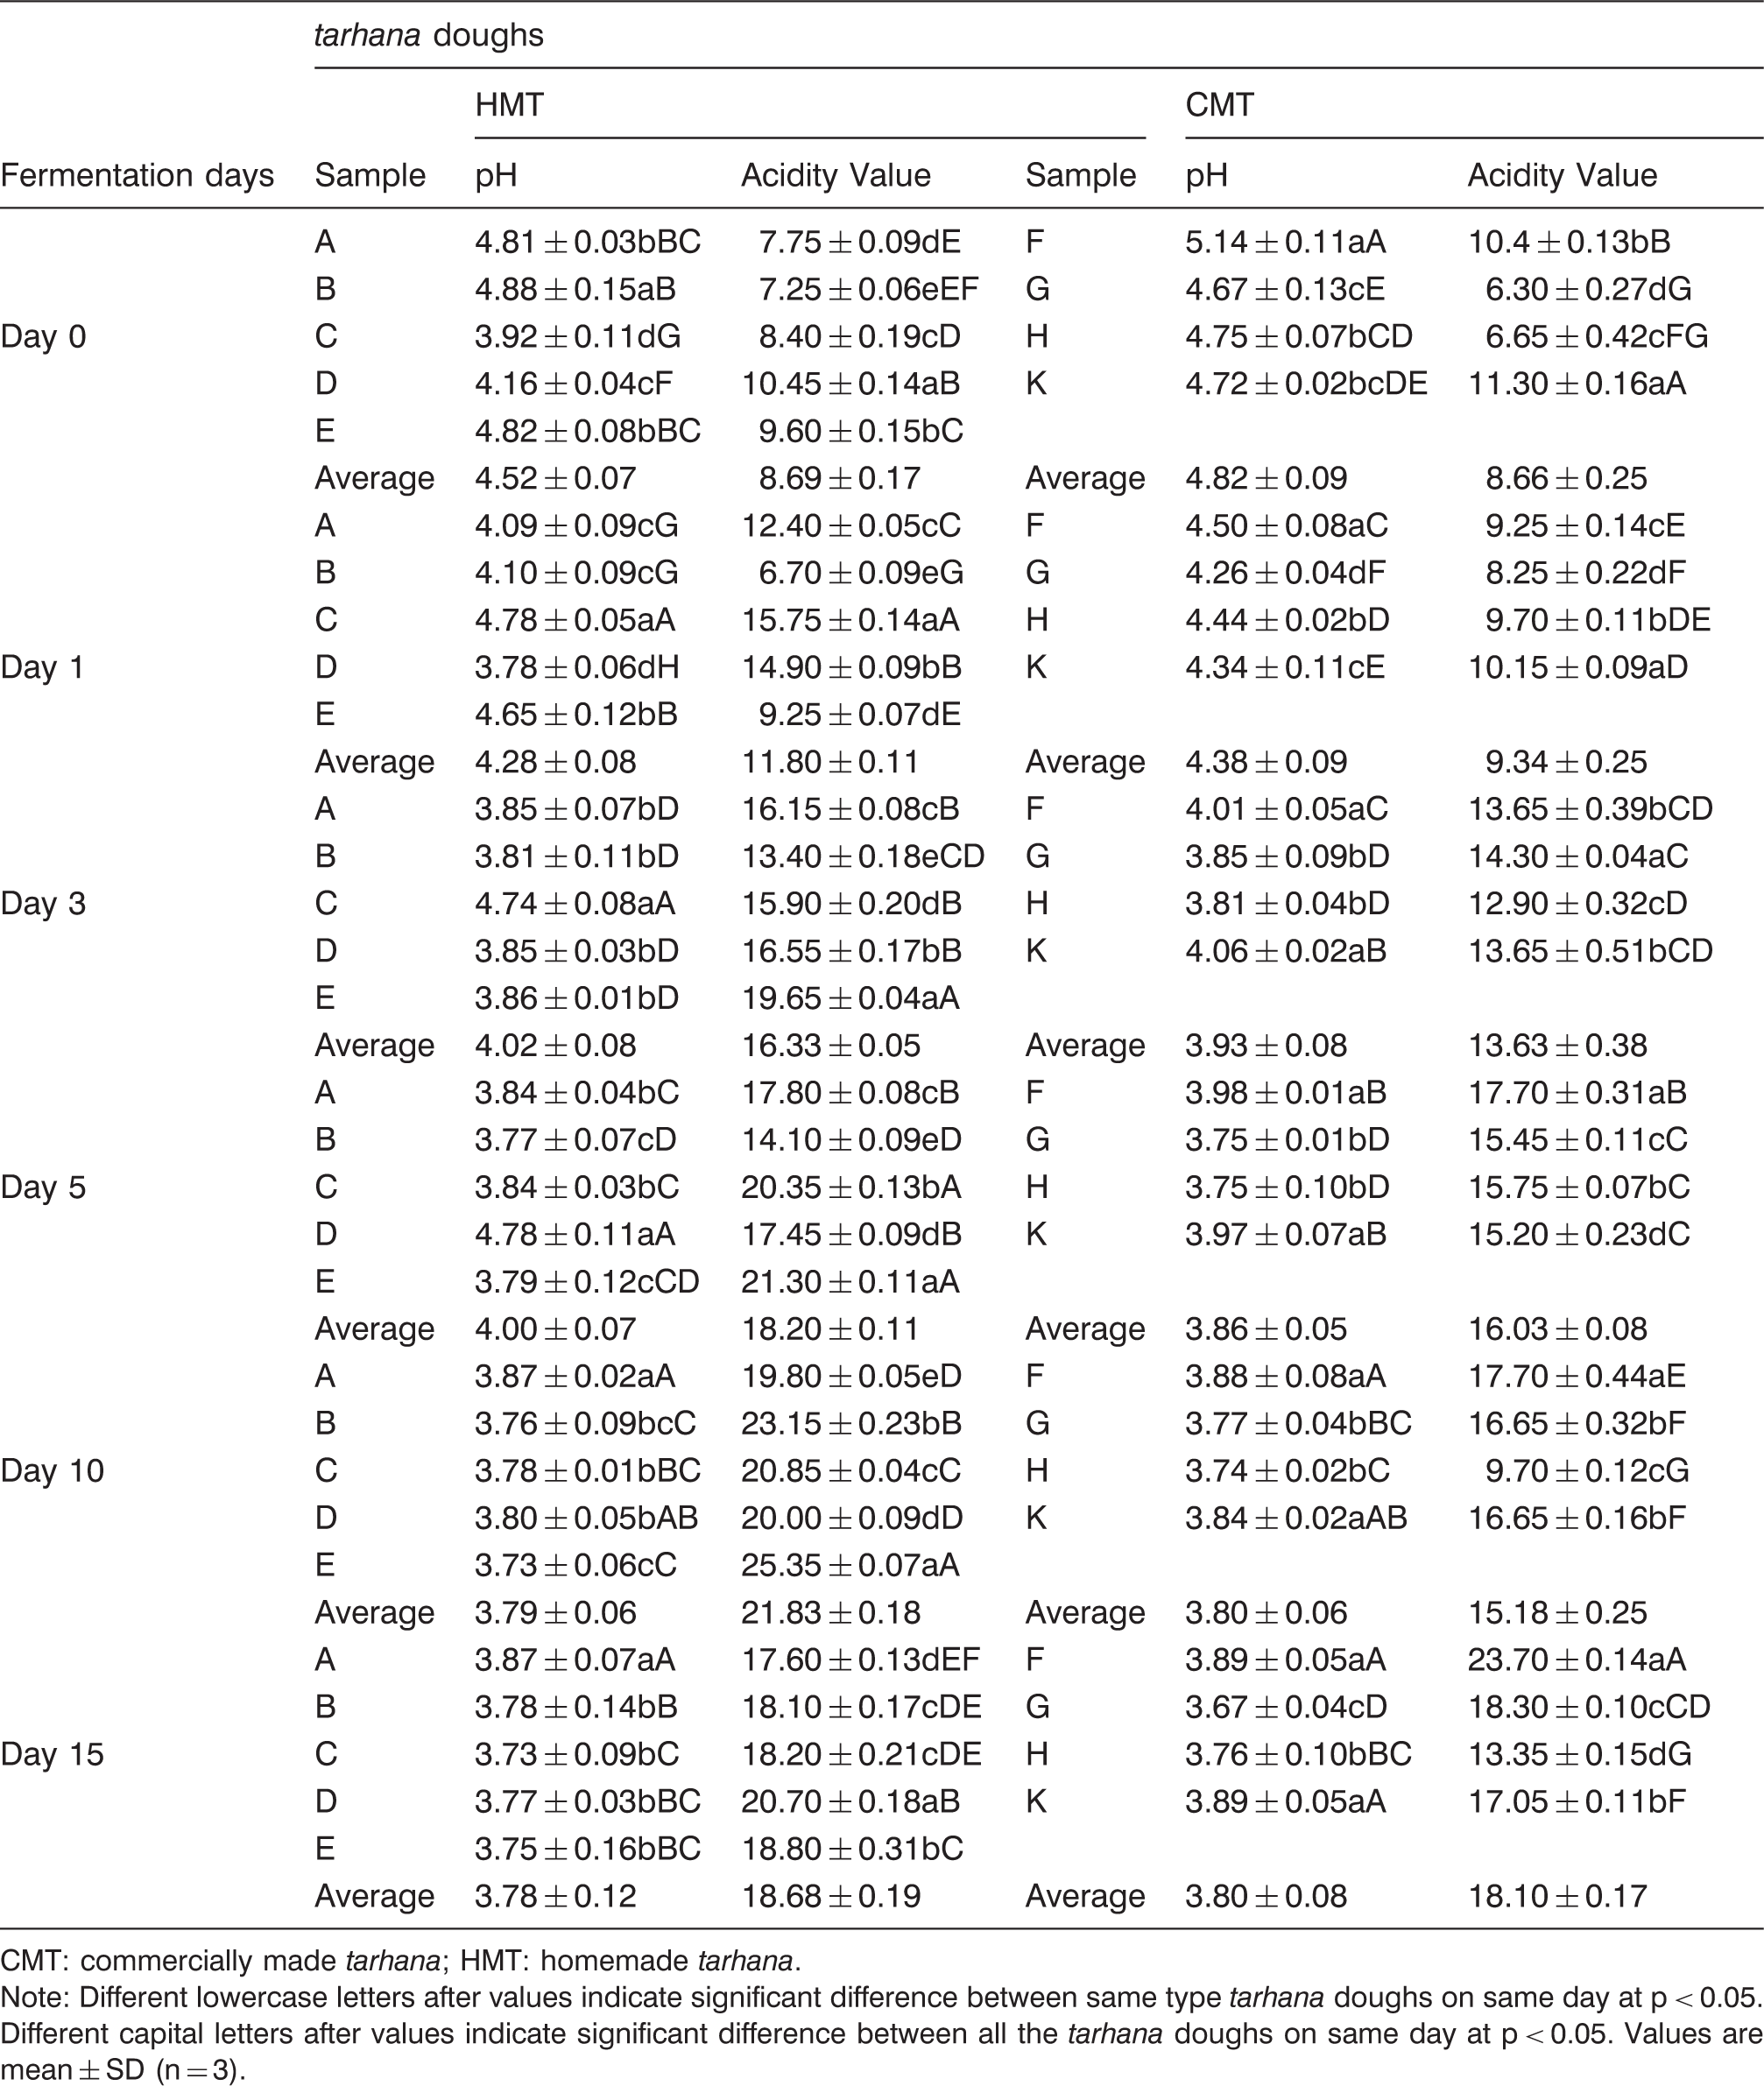
CMT: commercially made tarhana; HMT: homemade tarhana.
Note: Different lowercase letters after values indicate significant difference between same type tarhana doughs on same day at p < 0.05. Different capital letters after values indicate significant difference between all the tarhana doughs on same day at p < 0.05. Values are mean ± SD (n = 3).
Organic acid composition of HMT and CMT doughs during the fermentation
The amount of lactic, succinic and acetic acids increased significantly in all tarhana dough samples during the fermentation (Figure 2). However, the formic and fumaric acids were not. The lactic acid amount in tarhana dough samples reached four-fold at the end of fermentation except dough C. The majority amount of lactic acid in dough samples was produced at the initial five days of fermentation (p < 0.05). At the end of fermentation, the highest lactic acid amount was found in dough C (1151 mg/100 g), and the lowest was in dough H (703 mg/100 g). Also, the lactic acid content of HMT except dough D was significantly (p < 0.05) higher than the CMT dough samples. Accordingly, the lactic acid content of the HMT and CMT dough samples was averagely 994 and 856 mg/100 g, respectively (Figure 2(a)).
Organic acid compounds of HMT (A, B, C, D and E) and CMT (F, G, H and K) doughs during the fermentation: (a) lactic acid, (b) succinic acid and (c) acetic acid.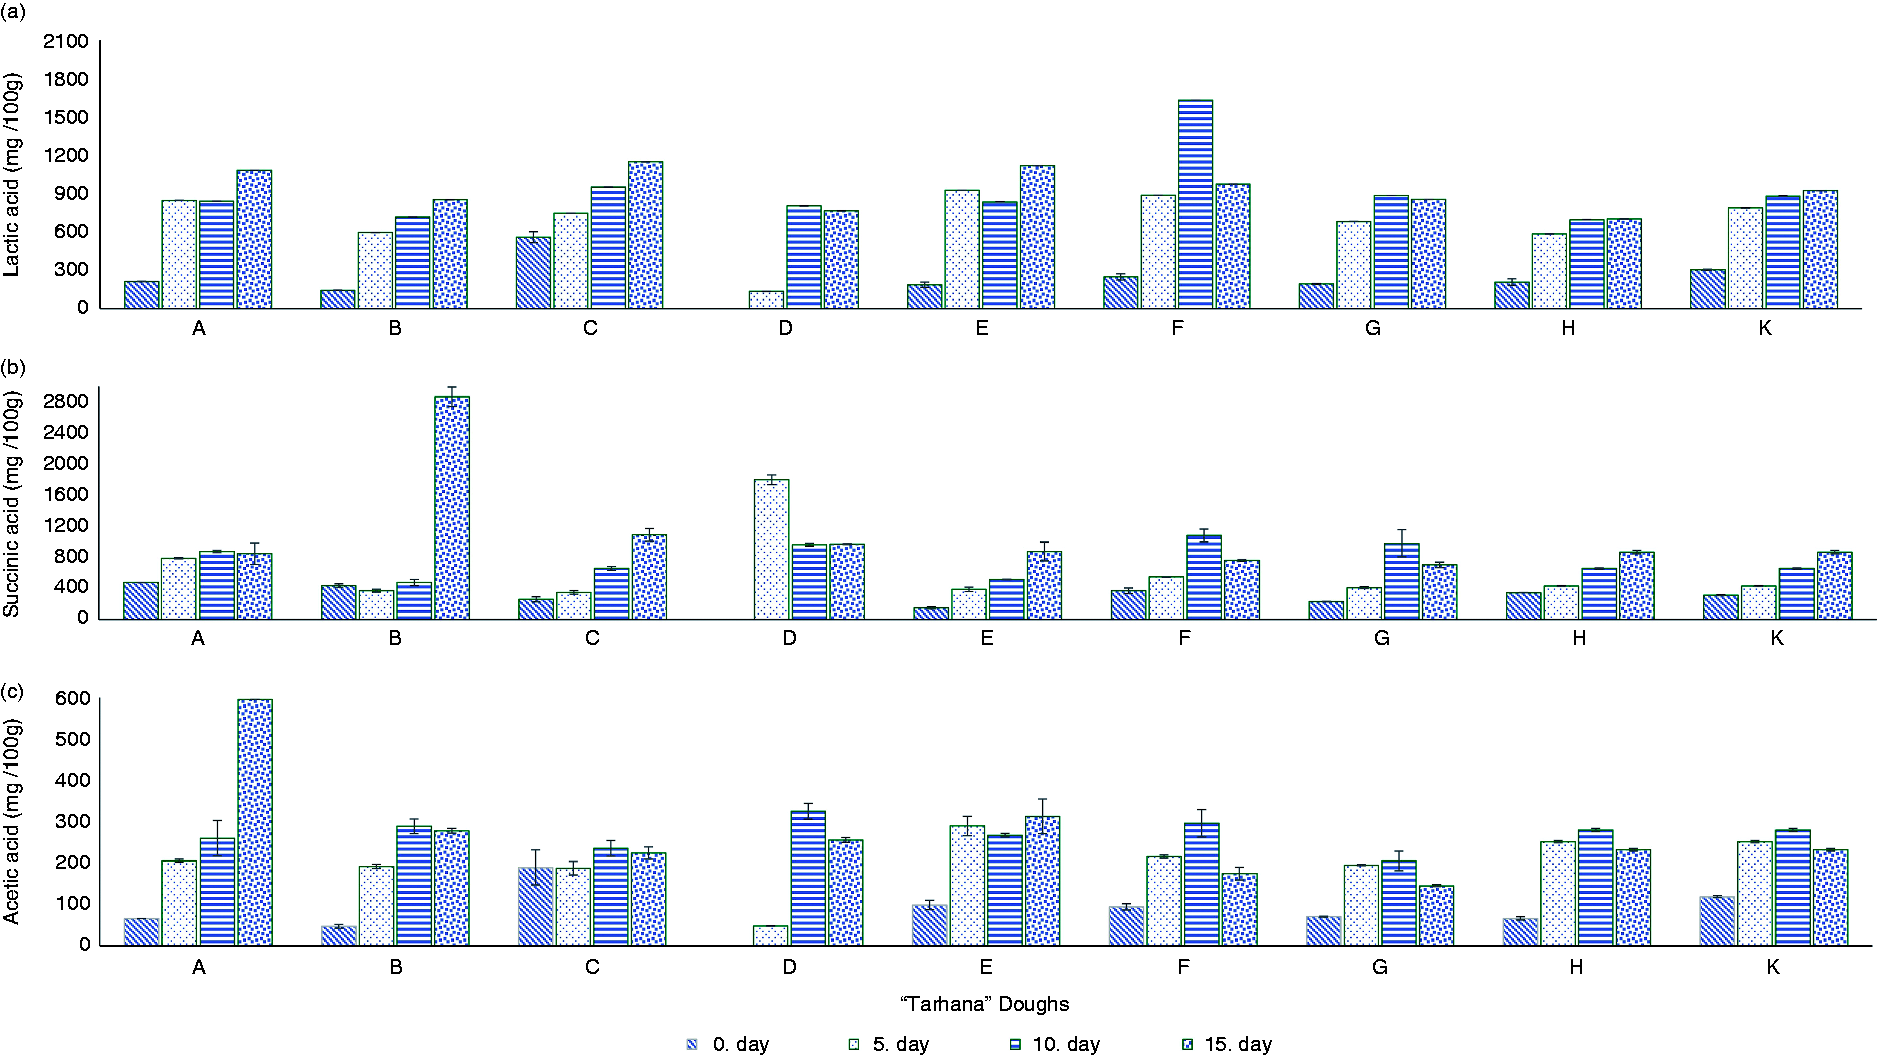
The second abundant OAC in tarhana dough samples was succinic acid (Figure 2(b)). This organic acid amount also increased in tarhana dough samples significantly with the fermentation. Especially, this increase was more noticeable in CMT dough samples (F, G, H and K dough). However, at the end of fermentation, HMT dough samples included higher succinic acid amount than the CMT dough samples. The amount of succinic acid was found highest in dough B (1434 mg/100 g) and lowest in dough G (702 mg/100 g).
The acetic acid also accumulated in all dough samples with the fermentation significantly (Figure 2(c)). The highest acetic acid amount was determined in dough A (595 mg/100 g) and the lowest in dough G (144 mg/100 g). Similarly, the acetic acid content of HMT dough samples was higher than CMT dough samples at the end of fermentation.
These results of lactic and acetic acid content and changes during the tarhana fermentation was consistent with previous studies (Erbaş et al., 2006; Kabak and Dobson, 2011; Magala et al., 2013). However, the high succinic acid amount in tarhana dough samples was reported for the first time. The yeast metabolism with glycosylate cycle may cause the accumulation of this relavant organic acid. The other is the conversion of pyruvic acid to succinic acid via oxaloacetic and acetic acid in the presence of electron acceptor citrate under anaerobic conditions by the LAB (Axelsson, 2004).
In general, the average lactic, acetic and succinic acid amounts of the HMT doughs were higher than that of the CMT doughs. This could be the result of microflora differences where CMT doughs were fermented with stable microflora but the HMT doughs include more wild type strains.
Volatile aroma composition of HMT and CMT doughs during the fermentation
Volatile aroma compounds of homemade and commercially made tarhana (HMT and CMT) doughs during the fermentation (%, percent area value). 4-methyl-2-pentanol was used as internal standard (IS) and retention index (RI) of IS was 976.
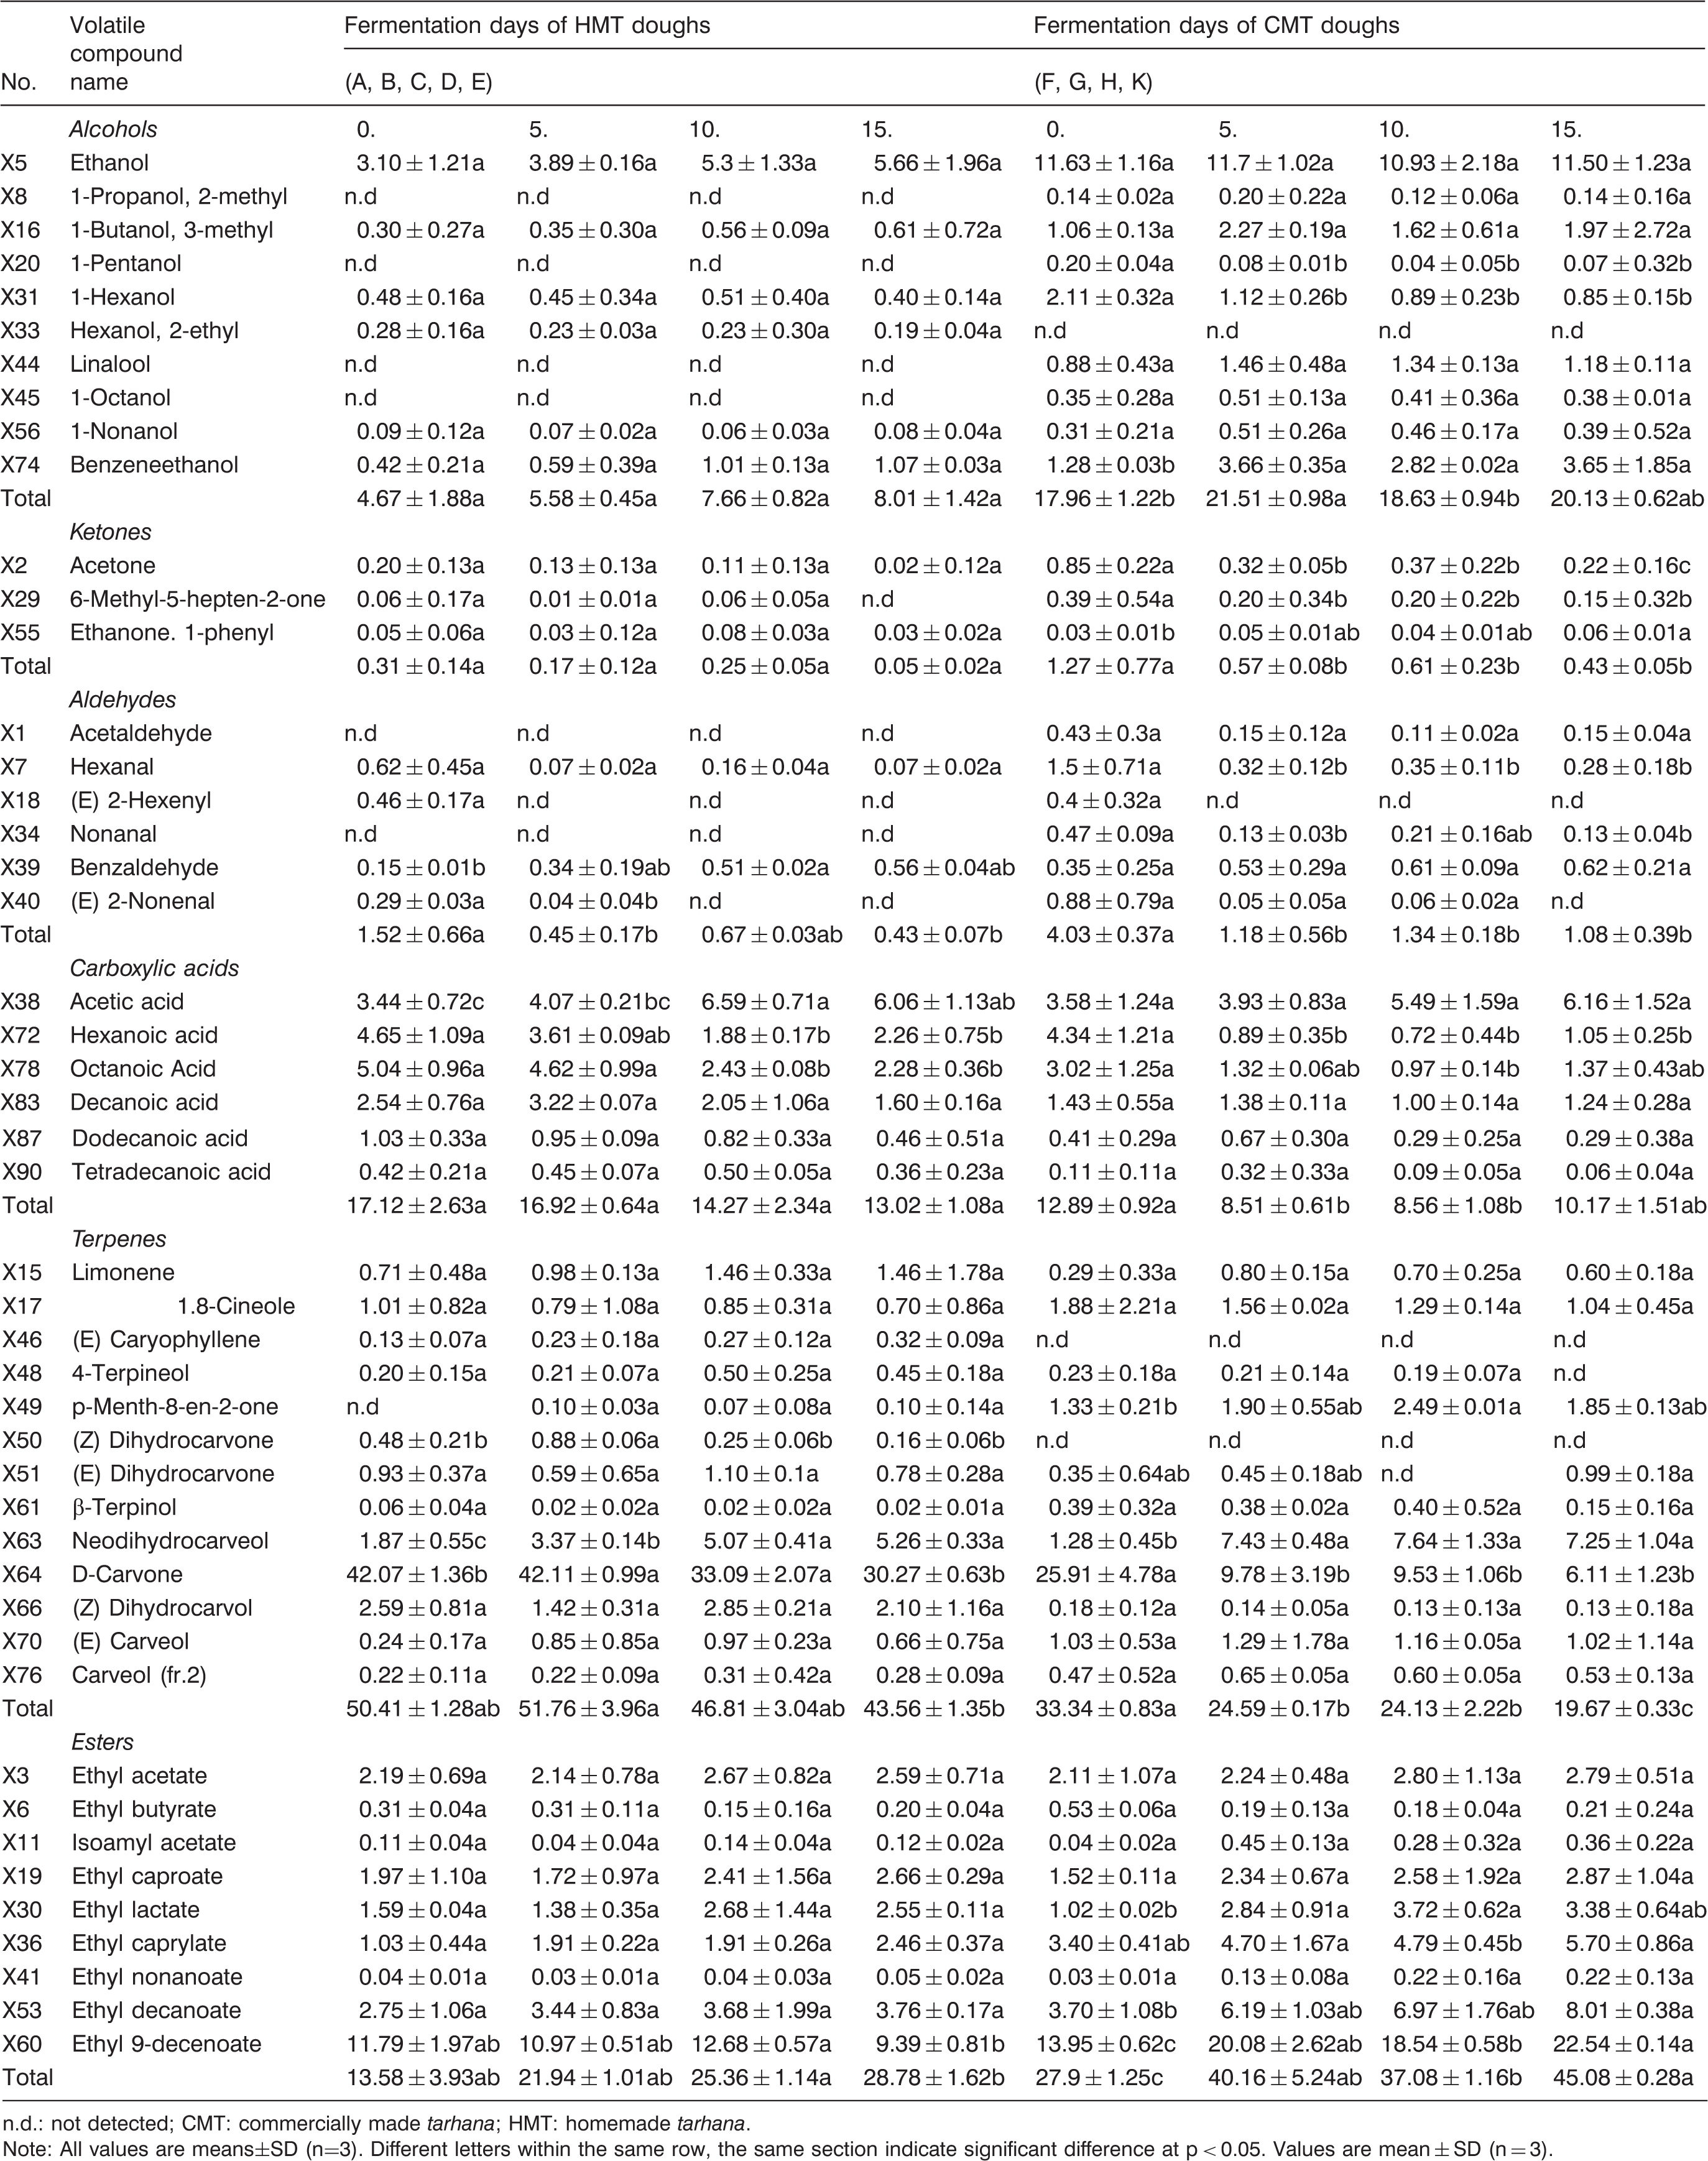
n.d.: not detected; CMT: commercially made tarhana; HMT: homemade tarhana.
Note: All values are means±SD (n=3). Different letters within the same row, the same section indicate significant difference at p < 0.05. Values are mean ± SD (n = 3).
The variations in the amount of VAC groups during the fermentation of tarhana indicated that some chemical reactions may be occurred between certain compounds or certain compounds could be synthesized by biochemical reactions. This is in line with reactions such as the synthesis of alcohols and acids from aldehydes, and the formation of esters from the reaction of alcohols with acids and the synthesis of amino acids through certain microorganisms (Cristiani and Monnet, 2001; Liu et al., 2004; Smit et al., 2005; Vandamme and Soetaert, 2002).
When the ester group VACs in tarhana dough (p < 0.05) were evaluated, ethyl acetate, ethyl capronate, ethyl lactate, ethyl caprylate, ethyl decanoate and ethyl 9-decanoate increased in both HMT and CMT doughs during fermentation. Similarly, Hansen and Hansen (1996) stated that ethyl acetate and ethyl lactate were formed in the fermentation of sourdough. Esters are reported to be formed biochemically by yeast through the reactions between alcohol and acetyl-CoA in the yeast cell catalyzed by various enzymes in fermented foods. Such as ethyl acetate and isoamyl acetate might be formed by the acetyltransferases existed in yeast cells (Birch et al., 2013; Rojas et al., 2001). Also, the other way could be the condensation reactions between fatty acid CoA and alcohol (Peng et al., 2018). In this study, different amounts of ethyl decanoate and ethyl caprylate were determined in both HMT and CMT doughs which may be the result of the ester reactions between octanoic acid-ethanol and decanoic acid-ethanol compounds.
Some VACs such as ethyl 9-decenoate, ethyl acetate and isoamyl acetate contents were higher in the CMT than the HMT samples. This could be due to the high amount of yeast present in the microflora and the diversity present in the CMT determined in a previous study (Özel et al., 2015). In addition, another study also evidenced that CMT doughs were fermented with more diverse Lactobacillus spp. including Lactobacillus plantarum, L. brevis, L. alimentarius than HMT doughs (Şimşek et al., 2017). These supporting studies indicated that the ester amount accumulated in the tarhana dough samples is closely related with the microbial amount and diversity of tarhana dough.
Distributions of volatile compounds during fermentation of homemade and commercially made tarhana (HMT and CMT) doughs.
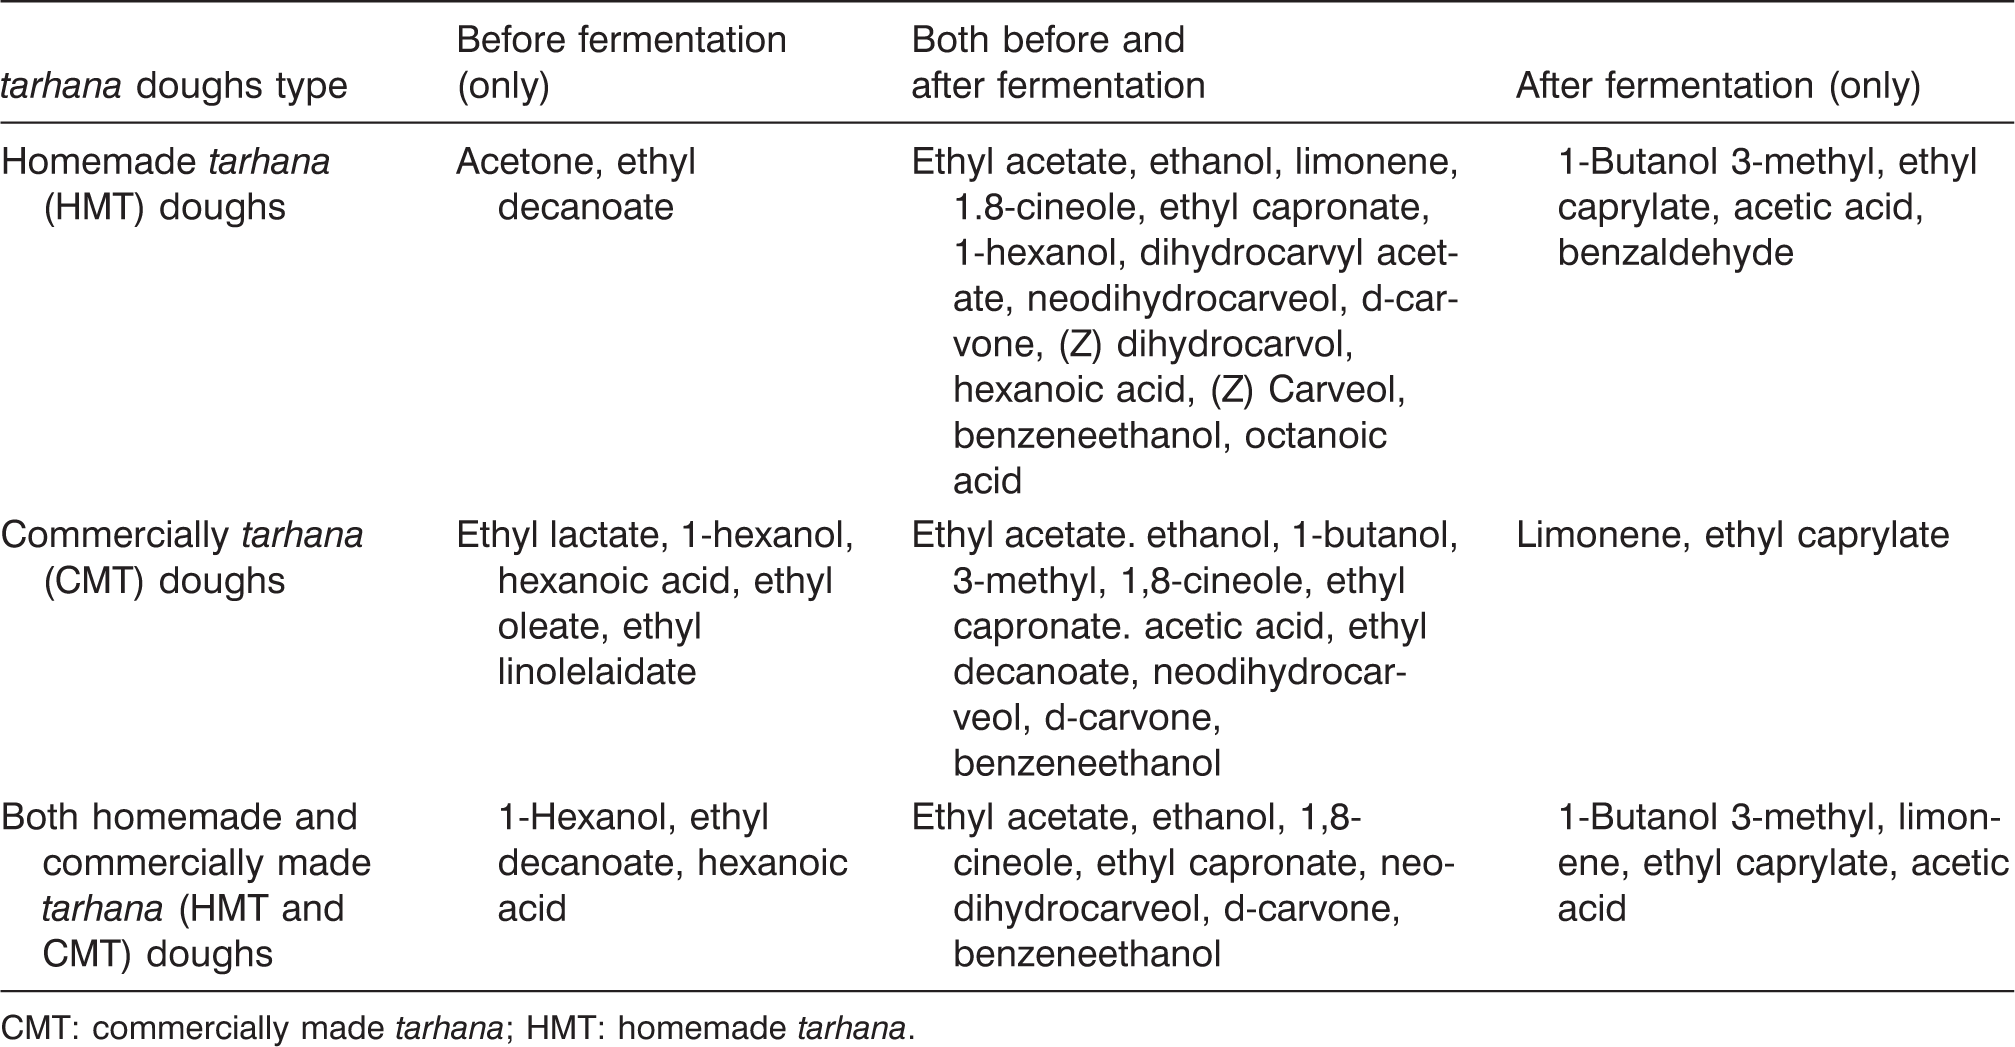
CMT: commercially made tarhana; HMT: homemade tarhana.
The conclusion is that ethyl acetate, ethanol, limonene, 1-butanol-3-methyl, ethyl lactate, ethyl caprylate, acetic acid, benzaldehyde, neodihydrocarveol, benzene ethanol, 1,8-cineole, ethyl capronate and d-carvone are the key VACs responsible for the formation of the characteristic tarhana aroma during fermentation.
Corelating the HMT and CMT doughs with the VACs on fermentation days
PCA, a procedure for identifying a smaller number of uncorrelated variables, used to monitor the change in volatile aroma composition of the tarhana doughs during fermentation and determine the formation of the tarhana volatile aroma profile. PCA was conducted using volatile data sets identified in each of the tarhana doughs on different fermentation days (Figure 3). After five days of fermentation, tarhana dough samples were clustered in two main groups; doughs F, G and H in group I and doughs A, B and E in group II (PC1 47.1%) (Figure 3(b)). In addition, dough D joined group I after 10 days of fermentation according to PC1 (48.6%) (Figure 3(c)). At the end of the fermentation (15th day), the clustered doughs remained same in their two different groups (PC1 38.2%); however, only dough K showed a different profile of volatiles to the other dough samples from initial to the end of fermentation. These results clearly showed that fermentation had a significant effect on the formation of the aromatic structure of the tarhana. Extending the fermentation time gave the tarhana dough a more consistent aromatic profile.
Principle component analysis of aroma data of the tarhana doughs during the fermentatation: (a) 0th day, (b) 5th day, (c) 10th day and (d) 15th day.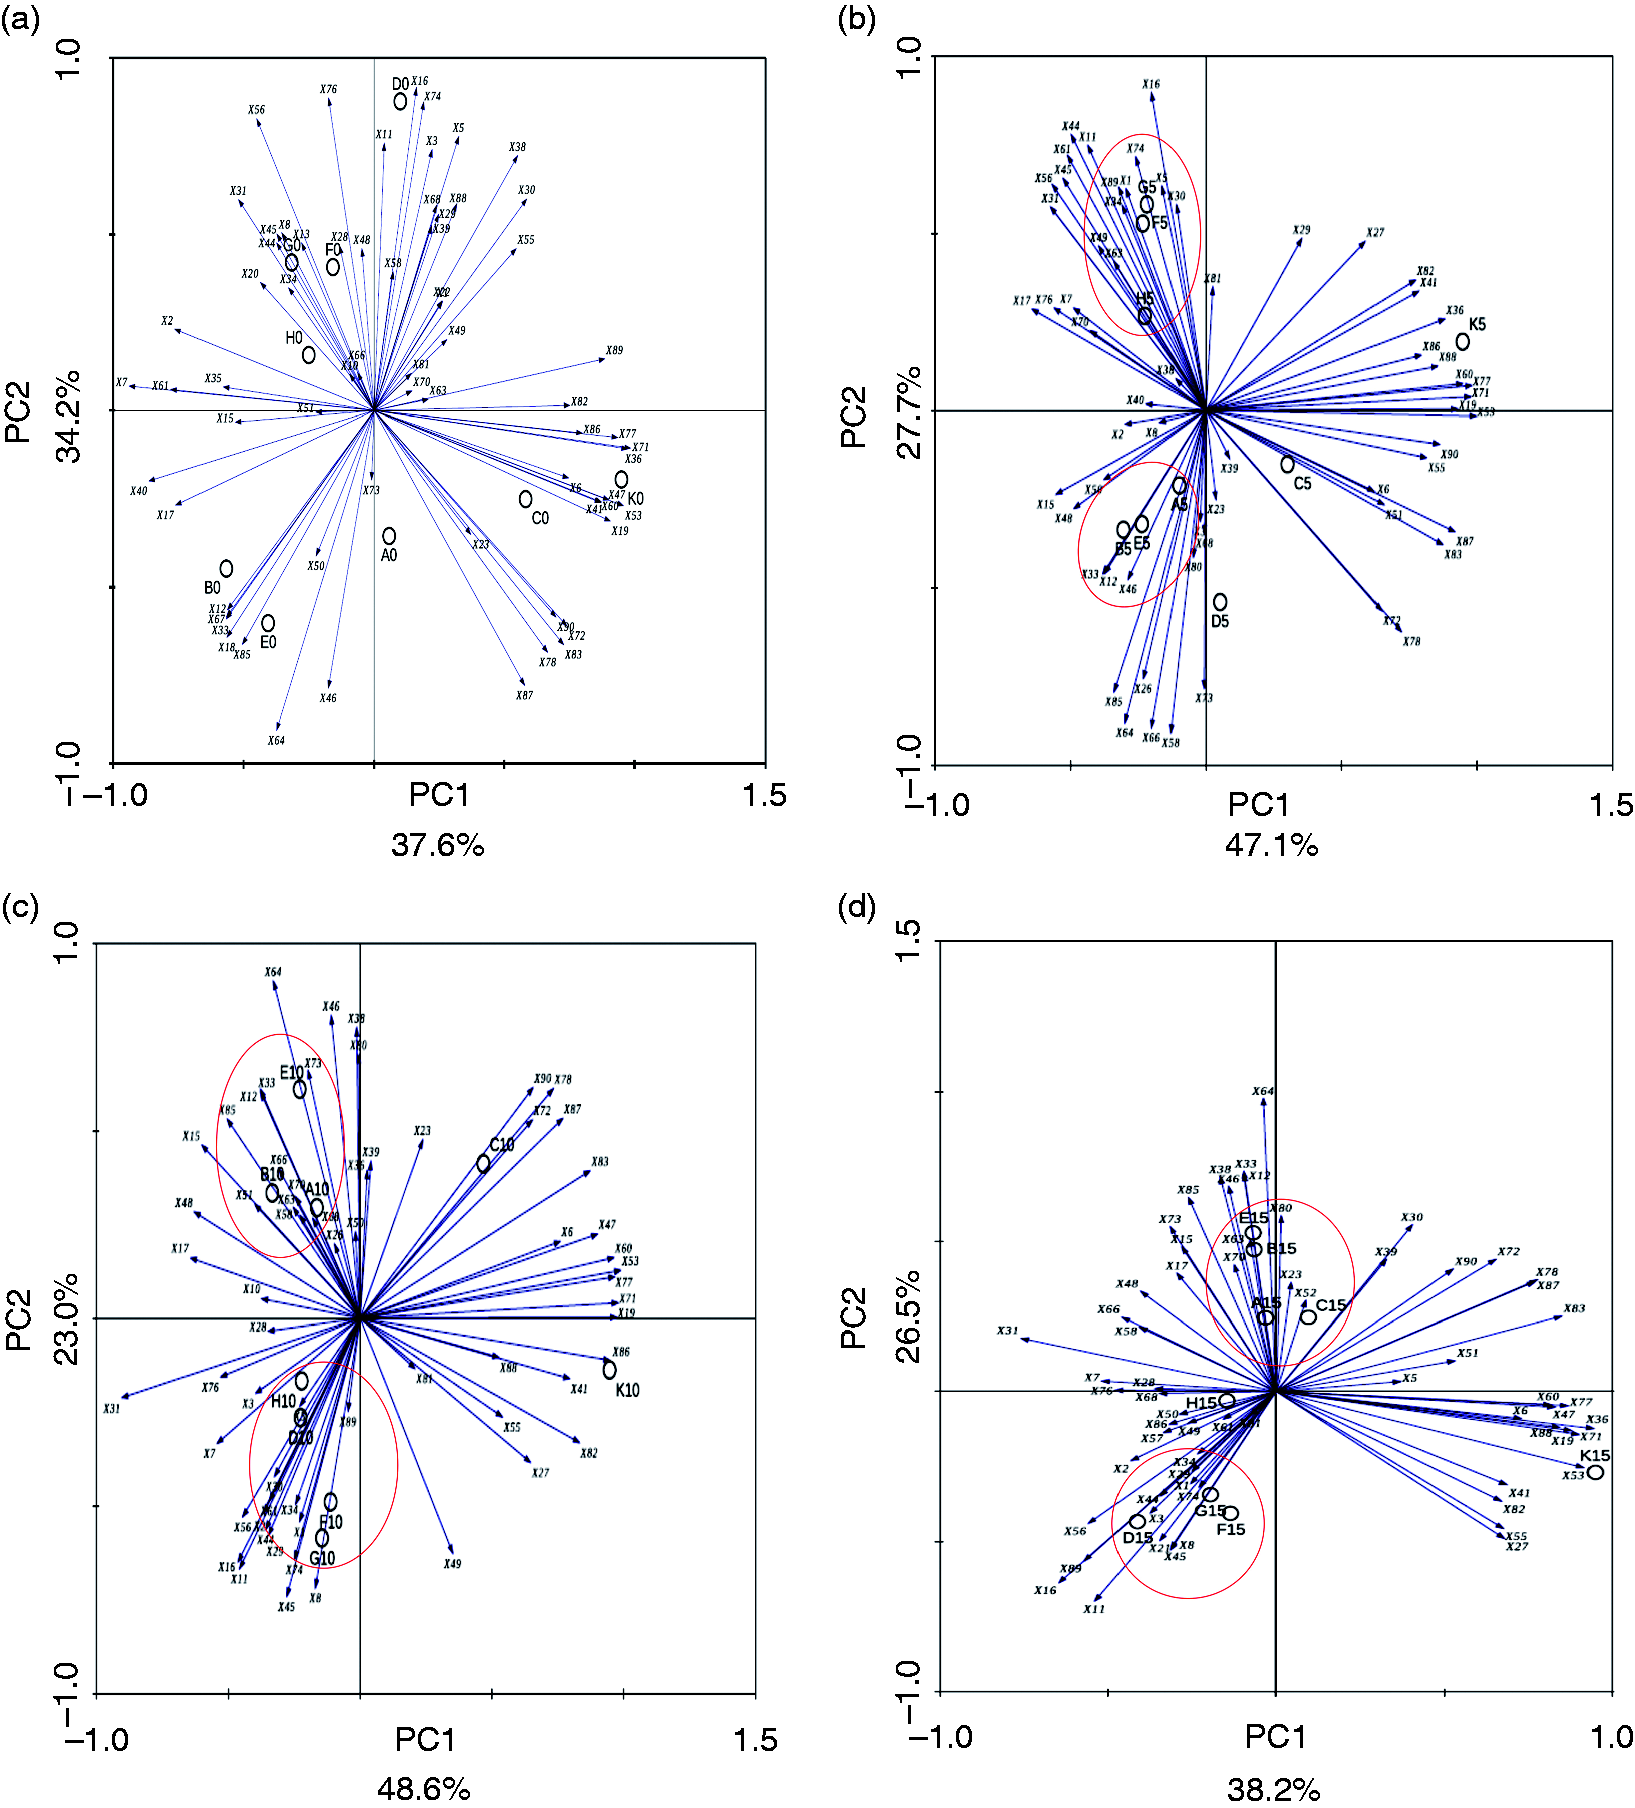
According to the screen plot shown in Figure 3(d), the volatiles d-carvone (X64), neodihydrocarveol (X63) and acetic acid (X38) were responsible for the clustering of A, B, C and E doughs during fermentation. In addition, (E) caryophyllene (X46) and (Z) carveol (X73) were responsible for the formation of the relevant group. 1-butanol-3-methyl (X16), ethyl acetate (X3), benzene ethanol (X74) and ethyl linolelaidate (X89) were effective in creating the cluster in group II, which contained doughs D, F, G and H. It was also observed that ethyl decanoate (X53), ethyl caprylate (X36), ethyl laurate (X71) and ethyl palmitate (X82) were responsible for the different characteristics of dough K.
Interestingly, the HMT and CMT doughs were clustered in separate groups after fermentation (Figure 3(d)). This result indicates that the differences in the preparation of the HMT and CMT doughs might affect the clustering of the volatiles in different ways. Evidently, the LAB and yeast flora of the HMT and CMT doughs collected from the same region were different (Özel et al., 2015).
Conclusions
The aromatic structure of tarhana doughs started to be formed after five days of fermentation. Accordingly, it is necessary to ferment tarhana for at least five days in order to obtain typical aromatic properties. However, the long fermentation applied in the production of the tarhana lead to accumulate the esters which would be especially responsible for the characteristic aroma property of the tarhana. The VAC groups produced at both HMT and CMT doughs were found similar at the end of fermentation. In addition, it was identified that the lactic succinic and acetic acids were the most important OACs for the tarhana doughs.
Footnotes
Declaration of conflicting interests
The author(s) declared no potential conflicts of interest with respect to the research, authorship, and/or publication of this article.
Funding
The author(s) disclosed receipt of the following financial support for the research, authorship, and/or publication of this article: This work was financially supported by The Scientific and Technological Research Council of Turkey (TUBITAK, Grant/Award Number: 113O400).