
Abstract
This study investigated the effect of ultraviolet-C irradiation on the inactivation of microorganisms in coconut water, a highly opaque liquid food (1.01 ± 0.018 absorption coefficient). Ultraviolet-C inactivation kinetics of two bacteriophages (MS2, T1UV) and three surrogate bacteria (Escherichia coli, Salmonella Typhimurium, Listeria monocytogenes) in 0.1% (w/v) peptone and coconut water were investigated. Ultraviolet-C irradiation at 254 nm was applied to stirred samples, using a collimated beam device. A series of known ultraviolet-C doses (0–40 mJ cm−2) were applied for ultraviolet-C treatment except for MS2 where higher doses were delivered (100 mJ cm−2). Inactivation levels of all organisms were proportional to ultraviolet-C dose. At the highest dose of 40 mJ cm−2, three surrogates of pathogenic bacteria were inactivated by more than 5-log10 (p < 0.05) in 0.1% (w/v) peptone and coconut water. Results showed that ultraviolet-C irradiation effectively inactivated bacteriophage and surrogate bacteria in highly opaque coconut water. The log reduction kinetics of microorganisms followed log-linear and exponential models with higher R2 (>0.95) and low root mean square error values. The D10 values of 3, 5.48, and 4.58 mJ cm−2 were obtained from the inactivation of E. coli, S. Typhimurium, and L. monocytogenes, respectively. Models for predicting log reduction as a function of ultraviolet-C irradiation dose were found to be significant (p < 0.05). Fluid optics were the key controlling parameters for efficient microbial inactivation. Therefore, the ultraviolet-C dose must be calculated not only from the incident ultraviolet-C intensity but must also consider the attenuation in the samples. The results from this study imply that adequate log reduction of vegetative cells and model viruses is achievable in coconut water and suggested significant potential for ultraviolet-C treatment of other liquid foods.
Introduction
Coconut water (CW), a sweet, refreshing drink, is gaining prominence among consumers for its high mineral content with low calories (Burkitt, 2009; Prades et al., 2012). CW is generally sterile inside the fruit; however, once extracted, its biochemical properties change rapidly, which makes it challenging to preserve. Extending the shelf life of CW without affecting flavor and nutrition is a critical technical hurdle. Although no foodborne outbreaks in CW have been reported in the United States or elsewhere, the nutritional ingredients of CW could provide favorable conditions for growth of microorganisms (Hoffmann et al., 2002; Melo et al., 2003). The pH and water activity (aw) of CW are 4.2–6.0 and 0.995, respectively (Walter et al., 2009) which favor the growth of vegetative cells and spores. Inactivation of bacterial endospores is a greater concern in the food industry especially for the processing of low acid (pH > 4.6) beverages. Organisms such as Clostridium botulinum including Salmonella spp., Escherichia coli O157: H7, and Listeria monocytogenes are the potential contaminants in CW that can cause foodborne infections (Ray and Bhunia, 2008).
As per the Hazard Analysis and Critical Control Point (HACCP) regulation (21 CFR. 120), all manufacturers must develop a HACCP plan and most resistant pathogens should be targeted to achieve a 5-log10 reduction (FDA US, 2004) to avoid outbreaks of foodborne illness. As a fact, heat pasteurization may modify the flavor and nutritional ingredients of processed juice and it is also a more costly treatment for many small processing plants (Koutchma et al., 2004). Currently, thermal processing is the most preferred method for treatment of CW and results in adverse organoleptic changes (Prades et al., 2012). Significant research has been done to develop alternative nonthermal techniques to meet the consumer demand for healthier and safer food products, and ultraviolet-C (UV-C) technology is an established technology which is under advanced research for industrial application.
UV-C light treatment is an efficient nonthermal technique capable of reducing pathogenic microbes by 5-log10 (Koutchma, 2009). Until recently, UV-C treatment has been studied by many authors which includes disinfection of water (Oguma et al., 2013; Severin et al., 1983; Xiong and Hu, 2013), fresh agricultural produce (Schenk et al., 2008), skim milk (Gunter-Ward et al., 2018), and the effect on polyphenols and antioxidant activity (Islam et al., 2016). UV-C technology is a process that extensively finds application in water treatment around the world (Guerrero-Beltran and Barbosa-Canovas, 2004; Koutchma, 2009). It is well documented in the literature that the primary mode of UV-C disinfection occurs upon absorption of UV-C light by nucleic acids of the target microbe (Sastry et al., 2000) and forms cross-linked pyrimidine dimers. These dimers, when present in sufficient numbers and critical locations, cannot be repaired and prevent the organism from replicating, rendering it nonviable (Bintsis et al., 2000; Guerrero-Beltran and Barbosa-Canovas, 2004). UV-C technology is approved by Food and Drug Administration (FDA) (CFR 179.21 and 179.39) as a novel nonthermal treatment for processing of fruit juices (USFDA USF and DA, 2018).
The challenges related to application of UV-C treatment of CW include: (a) UV-C dose verification and validation in a highly absorbing fluid such as CW, (b) accounting for the optical absorption coefficient (cm−1) of the liquid, and (c) understanding microbial inactivation kinetics of bacteria including bacteriophage (model viruses).
Therefore, the objective of this study was to assess the effectiveness of UV-C irradiation for the inactivation of S. Typhimurium American Type Culture Collection (ATCC) 13311, E. coli ATCC 25922, L. monocytogenes ATCC 19115, and two bacteriophages (MS2 and T1UV) as model viruses in CW. The UV-C dose levels were calculated considering the optical parameters of the fluid, and bio-dosimetry techniques were used to verify UV-C doses that help to validate target doses.
Materials and methods
Preparation of CW
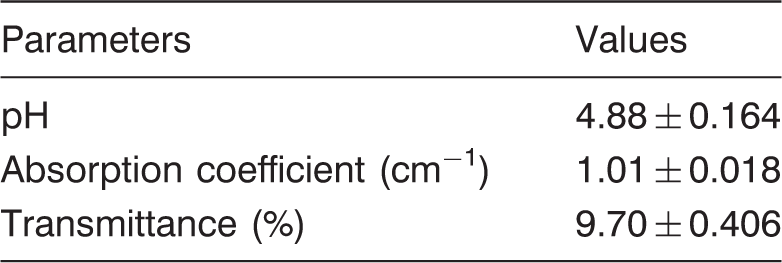
Optical properties and pH values of coconut water
Bacterial strains and cultural conditions
Three nonpathogenic and nonoutbreak strains of different bacteria were used in this study—E. coli (25922), S. Typhimurium (13311), and L. monocytogenes (19115). The bacterial strains were procured from ATCC. The bacterial cultures were stored in 25% glycerol in cryovials at −80 ℃. Fresh bacterial suspensions were prepared for inoculation into CW for every treatment. Two loops of individual strains of E. coli and S. Typhimurium were transferred to 15 ml of Tryptic soy broth (Oxoid Ltd, Basingstoke, UK) and incubated at 37 ℃ for 18 h. L. monocytogenes was also subjected to two successive transfers in tubes containing 15 ml of Buffered Listeria enrichment broth (Oxoid Ltd, Basingstoke, UK) and incubated at 37 ℃ for 24 h. After incubation, E. coli and S. Typhimurium cultures were transferred into 15 ml of TSB and incubated for 18 h at 37 ℃ to reach the stationary growth phase. Similarly, L. monocytogenes culture was transferred to 15 ml Listeria enrichment broth (Oxoid Ltd, Basingstoke, UK) and incubated for 24 h at 37 ℃. Centrifugation (3000 × g, 15 min) was performed to harvest the bacterial cells. A solution of 0.1% (w/v) phosphate-buffered saline (PBS) (Becton Dickinson, New Jersey, US) was used to wash the cell pellets and re-suspended in 50 ml of PBS, which was used to transfer inoculum to CW for UV treatments.
Bacteriophage and cultural conditions
Two bacteriophages were used as surrogates for viral pathogens: MS2 (single-stranded RNA) and T1UV (double-stranded DNA). The virus cultures were procured from GAP EnviroMicrobial Services Limited (London, Ontario, Canada). Cultures were kept at −20 ℃ until further use and were found to maintain viability for many months with little variation in measured titer.
The bacteriophage culturing method uses various E. coli host strains, which are specific for different bacteriophage using a single layer plating technique. Bacteriophage infects and multiplies in a susceptible bacterial host, and eventually lyse (break apart) the cell. For culturing MS2 bacteriophage, E. coli HS (pFamp) R (bacterial host for MS2) broth culture (1 ml) was added to a culture tube containing 20 ml of molten Tryptone Yeast Extract Glucose agar with a salt of triphenyl tetrazolium chloride. An appropriate volume of treated sample containing bacteriophage was then added to the same tube. After mixing gently by inversion, the molten agar including E. coli and sample was poured into a sterile Petri dish. The molten agar mixture was then allowed to solidify, and plates were incubated at 35 ± 0.5 ℃ for 18–24 h. The plates were examined for clear, roundish zones (plaques), which indicate that the phage has lysed the E. coli bacterial cells. The number of plaques per plate was recorded and multiplied by the dilution factor. Cell densities were reported as plaque forming units per milliliter of the original test sample.
CW inoculation
Aliquots of 100 ml CW were inoculated individually with each of the three bacterial cultures (L. monocytogenes, E. coli, and S. Typhimurium) targeting a concentration of 108 CFU (colony forming unit) ml−1. A 10 ml of inoculum was added to 90 ml of CW. The inoculated CW was plated using decimal dilutions on Tryptic soy agar (Oxoid Ltd, Basingstoke, UK) plates to determine the original E. coli and S. Typhimurium titers and incubation was done at 37 ℃ for 24 h. CW inoculated with L. monocytogenes was plated on Listeria selective agar base (Oxoid Ltd, Basingstoke, UK) and plates were then incubated at 37 ℃ for 48 h.
Optical properties and pH measurements
The absorption coefficient of CW at 254 nm was determined using a 1 cm pathlength quartz cuvettes (H. Baumbach & Co. Ltd, UK) in a Cary 300 spectrophotometer with a 6 in. integrating sphere (Agilent Technologies, CA, US). Baseline corrections, i.e. by zeroing (setting the full-scale reading of) the instrument using the blank and then blocking the beam with a black rectangular slide was carried out. Ultraviolet transmittance (UVT) is the measure of the fraction of incident light transmitted through the material over cm−1 pathlength and it is calculated using equation (1)

Collimated beam UV reactor
A low-pressure mercury lamp (Philips 25 W; Big Frog Mountain Corporation, Hixson Pike Chattanooga, TN, USA) emitting UV light at 253.7 nm was housed in a collimated beam apparatus. A 5 ml test sample was stirred in 10 ml beakers (sample depth: 3.2 cm; diameter: 1.83 cm) (Bolton and Linden, 2003; Islam et al., 2016) to enhance mixing and ensure uniform delivery of UV-C photons.
The UV-C dose delivered was calculated using a standardized approach (Bolton and Linden, 2003) where the average intensity (average germicidal fluence rate (W m−2)) in the well-mixed sample is expressed as

In equation (2), E0 is the measured irradiance. The product of E′avg and the exposure time (s) is the average germicidal fluence (UV-C dose) (J m−2 or mJ cm−2). Pf is the Petri factor defined as the ratio of the UV-C intensity measured at the center of the sample surface to the average intensity measured across the sample surface, (1 − R) is termed as the reflection factor where R is the fraction of UV-C light at 253.7 nm reflected at the air–surface interface (typically R = 0.025), L/(d + L) is termed the divergence factor where L is the distance from the lamp centerline to the sample surface, d is the sample depth, and (1−10− Ad )/Ad ln(10) is termed the absorbance factor where A is the absorbance coefficient (base10) at 253.7 nm of the fluids (Bolton and Linden, 2003).
The UV-C lamp was cooled by a fan installed at the base of the reactor with upward airflow to maintain a constant output. The lamp was switched on for 20 min before use to stabilize the UV-C output. The irradiance at the sample surface was measured using a radiometer (ILT-1700) with an SED 240 detector and NS254 filter (International Light Technologies, Peabody, USA).
The samples were placed on a stir plate, which in turn were positioned on the sample holder to locate the surface of the microbial suspension at the same level to the calibration plane of the radiometer (Bolton and Linden, 2003). The stir plate speed was adjusted to a maximum value at which the fluid surface remained flat and did not reach vortex effect. The vertical distance of 28.05 cm was kept between the surface of the liquid and UV-C lamp, as irradiance was measured at the same height (Islam et al., 2016).
Verification of UV-C fluence
The verification of UV-C dose was conducted as per the method described in Gunter-Ward et al. (2018) and Islam et al. (2016). The log reduction of MS2 population was used to calculate the UV-C dose delivered in the CW in each irradiation treatment utilizing the sensitivity of the MS2 as established by the buffer tests (Pinjuv et al., 2006).
Organism sensitivity test
An organism sensitivity test was carried out in 0.1% buffered peptone water by the methodology described in Bhullar et al. (2018) and Gunter-Ward et al. (2018).
UV-C irradiation treatments
UV-C sensitivity or D10 values of E. coli ATCC 25922, S. Typhimurium ATCC 13311, and L. monocytogenes ATCC 19115 following UV-C treatment at 254 nm.
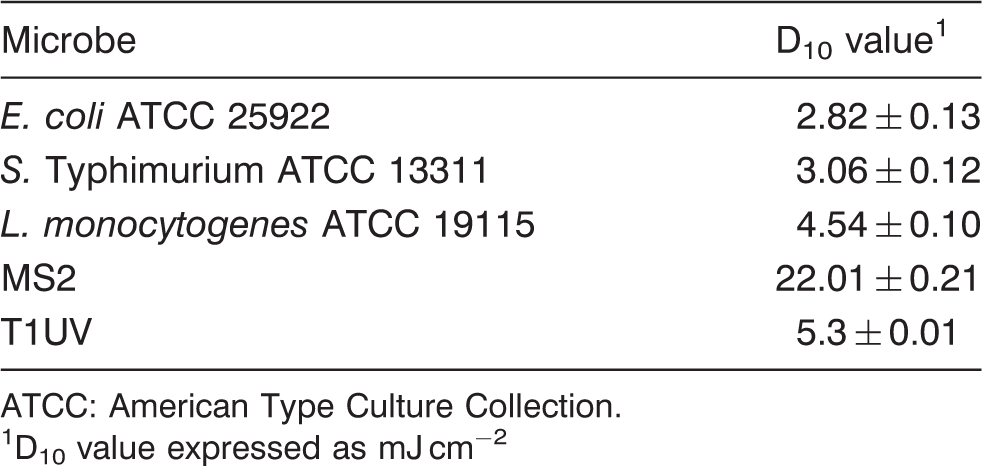
ATCC: American Type Culture Collection.
D10 value expressed as mJ cm−2
Enumeration of pathogens in CW after UV-C treatments
After UV-C treatment, decimal dilutions of the treated samples and control were prepared in 0.1% buffered peptone water (Oxoid Ltd, Basingstoke, UK). For determining the original cell population densities, appropriate dilutions of each cell suspension were made in 0.1% buffered peptone water. Cell suspensions were plated in duplicate using Tryptic soy agar (Oxoid Ltd, Basingstoke, UK) plates for E. coli and S. Typhimurium suspensions and incubated at 37 ℃ for 24 h. L. monocytogenes suspensions were plated on Listeria selective agar base (SR0141E) (Oxoid Ltd, Basingstoke, UK) plates with incubation at 37 ℃ for 48 h. The viable plate counts within the range of 25–250 were considered for analysis. Bacteria colonies were counted and results were reported as log CFU ml−1 of CW.
Modeling inactivation kinetics
Log-linear model
This model is widely used in many UV-C disinfection studies for reporting the log reduction curves resulted from the application of both thermal and nonthermal processing technologies. It also provides a good fit for different sets of data for microbial inactivation results. The inactivation curves that follow the first order of kinetics fit well into this model. The following equation denotes the model as discussed by Van Boekel (2002)

Non-linear model
For cases where inactivation does not follow a simple first-order rate, the exponential model has been used successfully. The inactivation curves may form different shapes resulting from heterogeneity among the cells of a population for a pure bacterial or a viral strain. In some cases, inactivation curves may be sigmoidal with concave or convex trend lines which fit well into this model. There are two parameters (α and β) given in the following model form for the first-order function

Model validation
For the modeling of inactivation kinetics, model prediction errors for each bacterium and viral surrogates were estimated by using equation (5) by computing the difference between the observed and predicted values


The value of an average bias of zero indicates the model with no prediction bias. Negative average bias is associated with an over-prediction by the model, whereas a positive value is associated with under-prediction by the model. Average bias percent reflects a relative measure of the magnitude of bias. The magnitude of bias from model prediction was determined separately for each bacterium.
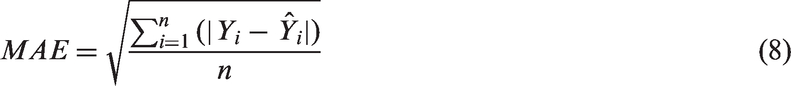
Mean absolute error (MAE) and prediction root mean square error (PRMSE) were used to describe the model prediction uncertainties.
The MAE, PRMSE, and relative error percent (RE%) were estimated by

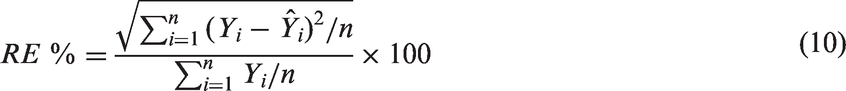
RE%, also known as the coefficient of variation, indicates the relative size of model prediction uncertainty. The model efficiency (EF) is also known as correlation index squared (I2) and indicates overall goodness of fit (Kozak and Kozak, 2003; Mayer and Butler, 1993; Pinjuv et al., 2006). The fit statistic was estimated by

Statistical analysis
The log reductions from the UV-C inactivation treatments were documented, and log-linear and non-linear models were fitted in R Statistical Computing Environment (R Development CT, 2016). Model fit statistics including R2 and RMSE were compared among the competing models. Independent set of data were collected for each UV-C treatment for all three bacteria, and model performance was evaluated for each model. The magnitude of bias, precision, and accuracy was assessed using independent dataset by generating a suite of validation statistics such as average bias, relative error, MAE, and EF. All the data were analyzed using p value of 0.05.
Results and discussion
E. coli ATCC 25922, S. Typhimurium ATCC 13311, L. monocytogenes ATCC 19115, MS2, and T1UV inactivation
From the optical data (Table 1), it can be seen that the CW was a strong absorber (absorption coefficient of 1.01 ± 0.018 cm−1) of UV-C light. On the contrary, apple juice has an absorption coefficient of 6.61 cm−1 (Chandra et al., 2017).
The UV-C inactivation of E. coli has been examined extensively by many authors (Sommer et al., 2000; Tosa and Hirata, 1999; Wilson, 1992; Wu et al., 2011; Yaun et al., 2003). A research study reported that E. coli O157:H7 ATCC 43894 had an initial shoulder with slow inactivation, followed by first-order kinetics up to 5-log10, with D10 in the log-linear region of about 1.2 mJ cm−2 (Wilson, 1992). This observation of an initial slow inactivation has been observed in Wang et al. (2005) and Wilson (1992), with the UV- C dose per log after this point ranging from about 1 to 2 mJ cm−2. The current study examines the inactivation of E. coli in CW, for which the authors found limited published literature (Augusto et al., 2015; Gautam et al., 2017; Ochoa-Velasco et al., 2014).
The populations of E. coli were reduced by 5.58-log at a highest UV-C dose of 40 mJ cm−2. The first-order inactivation kinetics, as plotted in Figure 1 show the opposite curvature, with rapid initial inactivation followed by increasing resistance to UV-C dose. A study reported E. coli ATCC 25922 inactivation of 7.5-log CFU ml−1 was achieved with a maximum UV-C dose of 1.5 mJ cm−2 in distilled water (Vermeulen et al., 2008). However, the optical absorption coefficient (cm−1) of the fluid samples and drop in UV fluence gradient was not reported. In contrast, the D10 value of E. coli ATCC 25922 was approximately 3 mJ cm−2 at 254 nm which is significantly different from what is reported in the study mentioned above, a D10 ≈ 0.2 mJ cm−2 at 250 nm using a xenon lamp. In yet another study, E. coli inactivation using UV-C was reported with a D10 value of 25 mJ cm−2 in CW (Gabriel et al., 2018). To the best of our knowledge, there is little information on the inactivation of the above micro-organisms in CW by UV-C light as the optical characteristics of treatment fluids are not accounted for estimating the dose delivery. Hence it is difficult to make direct comparisons with hitherto reported research.
Inactivation kinetics of (a) E. coli ATCC 25922, (b) S. Typhimurium ATCC 13311, and (c) L. monocytogenes ATCC 19115 following UV-C treatment at 254 nm in CW.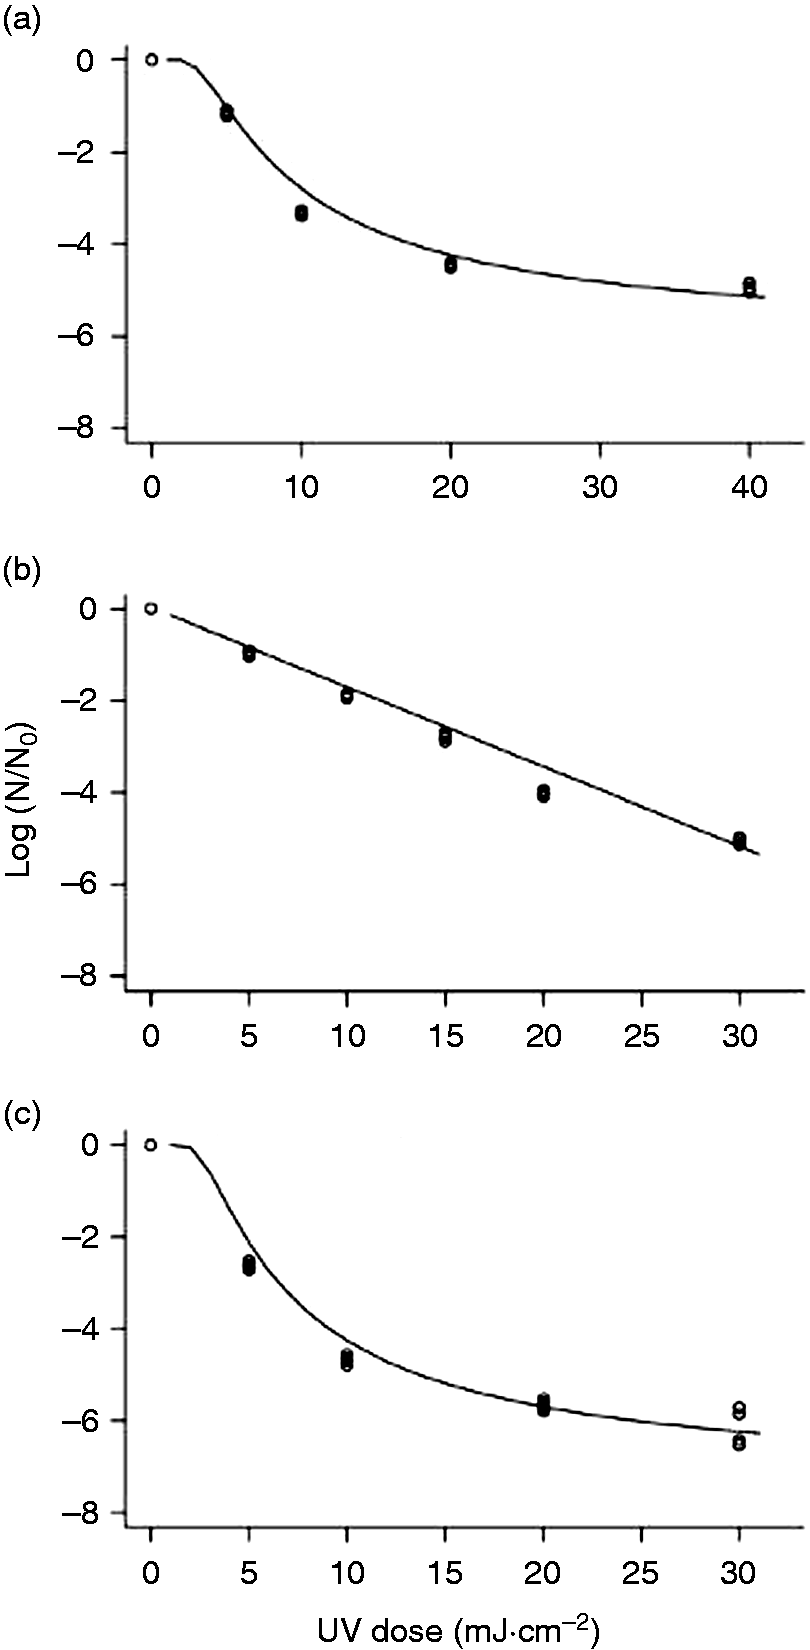
As may be seen in Figure 1, a tailing effect was observed at a higher dosage for E. coli. In our experiments, samples were continuously mixed during the entire duration of the irradiation treatments to ensure uniform dose delivery to a homogeneous test fluid. Although the log inactivation increased with increase in UV-C exposure, no significant differences in log reduction were observed at higher doses (30–40 mJ cm−2). The lower limit of the dose distribution in the collimated beam has a significant impact on microbial inactivation of highly sensitive microorganisms which results in tailing of dose–response curve. For more resistant organisms, such as MS2, the impact of mixing in the collimated beam apparatus is negligible (Figure 3). Similar observations were also reported by Gunter-Ward et al. (2018) where the assumption of perfect mixing for MS2 in collimated beam treatments was considered reasonable. It was observed in one of our studies (Bhullar et al., 2018), that if uniform mixing is achieved in a well-mixed reactor, microbial inactivation follows first-order kinetics.
UV-C irradiation effectively inactivated S. Typhimurium in CW as may be seen in Figure 1. The population of S. Typhimurium was reduced by 5.14-logs at maximum UV-C dose of 30 mJ cm−2. The S. Typhimurium population decreased linearly with increasing UV-C dosage, with a D10 of approximately 5.48 mJ cm−2. These results for Salmonella compared with literature show the similar sensitivity of the microbe. Several studies reported UV sensitivity of Salmonella spp. with a D10 value ranging from 2 to 3.5 mJ cm−2 (Hoyer, 1998; Tosa and Hirata, 1999; Wilson, 1992). In comparison to E. coli inactivation results, no tailing effect was observed for S. Typhimurium. The reason for this trend is not known. Nevertheless, the populations of both bacteria were reduced by 99.999%.
The efficacy of UV-C irradiation in inactivating L. monocytogenes is reported in Figure 1. The populations of L. monocytogenes were reduced by 6.56-logs, respectively, at the highest UV-C dose of 30 mJ cm−2, with a D10 of approximately 4.58 mJ cm−2. The L. monocytogenes inactivation showed tailing, similar to E. coli inactivation. Also, L. monocytogenes (Gram-positive) had lower resistance to UV-C exposure than that of S. Typhimurium and E. coli (both Gram-negative). In contrast, some studies reported that L. monocytogenes had notably higher resistance to UV-C treatment than Salmonella and E. coli O157:H7 when bacterial pathogens were suspended in PBS and apple juice (Gabriel and Nakano, 2009).
The observations in this study demonstrated that the bacterial populations along with T1UV were reduced by >5-logs at a maximum dose level of 40 mJ cm−2. As expected, the UV-resistant phage MS2 required approximately 100 mJ cm−2 for a 5-log inactivation. The UV-C irradiation doses delivered in this study successfully reduced the microbial load by 5-log. From the results, it can be reported that a linear relationship was observed between target dose and reduction equivalent dose expressed as mJ cm−2 (Figure 2) at 254 nm.
Comparison of delivered UV dose versus applied UV dose value in CW. Inactivation kinetics of (a) MS2 and (b) T1UV following UV-C treatment at 254 nm in CW.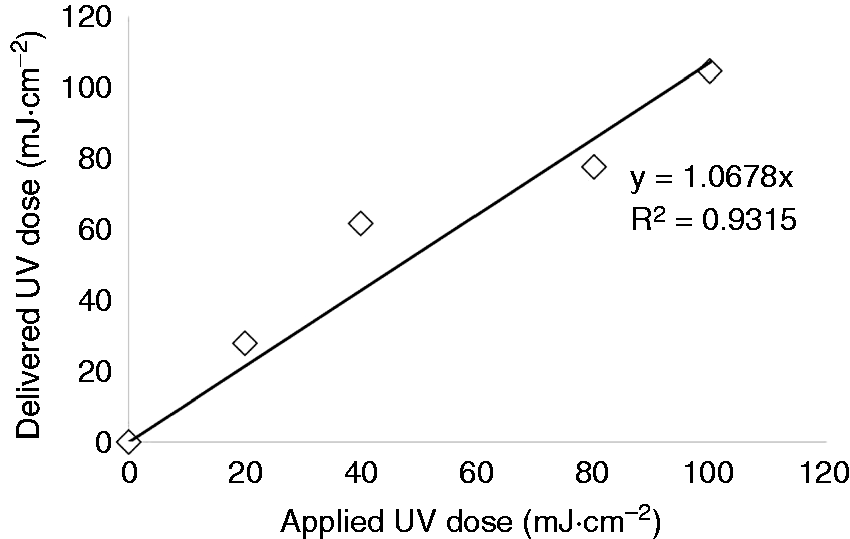
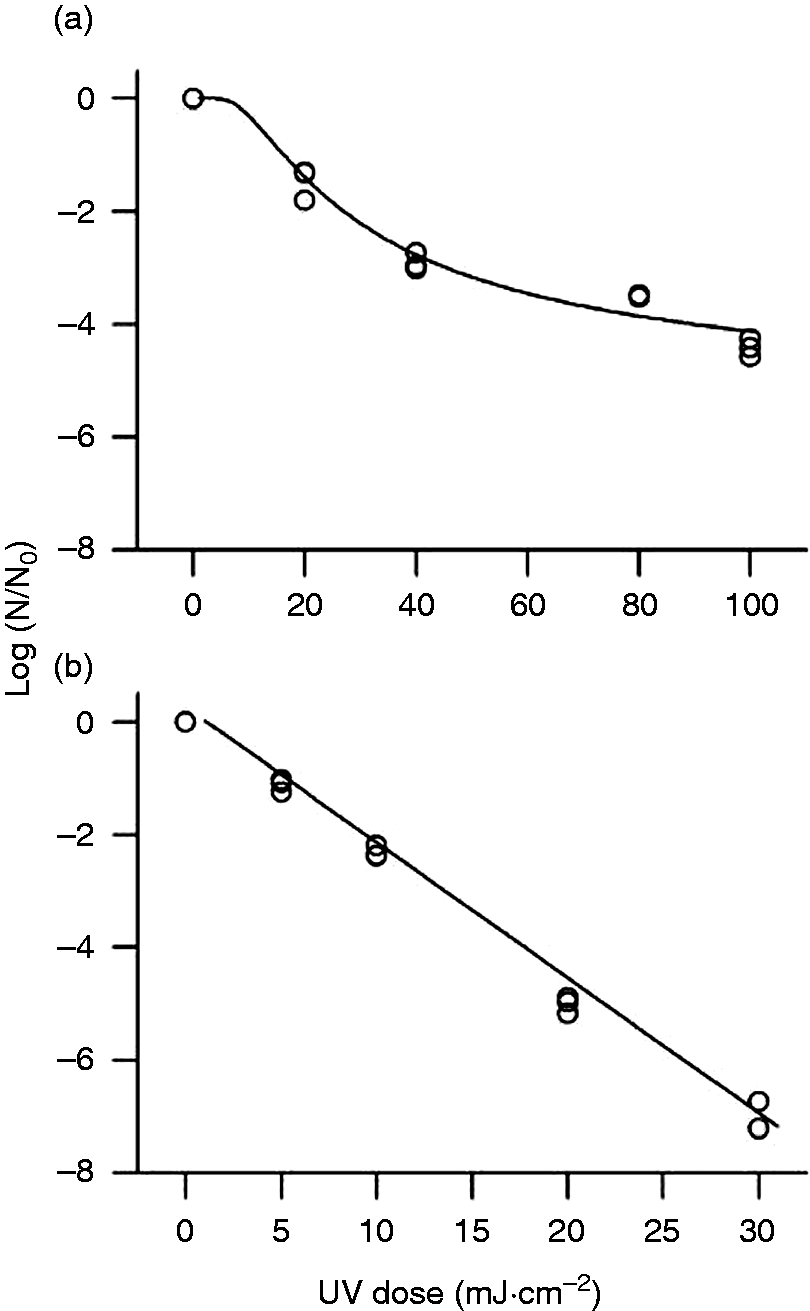
Bacteriophages, MS2 and T1UV, were selected as model viruses in this study. MS2 and T1UV inactivation were tested at various UV-C doses. Higher energy doses induced higher levels of MS2 and T1UV inactivation in CW. The general trends of these data are depicted clearly in Figure 3. The populations of MS2 were reduced by 4.41-logs at a maximum UV-C dose level of 100 mJ cm−2. As expected, T1UV was less resistant to UV and was inactivated by 7.06-logs at highest UV-C dosage of 30 mJ cm−2. Both viral surrogate concentrations decreased exponentially as UV-C exposure increased; there was no tailing. UV-C irradiation doses used in this study were enough to target ≈5-log10 reductions for model viral surrogates. At the maximum regulated UV-C dose set by the FDA (40 mJ cm−2), the inactivation treatments resulted in a 5-log10 decrease of S. Typhimurium, E. coli, and L. monocytogenes in CW. To conclude, this system allowed accurate estimation of the delivered doses required to inactivate 5-log10 reductions of these pathogens considering the UV-C irradiance, the absorption coefficient (cm−1), and the dose verification by biodosimetry.
Modeling inactivation kinetics
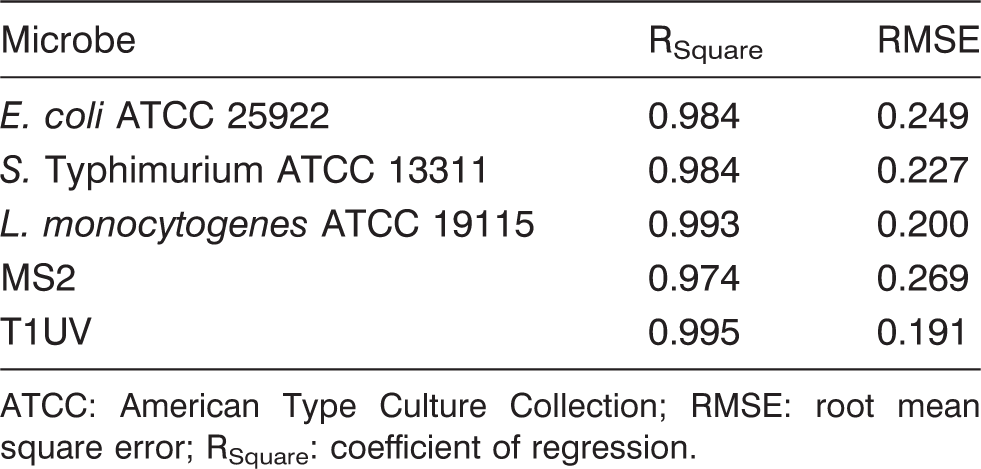
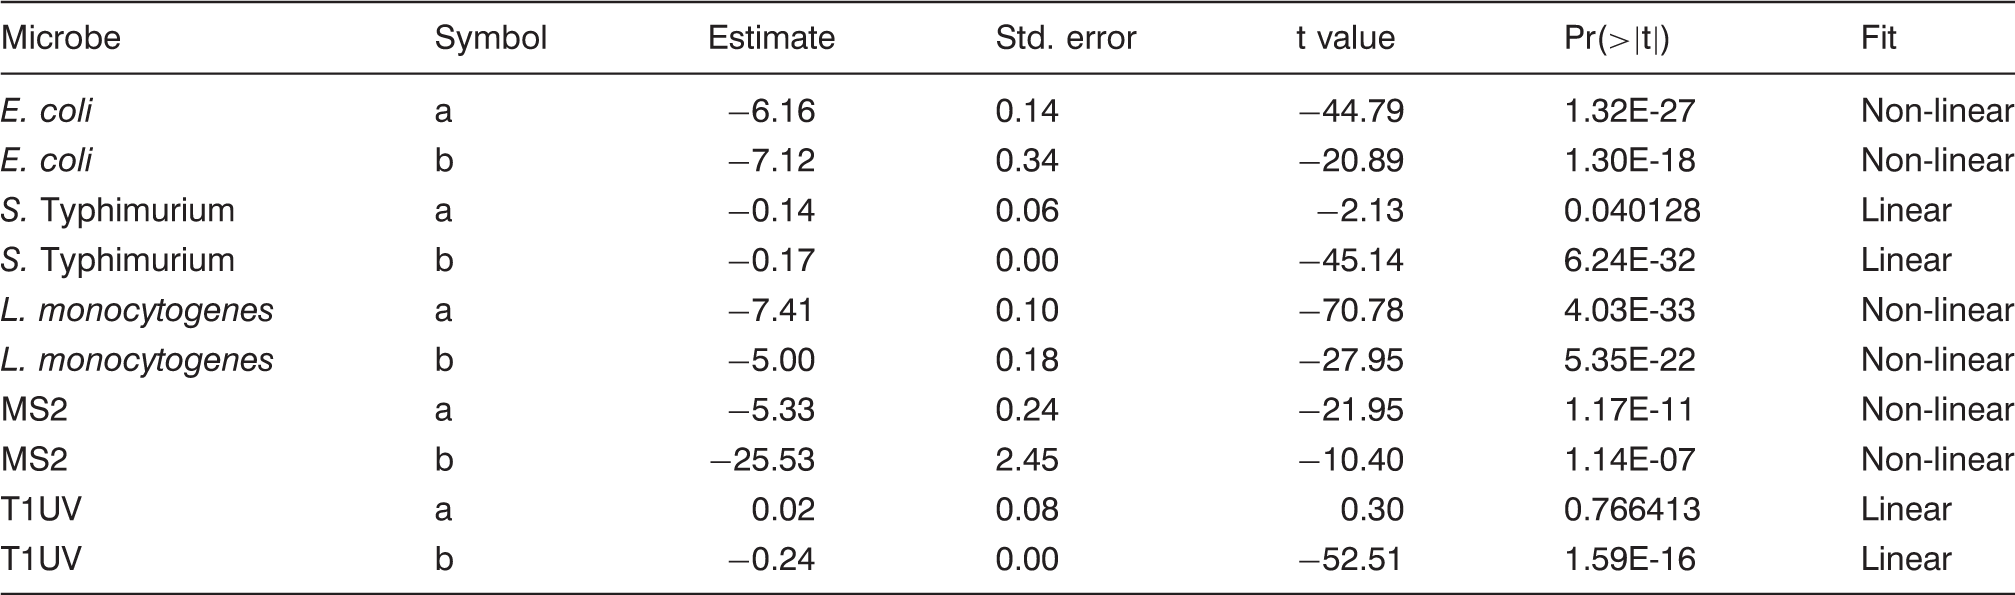
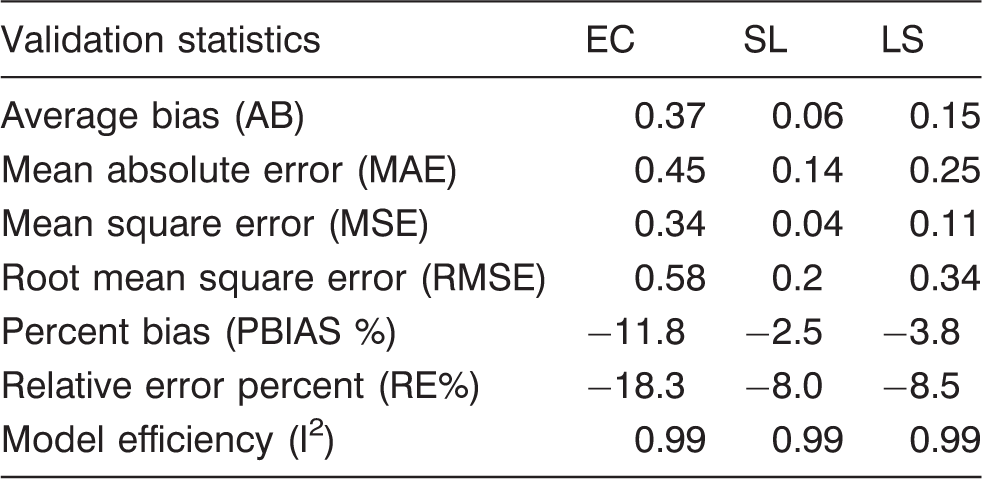
The log reduction curves of microbes under study exhibited both tailing and linear trend lines (Figure 1). We used an independent set of data to validate the models. We calculated model validation statistics (equations (4) to (10)) for each model (Table 5). The goodness of fit for the models and parameter estimates are listed in Tables 3 and 4. It was found that E. coli model was more biased compared to S. Typhimurium and L. monocytogenes as listed in Table 5. It can be inferred from Table 5 that E. coli have the maximum MAE followed by L. monocytogenes and S. Typhimurium. RE% also follows the same trend as MAE among three microbes. EF is best observed in S. Typhimurium followed by L. monocytogenes and E. coli as in Figure 4.
Predicted and actual (experimental values) for microbial log inactivation of (a) E. coli ATCC 25922, (b) S. Typhimurium ATCC 13311, and (c) L. monocytogenes ATCC 19115 following UV-C treatment at 254 nm in CW. Goodness of fit ATCC: American Type Culture Collection; RMSE: root mean square error; RSquare: coefficient of regression. Parameter estimation table for each model Validation statistics using independent set of data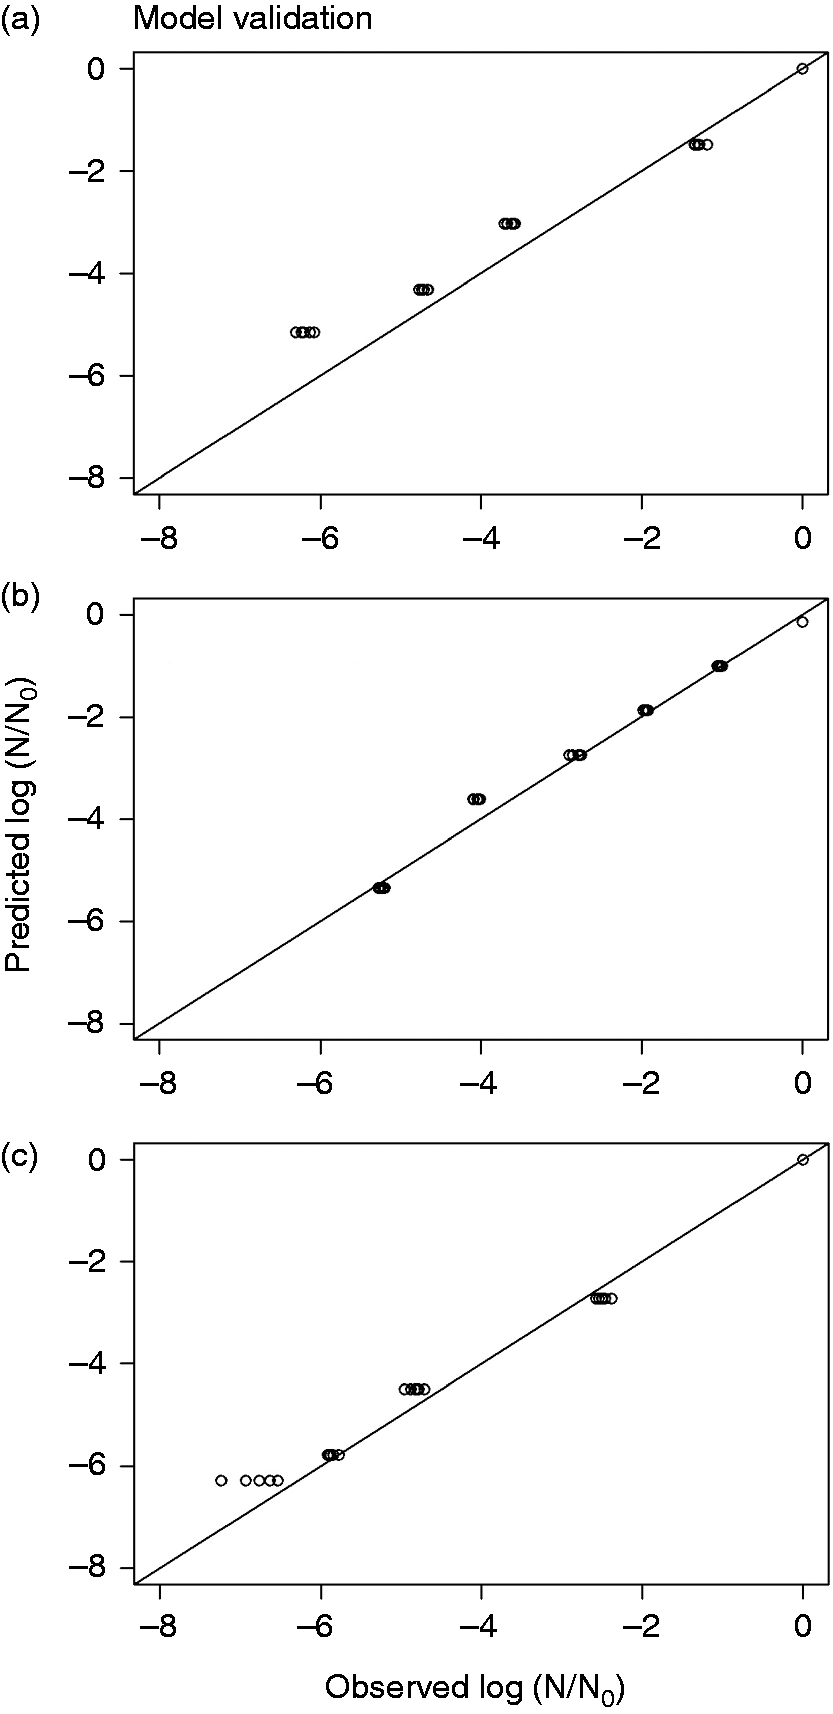
Conclusions
Commercially relevant UV-C doses delivered in this study successfully reduced the microbial load by 5-log in CW. This suggests that UV-C technology could be potentially applied as a treatment process for microbial inactivation in CW. The UV-C inactivation potential in CW was assessed by using nonpathogenic microbial organisms including bacteriophages. The inactivation curves of these tested microorganisms were best described by log-linear and non-linear kinetics. The UV-C inactivation dose for a 5-log reduction was around 40 mJ cm−2 for E. coli (25922), S. Typhimurium (13311), L. monocytogenes (19115), and T1UV. Therefore, UV-C irradiation could be used as a prospective alternative to traditional thermal processing technologies for inactivation of E. coli, L. monocytogenes, and S. Typhimurium populations to help ensure the safety of fresh CW. The scaling-up of the UV-C apparatus, toxicity analysis, and quantification of sensory changes in this beverage will be subject to further investigations for successful implementation of technology. The scale-up equipment has already been developed by the research team and is under research trials for determining its efficacy in inactivating microorganisms and other spores in juices on a larger scale.
Practical applications
This study investigated the ultraviolet-C mediated inactivation of model bacteria and viruses in coconut water. The ultraviolet-C dose of 40 mJ cm−2 inactivated all microbes by at least 5-log CFU ml−1 except MS2 where a higher dose (100 mJ cm−2) was required. The D10 values observed for Escherichia coli, Salmonella Typhimurium, and Listeria monocytogenes were 3, 5.48, and 4.58 mJ cm−2. Ultraviolet-C irradiation is an attractive food preservation technology and offers opportunities for horticultural and food processing industries to meet the growing demand from consumers for safer food products. Ultraviolet-C technology has several advantages over thermal processing technologies such as lower energy consumption, better nutrient retention, and reduced loss of sensory attributes. Knowledge gained through this study will facilitate significant advances in the field of food engineering. This study would also provide technical support for the commercialization of ultraviolet-C technology for treating turbid liquid foods such as coconut water.
Footnotes
AcknowledgEment
The author(s) extend their gratitude to Trojan Technologies for providing support and guidance in this project.
Declaration of conflicting interests
The author(s) declared no potential conflicts of interest with respect to the research, authorship, and/or publication of this article.
Funding
The author(s) disclosed receipt of the following financial support for the research, authorship and/or publication of this article: This study is financed under the Agriculture and Food Research Initiative (Food Safety Challenge Area), United States Department of Agriculture. The Award number for the grant application is 2015-69003-23117.