
Abstract
Drying with variable air temperature is a technique to decrease the drying time, preserve quality and maintain the nutritional components of products. The aim of this study was to find the effect of different heating patterns with variable air temperatures on the drying time, energy consumption and the quality of garlic as well as investigate the critical times to change the air temperature. The constant air temperatures were 50, 60, and 70 °C, and the variable air temperature included three patterns of 60 °C → 50 °C (I), 70 °C→50 °C (II), and 70 °C (30 minutes) →50 °C (III). Despite preventing garlic slices’ color changes in the constant air temperature of 50 °C, the antioxidant contents of the samples reduced significantly (45%), and the drying time was 136 minutes. At the air temperature of 70 °C, the color changes peaked, and the drying time was 65 minutes. The best drying condition was observed among the variable air temperature by pattern III. The drying time and loss of antioxidants were 24% and 45% lower than the one in the constant air temperature of 50 °C; besides, the effective moisture diffusivity was 24% higher. The color changes of these samples were lower compared to other patterns and the final product had acceptable quality and was produced in an optimal time.
INTRODUCTION
The convective drying of foods and agricultural products has high efficiency and comprehensive application. However, energy consumption is high in this method, and the quality of the dried product depends on the drying rate and the functional conditions of the dryer, such as air temperature, humidity, and velocity. Therefore, reducing energy consumption and preserving the quality of the dried product is an important challenge in this field. Because various quality parameters and standards determine the marketing value and price of the dried product, which vary across products. In addition to the functional conditions of the dryer, pretreatments could affect the quality of dried products and drying time. The common pretreatments used in various products include ultrasound, microwaves, and chemical treatments. Papu et al. (2014) studied the effect of slice thicknesses and pretreatments on the quality of garlic. The optimal quality was observed in slices with a thickness of 3 mm and pretreated with the KMS. Tahmasebi-pour et al. (2014a, 2014b) reported that the KMS pretreatment by increasing the effective moisture diffusivity (Deff) caused a decrease in drying time. However, using carboxymethyl cellulose increased the processing time. Rostami-Baroji et al. (2017) studied the effect of ultrasound and microwave pretreatments on carrot drying. According to their results, the 28-kHz ultrasound for 10 minutes and microwave with 1 W/g for 15 minutes reduced the drying time by 15.3% and 5%, respectively. Kowalski and Szadzinska (2014) also reported a 3.5% and 11.7% decrease in cherries’ drying time due to using osmotic dehydration and osmotic dehydration in combination with an ultrasound. Similar results were reported by Ghorbani et al. (2015) on the effect of ultrasound and osmotic dehydration in decreasing plums’ drying time. In addition to using pretreatments, some researchers used combined methods such as controlling the drying conditions and pretreatments to reduce the drying time and energy consumption and preserve the dried product's quality. Abano et al. (2011) studied the effect of hot air temperature (45, 50, and 55 °C) and pretreatment on the quality characteristics of garlic during convective drying. The results showed that samples pretreated with the KMS had the higher lightness and less redness than fresh garlic in all temperatures. To reduce energy consumption and preserve product quality, some studies combined drying methods in sequence. For example, the process first started with ultrasound, and hot air drying was used after a while. Yang et al. (2018) studied the drying process of garlic at the air temperature of 50, 60, and 70 °C. They showed that a combined hot air-ultrasound dryer could accelerate the drying process. The combined hot air-microwave or hot air-infrared dryer was studied in green peppers, vegetables and sweet potatoes (Hebbar et al., 2004; Lechtanska et al., 2015; Onwude et al., 2019).
One of the new methods used recently is intermittent drying, in which the drying conditions change during the process. In this method energy efficiency is high (Chua et al., 2002, 2003; Kowalski and Pawłowski, 2011). For example, changes in the drying conditions include variations in the air temperature and humidity in convective drying (Nalbandi et al., 2021). In this method, the drying starts with a specific initial temperature. When the temperature of the product reaches the critical temperature by progressing, the air temperature is reduced below the critical limit to prevent the product temperature from increasing. The temperature that causes damage to product quality is called the critical temperature and varies across products. Through this technique, product quality loss caused by the temperature increase can be prevented and it is possible to use the benefits of drying with high air temperature. Higher air temperature at the beginning of the process could accelerate the drying process and decrease the drying time. Reducing the temperature at the critical point preserves the product quality, such as the final color and nutritional component of the dried product. Simulation of heat and mass transfer was used to determine the proper time for changing the air temperature and drying condition. It helps detecting of the temperature and moisture profile as a function of boundary conditions, and performance parameters of the dryer (Nalbandi et al., 2021). It is possible to determine the proper performance parameters of the dryer through the simulation results because temperature and moisture affect the quality of products. In other words, the behavior and changes in the engineering and quality characteristics of products depend on the drying temperature and the cycles of temperature variation, which are different across the products and rely on the chemical composition of a product and the anticipated quality of the final product. Developed simulator and experimental measurement as the pre-experiment showed that drying with the variable air temperatures is beneficial and reduces drying time (Nalbandi et al., 2021). Using a high air temperature continually in the drying causes irreversible heating injury and quality loss in the final product. It is important to note that the optimal combination and cycle in combined drying methods should be determined to detect the proper temperature and time of temperature changes in the process; this leads to optimizing the energy consumption, drying time, and product quality.
This research aimed to study the different air temperature combinations and sequences in the convective drying of garlic slices using variable air temperature patterns. The drying time and energy consumption through the process, engineering, and quality characteristics of garlic slices, including effective moisture diffusivity, color changes, shrinkage, and density and antioxidant and polyphenol content were studied. Finally, the best pattern to vary the air temperature was determined.
MATERIALS AND METHODS
Preparing the samples
The garlic sample was purchased from the local market and kept at 4 °C. The sample was removed from the refrigerator 2 hours before every experiment, and the garlic cloves were peeled after reaching the ambient temperature. Then, the sample was sliced into slices of a thickness of 2.5 mm by a rotating disc slicer and was put in a solution of KMS 5% for 10 minutes (Abano et al., 2011). After wiping off the surface water, these were placed on a perforated tray in a single layer to prepare them for transferring into the dryer. The initial moisture content of the samples was measured in the oven at 102 ± 1 °C according to AOAC standard method with three replications (AOAC, 1990).
Drying the samples
The samples were dried using constant and variable air temperature methods.
Drying with constant air temperature
A convective dryer was used with two perforated trays and a heater with 13 kW, which could increase the air temperature up to 85 °C to dry the samples. A digital scale (AND model GF 3000, Japan with ±0.1 g accuracy) was placed outside the dryer connected to a computer with RS232. One of the trays was placed inside the dryer on a shelf directly attached to the scale and the second tray was individually placed on a shelf not connected to the scale (Seiiedlou et al., 2010). After the dryer had reached a stable state in terms of air temperature and velocity, 100 g of samples were placed on the tray, which was connected to the scale, weighed with the scale and recorded at intervals of 1 minute. On the second tray, other samples were placed to measure the quality characteristics, such as slice volume, shrinkage, color, antioxidant, and polyphenol contents, which were measured at the beginning and end of the experiments. The samples were dried at the air velocity of 1.2 m/s and constant air temperatures of 50, 60, and 70 °C until their moisture content reached 0.3 gw/gdm. The experiments were conducted with three replications. The energy consumption through the drying process was monitored and recorded using a power analyzer every 10 minutes.
Drying with variable air temperature
In drying the garlic samples through variable air temperature, the air velocity was 1.2 m/s, and three patterns of air temperature variation were used accordingly:
Drying was started at the air temperature of 60 °C and followed with the air temperature of 50 °C (60 °C→50 °C); Figure 1-I Drying was started at the air temperature of 70 °C and followed with the temperature of 50 °C (70 °C→50 °C); Figure 1-II Drying was started at the air temperature of 70 °C for 30 minutes and followed the process at the temperature of 50 °C (70 °C (30 minutes) → 50 °C); Figure 2
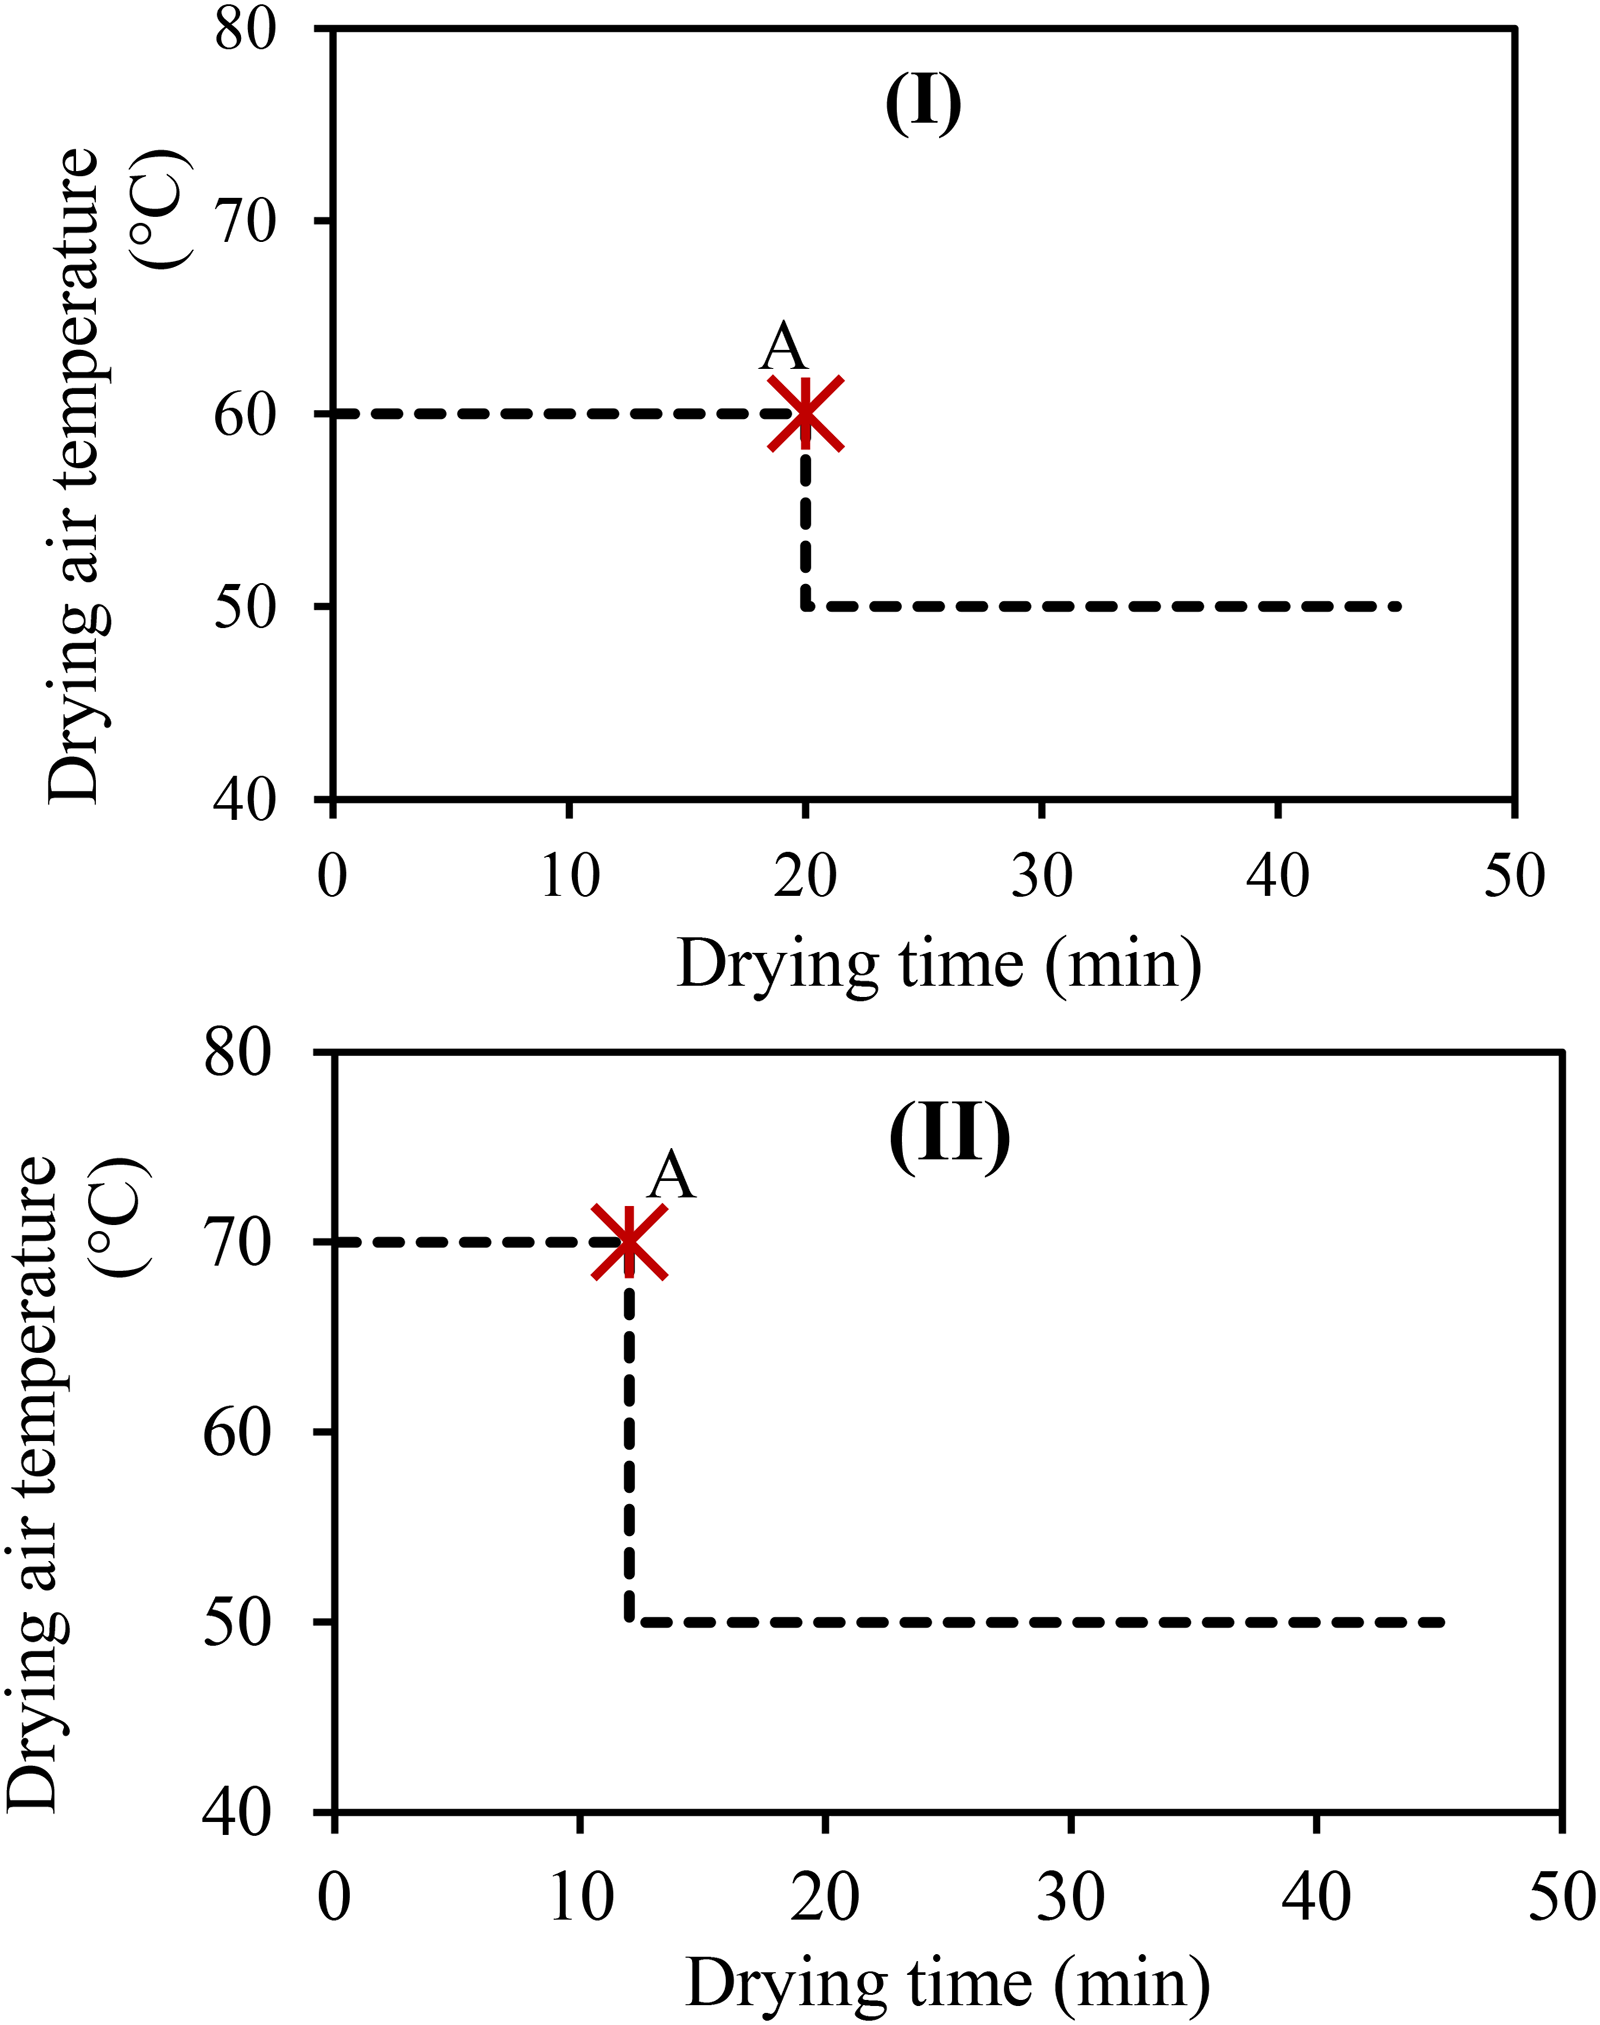
Air temperature reduction in patterns I and II; Point A shows the time that the air temperature reduces to 50 °C.
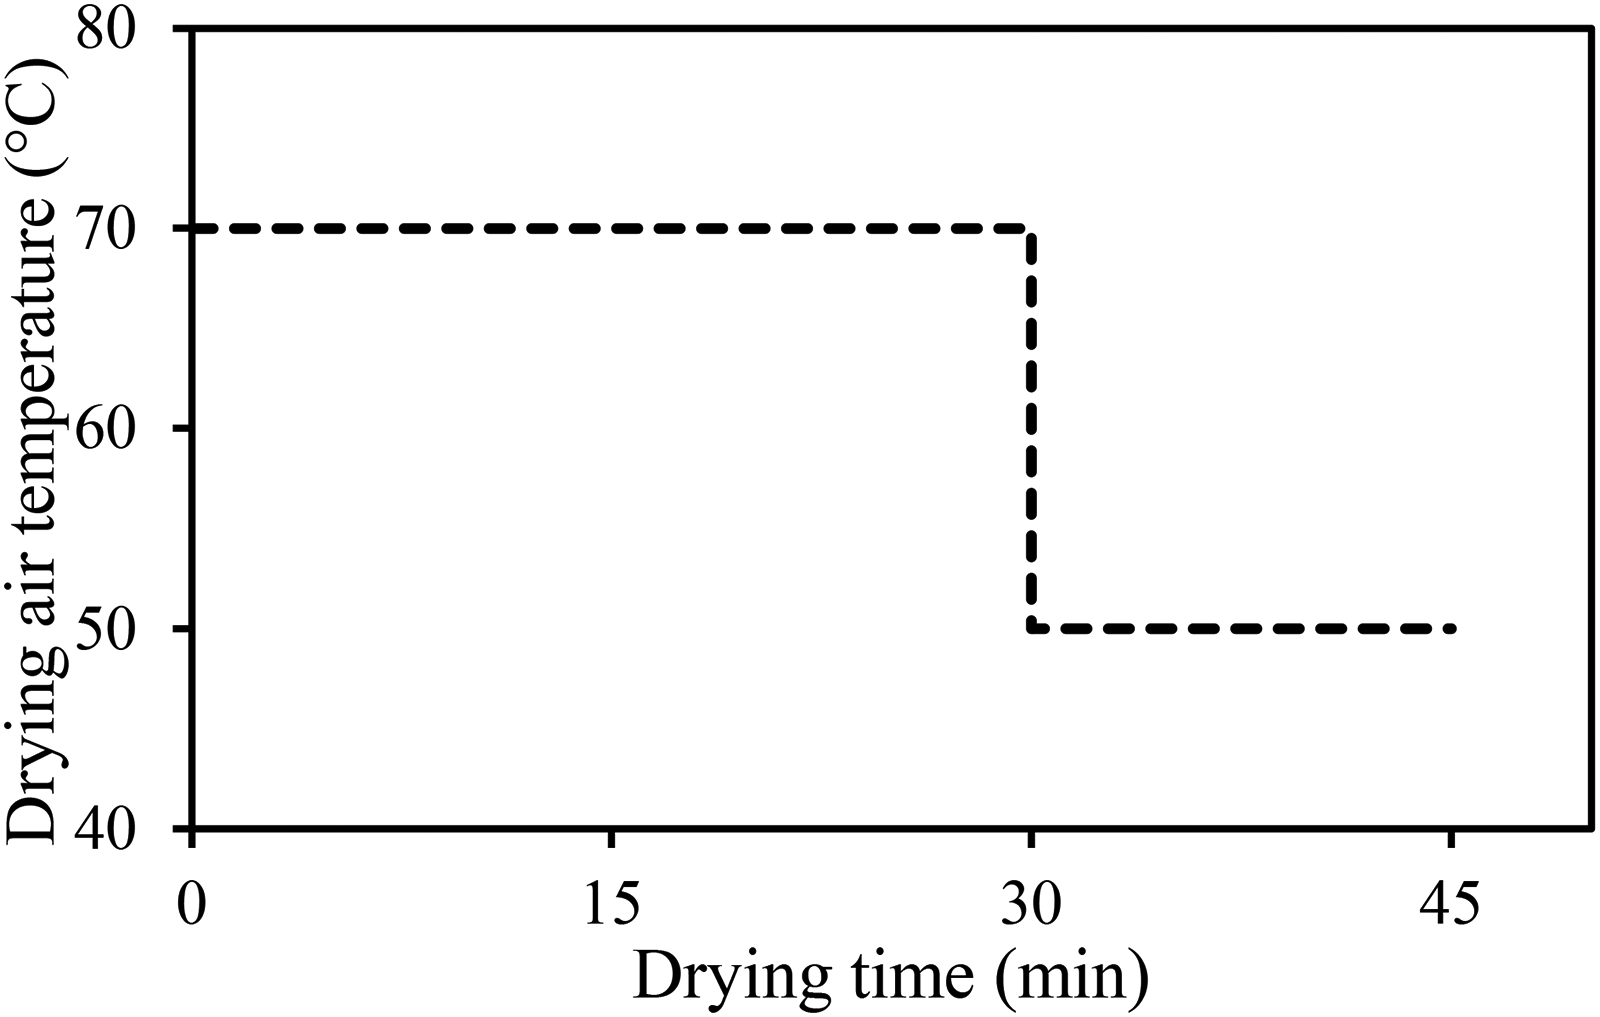
Air temperature reduction in pattern III.
All three patterns were performed until the samples’ moisture content reached 0.3 gw/gdm. The proper time to change the air temperature in patterns I and II were determined based on the simulation results and temperature profile. At the point of A, the product temperature reached 50 °C; to prevent passing the product temperature from 50 °C, the drying air temperature was reduced in the related time, because the optimal quality of garlic was achieved at the air temperature of 50 °C. Therefore, the surface temperature of the samples was measured during the drying process. When the surface temperature of the samples reached 50 °C, the air temperature reduced from the starting temperature to 50 °C, and the cycle continued with 50 °C (Figure 1-I, II).
The initial results showed that in patterns I and II, the samples were dried at the air temperature of 70 and 60 °C for a short time (16% and 10% of total drying time, respectively). The short drying time with the high air temperature (70 or 60 °C) resulted in a slight difference between patterns I and II and the drying mainly took place with an air temperature of 50 °C. Most agricultural products can endure high temperatures for a short time, and there is a slight loss of quality; thus, pattern III was added to the treatments in this study. In this pattern, the process started with the air temperature of 70 °C and with no attention to the product's surface temperature, the drying process continued for 30 minutes. Then, the air temperature was reduced to 50 °C (Figure 2). Drying with an air temperature of 70 °C took 30% of the total drying time. In addition, both experimentally measured temperature profiles predicted by the simulator showed that the samples experienced an air temperature of 50 to 60 °C only 17 minutes, and then the air temperature was reduced to 50 °C.
To measure the surface temperature of the garlic slices during the drying process, another tray with two garlic slices was placed beside the second tray. Their surface temperature was measured every 30 seconds with K thermocouple connected to a data logger (DELTA-T LOGGER). The thermocouple was used as surface mounted and its head was located precisely on the surface of the slice and could measure the surface temperate of slices.
In each experiment, the quality characteristics of the samples were measured at the beginning and end of the process, and energy consumption was recorded.
Determining the effective moisture diffusivity
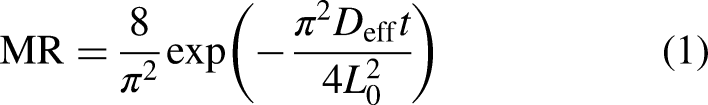
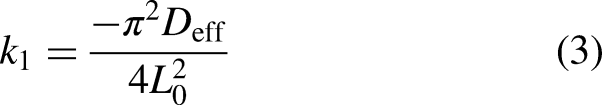
According to Fick's second law in diffusion, Equation (1) shows the samples’ moisture ratio (MR) as a function of drying time. Deff indicates the effective moisture diffusivity (m2/s), L0 is half of the initial slice thickness (m), and t is drying time (s) (Crank, 1975). Using the experimental drying data at each air temperature, the Deff was determined by drawing Ln MR versus drying time (Equation (2)) and calculated from the line slope fitted on the given data (Equation (3)) (Nalbandi et al., 2021).

Measuring the quality characteristics
Color of garlic slices
In each experiment, the color characteristics were measured at the beginning and end of the process. At the beginning of each experiment, three slices were placed in the hunter lab, and their color characteristics were determined. Then, they were put in the second tray beside other samples. After the process finished, the color characteristics of the same samples were determined again. The color characteristics included L*, a*, and b*, representing lightness, green to red and blue to yellow, respectively. The difference between the color of dried and fresh samples was used as a criterion of total color changes during the drying, which was calculated by Equation (4). The subscripts 0 and i indicate the color characteristics of fresh and dried garlic, respectively.

Shrinkage and density
To calculate the shrinkage and density of the samples, garlic slices’ volumes were measured using the toluene displacement method at the beginning and end of the drying process (Chakraverty and Poul, 2001). The density of the samples was calculated by dividing their mass by volumes. The samples’ shrinkage was calculated through Equation (5); where V0 and Vt indicate the initial and final volume of the samples (cm3), respectively, and Sh shows the shrinkage (%).
Antioxidant and polyphenol contents
To measure antioxidant and polyphenol content, the fresh and dried products at each experiment were extracted, and the DPPH solutions, gallic acid, sodium carbonate (Na2CO3), and Folin–Ciocalteu (F.C.K.) were provided. A spectrophotometer was set at 517 nm to measure the antioxidant content. In the first step, a 1950-µl DPPH was poured into a container, and its absorption was recorded. Then, 50 µl of garlic extraction was added to the micro-tube containing DPPH solution. After being kept for 15 minutes in the dark, absorption of the prepared sample (garlic extraction + DPPH) was recorded. The antioxidant percentage was calculated using Equation (6), where DPPH indicates the absorption value of this solution, material + DPPH is the absorption value of the solution and the sample's extraction.

To measure the polyphenol contents, 80 µl of methanol was poured into the container as a control sample and then put in the spectrophotometer. Then, 1600 µl of sodium carbonate was added to the 50-µl extraction. After 2 minutes, 80 µl of F.C.K. solution was added to the micro-tube containing the extraction and Sodium carbonate solution. F.C.K. solution is sensitive to light; therefore, the samples were put in a dark place for 30 minutes. Then, the solution was poured into the container, and the polyphenol amount of the solution was recorded at 720 and 690 nm. To use the gallic acid standard curve, it was assumed that the phenol in the sample extractions contained gallic acid. Finally, a linear equation resulting from the gallic acid standard curve was used to calculate the polyphenol content of samples.
Statistical analysis
The effect of methods and drying air temperature at six levels (including constant air temperature with 50, 60, and 70 °C, and variable air temperature with 60 °C → 50 °C, 70 °C → 50 °C and 70 °C (30 minutes) → 50 °C) were evaluated on the drying time, energy consumption, and garlic quality. The results were analyzed based on a randomized complete block design in three replications with MSTATC software. The mean comparison was performed by the Duncan test.
RESULTS AND DISCUSSION
Drying curves of the garlic slices at constant air temperatures
The drying kinetics of garlic slices was drawn as the moisture content versus the time at different air temperatures (Figure 3(a)). The drying time of samples to reach a specific moisture content level (0.3 gw/gdm) at the air temperature of 50, 60, and 70 °C was 136, 95, and 64 minutes, respectively. As shown in Figure 3(a), increasing the drying air temperature reduced the processing time, which agreed with the results reported by other researchers. Rasouli et al. (2011b) reported that the drying time of the garlic slices with 2 mm thickness were 85, 60, and 45 minutes in the air temperature of 50, 60, and 70 °C, respectively. In addition, the drying time of samples with a thickness of 3 mm at the same temperatures was 186, 127, and 86 minutes.
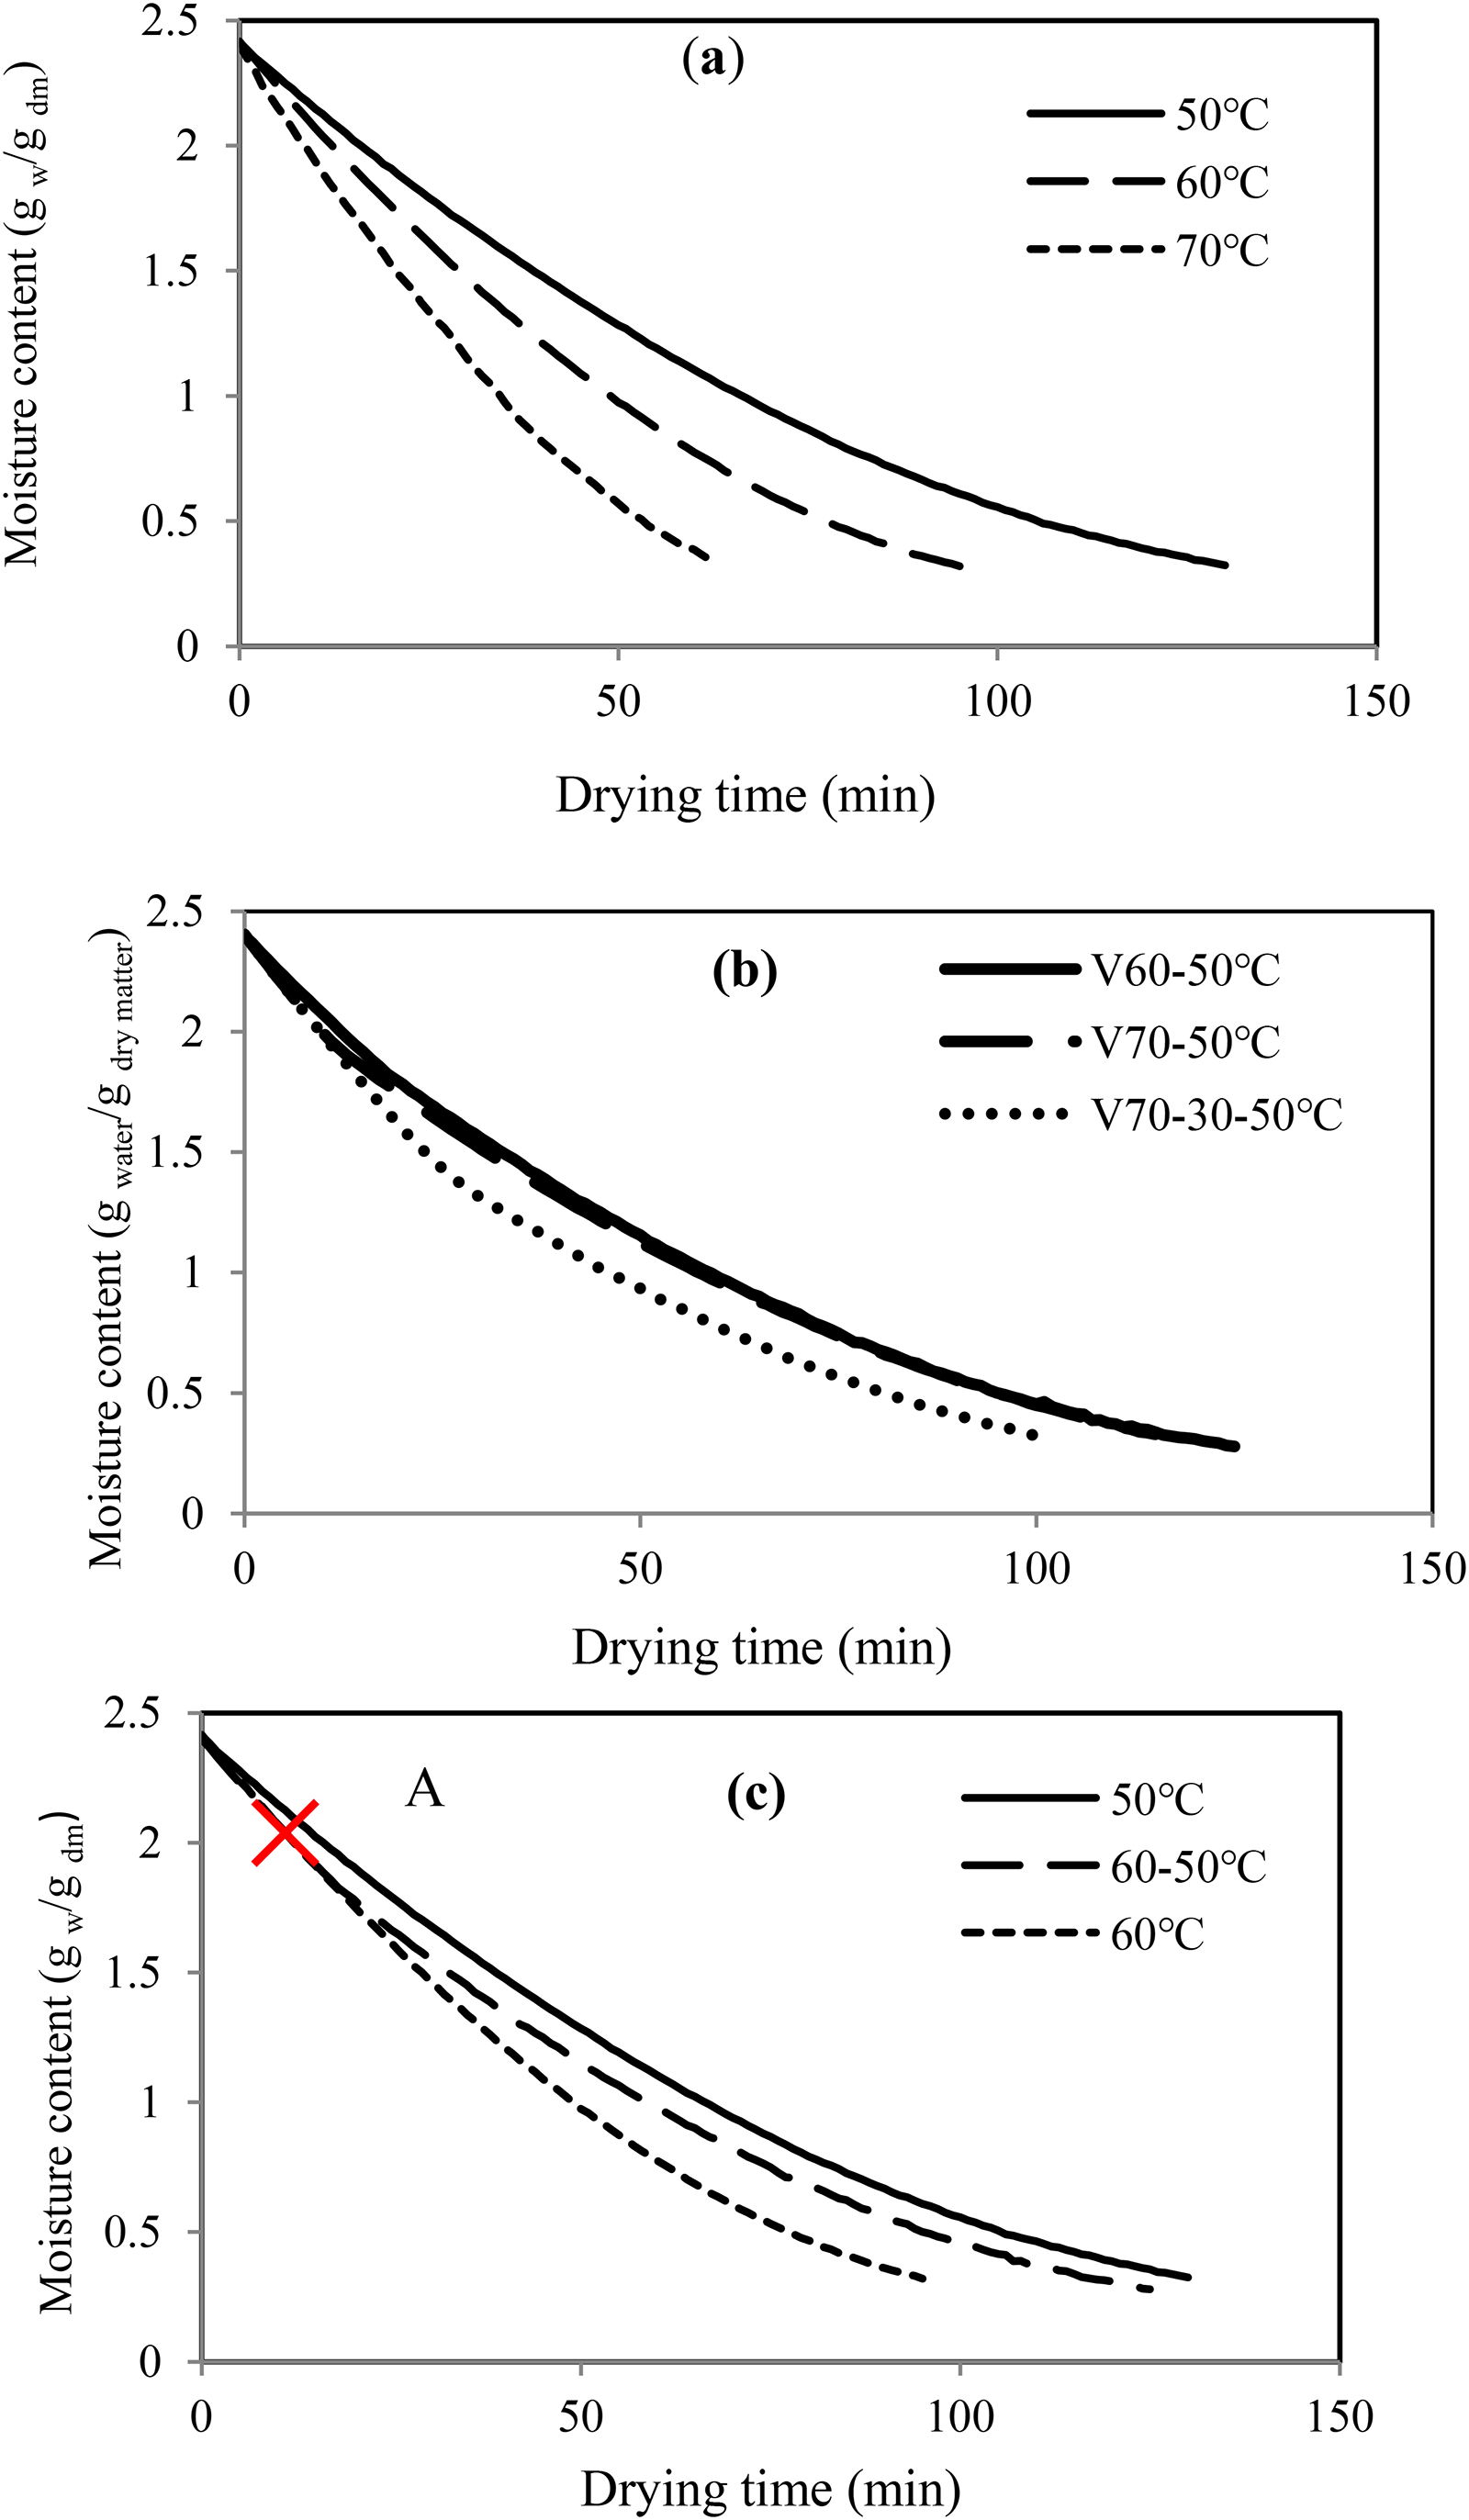
Drying curves of garlic slices: (a) constant air temperature, (b) variable air temperature, and (c) comparing pattern I with a constant air temperature of 50 and 60 °C (A: time of changing the air temperature from 60 to 50 °C).
Drying curves of the garlic slices at variable air temperatures
The drying time of garlic samples were 121, 120, and 103 minutes at variable air temperatures in the pattern I, II, and III, respectively (Figure 3(b)). Comparing the drying curves in the pattern I with the drying kinetics at constant air temperatures of 50 and 60 °C showed that the drying curve followed two stages. In the beginning, moisture content variation followed the drying curve of a constant air temperature of 60 °C. When the temperature changed from 60 to 50 °C (point A in Figure 3(c): 20th minute and 1.77 moisture content gw/gdm) the curve moved toward the drying curve of 50 °C constant air temperature. Hence, the drying time of products in this pattern (120 minutes) was less than that of samples at the constant air temperature of 50 °C (136 minutes) and more than the one at the constant air temperature of 60 °C (95 minutes). In this pattern, the samples dried at the air temperature of 60 °C only for 16% of the total drying time. For the rest of the process, these were dried under 50 °C, and this pattern reduced the drying time by 10.3%.
A similar procedure was observed in pattern II. The surface temperature of the samples reached 50 °C after about 12 minutes, which was less than 10% of the total drying time. In other words, the samples were dried with an air temperature of 70 °C only for 10% of the total drying time. During the rest of the drying, the air temperature was 50 °C, and the drying time (121 minutes) was less than that obtained at 50 °C (136 minutes) and more than the one at 70 °C (64 minutes). Comparing patterns I and II showed that the products were dried with an air temperature of 50 °C for 84% and 90% of the total drying time. The duration of drying when the high air temperature was dispensed at the beginning of the process (60 or 70 °C) and was a small percentage of the total drying time (16% and 10%). This resulted in a non-significant difference between the drying times of slices in patterns I and II (120 and 121 minutes, respectively). Therefore, pattern III was evaluated. As shown in Figure 3(b), the drying curve has a sharp slope in this pattern and the drying time was reduced by 16% compared to patterns I and II. In this pattern, the sample dried at the air temperature of 70 °C for 30% of the total drying time and dried at 50 °C for the remaining time. Increasing the period that the sample was dried at higher air temperatures reduced the duration of the process. The samples reached the moisture content of 0.3 gw/gdm after 103 minutes, which was reduced by 14% and 14.8% compared to the drying time in patterns I and II, respectively. In addition, compared to the constant air temperature of 50 °C, drying time was reduced by 24%.
Energy consumption and drying time of garlic slices at constant and variable air temperatures
The drying time and energy consumption during the drying of garlic slices with constant and variable air temperatures were analyzed (Table 1). The analysis of variance indicated that the method and the air temperature significantly affected the drying time at 1% probability level. The highest and lowest drying time was observed at constant air temperatures of 50 and 70 °C, respectively (Figure 4(a)). There were no significant differences between the drying times of samples in patterns I and II; because the sample was dried with the air temperature of 60 and 70 °C for a short time. However, the differences between the drying time by constant air temperature of 50 °C and pattern I was significant. Using the variable air temperature caused 14 minutes (10.3%) decrease in the drying time. In pattern III, the drying time was 33 minutes, which was 24% less than that obtained at the constant air temperature of 50 °C. As a conclusion, the drying time of slices in variable air temperatures was shorter than the one in constant air temperature of 50 °C. Despite using different air temperatures in the drying process, the methods and drying air temperature had no significant effect on the energy consumption, which can be due to the different drying times of samples at different air temperatures (Figure 4(b)). Drying air with a higher temperature has high enthalpy that leads to a decrease in the drying time. These effects, namely high air temperature and short drying time, balanced out each other's effect; therefore, energy consumption was not affected significantly by these variables. The highest and lowest energy consumption was 46.33 and 37.33 kW/h kgfresh product in the drying process with the constant air temperature of 6 °C and pattern II in variable air temperature, respectively.
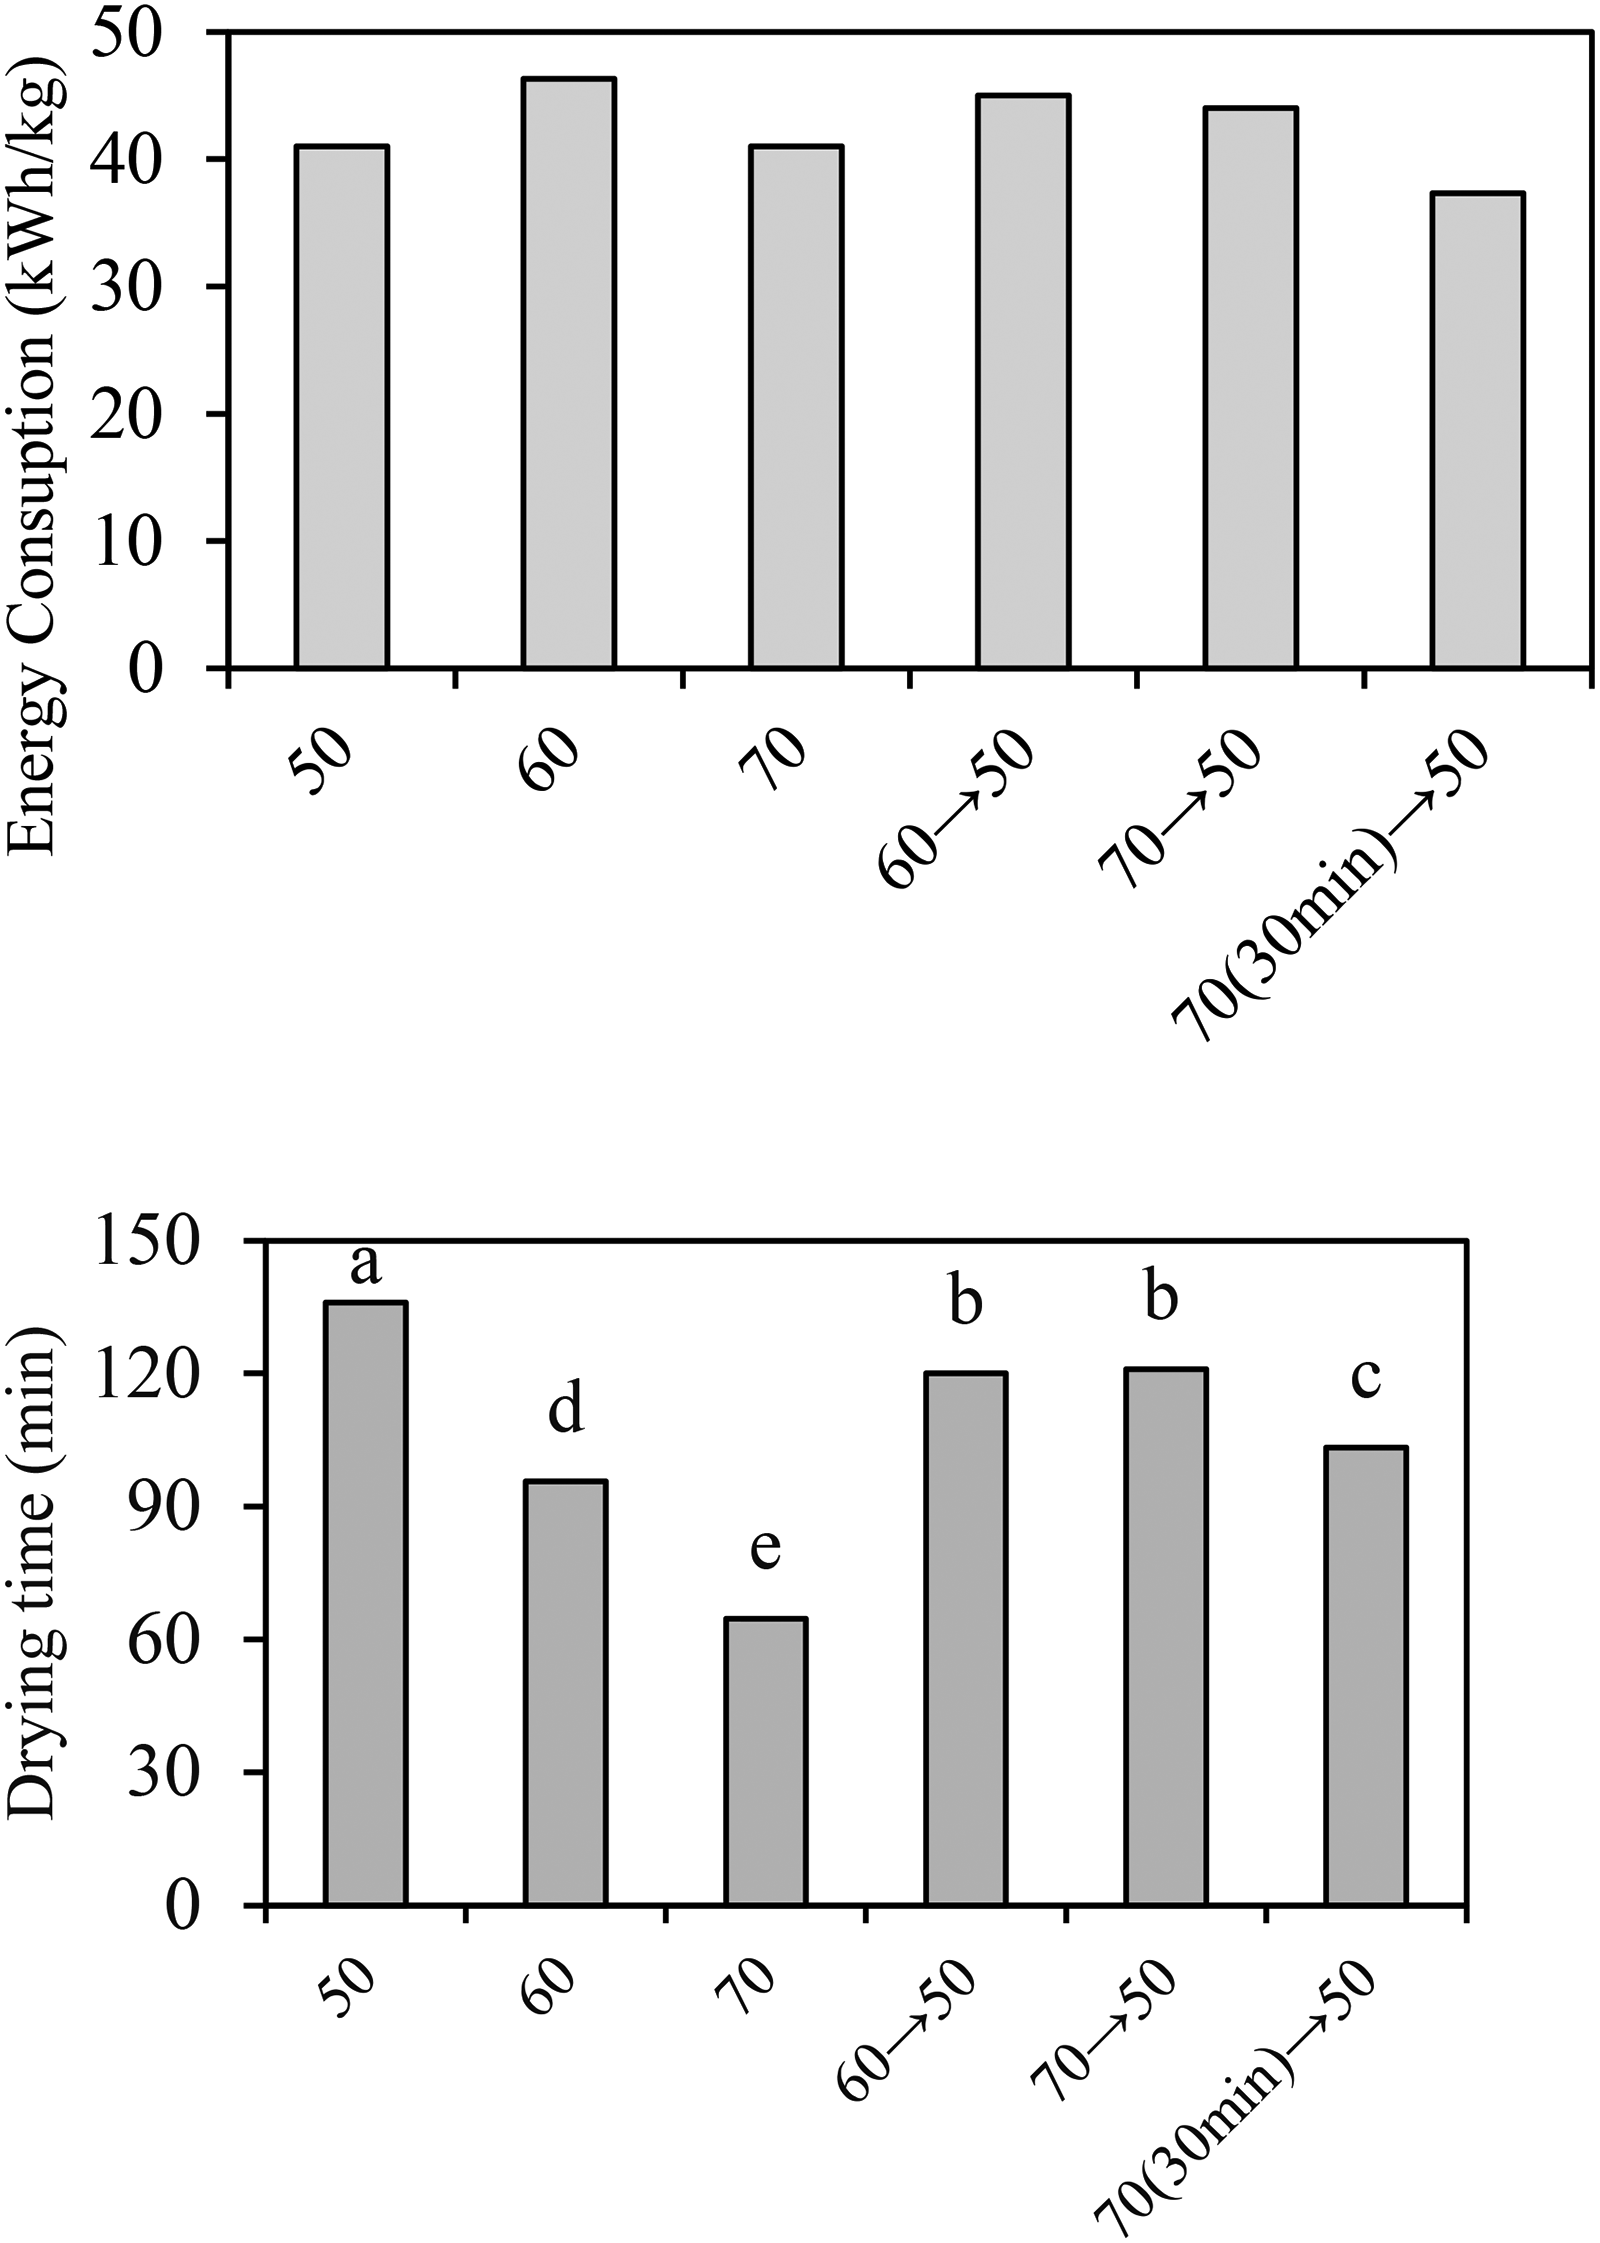
(a) Drying time and (b) energy consumption during drying garlic in studied treatments (different letters show the significant difference at a 1% probability level).
Effect of methods and drying air temperature on the drying time, energy consumption, and garlic quality.
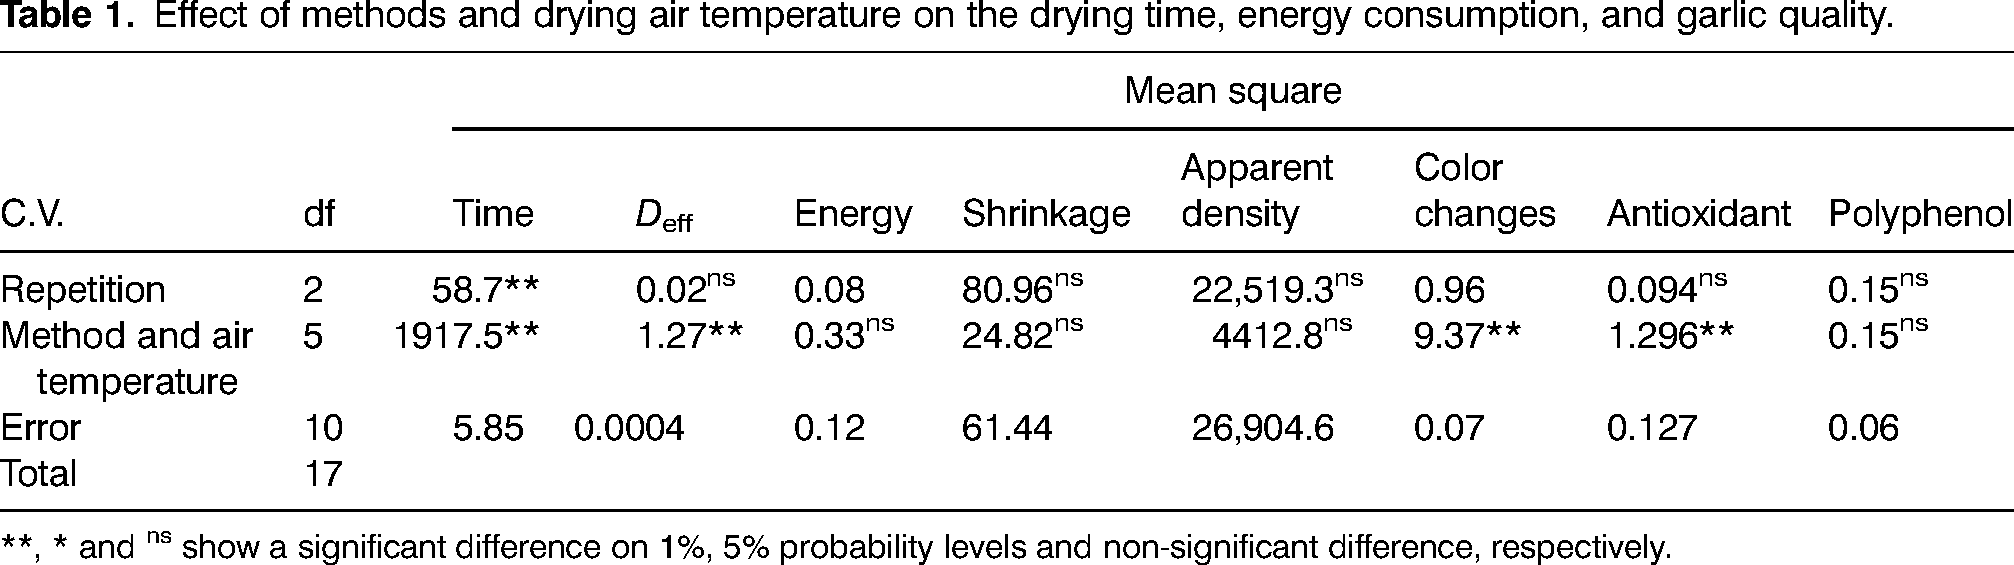
**, * and ns show a significant difference on 1%, 5% probability levels and non-significant difference, respectively.
Despite no studies on drying with variable air temperatures, the effect of changing drying air temperature on drying time in the intermittent drying method has been reported. Lopez-Ortiz et al. (2018) studied the effect of non-isothermal drying using a trapezoidal wave for a heating–cooling profile on garlic drying. They showed that the ascending heating–cooling treatment (started at 40 °C, AC) had a higher drying rate than the descending heating–cooling treatment (started at 60 °C, DC). Kowalski and Szadzinska (2014) reported that a stepwise changing air temperature reduced the drying time in the convective drying of cherries. At drying with a constant air temperature of 60 °C, the processing time was 453 minutes. In intermittent drying, the drying time was reduced. Two modes were used to change drying air temperature, namely 5 minutes heating and 30 minutes cooling and 10 minutes heating and 40 minutes cooling. The drying time at these modes was 395 and 423 minutes. Similar results were reported by Szadzinska (2014) in terms of drying green peppers. He showed that the drying process of pepper with a constant air temperature of 70 °C took 188 minutes. However, using intermittent drying with an air temperature of 70 °C in two drying modes, including 5-on-30 off and 10-on-30 off, reduced the drying time to 134 and 140 minutes, respectively.
The surface temperature of garlic slices during drying at variable air temperature
Figure 5 shows the surface temperature of garlic slices at different and variable air temperatures. In all patterns, the surface temperature variation curves had three phases. In pattern I, the surface temperature of garlic at phase 1 increased from 22 to 50 °C in the 32nd minute (a→b). Due to the decreases of drying air temperature from 60 to 50 °C, at 32nd minute of drying process, the second phase started and the surface temperature suddenly decreased to 42 °C (c at time of 32 minutes). Then, it gradually increased to 50 °C, and at the end of drying process after 92 minutes, the surface temperature was about the same temperature of the drying air (c→d). It was assumed that the product's surface temperature would not increase more than 50 °C because the highest product quality is achieved at this temperature range. However, in the experiments, it was found that after air temperature reduced from 60 to 50 °C, the surface temperature suddenly decreased and after a relatively long period (about 60 minutes), the surface temperature again reached 50 °C (c→d), which was relatively long periods compared to the total drying time. The manner of air temperature changing and setting the dryer are the most important reasons for the sudden reduction of the samples’ surface temperature and its gradual increases. At the phase variation time when the air temperature suddenly was reduced from 60 to 50 °C, the heaters cooling down and heating up times were the main reason of sudden reduction of the samples’ surface temperature. Using a dryer set equipped with PID (proportional-integral-derivative) controller could prevent sudden reductions in surface temperature.
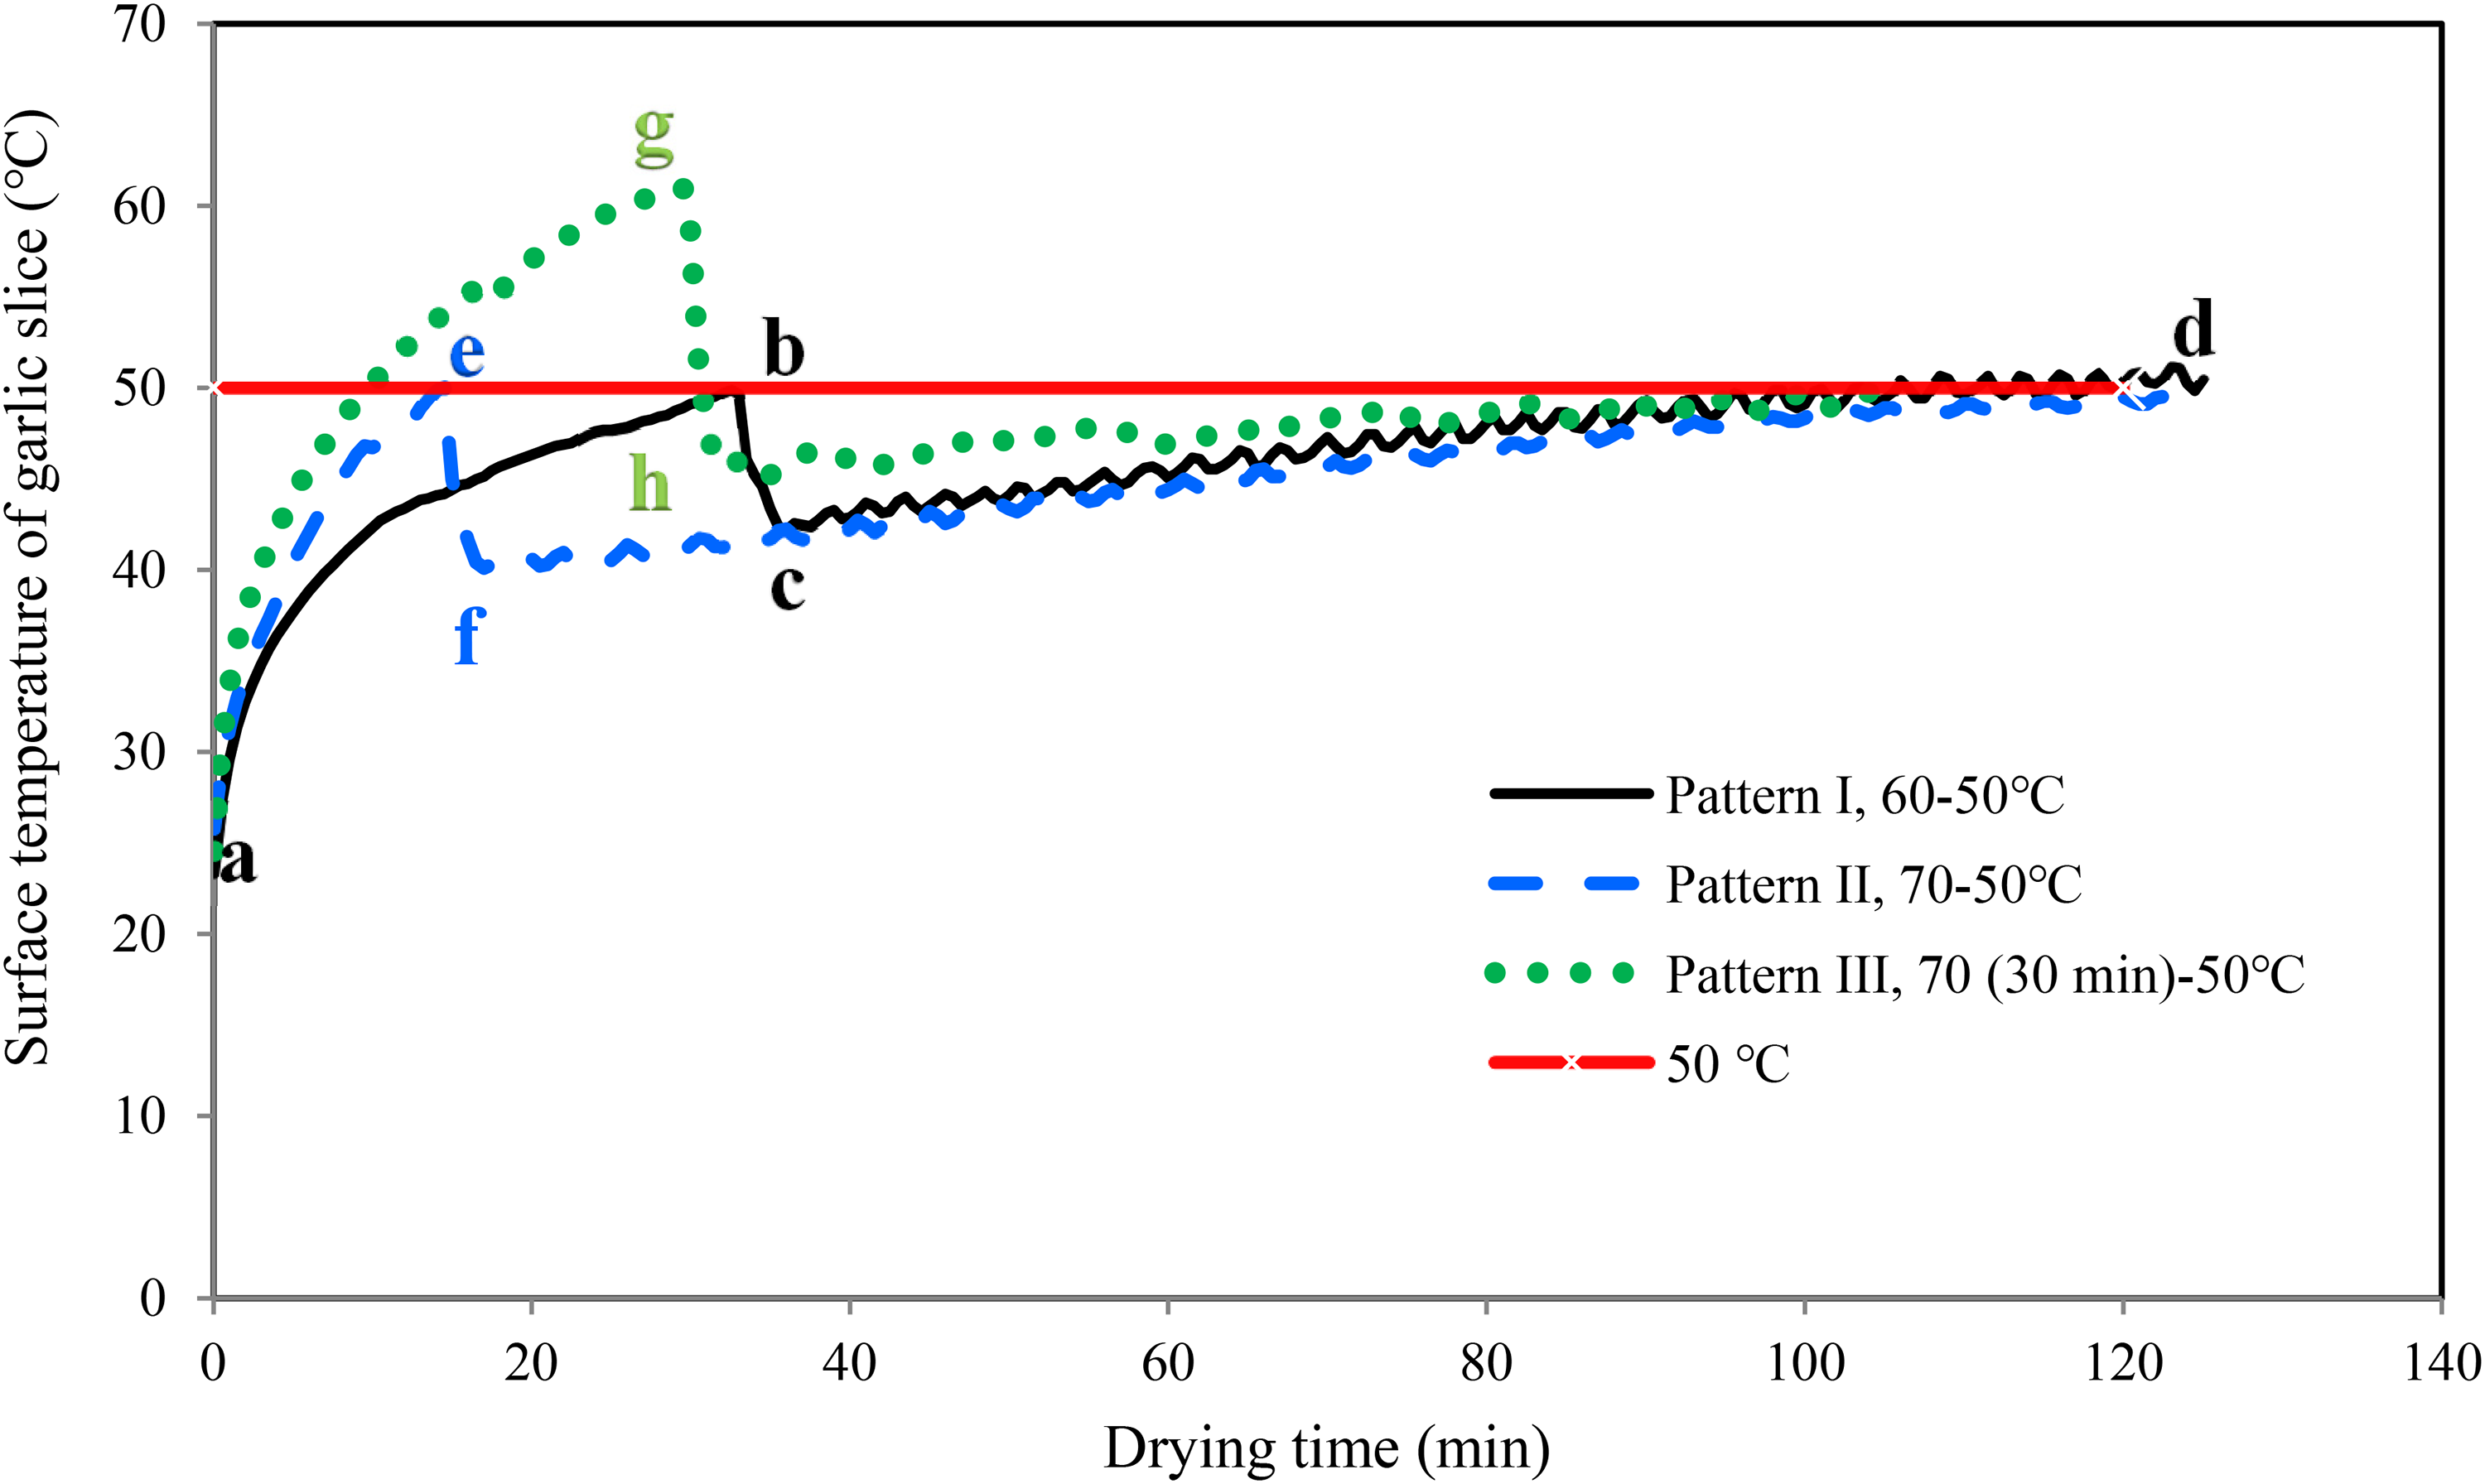
Surface temperature of garlic slices during the drying at different patterns of air temperature. (The letters on each graph indicate the time of change in surface temperature of garlic in different patterns. a, b, c and d are the critical points in the pattern I. a, e, f and d are the critical points in the pattern II. a, g, h and d are the critical points in the pattern III.)
Lilia et al. (2008) found similar results. They reported that by changing the drying air temperature in the intermittent mode, the sample temperature varied but, the rate of product temperature increasing was lower than the air temperature variation.
Kowalski and Szadzinska (2014) showed that the product temperature was a function of the drying air temperature. The variation mode of product temperature was similar to the air temperature variation but they were not exactly the same. For example, when the air temperature increased from 52 to 68 °C, the sample temperature increased from 23 to 40 °C. The sample temperature decreased to 38 °C, during the decline step of cycle (68→52 °C). In the next cycles, the sample temperature increased gradually and the differences between the air and sample temperature decreased. Finally, the sample and air temperature were the same after 320 minutes. Tetang et al. (2016) showed that changing the air temperature could prevent the excessive temperature increase of the product. Product temperature can be controlled as a function of air temperature variation. They also reported that there was a difference between the sample and the air temperature-increase rate. The air temperature-increase rate was higher than that obtained for the sample and led to the sample reaching the air temperature with a 50-minute delay.
The same manner was observed at pattern II. The drying time was 121 minutes and no significant difference was observed between the drying times of slices in patterns I and II. As it was mentioned before, most agricultural products can endure high temperatures for a short time without quality loss, thus, pattern III was studied. In pattern III, the product experienced a temperature above 50 °C (between 50 and 62 °C) for 17 minutes (about 16% of the total time). In this short time that the sample exposed with high temperature, the quality difference not occurred but the total drying time reduced 14% and 14.8% compared to the drying time in patterns I and II, respectively, and 24% compared to the constant air temperature of 50 °C.
According to results, by changing the drying air temperature, it is possible to prevent increasing the product surface temperature higher than the critical temperature (50 °C) for a long time and prevent decreasing product quality due to increase of its temperature from the critical point for a long time. Critical temperature is related to the product. For example, it is about 40–42 °C for rice and 50–52 °C for garlic.
Effective moisture diffusivity
The ANOVA analysis of air temperature and drying method effects on the Deff is shown in Table 1. The results indicated that the drying method and air temperature significantly affected the Deff at 1% probability level. The highest and lowest Deff was achieved at the constant air temperature of 70 and 50 °C, respectively (3.424 × 10⁻¹⁰ and 1.6734 × 10⁻¹⁰ m2/s). Rasouli et al. (2011b) reported that the Deff of garlic slices with 2 mm thickness in air temperatures of 50, 60, and 70 °C were in the range of 2.54 × 10⁻¹⁰ to 4.9 × 10⁻¹⁰ m2/s. The differences in Deff between previous research and the present studies could be due to the differences in samples’ thickness. Caginin et al. (2017) reported similar results. The Deff of garlic was in the range of 5.1 × 10⁻¹¹ to 9.07 × 10⁻¹¹ m2/s at the drying air temperature of 40 to 60 °C. The results indicated that there were no significant differences between the Deff samples at the constant air temperature of 50 °C and variable air temperature with patterns I and II. The Deff in pattern III was more than that the constant air temperature of 50 °C (Figure 6(a)).
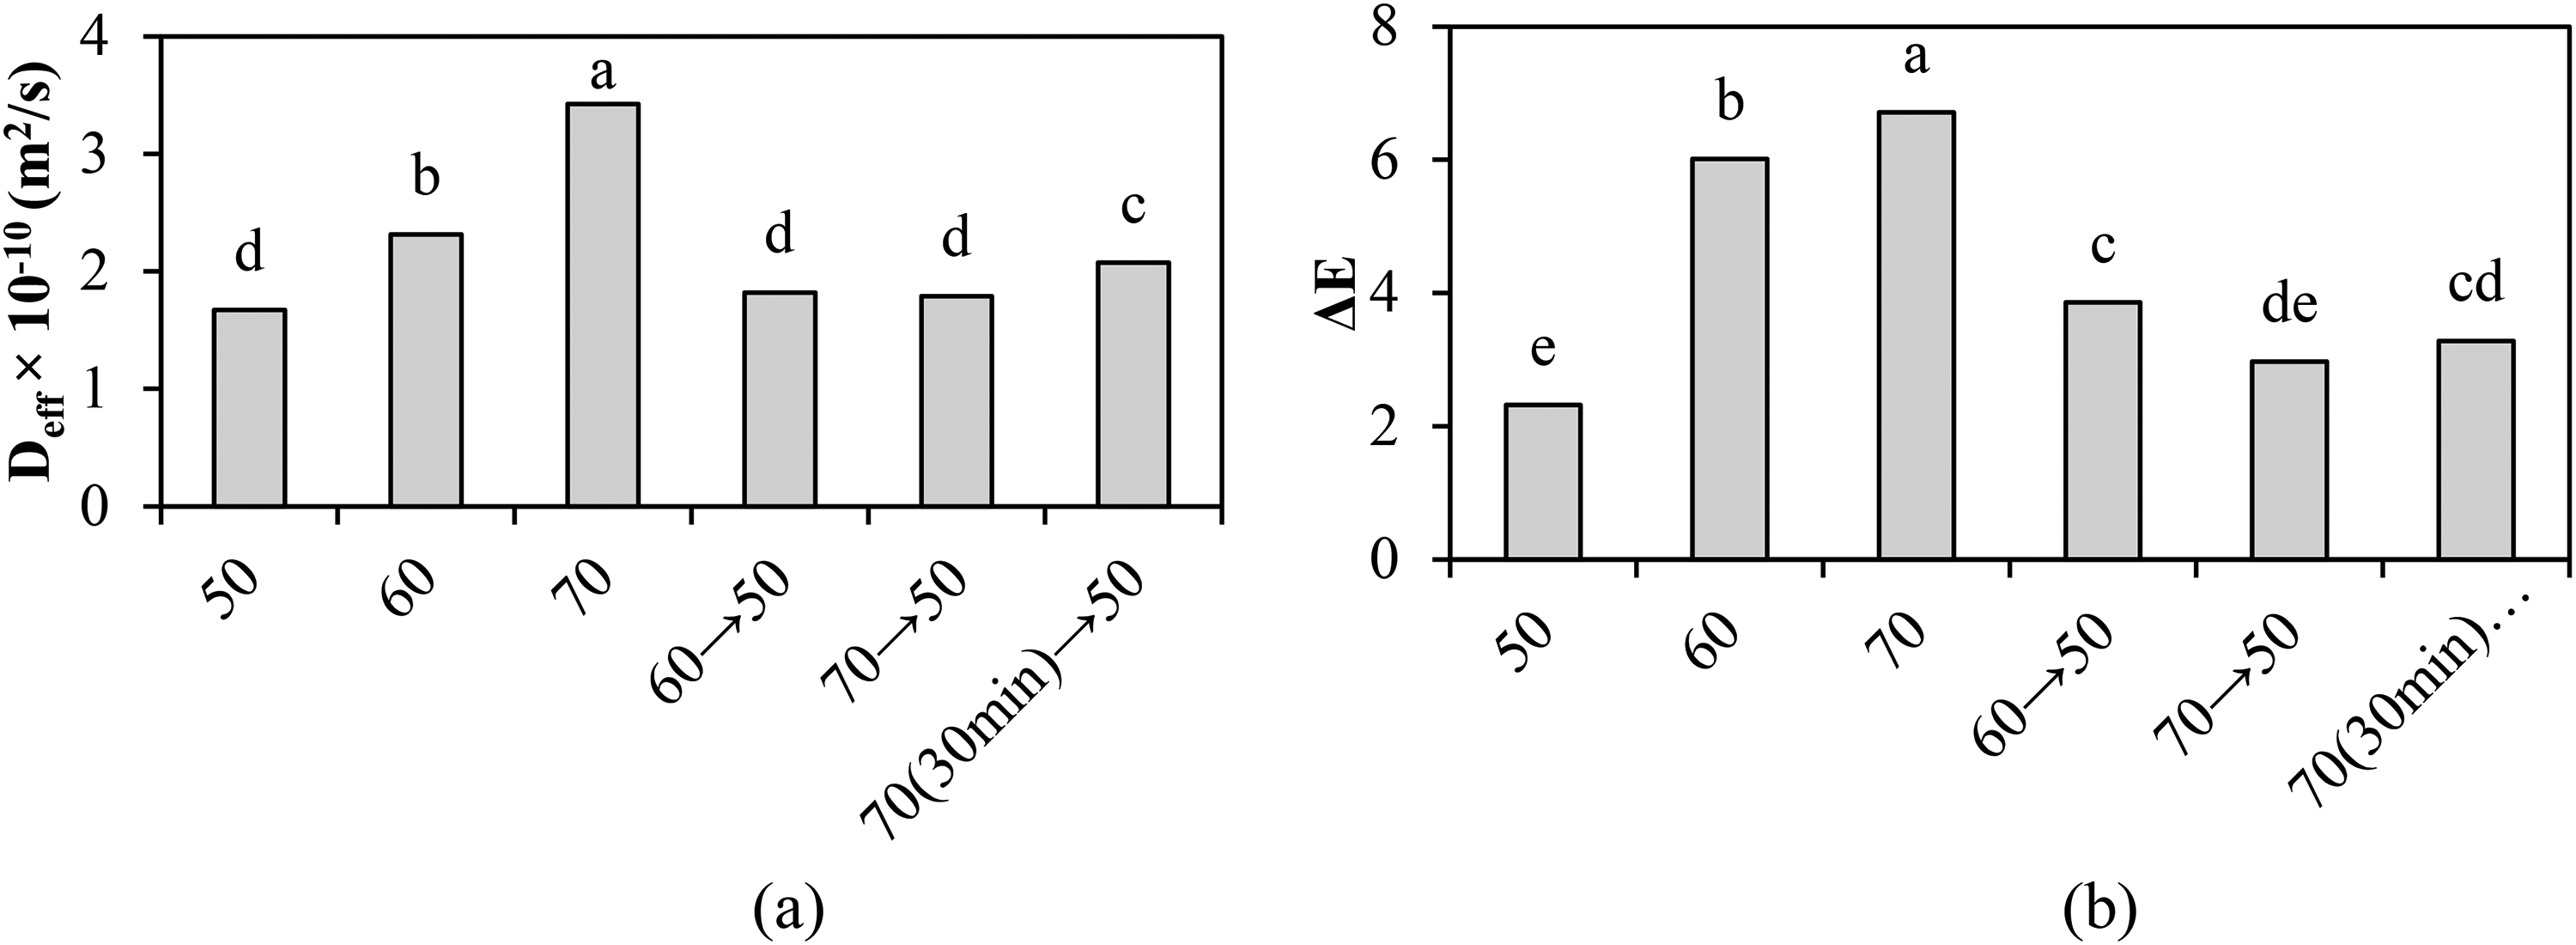
(a) Deff and (b) color variation of garlic slices in different treatments (different letters show a significant difference in 1% probability level).
López-Ortiz et al. (2018) reported that the Deff of garlic slices in intermittent drying was higher than in the samples dried with the constant air temperature. Kaveh et al. (2018) reported that the Deff of garlic samples at the air velocity of 0.5 and 1.5 m/s and temperatures of 40, 50, 60, and 70 °C was about 1.18 × 10⁻¹⁰ to 9.19 × 10⁻¹⁰ m2/s. The highest Deff was found in 70 °C temperature and 1 m/s air velocity, and the lowest belonged to 40 °C temperature and velocity of 0.5 m/s.
Color changes
The color of garlic changed through the drying process, and its intensity depended on the drying method and air temperature. The lowest color changes were observed through the constant air temperature of 50, and the greatest changes happened in the drying at a constant air temperature of 70 °C (Figure 6(b)). The color of slices in the variable air temperatures and patterns I and II was better than those dried in the constant air temperature of 60 and 70 °C and closer to the color of dried samples at the constant air temperature of 50 °C. This is a bonus point for the variable air temperature drying technique as product color is a priority in marketing.
Rasouli et al. (2011a) reported that the lowest color changes in dried garlic were achieved through the air temperature of 50 °C. Aware and Thorat (2011) reported increasing drying air temperature from 40 to 60 °C increased color changes of garlic. Abano et al. (2011) studied the effect of three pretreatments on garlic color changes in hot air drying. The results showed that the samples pretreated by KMS had higher lightness (85.95) and lower redness (1.36).
Shrinkage
The quality of the dried product was evaluated using various parameters, such as shrinkage. Measuring the volume changes (before and after drying) and calculating the shrinking of garlic slices indicated that the method and drying air temperatures had no significant effect on garlic shrinkage. Furthermore, the average shrinkage of the garlic slices was 58.84%. However, during drying with higher air temperatures like 70 °C and patterns I, II, and III in the variable air temperature, shrinkage was less than that obtained at 50 and 60 °C. Rasouli (2010) reported the non-significant effects of the drying air temperature on the shrinkage of garlic slices and the shrinking of the slices was around 67% to 71%. Yang et al. (2018) reported that ultrasound and drying air temperature did not affect the shrinking.
Density
The density of the garlic slices was calculated by measuring the samples’ volumes before and after the drying. The results showed that the sample density was not affected by the method and the drying air temperature. The highest and lowest density was observed at the constant air temperature of 50 °C (1293 kg/m3) and pattern III (1180 kg/m3), respectively. The average density of the garlic slices in all experiments was in the range of 1180 to 1293 kg/m3. It is important to note that the initial density of the samples was about 1060 kg/m3, and their density increased as the process progressed. The lower density of dried samples in the variable temperature method (pattern III) illustrates their high quality as compared to those dried at the constant drying temperature. Rasouli (2010) reported that the density of the garlic slices increased slightly as the moisture content reduced. It indicates that the volume reduction rate of samples during the drying process was higher than the moisture reduction rate. The final density of the garlic slices with 3 and 4 mm thickness and air temperature of 50 °C was 1329.4 and 1412.8 kg/m3, respectively.
Antioxidant and polyphenol contents of garlic samples
The antioxidant content in fresh garlic samples (after pretreatment) was about 6.63% and its final value (at the end of the process) was affected by the method and drying temperatures. The highest antioxidant content was preserved in the dried samples by the pattern I, which did not significantly differ from 60 °C, patterns II and III. The lowest amount of antioxidant content was recorded in the constant air temperature of 50 °C (Figure 7). Accordingly, increasing the air temperature from 50 to 60 °C could significantly preserve antioxidant contents. However, increasing the temperature from 60 to 70 °C reduced it. In addition, using variable air temperatures could preserve more antioxidant contents compared to the constant air temperature of 50 °C. Aside from antioxidants, the method and drying air temperatures did not affect the polyphenol contents. The remaining polyphenol in the samples after drying was about 1.667 to 2.229 mggallic acid/gdried product.
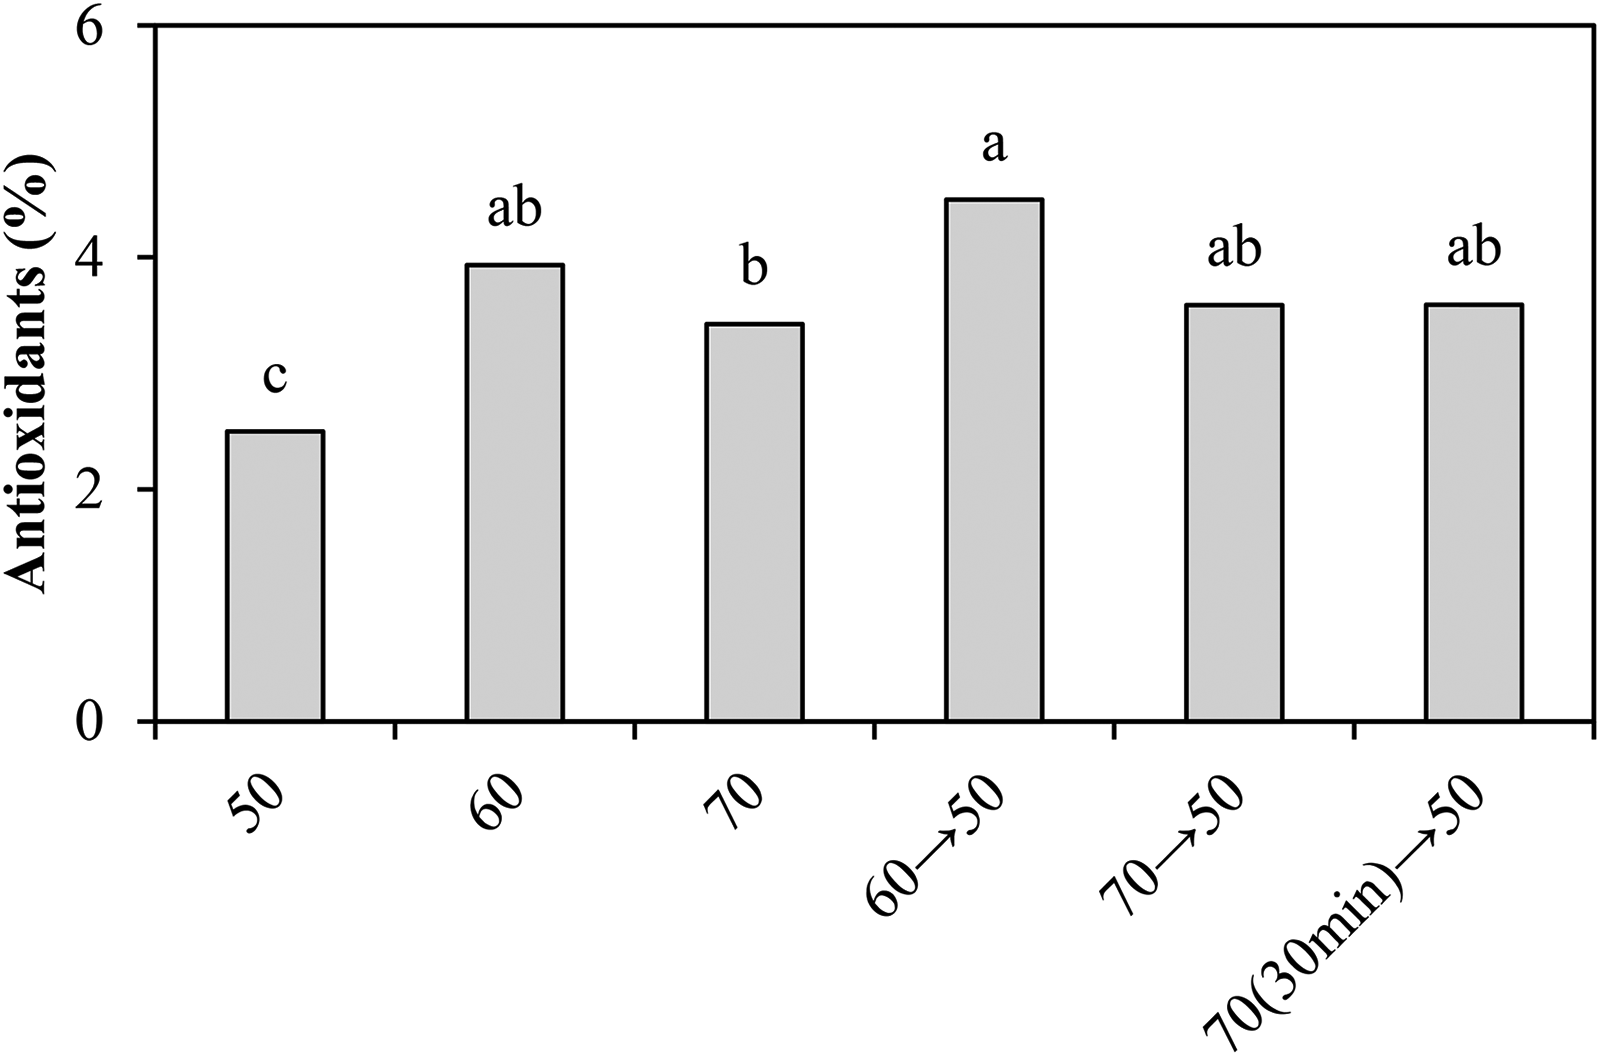
Antioxidant content variation in different treatments (different letters indicate a significant difference in 1% probability level).
Lilia et al. (2008) studied temperature cycle effects (60–40 °C and 40–60 °C) on Allinase enzyme activity in garlic drying. The Allicin-forming potential was 91% preserved by temperature cycling from 40 to 60 °C. It was 90% and 71% by drying at the air temperature of 40 and 60 °C, respectively. Aware and Thorat (2011) found that the highest Allicin retention was in the air temperature of 40 °C. Increasing drying air temperature from 40 to 60 °C decreased its retention.
Selecting the best treatment to dry garlic slices
According to the results, the lower air temperature prevented color changes in garlic slices. A lower color change was observed in the constant air temperature of 50 °C (2.319). However, the drying time in this treatment (136 minutes) was longer than others were and the samples contained the lowest antioxidant content and a 63.3% loss in antioxidant contents compared to the initial content. In the higher air temperature, like 70°C, although the drying time was minimum (64.67 minutes), samples’ color changes were at their maximum value (6.71). The proper drying conditions were observed in the variable air temperature; with pattern III. In this treatment, drying time and antioxidant losses were 24% and 45%, respectively, less than to those obtained in the constant air temperature of 50 °C. In addition, the Deff was 24% more than that of the 50 °C. Compared to the other treatments spatially the constant air temperature of 70 °C, the samples’ color in this treatment was better protected and had fewer changes. Therefore, in pattern III, the final product had good quality and was dried at an optimal time.
CONCLUSION
This study aimed to achieve a new method to dry heat-sensitive products while preserving their quality and reducing the drying time to prevent the products from overheating and nutrition component loss. The drying process of the garlic slices was conducted by two methods, including constant and variable air temperatures. The results showed that combining different air temperatures through the drying process had a positive effect on drying time reduction and preserving the quality of samples. The drying process of garlic slices with variable air temperature and pattern III (70 °C (30 minutes) →50 °C) not only reduced the drying time but also maintained the quality parameters, such as color and antioxidant contents of the samples. Therefore, the variable air temperature technique in the drying process was introduced as a successful method.
Footnotes
ACKNOWLEDGMENTS
The authors would like to appreciate the central laboratory and postharvest engineering laboratory of the University of Tabriz. The University of Tabriz approved this study.
DECLARATION OF CONFLICTING INTERESTS
The authors declared no potential conflicts of interest with respect to the research, authorship, and/or publication of this article.
FUNDING
The authors received no financial support for the research, authorship, and/or publication of this article.
INFORMED CONSENT
Written informed consent was obtained from all study participants.