
Abstract
Chicken skin, a major by-product of poultry processing, remains underutilized despite its high protein and lipid contents. This study aims to develop crispy chicken skin chips using three cooking methods: air frying, deep-frying, and oven baking. Physicochemical analyses indicated that air frying and oven baking significantly reduced lipid content by nearly 45% compared to deep-frying, while maintaining comparable protein levels. Sensory evaluation revealed that oven-baked chips achieved the highest consumer acceptance, exhibiting desirable crispness, color, and flavor profiles. Deep-frying enhanced browning intensity through pronounced Maillard reactions but led to greater fat uptake and higher energy values. Correlation and principal component analyses confirmed that each cooking method was uniquely associated with distinct quality attributes, influencing both composition and appearance. Microbiological analyses demonstrated microbial safety within acceptable limits across all processed samples. These findings highlight the potential of these processing methods to valorize poultry by-products, contributing to the development of sustainable and nutritious snack alternatives within the framework of a circular food economy.
Introduction
The poultry sector is experiencing steady growth, with global poultry meat production reaching 146 million tons in 2024 (Abbas et al., 2025) and accounting for nearly 40% of total meat production. This expansion is driven by increasing demand, particularly in developing countries, where poultry remains a vital and affordable source of animal protein (Samad et al., 2024). However, this intensification of production also generates a significant quantity of slaughter by-products, including feathers, viscera, and skin, which are often undervalued and disposed of as waste.
Chicken skin, in particular, is a major edible by-product of the poultry industry and is rich in collagen, lipids, and protein (Choi et al., 2016). Its biochemical composition makes it a promising raw material for developing high-value functional food products (Choe and Kim, 2019; Song et al., 2014). Moreover, recent consumer trends show a growing interest in protein-rich, low-carbohydrate, and indulgent snacks that provide both health benefits and sensory satisfaction (Jamadar et al., 2022). This has opened new opportunities for the development of innovative products derived from animal by-products, including crispy chicken skin chips (Mithun et al., 2025). Several studies and commercial initiatives have explored the transformation of animal by-products into snack-type foods, such as pork rinds, fish skin chips, and meat-based crisps, which are increasingly available on the market and well accepted by consumers. These products demonstrate the technical feasibility and commercial potential of valorizing animal skins and co-products into ready-to-eat snacks with appealing sensory properties (Choi et al., 2016; Mithun et al., 2025). Within the framework of sustainable food systems and circular economy principles, valorizing these co-products contributes not only to waste reduction but also to the creation of economically viable and nutritionally beneficial alternatives to conventional snacks (Kumar et al., 2019).
Cooking methods play a critical role in determining the physicochemical, microbiological, and sensory properties of the final product (Alugwu et al., 2022). Traditional frying techniques are generally associated with high fat content, thereby limiting their appeal to health-conscious consumers (Dangal et al., 2024). Alternative methods, such as air frying or oven baking, may help reduce oil uptake while preserving the desirable crispness. However, few studies have specifically focused on optimizing the technological, nutritional, and sensory qualities of chicken skin chips across different cooking methods. Therefore, the objective of this study is to systematically compare the effects of various cooking processes on the physicochemical properties, texture, microbiological safety, and sensory acceptability of chicken skin chips, to propose an innovative, sustainable, and market-relevant solution for the valorization of this by-product through the development of a high-quality, functional snack.
Materials and methods
Source of material
Fresh chicken breast skin (Pectoralis major) was obtained from a local butcher in Constantine, Algeria. Spices used for seasoning were purchased from local markets in the same city.
Manufacturing of chicken skin chips
Chicken skin chips were prepared as shown in Figure 1. Raw chicken skin (Pectoralis major) was first cleaned and trimmed to remove excess fat and connective tissue. The samples were then blanched in boiling water for 1–2 min to induce skin tightening. After blanching, the samples were subsequently cut into uniform pieces sized 5 cm × 5 cm. The skin pieces were seasoned and marinated (at 4 °C for 1 h) with salt (5%, w/w) and selected spices, namely Curry, coriander, and garlic powder (1%, w/w each), based on the total weight of the raw material. Three different cooking methods were applied: air frying at 180 °C for 15 min, deep-frying at 180 °C for 5 min, and oven baking at 200 °C for 20 min. After cooking, samples were cooled at room temperature and, where applicable, any excess oil was drained to enhance crispness. Prepared samples were then stored in air-tight containers until further analysis. A total of 27 samples of chicken skin chips were experimentally designed and manufactured (nine replicates per cooking method, using 1 kg of skin for each sample). Each replicate corresponds to an independent processing run performed on separate portions of raw chicken skin (biological replicates) prepared on different days to capture experimental variability, and replicates were treated and analyzed independently.
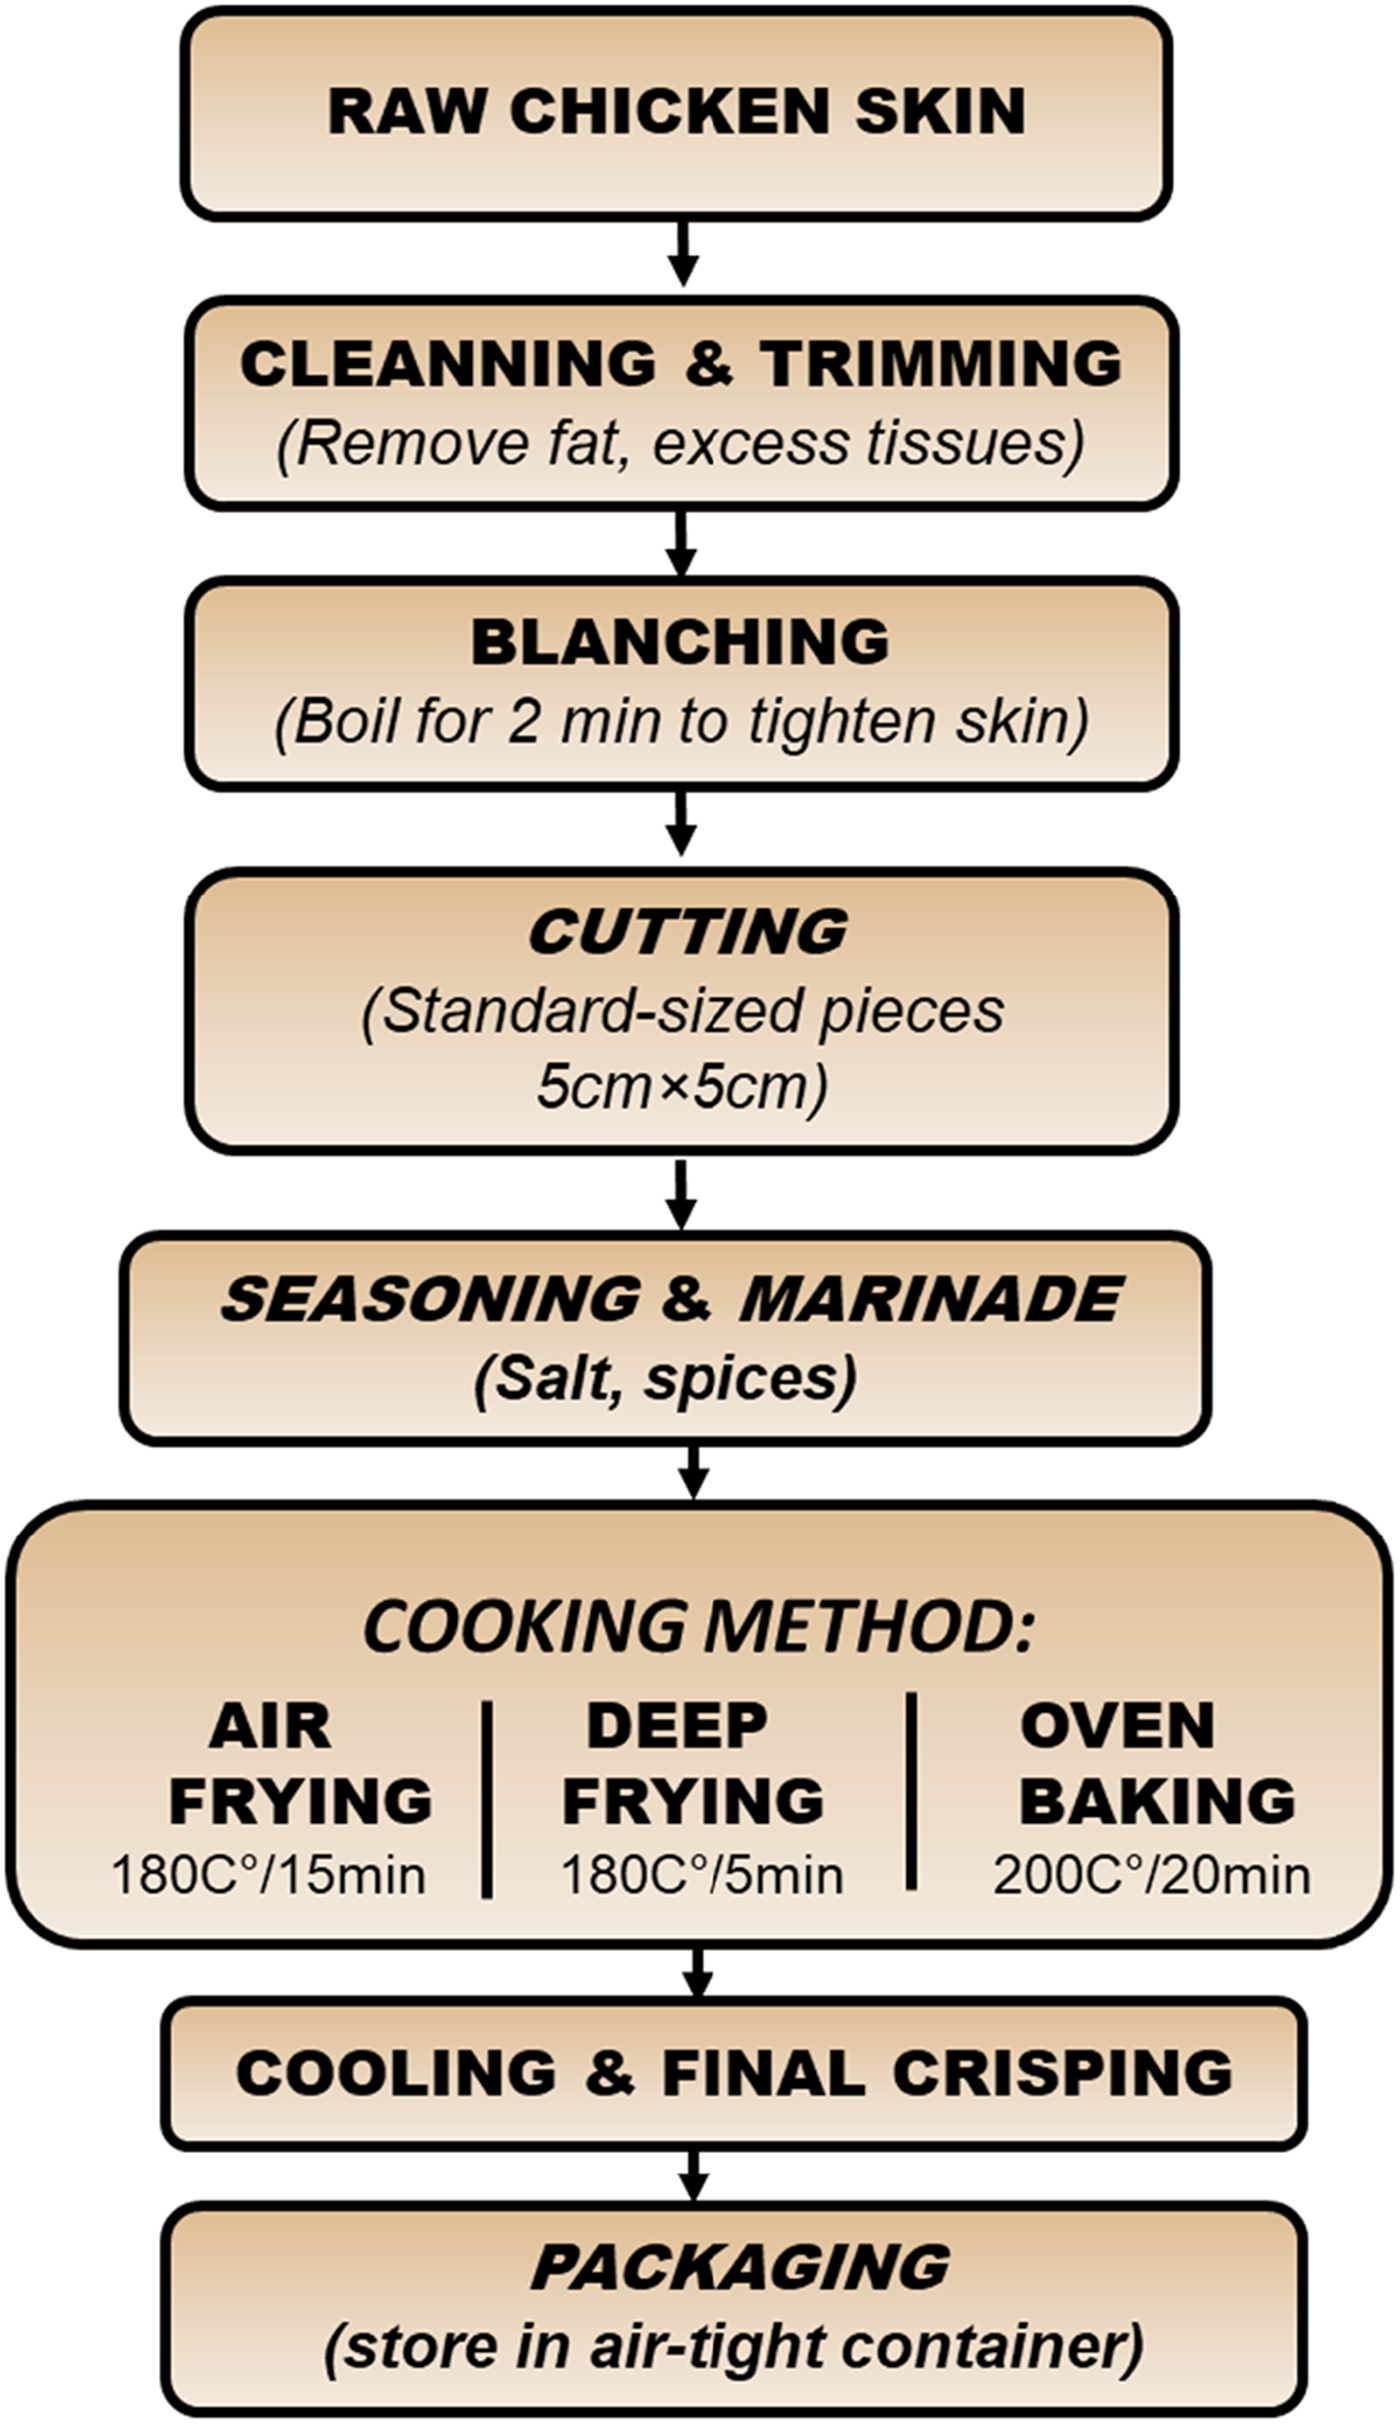
Flowchart of the preparation of chicken skin chips.
Proximate composition of chicken skin chips
The proximate composition of raw chicken skin and chicken skin chips was analyzed according to AOAC (2000) standard methods. Moisture was measured by drying samples in an oven at 105 °C until constant weight. Ash content was determined by incinerating samples at 550 °C for 6 h. Crude protein was determined using the Kjeldahl method with a nitrogen-to-protein conversion factor of 6.25, while fat content was determined by Soxhlet extraction with hexane. Glucose was measured using the Anthrone colorimetric method as described by Ashwell (1957); samples were acid-hydrolyzed, reacted with Anthrone reagent, and absorbance measured at 620 nm. Glucose served as the standard; results are expressed as glucose equivalents (w/w %). To estimate the energy value of chicken skin chips prepared by different cooking methods, the following conversion factors were used: 4 kcal/g for protein, 9 kcal/g for fat, and 4 kcal/g for carbohydrates. Energy (kcal/100 g) = (Protein × 4) + (Fat×9) + (Carbohydrates×4). All values were expressed per 100 g of sample on a wet-weight basis.
Technological properties of chicken skin chips
pH
The pH was measured using a pH meter (PHS-3CW microprocessor pH/mV meter, BANTE instrument) after 1 g of sample was mixed with 10 mL of distilled water for 15 s using a Polytron homogenizer (Polytron PT-MR 2100, Kinematica AG, Switzerland) (Lorenzo et al., 2008).
Estimation of carotenoid content
Carotenoid content in chicken skin chips was determined using a spectrophotometric method as described by Pérez-Vendrell et al. (2001). Pigments were extracted from minced skin samples using an acetone–hexane solvent system (1:1, v/v) with butylated hydroxytoluene (BHT) added as an antioxidant. The hexane phase was then collected, and absorbance was measured at 450 nm. Total carotenoid content was calculated using a β-carotene standard curve and expressed as µg per gram of sample (µg/g).
Browning Index (BI) measurement
The BI, an indicator of non-enzymatic browning resulting from Maillard reactions, was determined following a spectrophotometric method described by Guo et al. (2022). Briefly, 2 g of chicken skin chips were homogenized in a 60% ethanol–water (v/v) mixture and centrifuged to obtain a clear supernatant. The absorbance of the supernatant was measured at 420 nm using a UV-Vis spectrophotometer (Shimadzu Co., Ltd., Japan). The BI was expressed as absorbance units at 420 nm (A₄₂₀), which indicates the intensity of brown pigments formed during the Maillard reaction.
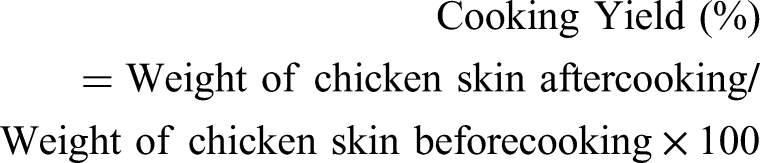
Cooking yield
Based on AMSA (2015), Chicken skin samples were weighed before and after cooking. Cooking was carried out under controlled conditions (e.g., air frying, deep-frying, and oven baking), and the samples were then cooled at room temperature prior to reweighing. The cooking yield was calculated using the following formula:
Sensory evaluation
A thirty-member panel, composed of 15 females and 15 males, including researchers and PhD students from the Institute of Nutrition, Food and Agri-Food Technologies, University of Constantine, Algeria, was involved in the sensory evaluation, which was designed as an exploratory assessment of product acceptability and key sensory attributes. The panel was considered semi-trained, as the assessors were familiar with sensory analysis and underwent a preliminary training session to harmonize their understanding of the descriptors and the evaluation procedure. The 27 products (nine samples per cooking method) were evaluated over multiple sessions to avoid sensory fatigue. In each session, three samples were evaluated per panelist. All sessions were conducted in the mid-morning and lasted approximately 30‒45 min. Chicken skin chips samples were served to panelists on white plates in a randomized order. A cup containing water (90%) and apple juice (10%) was used to cleanse the palate between tastes, to reduce residual fat perception and improve sensory discrimination (Hutchison et al., 2012). A list of nine descriptors with definitions was used by the panel, grouped as follows: texture (Crispiness), appearance (color, shape), taste (salt intensity, spicy taste, fatty taste, and aftertaste), aroma, and overall liking. These descriptors were selected based on literature data and preliminary discussions with the panel to ensure their relevance to the studied product. Each attribute was rated on a 0–10 unstructured scale, where 0 indicated no perception, and 10 indicated very intense perception (Boudechicha et al., 2015). Mean values and standard deviations were calculated from the data obtained from the 27 products. Microsoft Excel software was used for data organization and preliminary calculations, and statistical analyses were performed to compare the different samples.
Microbiological analysis
For each sample, 10 g was aseptically homogenized in 90 mL of sterile 0.1% peptone water (AES Laboratories, Combourg, France) for 2 min using a Polytron homogenizer (Polytron PT-MR 2100, Kinematica AG, Switzerland). Successive decimal dilutions were prepared in duplicate (10−1 to 10−6). Microbial analyses were performed as follows. Total aerobic bacteria were enumerated on Plate Count Agar (PCA) after incubation at 30 °C for 48 h. Enterobacteriaceae were counted on Violet Red Bile Glucose (VRBG) Agar after incubation at 37 °C for 24 h. Fecal enterococci were grown on Violet Red Bile Agar (VRBA) and incubated at 37 °C for 24 h. Detection of Salmonella spp. involved pre-enrichment in Buffered Peptone Water, followed by selective plating on Xylose Lysine Deoxycholate (XLD) and Salmonella–Shigella (SS) agars, and confirmed using standard biochemical tests. In parallel, Yeasts and molds were enumerated on Malt Extract Agar after incubation at 25 °C for 5 days. Sulphite-reducing clostridia were detected on Sulfite Polymyxin Sulfadiazine (SPS) Agar under anaerobic conditions at 37 °C for 48 h and Coagulase-positive Staphylococcus aureus was counted on Baird-Parker Agar supplemented with egg yolk tellurite emulsion, incubated at 37 °C for 24–48 h, and confirmed by coagulase test. Microbial counts were expressed as log CFU/g, and statistical analysis was performed using one-way ANOVA with significance defined at p < 0.05.
Statistical analysis
Statistical analyses were performed on replicate-level data (n = 27), comprising nine independent replicates per cooking method. Data were presented as mean ± standard deviation (SD). One-way analysis of variance (ANOVA) was conducted using XLSTAT (2016) to evaluate the effect of cooking method (air frying, deep-frying, and oven baking) on the characteristics of chicken skin chips. Mean comparisons were performed using Tukey's test at a 5% significance level (p < 0.05). Raw chicken skin was included as a reference sample; however, statistical interpretation were mainly focused on processed samples obtained by different cooking methods due to large differences in moisture content. To explore associations among variables and visualize relationships between cooking methods, Pearson correlation analysis and principal component analysis (PCA) were carried out. PCA was performed on standardized mean values (z-scores) of physicochemical and sensory attributes for each cooking method. The first two principal components (PC1 and PC2) were retained to interpret sample clustering and variable contributions. In addition, a permutational multivariate analysis of variance (PERMANOVA) was conducted on replicate-level data (n = 27) using 999 permutations and Euclidean distance to confirm that multivariate differences among cooking methods were statistically significant. Confidence ellipses (95%) were added to PCA plots to illustrate group clustering consistency among.
Results and discussion
Proximate composition of chicken skin chips
The proximate composition of raw chicken skin and chicken skin chips obtained by air frying, deep-frying, and oven baking is presented in Table 1. Significant differences (p < 0.05) were observed for moisture and fat content, whereas ash, protein, and carbohydrate contents did not vary significantly among the processing methods. Raw chicken skin contained a high moisture level (47.71%), which decreased markedly after cooking, with the lowest values observed in deep-fried samples (6.34%). This reduction is attributed to water loss during thermal processing. Air frying and oven baking also significantly reduced moisture content to 9.82% and 7.72%, respectively. This pronounced moisture reduction is consistent with previous studies on fried and baked meat products, where dehydration improves crispness and extends shelf-life (Choi et al., 2016; Osburn and Mandigo, 1998).
Proximate composition of chicken skin chips prepared by different cooking methods.
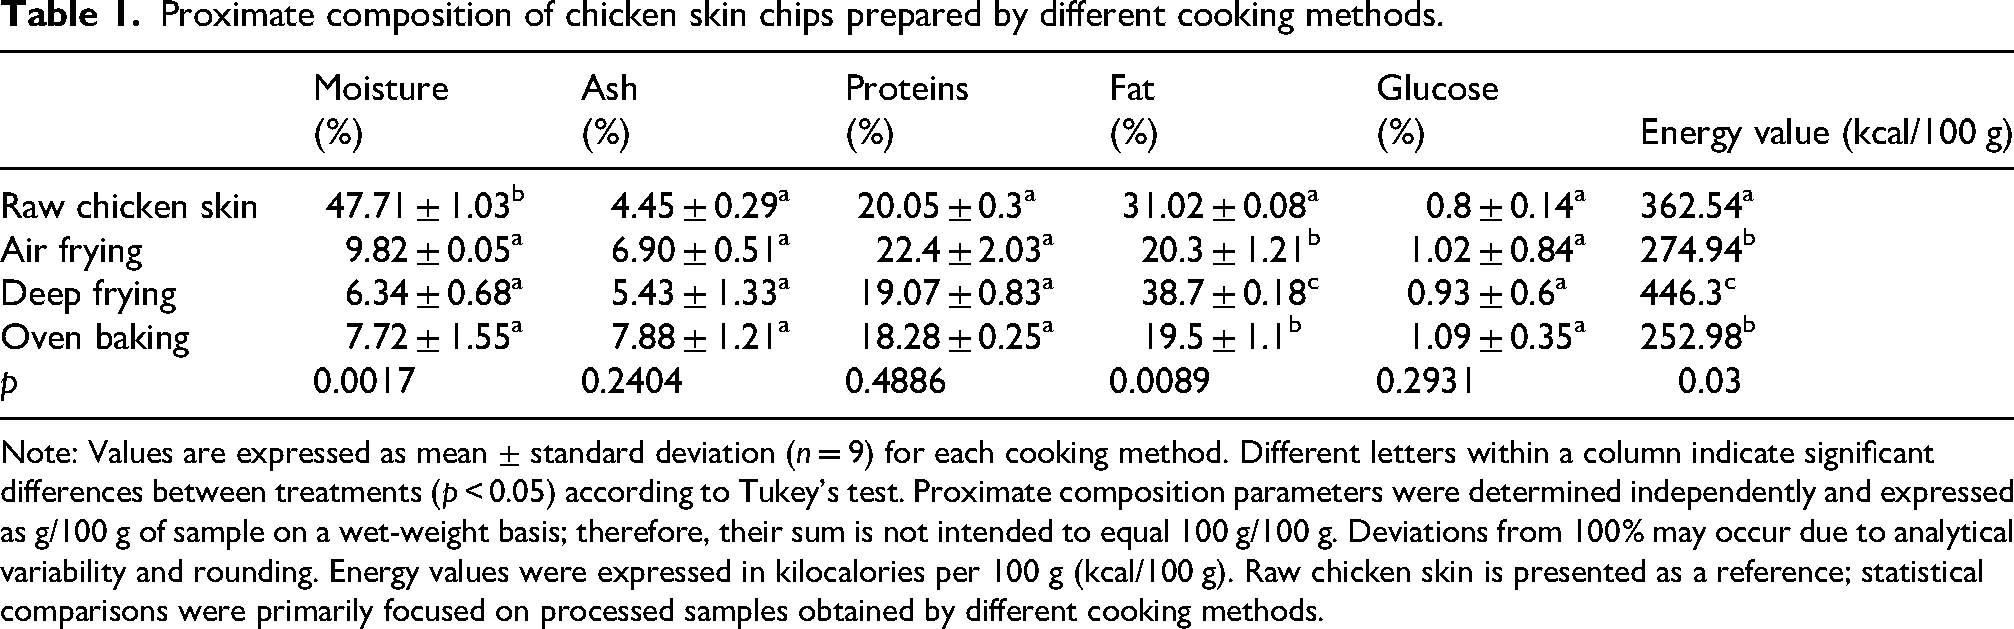
Note: Values are expressed as mean ± standard deviation (n = 9) for each cooking method. Different letters within a column indicate significant differences between treatments (p < 0.05) according to Tukey's test. Proximate composition parameters were determined independently and expressed as g/100 g of sample on a wet-weight basis; therefore, their sum is not intended to equal 100 g/100 g. Deviations from 100% may occur due to analytical variability and rounding. Energy values were expressed in kilocalories per 100 g (kcal/100 g). Raw chicken skin is presented as a reference; statistical comparisons were primarily focused on processed samples obtained by different cooking methods.
The ash content ranged from 4.45% to 7.88%, with no significant differences (p > .05) among the processing methods. This may be related not only to the concentration effect due to water loss but also to the contribution of minerals from the spices used in marination process, which can contribute to increased ash content in meat products (Araújo et al., 2019; Kim et al., 2016).
Protein values varied from 20.05% in raw skin to 22.4% in air-fried samples. Although no significant differences were observed (p > .05), the apparent increase after processing may be attributed to the relative concentration of nutrients due to dehydration. This trend is consistent with the findings of Babji et al. (1998), who reported a significant increase in protein content after cooking, likely due to moisture loss and nutrient concentration effects.
Fat content was significantly affected by the cooking method (p < 0.05). Deep-frying produced the highest fat level (40.7%), reflecting oil uptake during immersion frying. In contrast, air frying and oven baking yielded lower fat contents (20.3% and 19.5%, respectively), approximately half that of deep-fried samples. This confirms that air frying and oven baking are healthier alternatives, producing reduced-fat snacks while maintaining palatability.
As expected, Glucose levels were very low (<1.1%) in both raw and processed samples, with no significant differences (p > 0.05) among treatments. Deep-fried chips exhibited the highest energy value (446.3 kcal/100 g), whereas oven-baked (252.98 kcal/100 g) and air-fried (274.94 kcal/100 g) products showed considerably lower caloric values. Raw chicken skin displayed an intermediate value (396.16 kcal/100 g). The reduction in energy value in oven-baked and air-fried samples underscore their potential as healthier meat-based snack alternatives (Mithun et al., 2025).
Technological properties of chicken skin chips
Thermal processing significantly influenced the technological properties and quality attributes of chicken skin chips (Table 2). The pH values increased from 5.80 in raw skin to 6.1–6.27 in processed samples (p < 0.05). This rise in pH after thermal processing may be attributed to the denaturation of proteins and release of basic compounds (e.g., amines, ammonia) during heating (Qiao et al., 2001). Similarly, Martins et al. (2001) reported that the Maillard reaction can generate alkaline intermediates, thereby contributing to higher pH values in cooked products.
Technological properties of chicken skin chips prepared by different cooking methods.
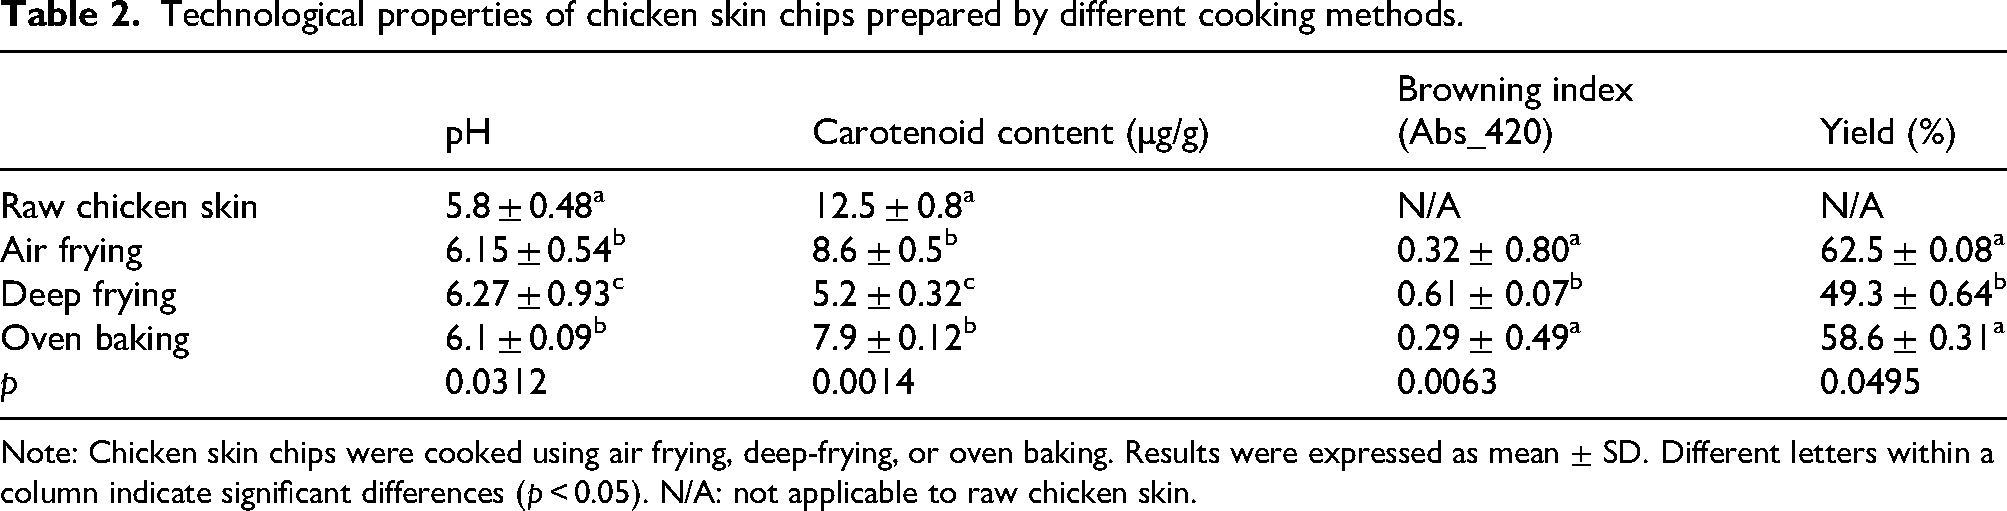
Note: Chicken skin chips were cooked using air frying, deep-frying, or oven baking. Results were expressed as mean ± SD. Different letters within a column indicate significant differences (p < 0.05). N/A: not applicable to raw chicken skin.
Among the cooking methods, deep-frying produced slightly higher pH values compared to air frying and oven baking (p < 0.05). This suggests that oil immersion cooking promotes a stronger release of basic compounds than dry-heat processes, consistent with findings by Bouchon (2009).
The carotenoid content decreased significantly from 12.5 µg/g in raw skin to 5.2–8.6 µg/g in processed samples (p < 0.05). The color of chicken skin color is strongly influenced by dietary carotenoids, which accumulate the skin and fat tissues (Britton and Khachik, 2009; Meléndez-Martínez et al., 2021). Carotenoids are heat-sensitive and susceptible to oxidative degradation, and their loss was most pronounced in deep-fried samples (Castañeda et al., 2005). This finding suggests that oil immersion promotes pigment breakdown or leaching into the frying medium (Britton et al., 2008). Conversely, air frying and oven baking limited carotenoid degradation, demonstrating their relative efficiency in preserving thermolabile bioactive compounds (Maoka, 2016).
The BI, an indicator of Maillard reaction products, varied significantly among cooking methods (p < 0.05). Deep-frying samples showed the highest browning intensity (0.61), followed by air fried (0.32) and oven baked (0.29) products. The combination of high frying temperature and a slightly alkaline pH likely accounts for the pronounced formation of Maillard-derived pigments in deep-fried samples. Similar observations have been reported in meat systems, where an increase in pH enhances Maillard browning intensity under alkaline conditions (Ames, 1990; Kumar et al., 2018; Nursten, 2005). These results indicate that lipid-rich, high-temperature environments promote advanced Maillard reactions and caramelization, resulting in darker color development (Martins et al., 2001). These findings align with earlier results by Ngadi et al. (2007), who reported that color darkening intensifies with increasing cooking temperature in fried food products, such as potato chips and chicken nuggets.
Yield values ranged from 49.3% in deep-fried samples to 62.5% in air-fried chips. The processing yields of chicken skin chips differed significantly (p < 0.05) among treatments. Deep-frying produced the highest weight loss, likely due to extensive fat melting and moisture evaporation. This finding is consistent with previous reports indicating that frying often decreases product yield due to moisture loss and oil exchange (Saguy and Dana, 2003). Accordingly, Farkas (1996)[8] classified deep-frying as a dehydration process, as the high temperatures of the frying oil promotes water evaporation. On the other hand, air frying and oven baking yielded higher product recovery, likely because these methods minimize fat loss and limit oil absorption during cooking.
Sensory evaluation
The sensory evaluation of chicken skin chips prepared by air frying, deep frying, and oven baking revealed significant differences in several quality attributes (Figure 2). Deep-fried samples received the highest color score (8.25), exhibiting an intense golden-brown surface. This result is consistent with stronger Maillard reactions during immersion frying at high oil temperatures (Ngadi et al., 2007). In contrast, oven-baked chips scored lower (6), likely due to reduced surface browning, while air-fried samples were intermediate (7). These findings align with previous reports that frying produces more pronounced surface color in meat products than dry-heat cooking methods (Alugwu et al., 2022). Regarding shape, oven-baked chips received the highest score (8.5), indicating structural stability. In contrast, deep-fried chips showed deformation (score 5), possibly due to oil absorption and uneven shrinkage during immersion frying, leading to a less uniform structure (García-Segovia et al., 2007). Crispiness was a defining textural attribute across treatments and strongly influenced consumer preference. In this study, air-fried samples achieved the highest score (10), followed by oven-baked (9.8) and deep-fried (9). The enhanced crispiness in air-fried and oven-baked samples may be attributed to rapid dehydration with limited oil uptake, promoting a brittle texture (Zhang et al., 2012).
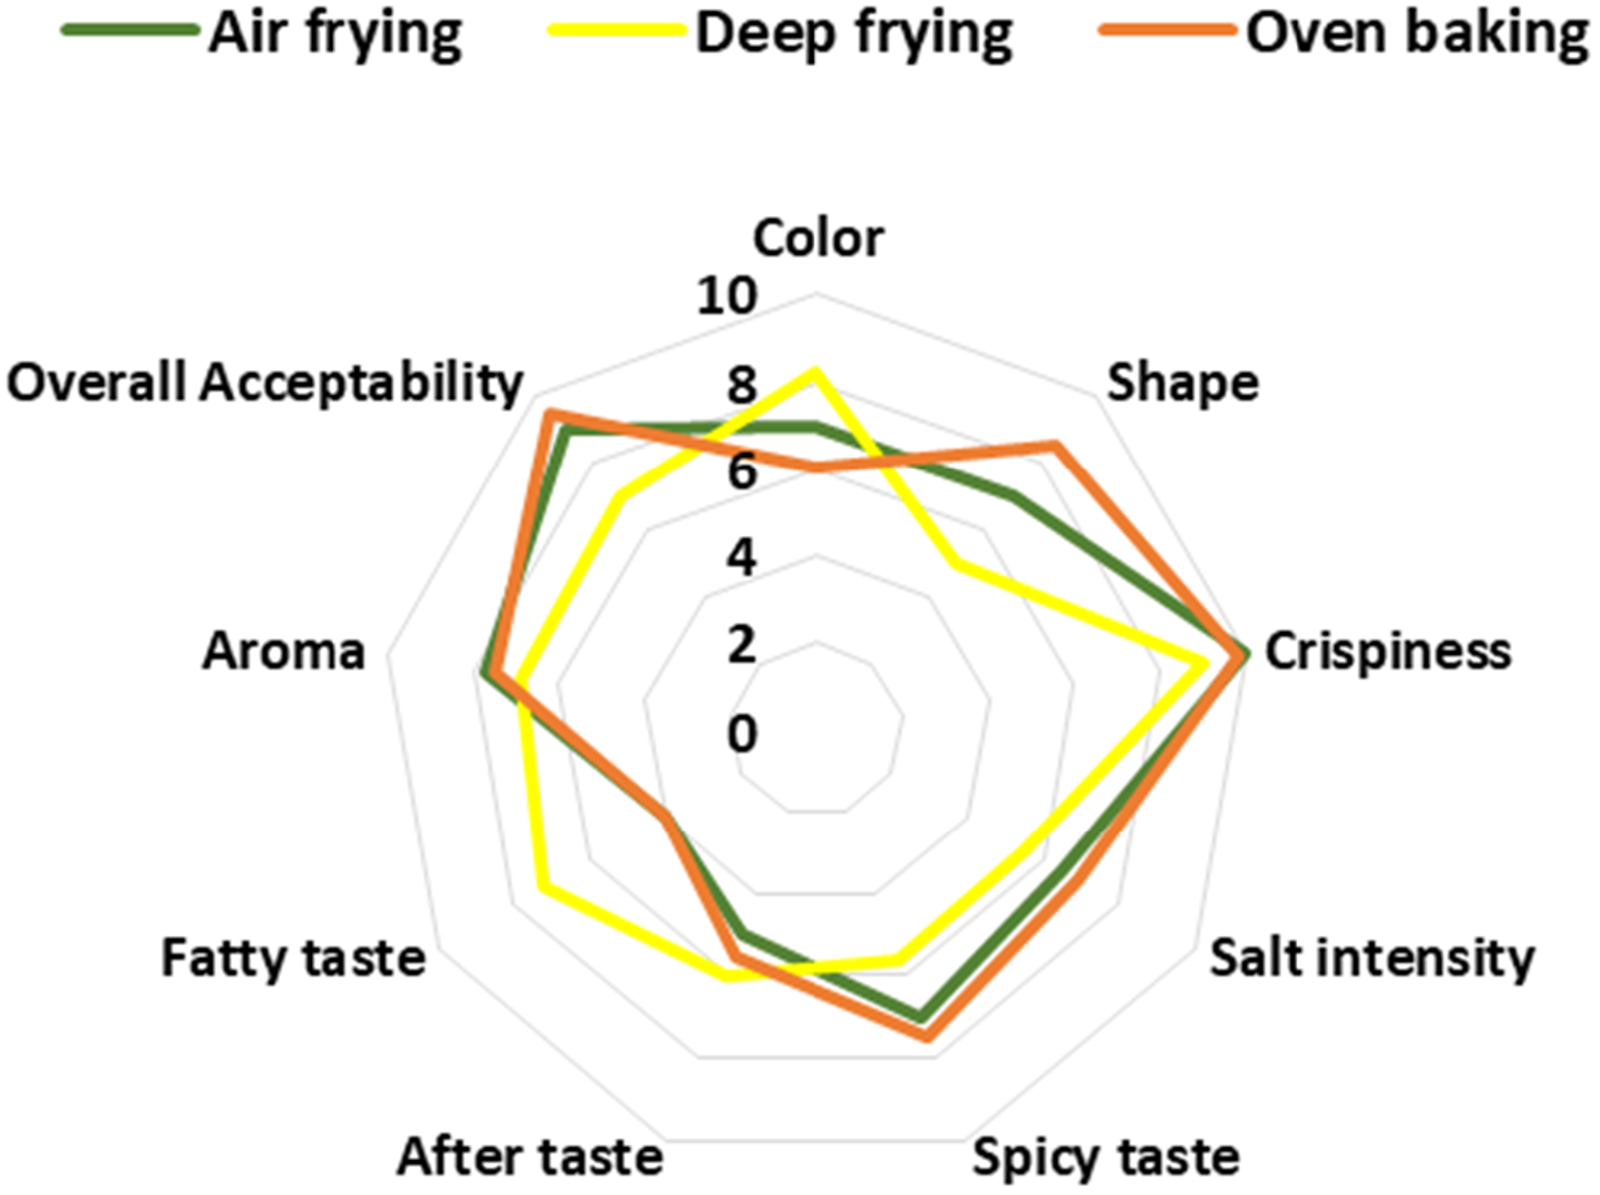
Spider plot of the sensory profile of chicken skin chips cooked by air frying, deep-frying, and oven baking. Attributes evaluated include color, shape, crispiness, salt intensity, spicy taste, aftertaste, fatty taste, aroma, and overall acceptability. Each value represents the mean score on a scale of 0 to 10.
Salt and spicy taste intensities were perceived as higher in oven-baked samples (6.9 and 7.5, respectively) compared to air- or deep-fried chips, likely due to differences in moisture retention and surface salt crystallization during baking. Conversely, aftertaste was most pronounced in deep-fried samples, likely due to residual lipid oxidation products.
Overall acceptability was highest for oven-baked chips (9.5), followed closely by air-fried samples (9), while deep-fried samples received the lowest score (7). The preference for baked and air-fried samples reflects consumer trends toward less greasy, crispier snacks with balanced flavor, consistent with previous studies on fried/baked poultry and meat products (Tura et al., 2024; Zhang et al., 2012).
However, the sensory evaluation conducted in this study should be considered preliminary and exploratory, as the use of a semi-trained panel and the applied methodology may limit descriptive precision and the generalizability of the results. Nevertheless, the analysis remains useful for identifying general trends and differences between processing methods, and further studies involving fully trained panels and more advanced sensory methodologies are recommended to confirm and extend these findings.
Microbiological analysis
The microbiological analysis of chicken skin chips revealed significant differences between raw and cooked samples (Table 3). As expected, raw chicken skin exhibited the highest microbial load, with total aerobic bacteria reaching 5.63 ± 0.02 log CFU/g, accompanied by high counts of Enterobacteriaceae (4.65 ± 0.52 log CFU/g), fecal enterococci (4.25 ± 0.23 log CFU/g), and yeasts and molds (1.32 ± 1.09 log CFU/g). These findings confirm that raw poultry skin represents a critical source of microbial contamination, consistent with previous reports (Mead, 2004), highlighting the role of chicken skin as a reservoir for spoilage and pathogenic microorganisms. In addition, Rouger et al. (2017) reported that high microbial loads are typically associated with raw poultry products due to skin surface exposure and moisture content.
Microbiological quality of raw and cooked chicken skin chips prepared by different cooking methods.
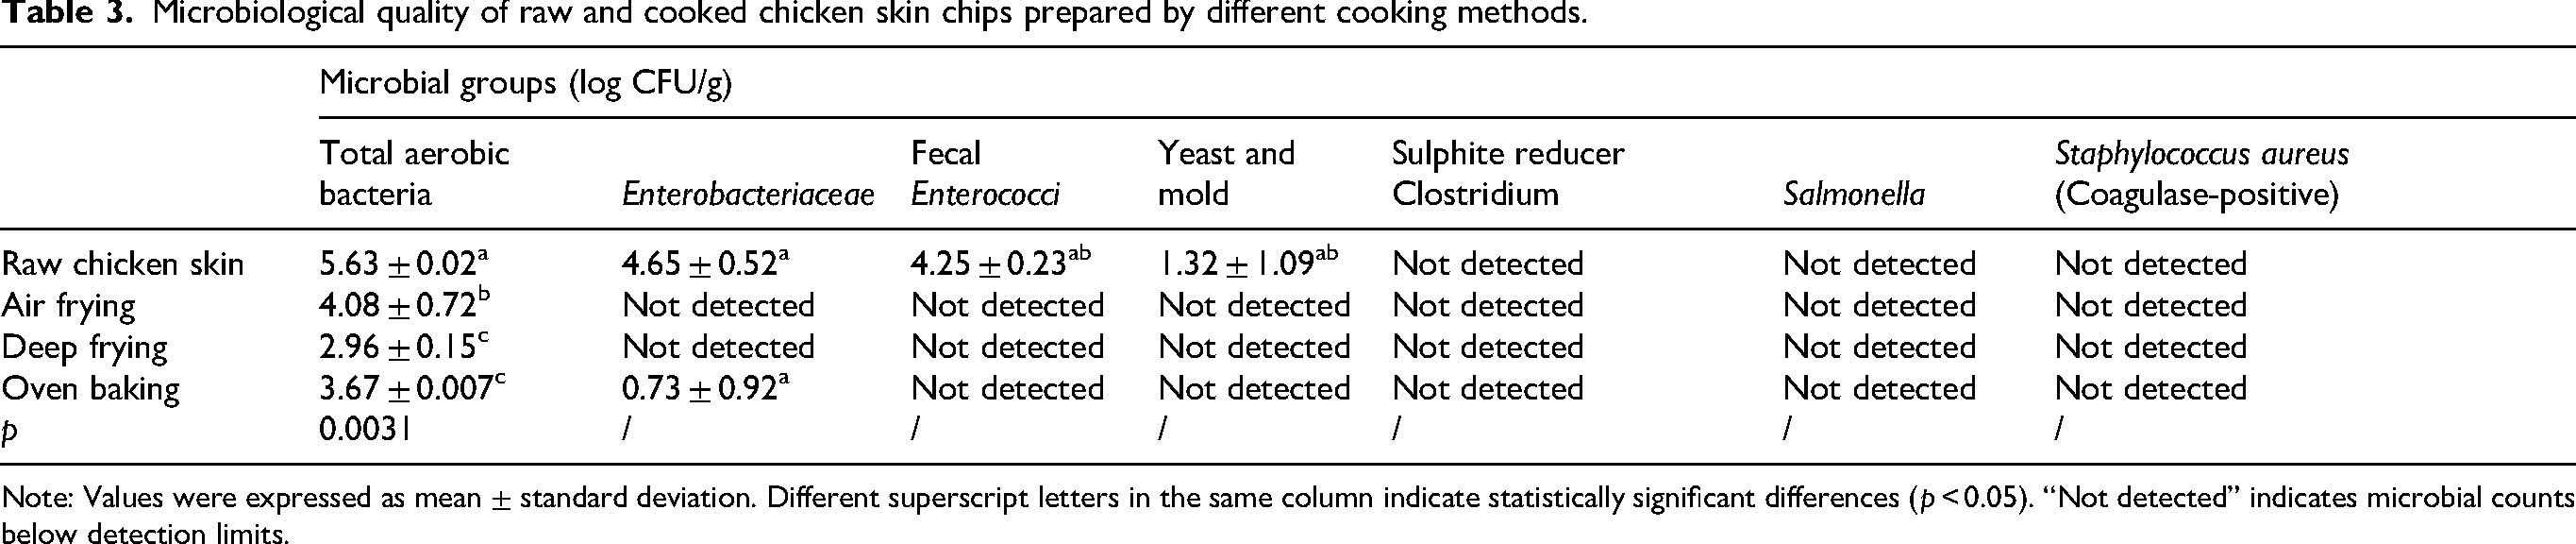
Note: Values were expressed as mean ± standard deviation. Different superscript letters in the same column indicate statistically significant differences (p < 0.05). “Not detected” indicates microbial counts below detection limits.
Thermal processing significantly (p < 0.05) reduced the aerobic microbial load across all cooking methods. Deep-frying was the most effective method, decreasing the total aerobic bacteria count to 2.96 ± 0.15 log CFU/g, likely due to the complete immersion in hot oil, which ensures more effective heat transfer and microbial inactivation (Fluckey et al., 2003). Oven baking reduced the count to 3.67 ± 0.007 log CFU/g, while air frying achieved a reduction to 4.08 ± 0.72 log CFU/g, indicating both methods were effective but less so than deep-frying. These observations are consistent with previous reports (Cano et al., 2022; Jay et al., 2005), showing that microbial survival is influenced by the time–temperature profile and heat transfer efficiency specific to each cooking method.
Enterobacteriaceae, fecal enterococci, yeasts, and molds were undetectable in all cooked samples, except in oven-baked chips, where Enterobacteriaceae were still detected (0.73 ± 0.92 log CFU/g). This suggests incomplete microbial inactivation, possibly due to uneven heat distribution or microbial protection of the skin matrix. These microbial levels were below commonly accepted limits for ready-to-eat poultry products (Jay et al., 2005), indicating that the processed products are microbiologically safe for consumption. Non-pathogenic bacteria, including Salmonella spp., sulphite-reducing Clostridia, or coagulase-positive Staphylococcus aureus, were not detected in either raw or cooked samples, indicating satisfactory hygiene during preparation and cooking.
Multivariate statistical analysis
Correlation analysis
Pearson correlation analysis (Table 4) revealed strong links between the physicochemical, technological, and sensory parameters of chicken skin chips prepared using different cooking methods. Moisture content was negatively correlated with fat (r = –0.970), indicating that higher dehydration during frying processes promotes lipid concentration while reducing water retention. This finding aligns with previous reports that moisture loss in fried poultry enhances fat absorption (Zhang et al., 2012).
Pearson’s correlation coefficients between technological attributes and nutritional composition of chicken skin chips.
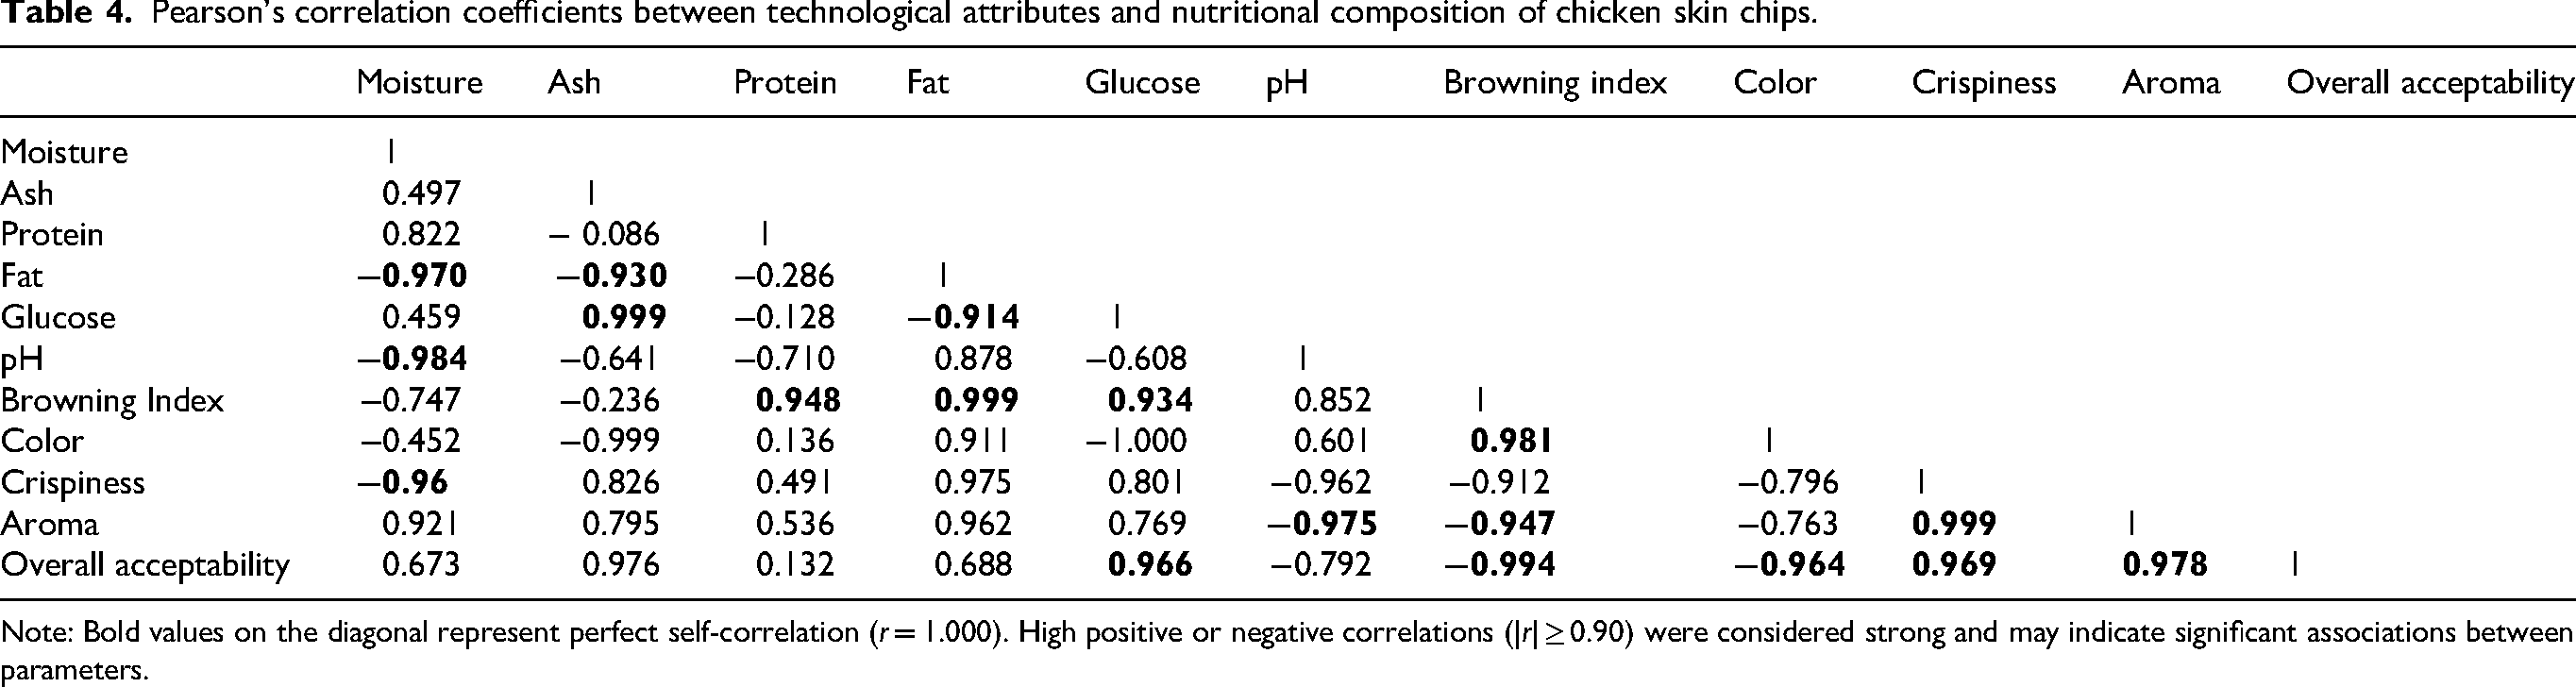
Note: Bold values on the diagonal represent perfect self-correlation (r = 1.000). High positive or negative correlations (|r| ≥ 0.90) were considered strong and may indicate significant associations between parameters.
Ash and carbohydrate contents were highly and positively correlated (r = 0.999), reflecting the contribution of mineral and carbohydrate components from the marinade ingredients. In contrast, both parameters were negatively correlated with fat (r = –0.930 and −0.914, respectively), suggesting that excessive oil uptake reduces the relative proportion of non-lipid compounds in the final product. pH exhibited a strong negative correlation with moisture (r = –0.984) and a positive correlation with fat (r = 0.878), suggesting that Maillard reaction activity increases under more alkaline and lipid-rich conditions. Furthermore, the BI was highly correlated with fat (r = 0.999) and protein (r = 0.948), confirming that these components play a key role in non-enzymatic browning and color development during high-temperature cooking (Martins et al., 2001; Mba et al., 2015).
Regarding sensory properties, crispiness and aroma were highly correlated (r = 0.999), highlighting the strong link between texture and aroma perception that develops during cooking. Both attributes were also positively associated with overall acceptability (r = 0.969 and 0.978, respectively), suggesting that the sensory perception of crispiness and aroma are key determinants of consumer preference. Additionally, BI and color were closely related to overall acceptability (r = –0.994 and −0.964), indicating that an optimal surface color balance contributes significantly to product appeal.
Principal component analysis (PCA)
The PCA biplot (Figure 3) clearly separates the three cooking methods (air frying, deep-frying, and oven baking), accounting for 80.1% of the total variance in the first principal component (PC1) and 19.9% in the second principal component (PC2). Deep-fried samples were grouped separately along PC1 due to their higher fat content, BI, and color intensity, reflecting intense Maillard reactions and higher oil absorption. In contrast, air-fried chicken skin chips were associated with higher protein content, crispiness, and aroma scores, while oven-baked samples were characterized by higher ash and carbohydrate content, as well as overall acceptability.
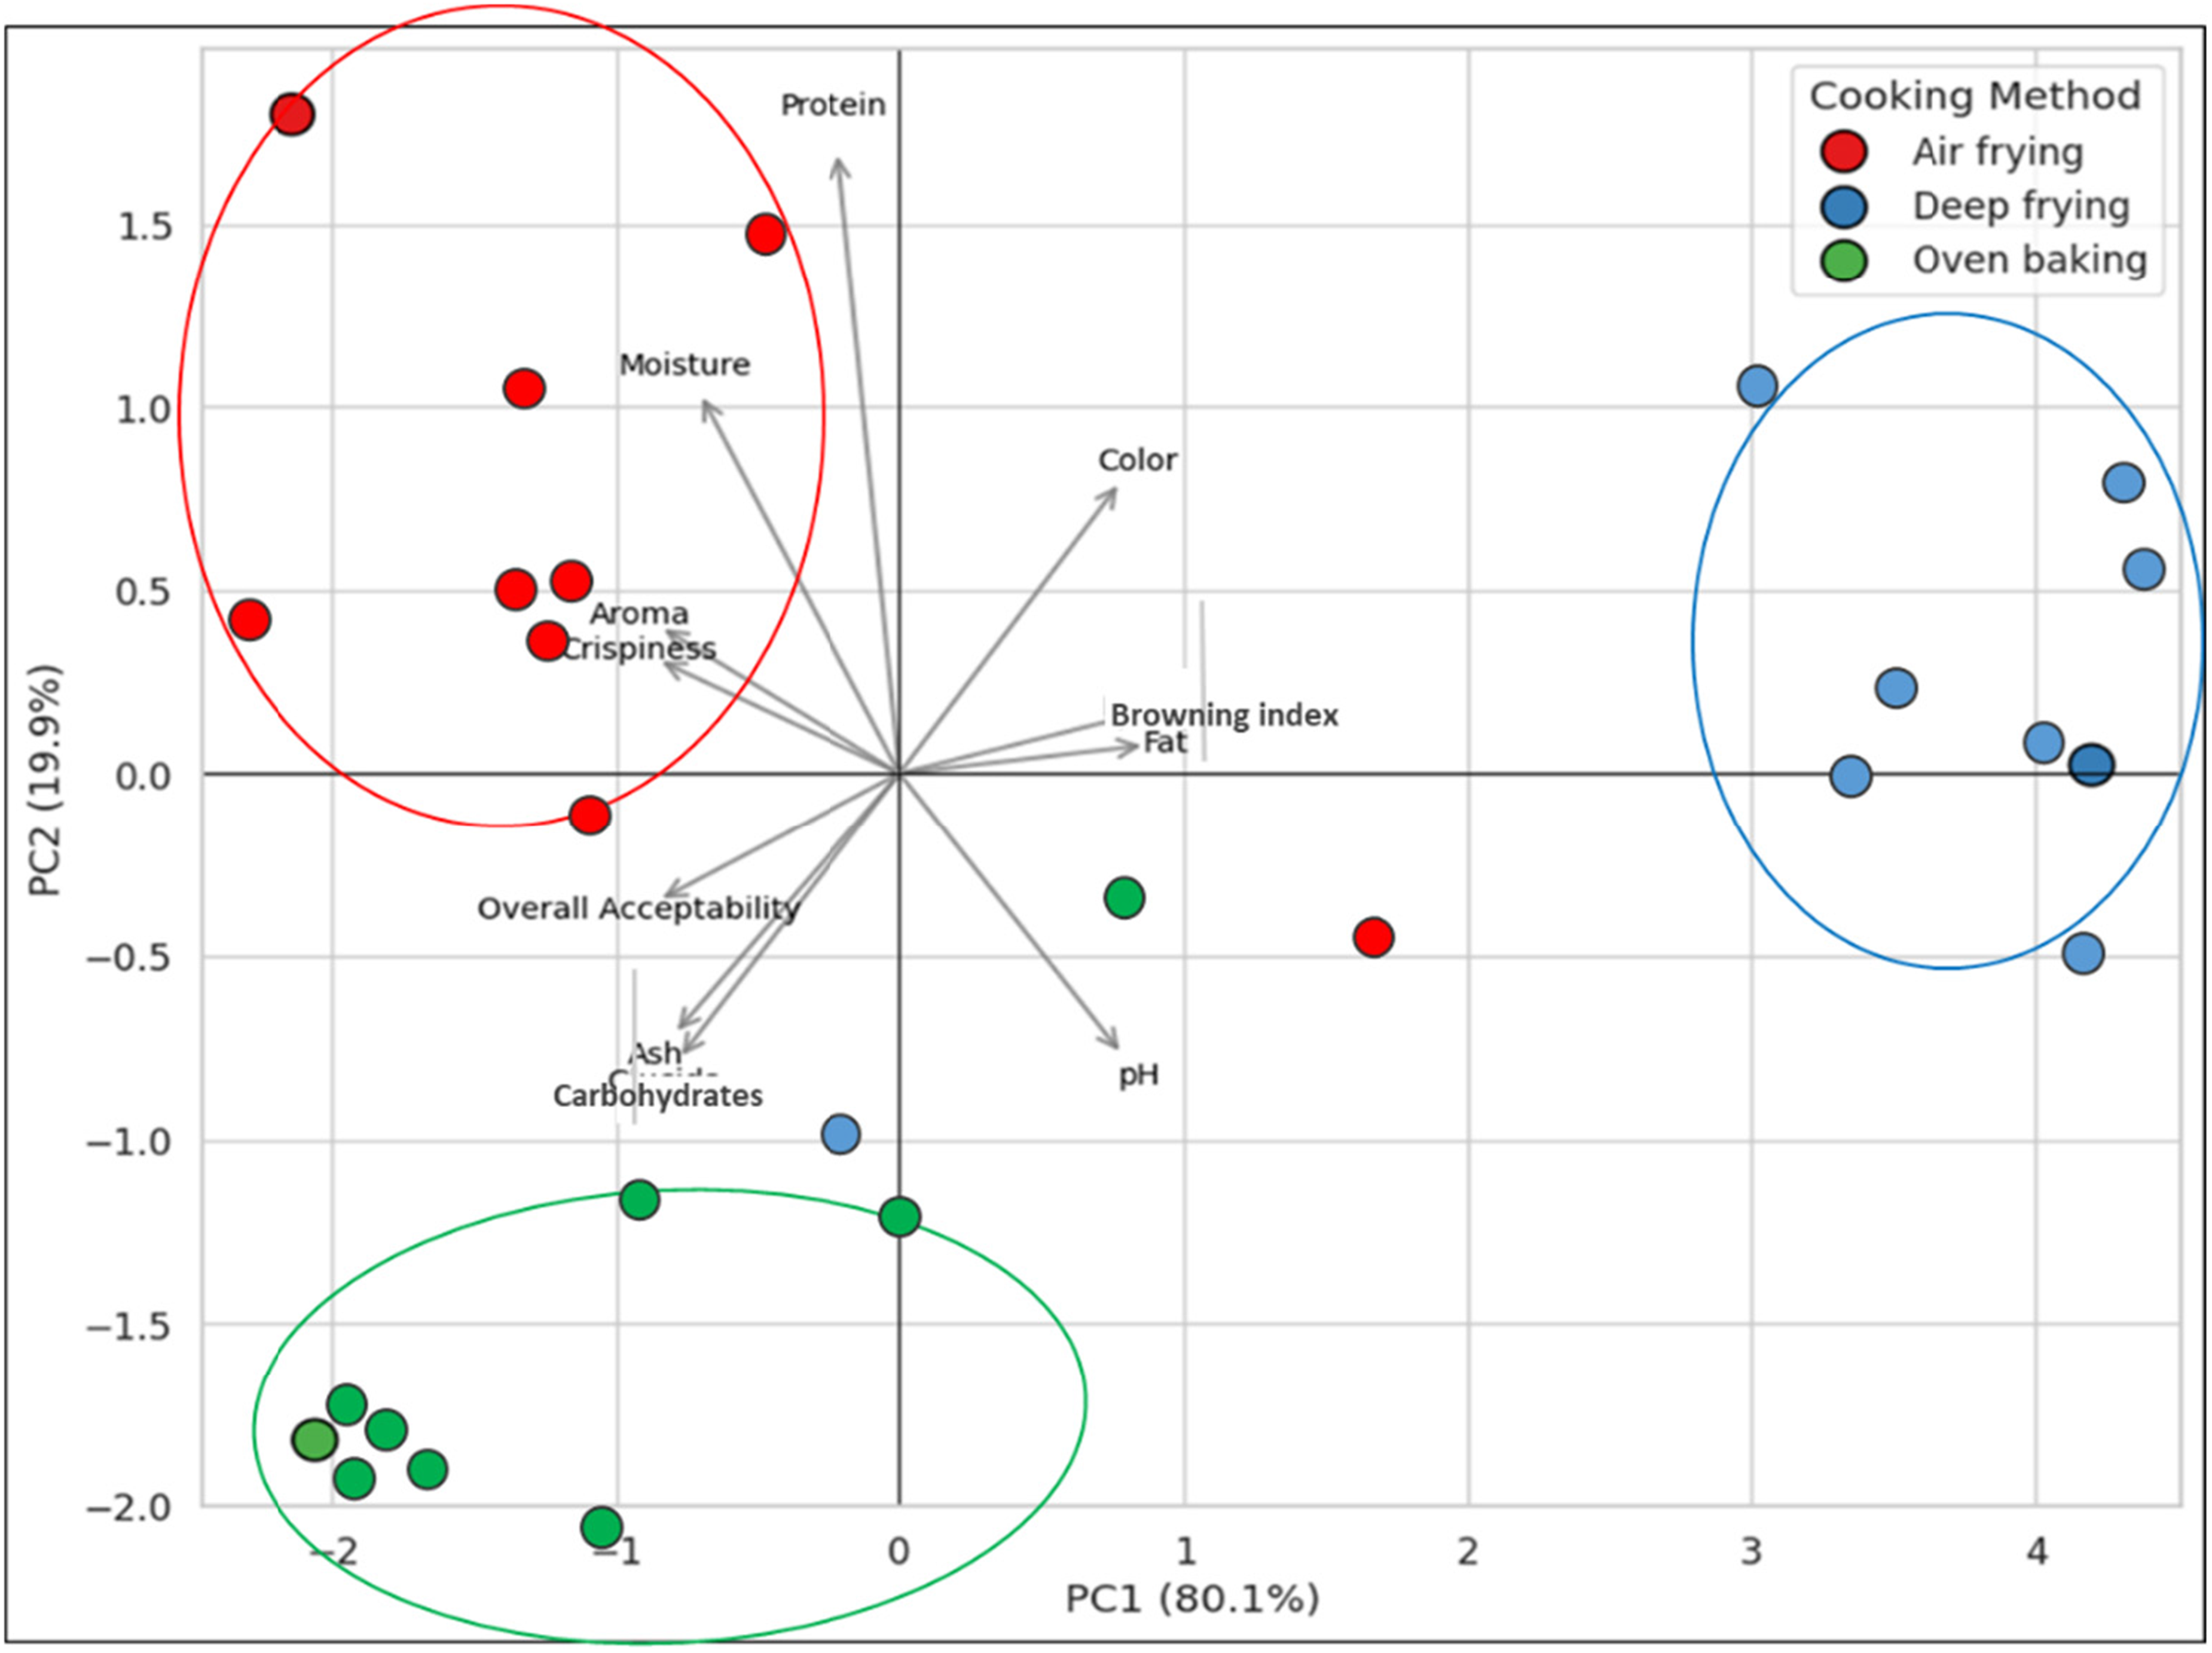
Principal component analysis (PCA) biplot of physicochemical and sensory attributes of chicken skin chips obtained by different cooking methods (air frying, deep-frying, and oven baking). PCA scores for individual replicates (n = 27; 9 replicates per method); each point represents the mean of three replicates; ellipses indicate 95% confidence intervals for each group. The multivariate differences were significant according to PERMANOVA (Pseudo-F = 5.65, R2 = 0.72, p = 0.012, 999 permutations).
Although some replicate points fall slightly outside the ellipses, overall clustering showed clear separation among air-fried, deep-fried, and oven-baked samples. The distinct group separation confirmed by PERMANOVA (Pseudo-F = 5.65, R2 = 0.72, p = 0.012, 999 permutations) demonstrated significant differences in within-group behavior and distinct profiles among cooking methods. Overall, PCA effectively summarized the multivariate relationships among quality attributes and confirmed that cooking method strongly influences the characteristics of chicken skin chips.
Conclusion
This study was carried out to compare the quality characteristics of chicken skin chips prepared using different cooking methods. Oven baking and air frying were associated with more desirable sensory attributes, yielding chips with appealing color, crispiness, and flavor, while maintaining lower fat contents than deep-fried samples. Although deep-frying enhanced browning intensity through more advanced Maillard reactions, it resulted in higher fat uptake. Correlation and principal component analyses indicated that each cooking method was distinctly associated with specific quality traits, highlighting their impact on product composition and appearance. Microbiological analyses confirmed that high-temperature treatments (180–200 °C) effectively ensured the microbial safety of chicken skin chips. Overall, air frying and oven baking appear to be promising alternatives to deep-frying, offering healthier and high-quality products. Future studies should focus on process optimization and storage stability to support the sustainable valorization of poultry by-products in the food industry.
Footnotes
Acknowledgements
The authors would like to thank the butchers of Constantine City for their generous donation of the chicken skin samples used in this study, as well as the members of the MaQuaV/INATAA team for their valuable contributions to this work.
Ethical considerations
Not applicable (no human participants, human data, or human tissue were involved).
Consent to participate
Not applicable.
Consent for publication
Not applicable.
Author contributions
H.B. designed the study and conducted the experiments. K.H. performed the data analysis. B.L., M.K., R.G., M.S. carried out the laboratory experiments and data acquisition. L.E. contributed to the manuscript review. All authors read and approved the final manuscript.
Funding
The authors received no financial support for the research, authorship, and/or publication of this article.
Declaration of conflicting interest
The authors declare no potential conflicts of interest with respect to the research, authorship, and publication of this article.
Data availability
Data sharing is not applicable to this article as no datasets were generated or analyzed.