
Abstract
This study investigated the potential of Cucurbita moschata and Cucurbita maxima as functional ingredients in cookie formulations. Pumpkin powders were incorporated as partial wheat flour substitutes to evaluate their effects on the physicochemical, nutritional profile, and functional properties of cookies. The results showed that pumpkin incorporation improved moisture retention and water absorption capacity, contributing to enhanced technological performance of the dough and baked products. Nutritional analysis revealed significant increases in protein, dietary fiber, fat, ash, and carotenoid contents in enriched cookies compared with the control formulation.
Texture profile analysis demonstrated variety-dependent effects. Cookies enriched with C. moschata showed increased hardness at lower substitution levels but a softening effect at higher concentrations, whereas C. maxima maintained relatively stable firmness across formulations. Thermal analysis indicated improved thermal stability in enriched cookies, while mineral analysis confirmed better retention of essential elements. Confocal laser scanning microscopy further revealed a more homogeneous ingredient distribution and stronger matrix integration in cookies containing C. maxima powder.
Furthermore, the incorporation of pumpkin powders significantly enhanced the bioactive profile of cookies, as reflected by higher total polyphenol content and increased DPPH (2,2-diphenyl-1-picrylhydrazyl) radical scavenging activity. These results highlight the potential of pumpkin powders as valuable functional ingredients for improving both the nutritional quality and functional properties of bakery products. The study supports the development of nutritionally enriched cookies with enhanced health benefits and technological performance.
Introduction
The increasing prevalence of diet-related chronic diseases and growing consumer awareness of the relationship between diet and health have stimulated interest in the development of functional foods with improved nutritional value. Bakery products, particularly cookies, are widely consumed across different age groups and represent an ideal vehicle for the incorporation of nutrient-dense plant ingredients aimed at enhancing dietary intake without drastically altering eating habits.
In this context, the use of vegetable-derived powders has gained considerable attention as a strategy to improve both the nutritional and functional properties of cereal-based products. Vegetable powders are rich in dietary fiber, minerals, vitamins, and various bioactive compounds, which can contribute to antioxidant activity and overall health promotion. Among these, pumpkin (Cucurbita spp.) has emerged as a promising ingredient due to its high levels of carotenoids, phenolic compounds, and essential micronutrients (Batool et al., 2022).
Pumpkin is particularly recognized as a rich source of β-carotene, a provitamin A carotenoid associated with visual health, immune system support, and antioxidant defense. Additionally, pumpkin contains significant amounts of potassium, vitamin C, and dietary fiber, which contribute to cardiovascular health, digestive function, and glycemic regulation (Moccia et al., 2020). These nutritional attributes make pumpkin powder a suitable candidate for improving the nutritional quality of commonly consumed foods such as biscuits and cookies.
The incorporation of vegetable powders, including pumpkin, into bakery products has been widely investigated in recent years. Previous studies have reported that partial substitution of wheat flour with pumpkin powder can enhance antioxidant capacity, increase mineral and fiber contents, and influence the physicochemical and sensory properties of cookies and other baked goods (Jayalath et al., 2024).
Despite the growing body of literature on pumpkin-enriched bakery products, comparative information regarding the influence of different pumpkin species on the physicochemical, microstructural, and functional properties of cookies remains limited. In particular, differences between Cucurbita moschata and Cucurbita maxima in terms of composition and their subsequent impact on final product quality have not been sufficiently explored.
Therefore, the present study aims to evaluate and compare the effects of incorporating powders from Cucurbita moschata and Cucurbita maxima into cookie formulations. The study focuses on their impact on nutritional profile, texture, thermal behavior, microstructure, and antioxidant activity. By identifying species-dependent differences, this work seeks to provide new insights for the selection of appropriate pumpkin varieties in the development of nutritionally improved and technologically stable bakery products.
Material and methods
Plant material
Pumpkin pulp powders from Cucurbita moschata and Cucurbita maxima were used as biological materials. The fresh pumpkins were rigorously washed, peeled, and cut into small pieces before being homogenized using an electric mixer-grinder (Moulinex, Groupe SEB, France). The resulting pulp was freeze-dried (Irtis Genesis, ATS Scientific Products, Pennsylvania, USA) for 72 h to preserve bioactive compounds and maintain its physicochemical characteristics. The dried material was then ground using the grinder (Moulinex, Groupe SEB,France) into a fine powder and sieved using a 150-μm sieve to ensure uniform particle size. Finally, the pumpkin powders were stored in sterile, airtight containers under cool, in a dessicator at room temperature (25 ± 2 °C) for 1 week prior to further analyses or cookie preparation.
Cookies formulation
The preparation of doughs and cookies was carried out following the procedure described by Laguna et al. (2011). To achieve this, 5 g and 15 g of pumpkin powder were incorporated into the dough as a substitute for equivalent quantities of flour. The mixture of shortening (60 g) and pumpkin powder (5 and 15 g) was homogenized using an electric blender (Kenwood Major Classic, UK) for 4 min at a low rotational speed of 60 rpm to obtain a uniform cream. Next, sugar (30 g) was incorporated into the blend and combined by stirring for a further 2 min at an increased speed of 255 rpm (speed 4). Subsequently, reconstituted milk powder (0.6 g) was introduced and mixed for 2 min at the same low speed (60 rpm). Finally, flour (100, 95 and 85 g for control, 5 g pumpkin powder and 15 g pumpkin powder, respectively), salt (0.2 g), sodium bicarbonate (0.2 g), and ammonium hydrogen carbonate (0.3 g) were added and processed under identical operating conditions (60 rpm for 2 min) to produce a cohesive dough. Once prepared, the dough underwent further processing using a rolling mill (Parber, Vizcaya, Spain) to obtain a uniformly laminated dough with a consistent thickness of up to 8 mm. Afterward, the flattened dough was refrigerated for a period of 30 min at 5 °C and molded into pieces of 52 mm in diameter × 3.4 mm in thickness. Twenty biscuits were placed on a perforated tray and baked in a conventional oven (De Dietrich, Basingstoke, UK) for 20 min at 170 °C. After cooling, the biscuits were packed in thermally sealed metallized polypropylene bags (Sealboy 320, Audion Elektro) stored at room temperature and evaluated after 24 h.
Physicochemical properties
The size attributes of the cookies, specifically their length and breadth, were determined by placing five cookies side by side in both vertical and horizontal orientations. To determine their thickness, five biscuits were stacked on top of one another. The measurements, recorded in millimeters, represent the average value obtained from two separate trials.
The water activity (aw) of the cookies was measured in triplicate using an Aqua Lab Model Series 3 dew-point hygrometer (Decagon Devices, Inc, Pullman, WA, USA).
The pH of pumpkin powder was determined by preparing a 10% (w/v) suspension in distilled water. The mixture was allowed to equilibrate for 30 min at room temperature, filtered, and the pH of the filtrate was measured using a calibrated digital pH meter EDGE H12020 (Hanna Instruments, Eibar, Gipuzkoa).
Weight reduction during baking (WR) was determined according to equation (1). “WL” denotes the weight in grams. For each formulation, six samples were weighed individually both prior to baking (Wdough) and after baking (Wbiscuit). The measurements were carried out in duplicate.

Water absorption capacity (WAC) was determined according to Adebowale et al. (2012). One gram of sample was mixed with 10 mL of distilled water at room temperature, stirred for 30 s (Vortex, Phoenix, Garbsen, Deutschland), and reweighed; the mass increase corresponded to the amount of water absorbed. WAC was calculated following equation (2) and was expressed as grams of water per gram of flour (g/g).

Analysis of moisture, fat, total protein, and carbohydrate content of pumpkin powder and cookies samples was carried out following the methodology described in AOAC (2005).
Texture analysis
Textural properties were measured using a TA-TX.plus texture analyzer (Stable Microsystems, Godalming, UK) with Texture Exponent software (v. 2.0.7.0). Dough sheets (8 mm thick) were analyzed by texture profile analysis (TPA) using a 75 mm aluminum plate (P/75), with double compression to 50% of the original height, a 5-s interval, a test speed of 1 mm s−1, and a trigger force of 0.035 N. Hardness, springiness, cohesiveness, and chewiness were calculated from TPA curves (n = 3). Cookie texture was evaluated by a 3-point bending test (A/3PB; 30 mm span, 1 m s−1) to determine breaking strength, and by penetration using a Volodkevich Bite Jaw probe to a depth of 4 mm at 1 mm s−1, with penetration force used as an indicator of hardness.
Determination of thermographic properties
Thermogravimetric analysis (TGA) was carried out using a TGA550 instrument (TA Instruments S.A., City, Country). Approximately 2.5 mg of the cookie sample was placed in a platinum crucible and heated from 30 to 800 °C at 10 °C/min under a nitrogen atmosphere (20 mL/min). TG (thermogravimetry) and DTG (derivative thermogravimetry) curves were recorded and analyzed using TRIOS software (version 5.1) to evaluate thermal decomposition behavior. A second heating cycle was then performed from 450 to 800 °C under air at 20 °C/min to determine thermal degradation parameters, and ash content was calculated from the residual mass (Rachini et al., 2009).
Confocal laser scanning microscopy
All cookies were examined using a Zeiss LSM 980 confocal microscope (Carl Zeiss AG, Oberkochen, Germany) to assess protein distribution within the internal matrix. Images were acquired using a 10× objective with a 6× digital zoom (equivalent to 60× magnification). Cookies were vertically sectioned with a clean scalpel, avoiding crusted or overbaked surface areas, to obtain slices approximately 3–5 mm thick. The freshly cut surfaces were stained with fluorescent dye Fast Green (0.01%, 15 µL), which was absorbed into the porous matrix by capillary action to visualize proteins as described by Wilson (1983). Fluorescence was recorded using appropriate laser lines (e.g., 640 nm for Fast Green), and images were processed using NIS-Elements BR 3.2 (Nikon, Japan) and further adjusted with Fiji/ImageJ (version 1.49q, NIH, USA).
Total phenolic content
Total phenolic content in cookies was determined as essentially described in Zacarías-García et al. (2022), with subtle adjustments. Approximately 0.5 g of freeze-dried sample was extracted using 5 mL of 80% methanol (v/w ratio 10:1) under homogenization for 5 min at room temperature. The mixture was then centrifuged at 3500 × g for 10 min at 4 °C, and the clear supernatant was collected for analysis. An aliquot (50 µL) of the extract was combined with 2% Na₂CO₃ in 0.1 M NaOH (500 µL) and kept in darkness for 15 min, followed by the addition of 50 µL of diluted (1:1) Folin–Ciocalteu reagent. After 30 min, absorbance was recorded at 724 nm using a microplate UV–Vis spectrophotometer.
Total phenolics of digests were carried out by spectrophotometric methods described by Cakarevic et al. (2020). An aliquot (200 µL) of the extract was combined with 100 uL of Folin–Ciocalteu reagent and 2% Na₂CO₃ in 0.1 M NaOH (80 µL). After 1 h, absorbance was recorded at 724 nm using a microplate UV–Vis spectrophotometer. Determinations were performed in triplicate, and results are expressed as mg of gallic acid equivalents (GAE) per 100 g of dry weight.
Antioxidant capacity
The antioxidant capacity of cookies was evaluated using DPPH (2,2-diphenyl-1-picrylhydrazyl), ABTS (2,2'-azino-bis (3-ethylbenzothiazoline-6-sulfonic acid), and FRAP (ferric reducing antioxidant power) assays, following the procedure described by Zacarías-García et al. (2022), with minor modifications. Briefly, 0.5 g of dried cookie sample was extracted with 5 mL of methanol:water (80:20, v/v) for DPPH and FRAP analyses, whereas extraction for ABTS was performed using 5 mL of dipotassium phosphate buffer (pH 7.8). Extracts were centrifuged, and the supernatants were used for analysis. In the DPPH assay, appropriate aliquots of the extract were mixed with DPPH solution, incubated in the dark, and absorbance was measured at 517 nm. FRAP analysis was carried out by mixing 20 µL of extract with 200 µL of FRAP reagent, followed by incubation for 30 min at 37 °C in the dark and measurement at 593 nm. For ABTS, the extract was reacted with the ABTS•+ solution and absorbance was recorded at 730 nm. In addition, in vitro digested cookies were evaluated using DPPH, ABTS and FRAP assays (Cakarevic et al., 2020). Antioxidant capacity was quantified using a Trolox calibration curve and results were expressed as mg Trolox equivalents (TEAC) per 100 g of dry weight.
Determination of sugars
Sucrose, glucose, and fructose were extracted from 0.5 g of dry cookie sample with 5 mL MilliQ water and diluted 1:500 prior to analysis. Sugars were quantified using a Dionex ICS 3000 high-performance ionic chromatograph (Dionex, California, USA) with a CarboPac PA100 anion-exchange column (250 × 4 mm, 4 μm) and guard column (50 × 4 mm, 4 μm). Elution was performed at 1 mL/min over 12.5 min using a gradient of NaOH and NaOAc: 0–2 min, 0.1 M NaOH; 2–5 min, linear increase of NaOH to 0.3 M; 5–12.5 min, NaOH at 0.3 M and NaOAc increased linearly to 0.15 M. Results are expressed as g per 100 g dry weight.
Assessment of total carotenoids in pumpkin-containing cookies
Total carotenoids were extracted from 0.5 g dried cookies with 5 mL Tris–HCl buffer (50 mM, pH 7.5–8.0) and 5 mL dichloromethane, sonicated for 6 min, and centrifuged (4500 rpm, 10 min, 4 °C). The organic phase was collected, and the aqueous phase re-extracted until colorless. Extracts were dried, dissolved in chloroform, and quantified at 450 nm using the β-carotene absorption coefficient (De Carvalho et al., 2012). Results are expressed as µg β-carotene equivalents per g of dry weight.
In vitro digestion of cookies
The standardized protocol of Minekus et al. (2014) was applied for in vitro digestion, with small modifications. During the oral phase, ground cookie samples were combined with simulated salivary fluid at a 1:1 (w/v) ratio, containing salivary α-amylase (75 U/mL), and the pH was set to 7.0. The mixture was incubated at 37 °C for 2 min under continuous stirring. For the gastric phase, the oral bolus was mixed with simulated gastric fluid at a 1:1 (v/v) ratio, enriched with pepsin (2000 U/mL), and adjusted to a pH of 4.0. This mixture was then incubated at 37 °C with agitation for 2 h. In the intestinal phase, the gastric chyme was diluted at a 1:1 (v/v) ratio using simulated intestinal fluid containing pancreatin (100 U/mL) and bile salts (10 mM), with the pH adjusted to 7.0. The sample underwent incubation in a stirring water bath at 37 °C for an additional 2 h. At the conclusion of each digestion stage, aliquots were extracted and centrifuged at 3000 rpm for 10 min,and the supernatants were collected and stored at −80 °C for total phenolic content (TPC) and antioxidant analyses (DPPH, ABTS, and FRAP).
Statistical analysis
A one-way analysis of variance (ANOVA) was conducted using XLSTAT software (version 2010, Addinsoft, Barcelona, Spain). When significant effects were identified, Tukey's test was applied with a significance threshold of P ≤ .05 to determine differences between the samples.
Results and discussion
Physical properties of cookies
There are no significant differences between C. moshata variety and the control sample in weight loss and a gain in dimensions, whereas C. maxima variety has lower significant values (Table 1). Water activity (aw) increased significantly in pumpkin-enriched cookies (P < .05), implying a greater availability of water for microbial and biochemical reactions. WAC was significantly higher (P < .05), rising from 230% to 248% for C. moschata and from 133% to 143% for C. maxima, although these last values did not differ to the control cookie. Cookie pH ranged from 6.7 to 7.3 depending on the formulation. The control (C0) had the highest pH (7.3), typical of wheat-flour-based bakery products with leavening agents, while pumpkin-enriched cookies (C1–C4) showed significantly lower pH values (6.7–7.1). The reduction in C1 and C3 (6.7) is likely due to organic acids in pumpkin pulp such as citric malic and fumaric acids. Although pH did not decrease strictly with enrichment level pumpkin incorporation slightly reduced alkalinity maintaining near-neutral values favorable for product stability and limiting microbial growth without affecting sensory quality (Akhtar et al., 2010).
Mean values of weight loss (WL), dimensions, pH, water activity (aw) and water absorption capacity (WAC) of cookies enriched with C. moshata variety and C. maxima variety (C1: cookies enriched with 5% of C. maxima variety, C2: cookies enriched with 5% of C. moshata variety, C3: cookies enriched with 15% of C. maxima variety, C4: cookies enriched with 15% of C. moshata variety).
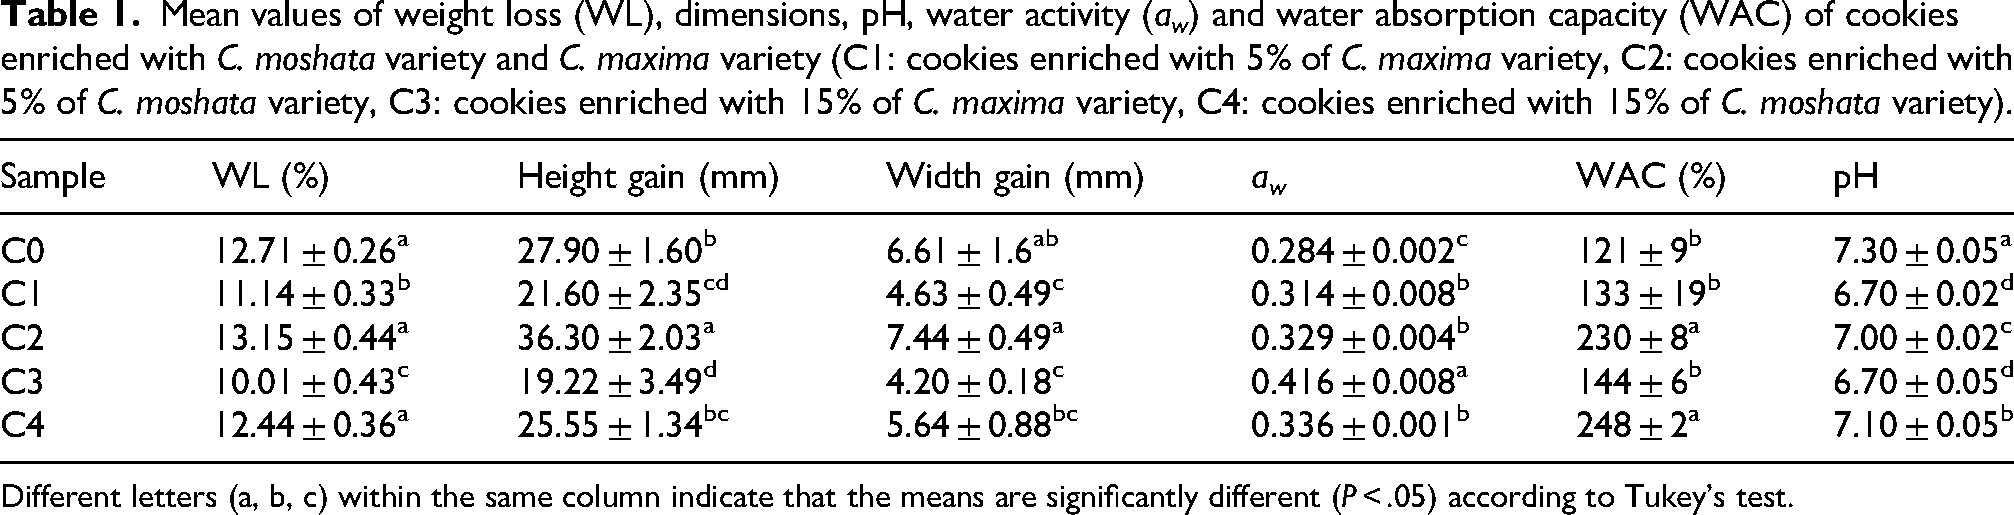
Different letters (a, b, c) within the same column indicate that the means are significantly different (P < .05) according to Tukey's test.
Approximate composition of a cookie made from pumpkin flour
Table 2 shows the proximate composition of the cookies. Moisture content ranged from 2.0% to 3.96%, indicating low water levels favorable for shelf life (Adebowale et al., 2012). No differences in protein and fat content among the samples were found. Ash content increased with higher pumpkin substitution (0.544–0.906 and 1.078), reflecting higher mineral content.
Mean values of moisture, protein, ash and fat of cookies enriched with C. moshata and C. maxima variety (C1: cookies enriched with 5% of C. maxima variety, C2: cookies enriched with 5% of C. moshata variety, C3: cookies enriched with 15% of C. maxima variety, C4: cookies enriched with 15% of C. moshata variety).
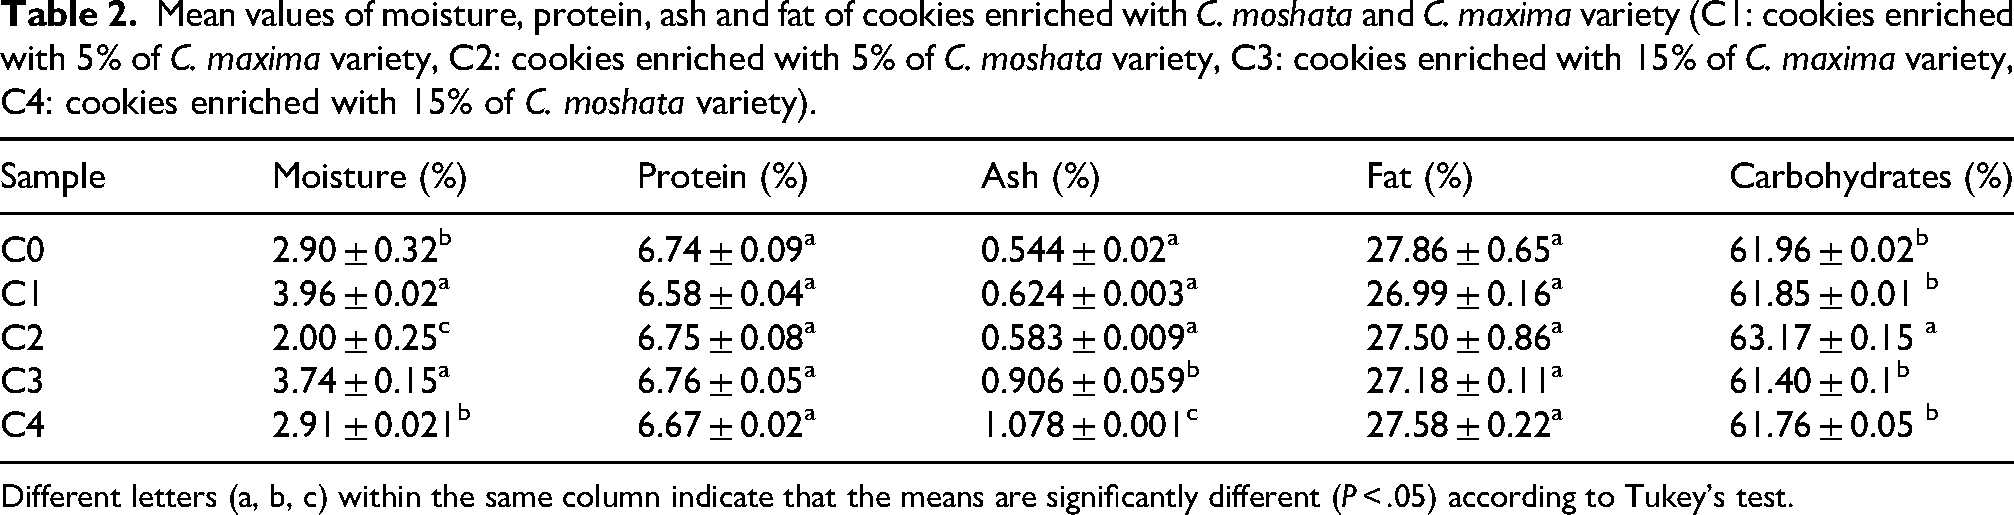
Different letters (a, b, c) within the same column indicate that the means are significantly different (P < .05) according to Tukey's test.
Carbohydrate content ranged from 61.40 to 63.17, with sample C2 showing the highest value (P < .05), likely due to lower moisture and ash levels. Other formulations showed no significant differences, indicating that pumpkin incorporation had a limited effect on carbohydrate content, consistent with previous studies (Kulczyński et al., 2019).
Texture analysis
Texture profile analysis of biscuit dough
Understanding the impact of dough composition on cookie texture is essential. TPA parameters, including hardness, springiness, cohesiveness, and chewiness, were evaluated (Table 3). Hardness, reflecting resistance to deformation, influences consumer perception of quality and freshness. The control (C0), doughs with 5% and 15% of C. maxima (C1 and C3) showed comparable hardness (P > .05), slightly higher than C. moschata dough likely due to the higher water-holding capacity of fiber in the maxima variety. Higher dietary fiber and improved water and oil retention are also known to increase firmness (Topkaya and Isik, 2019). Springiness, cohesiveness, and chewiness showed no significant differences, though C. moschata dough had slightly higher springiness and chewiness. Overall, pumpkin incorporation reduced firmness while maintaining cohesiveness and elasticity, contributing to a softer, well-balanced dough that may yield tender more palatable cookies.
Instrumental texture characteristics obtained by TPA, bite force test and 3-point bending test for the five cookies formulations enriched with C. moshata variety and C. maxima variety (C0: control, C1: cookies enriched with 5% of C. maxima variety, C2: cookies enriched with 5% of C. moshata variety, C3: cookies enriched with 15% of C. maxima variety, C4: cookies enriched with 15% of C. moshata variety).
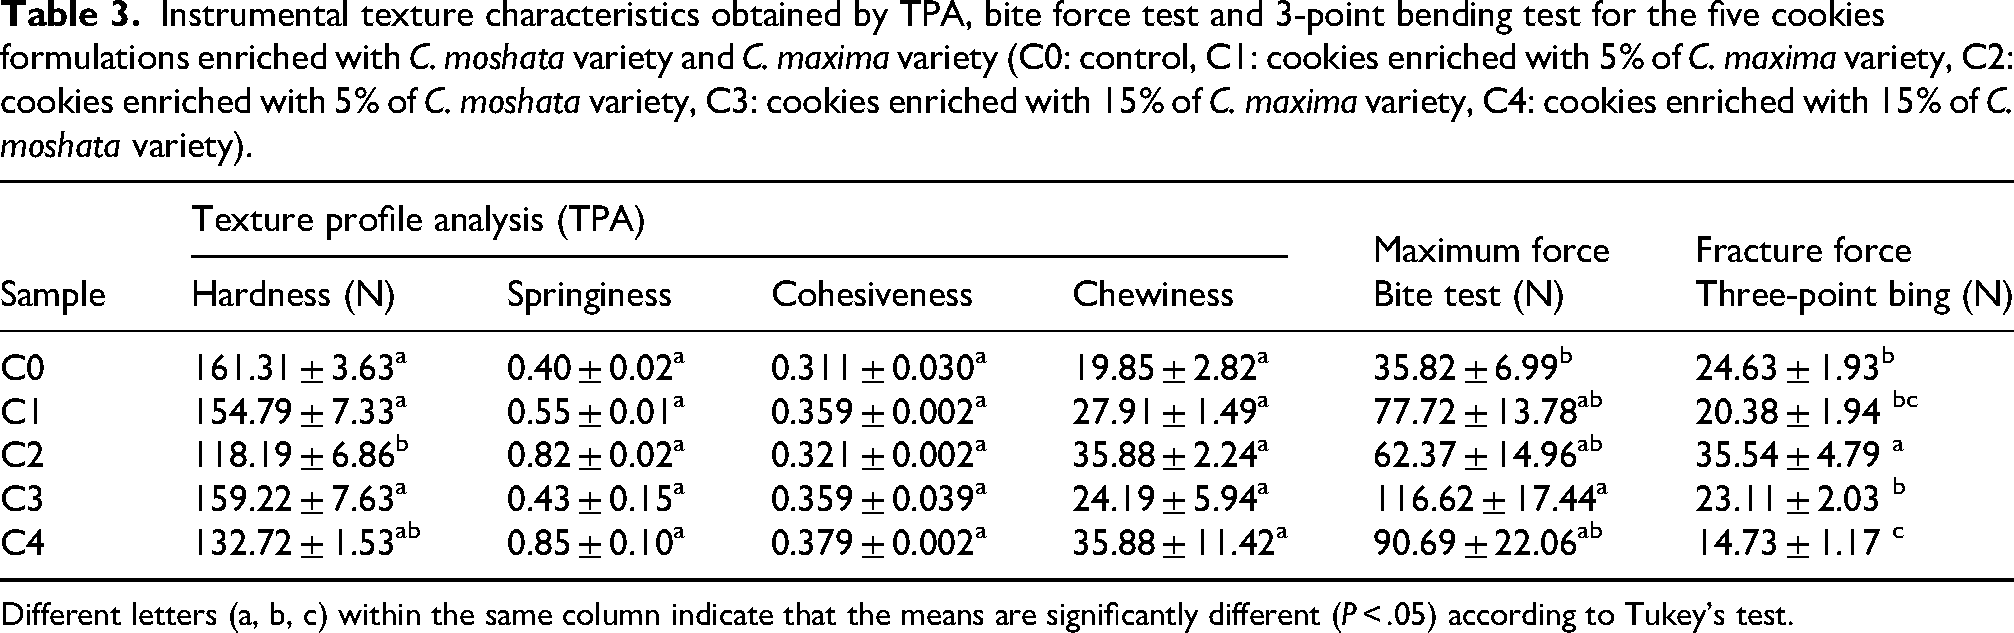
Different letters (a, b, c) within the same column indicate that the means are significantly different (P < .05) according to Tukey's test.
Texture of cookies
Baking shortcrust pastry converts it into a cellular solid, which gives it its distinctive texture. The highest fracture force was recorded in cookies containing 5 g of C. moschata (C2) (Table 3), suggesting a denser and less aerated structure. As pumpkin levels increased, hardness tended to decrease, likely resulting from reduced flour content and changes in water absorption. However, C2 exhibited a higher penetration force, likely due to its compact crumb structure and enhanced internal lubrication, which facilitated fracture into smaller fragments. For C. maxima, hardness remained relatively stable with increasing pumpkin content, likely due to its high carotenoid content and rigid starch granules reinforcing the structure. In contrast, C. moschata, richer in sugars and soluble pectins, showed weaker cohesion and reduced hardness at higher levels (Rinaldi et al., 2023; Xu et al., 2024).
Maximum bite force ranged from 35.82 N (C0) to 116.62 N (C3), while fracture force from the 3-point bending test varied from 14.73 N (C4) to 35.54 N (C2). Cookies enriched with C. moschata exhibited greater fracture resistance, whereas C. maxima formulations showed more consistent mechanical properties. These findings confirm that pumpkin type and level significantly affect cookie texture, consistent with reports by Topkaya and Işık (2019).
Determination of thermographic properties
TGA was used to assess the thermal degradation of pumpkin-enriched cookies. Thermograms (Supplentary Figure) showed distinct mass-loss stages, with degradation parameters summarized in Table 4. All samples exhibited the characteristic inverted S-shaped profile, with initial mass loss from moisture evaporation, followed by degradation of starch, proteins, lipids, and fibers, in agreement with previous studies on pumpkin-based bakery products (Asaduzzaman et al., 2025).
Thermal degradation profile by therogravimetric and derivative thermogravimetic analysis (TGA and DTG) of cookies formulations enriched with C. moshata variety and C. maxima variety (C0: control, C1: cookies enriched with 5% of C. maxima variety, C2: cookies enriched with 5% of C. moshata variety, C3: cookies enriched with 15% of C. maxima variety, C4: cookies enriched with 15% of C. moshata variety).
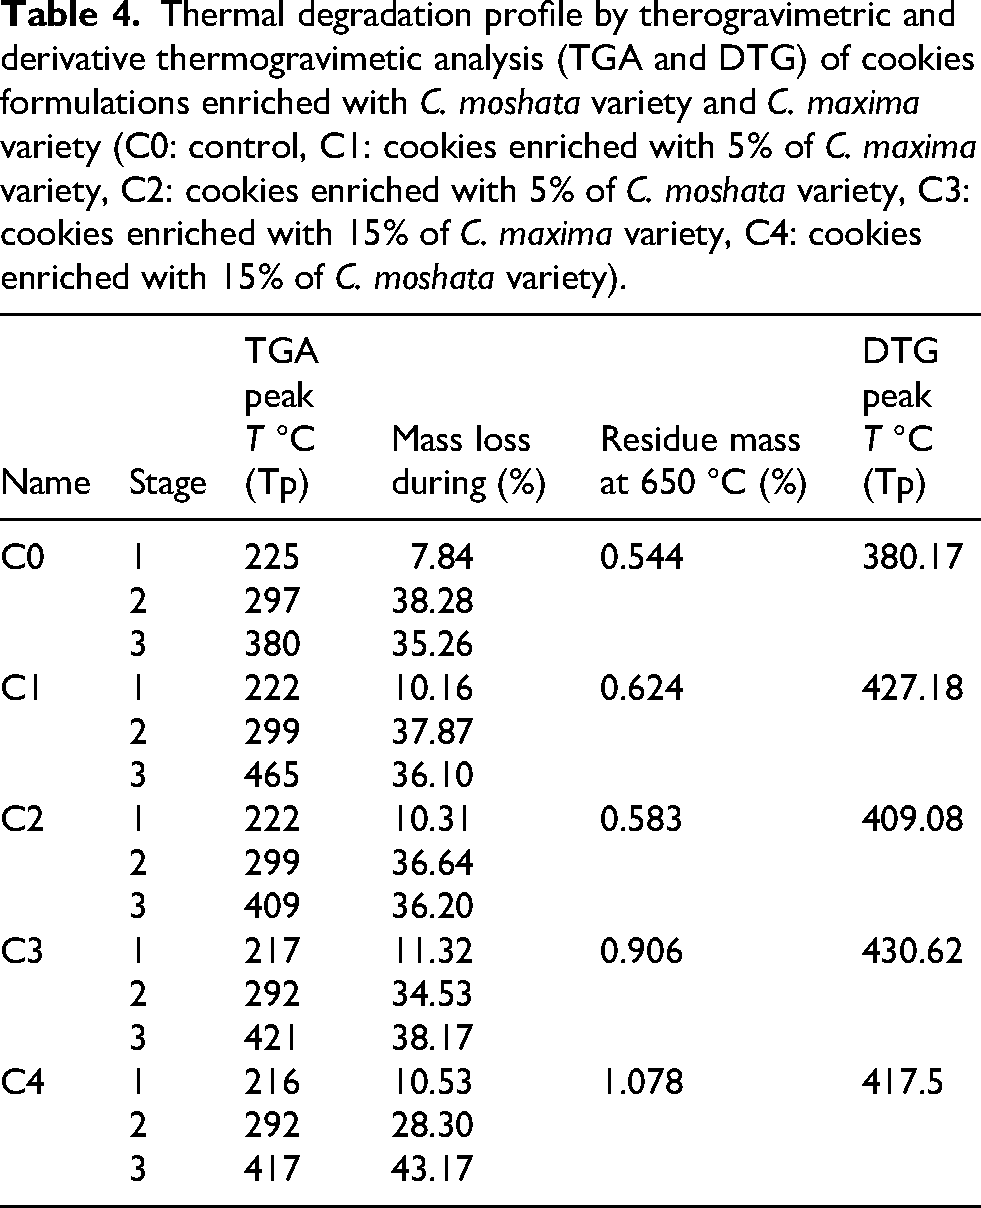
TG-DTG analysis revealed three main decomposition stages: drying, devolatilization, and carbonization. The first stage, mainly moisture evaporation, occurred at peak temperatures of 216.82–223.07 °C (C0–C4) with 8.56–11.32% mass loss; slightly higher losses may reflect volatilization of light compounds (Singh et al., 2021). The second stage, associated with protein and carbohydrate degradation, occurred at 292.26–299.34 °C with 31.23–37.87% mass loss. The third stage corresponded to char degradation and carbonization, with the highest mass loss for C4 (43.17% at 417.5 °C) and the lowest for C0 (35.26% at 380.17 °C), involving formation of stable mineral residues and release of volatiles (Sonawane et al., 2020). At 650 °C, residual mass followed the order C4 > C3 > C1 > C2 > C0, reflecting differences in inorganic ash content (Singh et al., 2021).
Observation by confocal laser scanning microscopy
Confocal laser scanning microscopy (CLSM) was used to examine the distribution of ingredients within biscuits through differential staining techniques. Figure 1 presents CLSM images of biscuits stained with Fast Green, where proteins appear as dispersed red regions. The micrographs highlight areas with higher protein concentration, particularly in dense regions of the inner crumb. This observation is consistent with the findings of Chevallier et al. (2000), who described biscuit structure as a suspension of proteins and starch–protein associations.
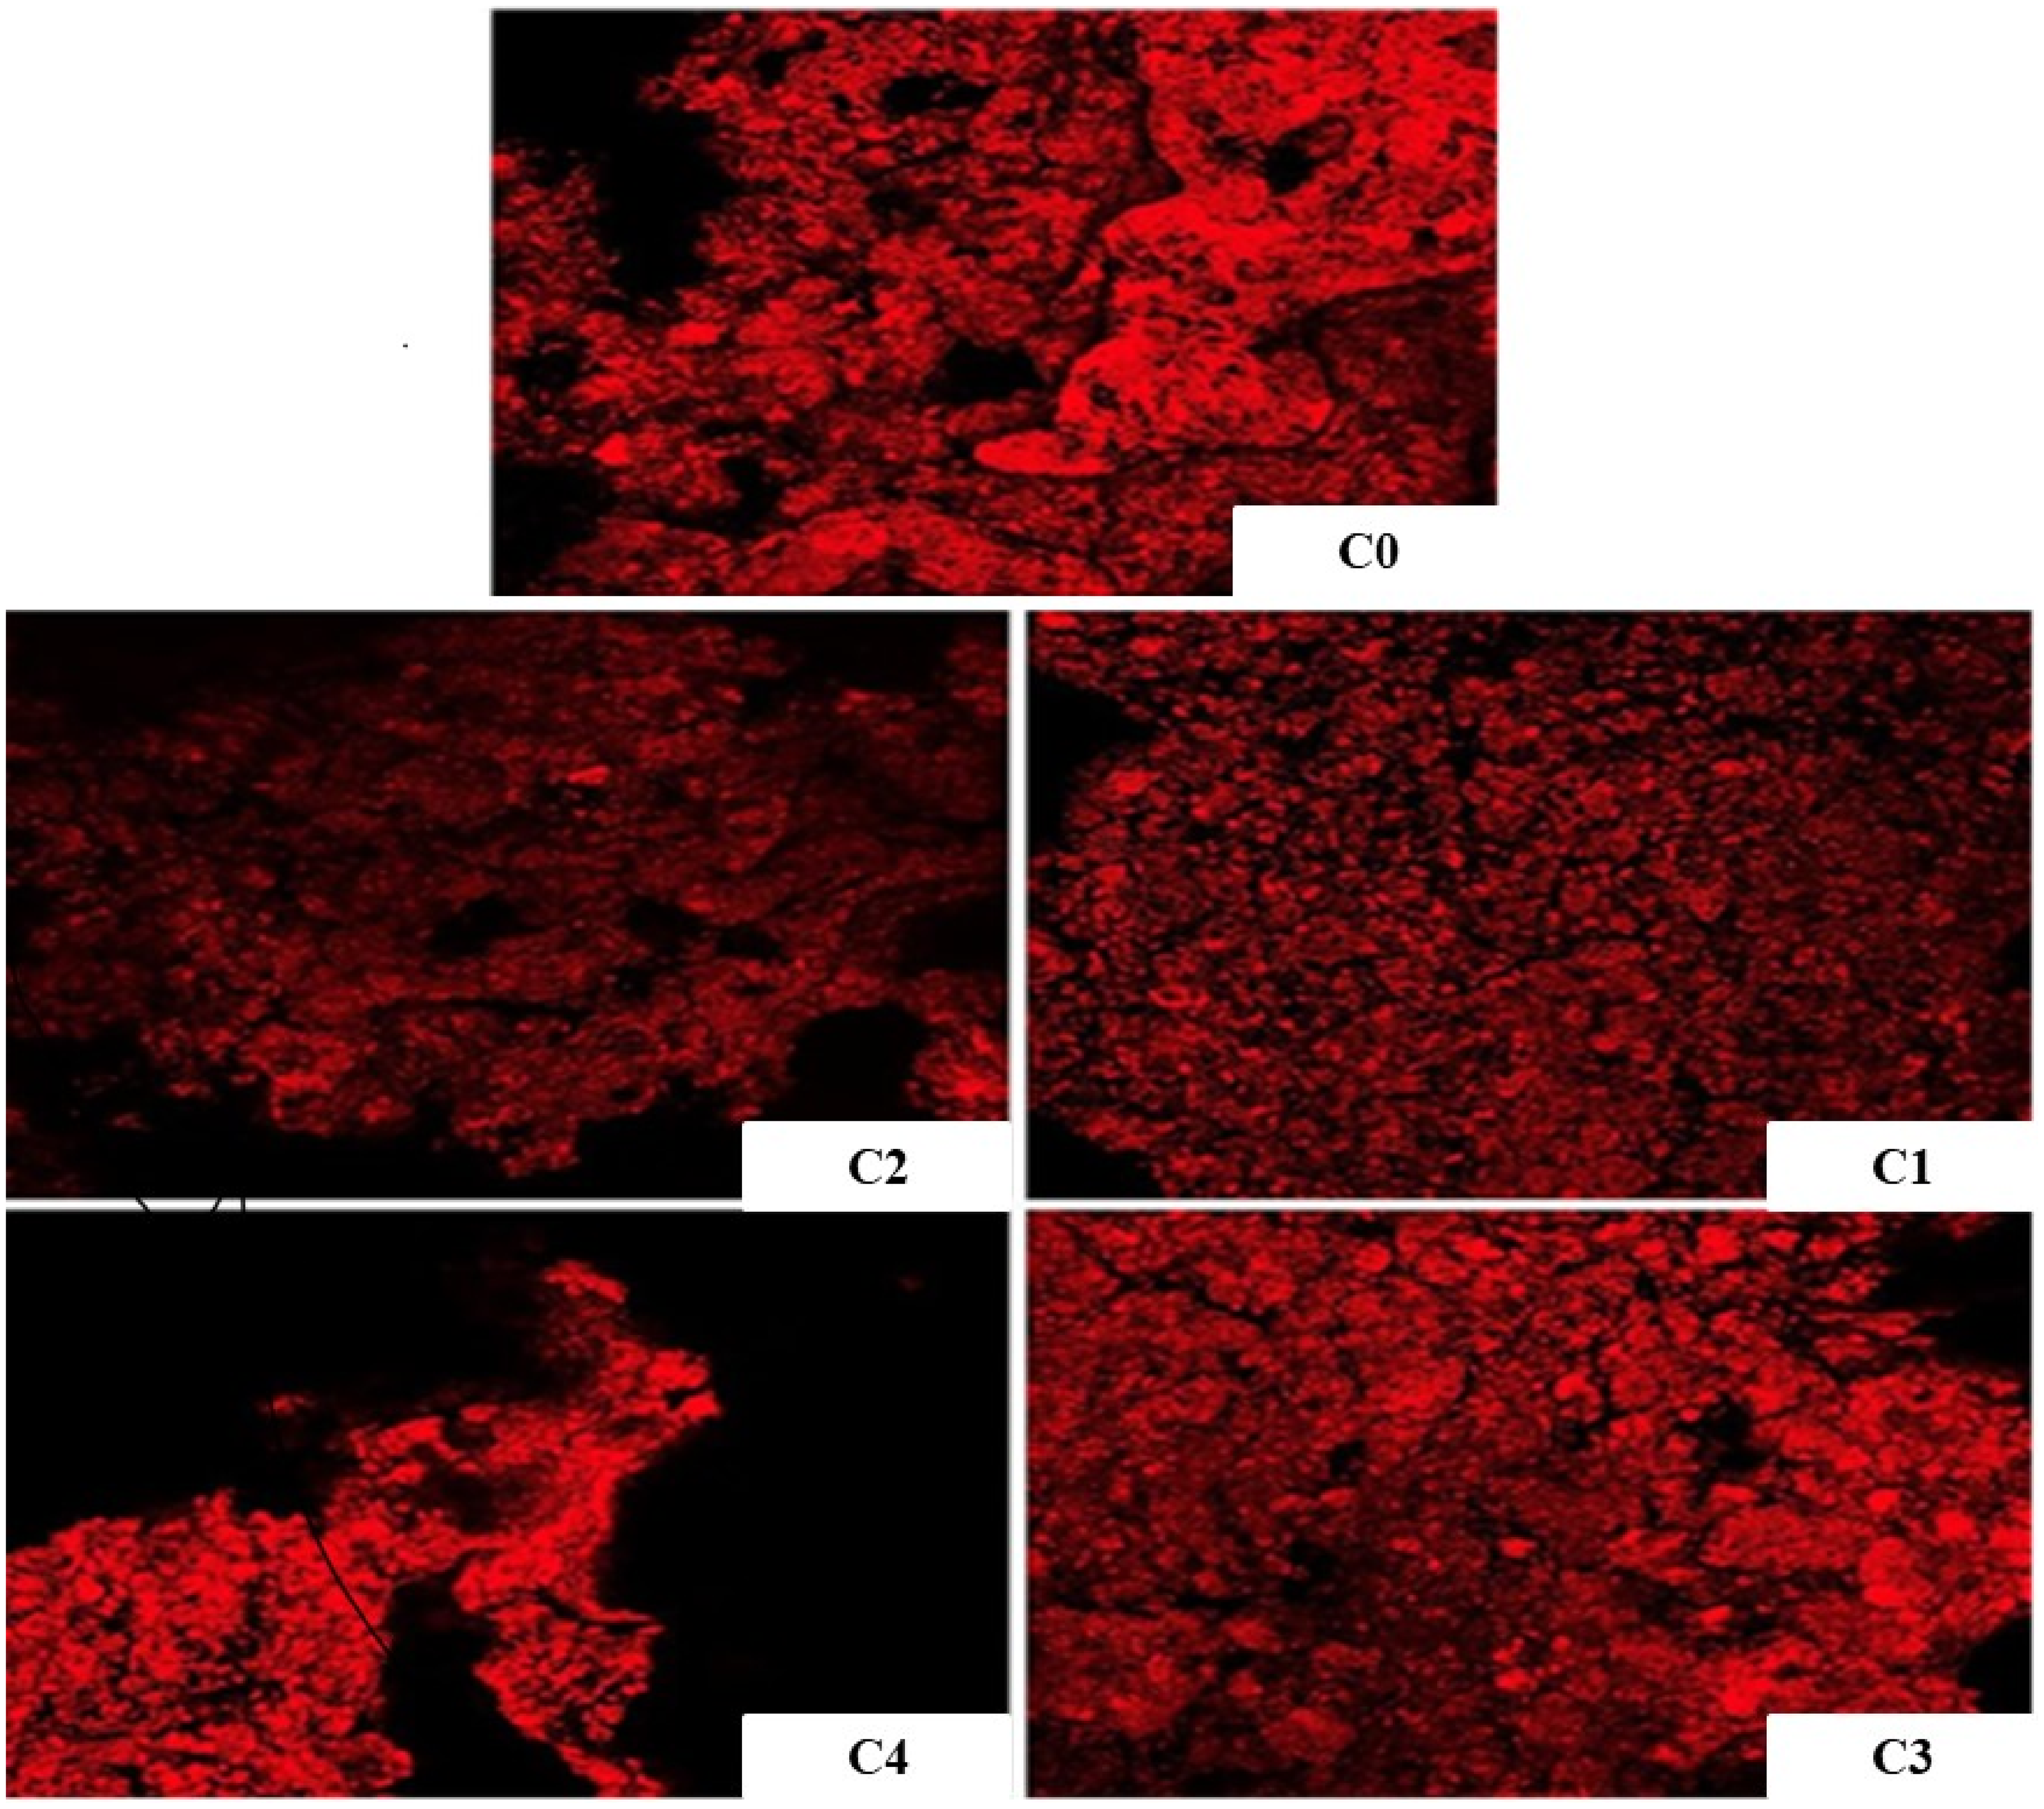
Confocal laser scanning microscopy (CLSM). Images of cookies stained with Fast Green are shown. (C0: control, C1: cookies enriched with 5% of C. maxima variety, C2: cookies enriched with 5% of C. moshata variety, C3: cookies enriched with 15% of C. maxima variety, C4: cookies enriched with 15% of C. moshata variety).
Control cookies without pumpkin (C0) exhibited a heterogeneous structure characterized by an irregular distribution of the starch–protein matrix. The C2 sample showed weak and uneven fluorescence, suggesting limited incorporation of the enriched compounds. In contrast, C4 displayed stronger fluorescence, although the distribution remained granular with visible aggregation zones, indicating partial segregation within the matrix. On the other hand, C1 and C3 showed a more structured matrix, which is related to the more consistent mechanical properties obtained in the C. maxima variety.
Overall, C. maxima achieved better matrix integration than C. moschata, highlighting the importance of variety and concentration for uniform dispersion and improved functional properties (Saini and Keum, 2018).
Determination of sugars
As shown in Table 5, sucrose, glucose, and fructose were the main sugars in all pumpkin cookies. Sucrose was predominant (37.62–51.66 g/100 g), followed by glucose (0.18–2.30 g/100 g) and fructose (0.43–2.26 g/100 g). The highest sucrose content was in C4, while C0 and C2 had the lowest. Glucose and fructose were highest in C3 (2.30 ± 0.17 and 2.26 ± 0.21 g/100 g) and lowest in C2 (0.18 ± 0.02 and 0.43 ± 0.01 g/100 g), with no detectable glucose or fructose in pumpkin-free cookies (C0). These results show that pumpkin enrichment strongly affects glucose and fructose levels, moderately impacts sucrose, and that sugar composition also depends on pumpkin variety. This aligns with previous findings that pumpkins enhance sensory quality via their sugars and organic acids (Zhou et al., 2017).
Sugars concentrations (g/100 g DW) of cookies formulations enriched with C. moshata variety and C. maxima C0: control, C1: cookies enriched with 5% of C. maxima variety, C2: cookies enriched with 5% of C. moshata variety, C3: cookies enriched with 15% of C. maxima variety, C4: cookies enriched with 15% of C. moshata variety).
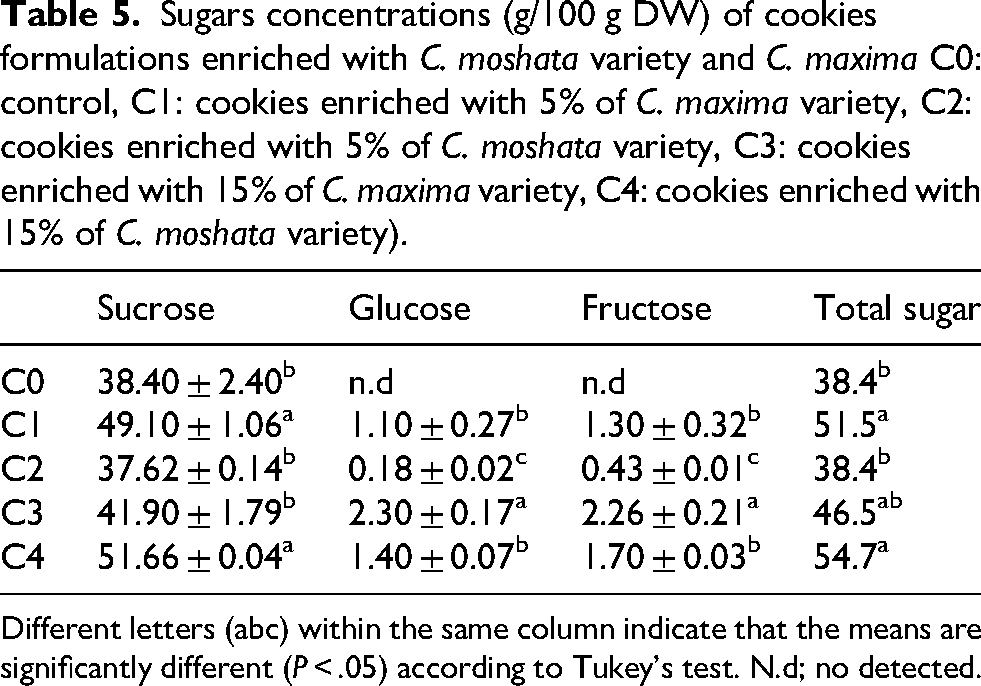
Different letters (abc) within the same column indicate that the means are significantly different (P < .05) according to Tukey's test. N.d; no detected.
Determination of carotenoids
Figure 2 shows the total carotenoid content in control and pumpkin-enriched cookies. Cookies with 15 g of pumpkin powder had the highest levels, while the control showed the lowest. Carotenoid content increased with pumpkin incorporation: C. maxima cookies (C1 and C3) contained 24.1 ± 0.44 and 48.5 ± 2.06 µg/g β-carotene equivalents, and C. moschata cookies (C2 and C4) had 18.2 ± 0.45 and 47.7 ± 3.79 µg/g. These results indicate that pumpkin enrichment, particularly at 15 g, substantially enhances carotenoid content, with C. maxima being slightly more effective than C. moschata . Similar trends have been reported in previous studies, where pumpkin addition increased β-carotene in biscuits and cakes proportionally to substitution level (Dhiman et al., 2018; Zaki et al., 2018).
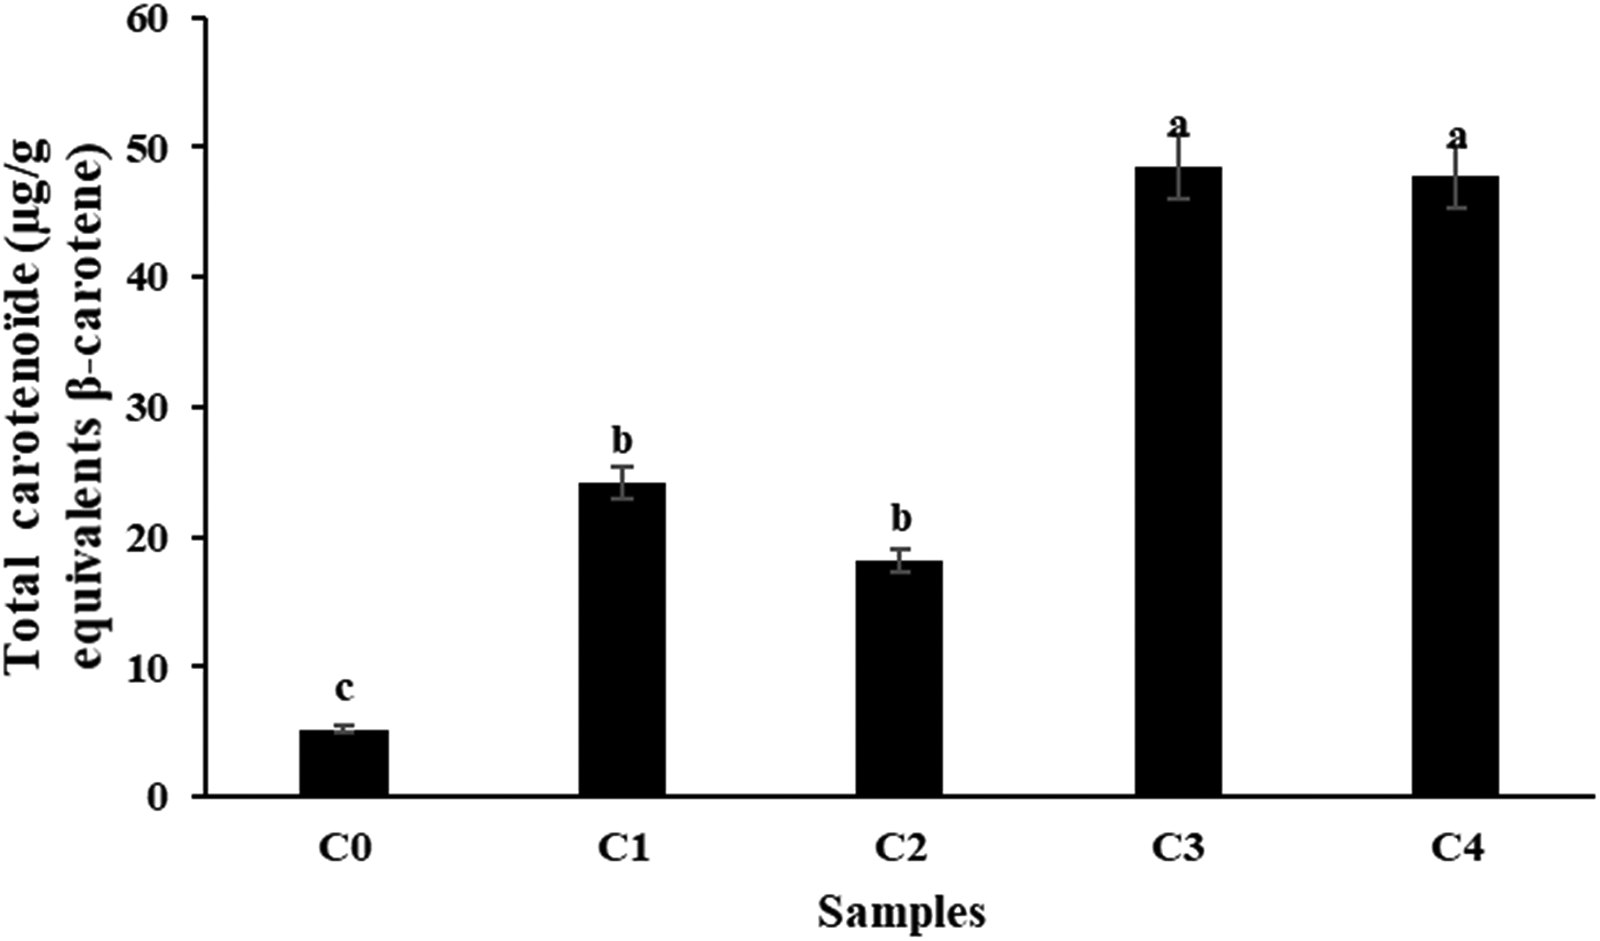
Total carotenoids amount (µg/g equivalents of ß-carotene DW) of cookies formulations enriched with C. moshata variety and C. maxima variety (C1: cookies enriched with 5% of C. maxima variety, C2: cookies enriched with 5% of C. moshata variety, C3: cookies enriched with 15% of C. maxima variety, C4: cookies enriched with 15% of C. moshata variety).
In vitro digestion of cookies
Cookie digestibility was assessed to evaluate potential bioactive effects upon consumption and to understand how digestion, under varying pH and digestive enzymes, influences their bioactivity.
Analysis of total phenolic and antioxidant capacity
Pumpkin is a nutritious source of dietary polyphenols with health-promoting properties, but these compounds need to be freed from the food matrix to become bioaccessible (Lucini Mas et al., 2022). TPC from 80% methanolic extracts (Table 6) was highest in C4 (182.6 ± 1.6 mg GAE/100 g) and lowest in the control (C0: 118.8 ± 13.7). While 5% pumpkin had little effect, 15% enrichment increased TPC by 23% in C. maxima and 35% in C. moschata, reflecting the high phenolic content of pumpkin (Asif et al., 2017).
Mean values of total phenolic content TPC (GAE/100 g DW) and antioxidant capacity measured by DPPH (mg eq vit C/100 g), ABTS (mg eq vit C/100 g), and FRAP (mg eq vit C/100 g), assays (TEAC/100 g DW) before and after in vitro digestion of cookies enriched with C. moschata and C. maxima varieties (C0: control, C1: cookies enriched with 5% of C. maxima variety, C2: cookies enriched with 5% of C. moshata variety, C3: cookies enriched with 15% of C. maxima variety, C4: cookies enriched with 15% of C. moshata variety).
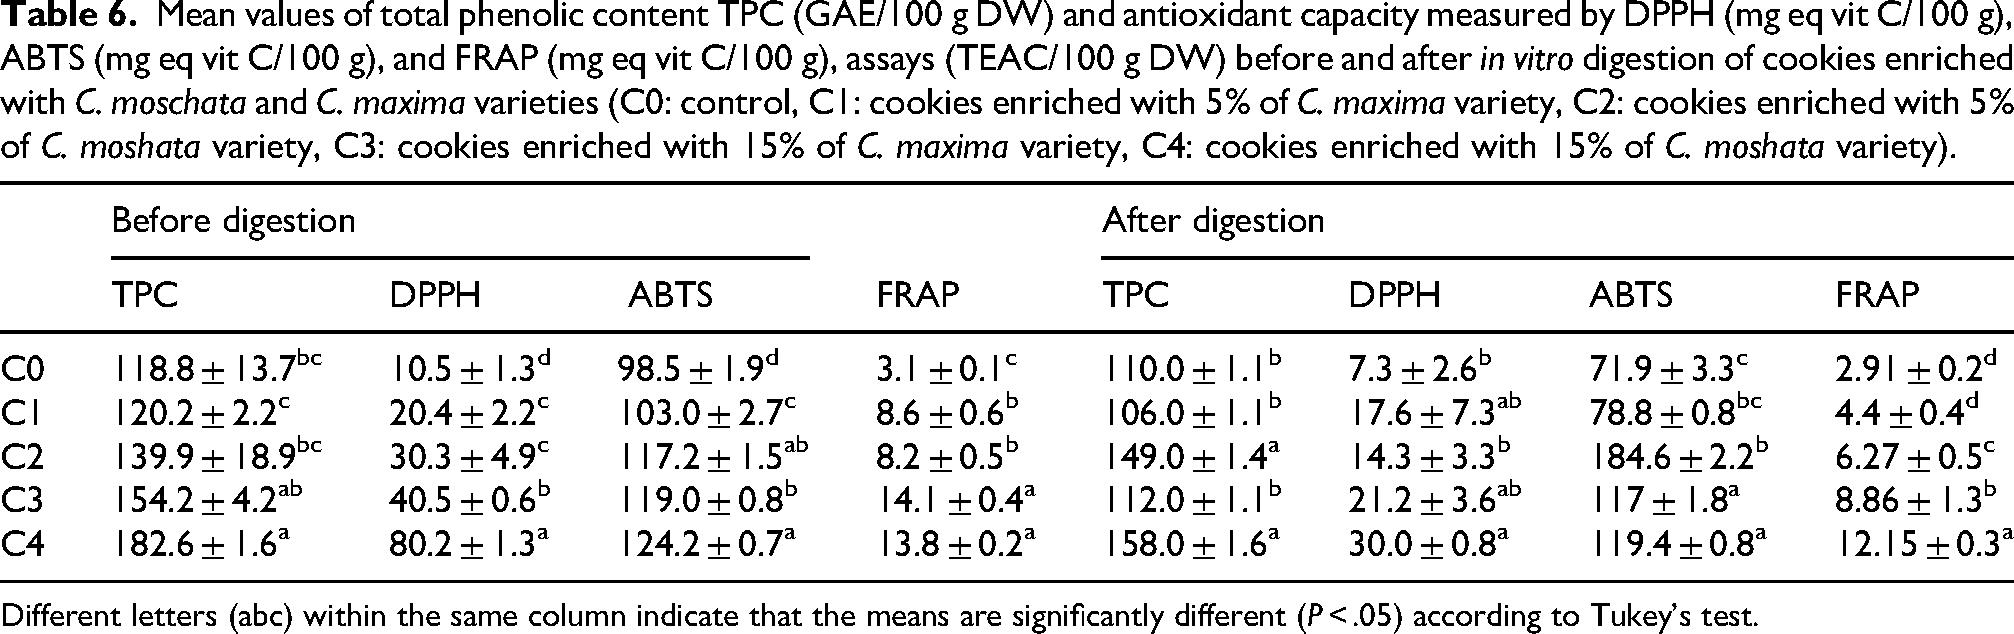
Different letters (abc) within the same column indicate that the means are significantly different (P < .05) according to Tukey's test.
DPPH activity followed a similar trend: C0 showed the lowest activity (10.5 mg eq Vit C/100 g), 5% enrichment gave intermediate values (20.4 for C. maxima, 30.3 for C. moschata), and 15% enrichment markedly increased antioxidant capacity to 40.5 and 80.2 mg eq Vit C/100 g, respectively, demonstrating dose- and variety-dependent effects. ABTS results mirrored these trends, confirming pumpkin powder as a valuable polyphenol source (Kaur et al., 2020).
FRAP assay supported these findings: the control had the lowest reducing power (3.1 mg eq Vit C/100 g), 5% enrichment increased values to 8.6 (C. maxima) and 8.2 (C. moschata), and 15% enrichment reached 14.1 (C3) and 13.8 (C4), showing a clear dose-dependent effect. Statistical analysis grouped enriched samples into low (C1–C2) and high (C3–C4) categories. These findings underscore the significant role of pumpkin, with Cucurbita moschata in particular, in augmenting the phenolic content and antioxidant capacity of cookies, aligning with the outcomes of previous research by Mojarad and Mahdikhani (2020).
The comparative analysis of TPC and antioxidant activity (DPPH, ABTS, FRAP) before and after in vitro digestion (Table 6) revealed significant impacts from pumpkin type and enrichment level. After digestion, TPC generally decreased due to polyphenol degradation, although C2 showed a slight increase, likely from phenolics released from the food matrix or fiber (Zhang et al., 2023).
DPPH activity increased post-digestion, indicating improved bioaccessibility. C4 remained the most effective, with the highest DPPH (29.95 ± 0.8), ABTS (119.4 ± 0.8), and FRAP (12.15 ± 0.3) values. ABTS retained more activity than DPPH and FRAP, reflecting its sensitivity to hydrophilic antioxidants released during digestion (Ma et al., 2023). Reductions in activity have been linked to gastrointestinal enzymes, pH, and salts (Menchaca-Armenta et al., 2023). Overall, C. moschata at high enrichment showed greater phenolic stability, while C. maxima exhibited higher bioaccessibility and a pronounced antioxidant response. These results confirm that pumpkin powder significantly enhances the antioxidant potential of cookies, supporting their development as functional foods and valorization of cucurbit-based ingredients (Pinto et al., 2023).
Inhibitory activities of cookies against α-amylase and α-glucosidase
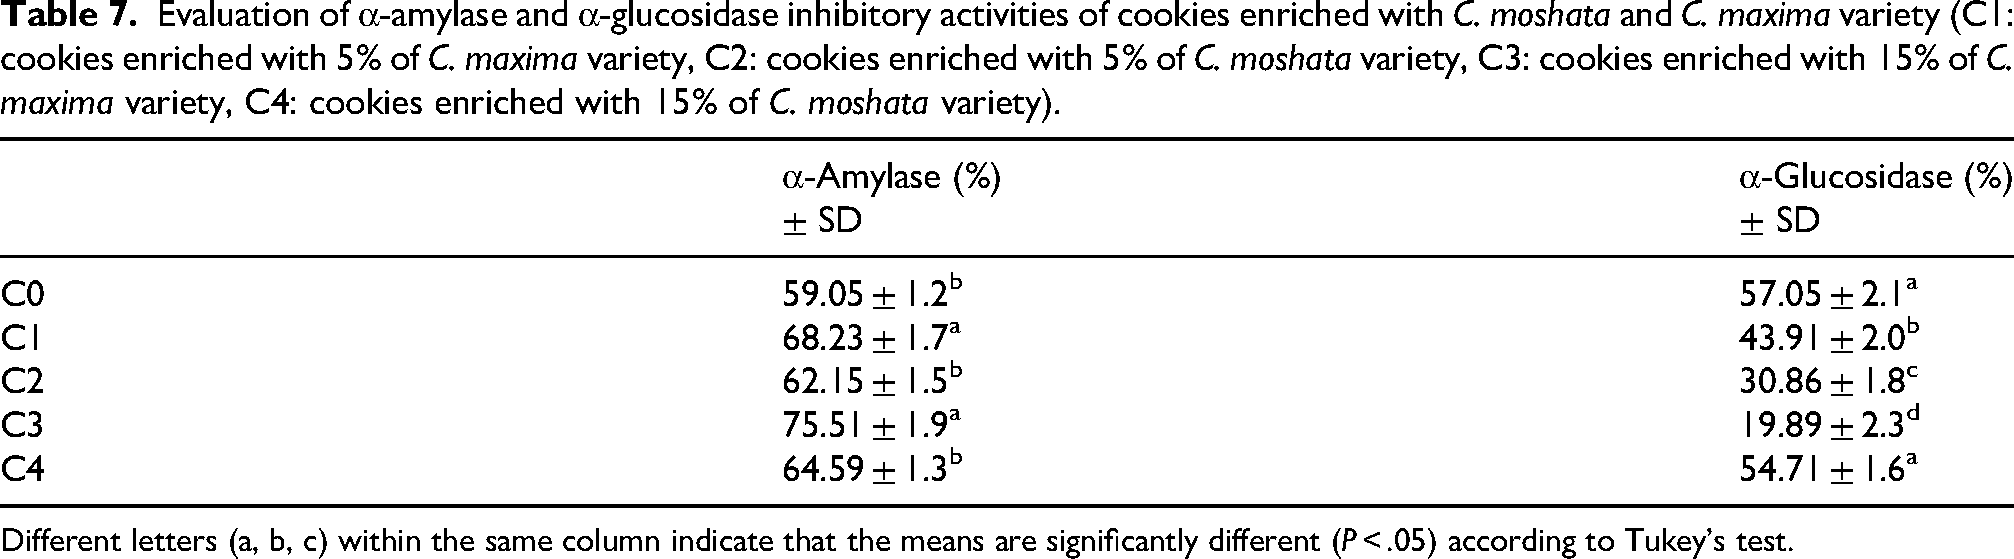
Cookies fortified with Cucurbita maxima (C1, C3) and Cucurbita moschata (C2, C4) demonstrated significantly higher α-amylase and α-glucosidase inhibition compared to the control group (P < .05; Table 7).The control exhibited moderate enzyme inhibition. Pumpkin enrichment enhanced α-amylase inhibition, especially in C3 (C. maxima, 75.51%), likely due to polyphenols, flavonoids, and soluble fibers interacting with digestive enzymes. In contrast, α-glucosidase inhibition decreased in enriched samples, particularly C3 and C2, reflecting a preferential effect on α-amylase, as reported for pumpkin flavonols and carotenoids (Pinto et al., 2023). Overall, C3 demonstrated the most favorable antidiabetic profile by moderating starch hydrolysis without excessive α-glucosidase inhibition, potentially reducing postprandial glycemia while minimizing gastrointestinal effects (Chandel, 2021; Hasaninezhad et al., 2020). These results suggest that pumpkin-enriched cookies, particularly C3, combine antioxidant activity with balanced enzyme inhibition, supporting their potential as functional foods with antidiabetic benefits.
Evaluation of α-amylase and α-glucosidase inhibitory activities of cookies enriched with C. moshata and C. maxima variety (C1: cookies enriched with 5% of C. maxima variety, C2: cookies enriched with 5% of C. moshata variety, C3: cookies enriched with 15% of C. maxima variety, C4: cookies enriched with 15% of C. moshata variety).
Different letters (a, b, c) within the same column indicate that the means are significantly different (P < .05) according to Tukey's test.
Conclusion
This research highlighted that pumpkin, a widely available by-product of food processing, can be successfully utilized in biscuit production. Adding 15% pumpkin flour sourced from C. maxima and C. moschata significantly improved the nutritional value by increasing protein, total sugar, ash content, and bioactive compounds such as antioxidants and carotenoids. Additionally, the production process proved to be straightforward and cost-efficient. These findings demonstrate that pumpkin-enriched biscuits are a nutritious, functional, and consumer-friendly food option.
Supplemental Material
sj-docx-1-fst-10.1177_10820132261464263 - Supplemental material for Assessment of physicochemical and functional properties of cookies fortified with pumpkin powder
Supplemental material, sj-docx-1-fst-10.1177_10820132261464263 for Assessment of physicochemical and functional properties of cookies fortified with pumpkin powder by Sonia Dhifli, Ana Salvador, Ibtissem Ghanmi, Silvia Bobadilla, Jaime Zacarias, Teresa Sanz, Hedia Chaabane, Mondher Mejri and Hela Mahmoudi in Food Science and Technology International
Footnotes
Acknowledgments
The authors gratefully acknowledge the researchers involved in the Ministry of Higher Education project at the University of Jendouba, the Tunisian Natural Substances Laboratory (INRAP), and the Laboratory of Physical, Sensory, and Consumer Properties for their support. They also thank IATA-CSIC for valuable scientific discussions and ISBB for technical assistance.
Funding
The authors disclosed receipt of the following financial support for the research, authorship, and/or publication of this article: This research was supported by the Spanish Ministry of Science and Innovation (Grant No. PID2022-1375870B-C21). IATA-CSIC is recognized as a Severo Ochoa Centre of Excellence (CEX2021-001189-S) funded by MCIN/AEI/10.13039/501100011033).
Declaration of conflicting interests
The authors declared no potential conflicts of interest with respect to the research, authorship, and/or publication of this article.
Supplemental material
Supplemental material for this article is available online.
References
Supplementary Material
Please find the following supplemental material available below.
For Open Access articles published under a Creative Commons License, all supplemental material carries the same license as the article it is associated with.
For non-Open Access articles published, all supplemental material carries a non-exclusive license, and permission requests for re-use of supplemental material or any part of supplemental material shall be sent directly to the copyright owner as specified in the copyright notice associated with the article.