
Abstract
Beginning January 1, 2020, Medicare’s Patient-Driven Groupings Model (PDGM) eliminated therapy as a direct determinant of Home Health Agencies’ (HHAs’) reimbursements. Instead, PDGM advances Medicare’s shift toward value-based payment models by directly linking HHAs’ reimbursements to patients’ medical conditions. We use 3 publicly-available datasets and ordered logistic regression to examine the associations between HHAs’ pre-PDGM provision of therapy and their other agency, patient, and quality characteristics. Our study therefore provides evidence on PDGM’s likely effects on HHA reimbursements assuming current patient populations and service levels do not change. We find that PDGM will likely increase payments to rural and facility-based HHAs, as well as HHAs serving greater proportions of non-white, dual-eligible, and seriously ill patients. Payments will also increase for HHAs scoring higher on quality surveys, but decrease for HHAs with higher outcome and process quality scores. We also use ordinary least squares regression to examine residual variation in HHAs’ expected reimbursement changes under PDGM, after accounting for any expected changes related to their pre-PDGM levels of therapy provision. We find that larger and rural HHAs will likely experience residual payment increases under PDGM, as will HHAs with greater numbers of seriously ill, younger, and non-white patients. HHAs with higher process quality, but lower outcome quality, will similarly benefit from PDGM. Understanding how PDGM affects HHAs is crucial as policymakers seek ways to increase equitable access to safe and affordable non-facility-provided healthcare that provides appropriate levels of therapy, nursing, and other care.
Keywords
Introduction
Beginning January 1, 2020, Medicare implemented the Patient-Driven Groupings Model (PDGM) to reimburse home health agencies (HHAs). Previously, HHA reimbursement was based largely on the volume of therapy HHAs delivered. PDGM removes therapy volume from the payment formula and instead links payments directly to patients’ medical conditions. Moreover, PDGM changes the payment unit from 60-day episodes to 30-day episodes to help reduce costs and better align with the care typically provided. These changes for HHAs—mandated by the Bipartisan Budget Act of 2018 1 (the 2018 Act) and implemented by Centers for Medicare & Medicaid Services (CMS) 2 —follow analogous innovation in the payment model for skilled nursing facilities (SNFs), which began using the Patient-Driven Payment Model on October 1, 2019.
To link payments to patients’ medical conditions, PDGM determines case-mix adjustments based on 5 patient characteristics, each with multiple levels, that increase the number of Home Health Resource Groups from 153 under prior law to 432 under PDGM. Figure 1 summarizes how patients’ 30-day episodes are placed into subgroups for each of the 5 categories.3,4 First, initial admission referrals come from either institutional or community providers, while later episodes are generally community. Institutional referrals provide roughly 40% higher reimbursement than community referrals. For the second HHRG category, the first 30-day episode is considered early, while subsequent episodes are late, unless there is an intervening 60-day period of no home healthcare. Under PDGM, early episodes receive higher payments than later ones. Clinical grouping (category 3, with 12 levels) is determined by a patient’s principal diagnosis. Functional impairment (category 4, with 3 levels) is based on a patient’s ability to perform daily living activities. Comorbidities (category 5, with 3 levels) are based on a patient’s secondary diagnoses and can increase payments up to 20%.
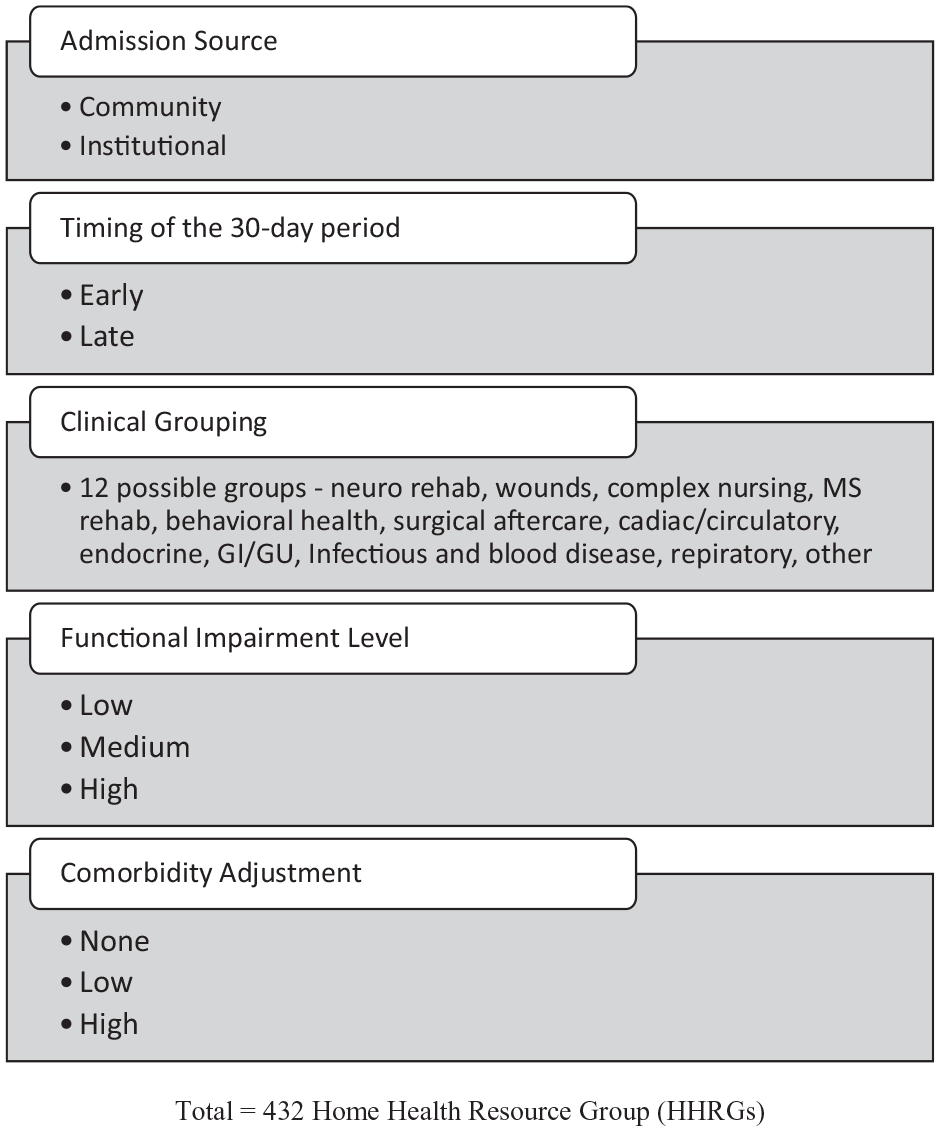
Summary of the Patient-Driven Groupings Model (PDGM) methodology for patient coding.
Section 51001(a)(2) of the 2018 Act anticipates that PDGM alters HHAs’ coding incentives, and directs CMS to modify reimbursement rates to account for HHAs’ likely “behavioral adjustments.” 1 It is expected that HHAs will (1) put the highest-paying diagnosis code as the principal diagnosis; (2) increase payments by submitting more claims with multiple comorbidities; and (3) add visits to avoid Low Utilization Payment Adjustments (LUPAs), which provide lower payments. The 2018 Act requires budget neutral HHA payment changes. Given HHAs’ expected “behavioral adjustments,” CMS reduced payments by 4.36% to maintain budget neutrality. For 2020, the 30-day payment amount is $1864.03, which is then case-mix adjusted.2,5 HHAs’ anticipated behavioral adjustments were a controversial feature of CMS’s revised Final Rule for PDGM in 2020. CMS assured commenters that such adjustments are commonplace, mandated by the 2018 Act, and do not imply that providers engage in unethical gaming behavior related to payment systems. 2
Examining how PDGM affects—generally and differentially—HHAs’ reimbursements is crucial for 3 reasons. First, in 2017, nearly 12,000 HHAs provided care to 3.4 million Medicare beneficiaries at a cost of $17.7 billion. 6 Going forward, home healthcare is expected to flourish, fueled by an aging population, increases in chronic conditions, and policymakers’ belief that home healthcare reduces costs and improves outcomes. 7 Increased reliance on home healthcare may also reduce utilization of SNFs, which have higher costs, lower patient satisfaction, and a 100 day Medicare limitation.8-10 Moreover, the COVID pandemic has elevated home healthcare as a preferred choice for mitigating disease transmission, and pursuant to COVID-related regulatory changes, nurse practitioners, clinical nurse specialists, and physician assistants can now all approve home health services.11,12
A second reason to examine PDGM’s effects is that healthcare provision is sensitive to the features of payment systems. For example, the 1983 transition to prospective payment systems (PPS) for inpatient care, with post-acute care payments remaining cost-based, contributed to an increase in Medicare HHA spending from $2 billion in 1987 to $17 billion in 1997. 13 Thereafter, Medicare curtailed HHA payments under a 3-year Interim Payment System (IPS), followed by a PPS that linked payments to therapy volume. Predictably, studies find reduced HHA utilization under IPS, followed by increases under therapy-based PPS.14-16 After 2000, PPS incentivized HHAs to provide multiple 60-day episodes and more therapy. Under this system, research shows that HHAs calibrated therapy delivery to optimize payments.17-20 HHA critics contend that over the last decade, PPS reimbursements have greatly exceeded costs, with freestanding HHAs earning margins of 16% in 2019. 6 Such concerns align with research that challenges the efficacy of HHA services, and with 1 study that estimated more than one-half of HHA Medicare payments are improper.9,21,22
A third reason to explore PDGM’s effects is Medicare’s status as a first-mover in healthcare. Healthcare services are highly influenced by payer source, 23 and Medicare is the largest payer in home healthcare (about 40%), with Medicaid contributing another 36% of 2017 home healthcare spending. 24 States’ Medicaid systems are also implementing payment models that focus on outcomes and quality rather than service volumes. Moreover, private insurance often follows CMS’s lead on payment initiatives. 25
We are not the first to examine PDGM’s financial effects, but we provide a unique, relevant, and timely assessment of how HHAs may be affected by PDGM. CMS’s Final Rule projects a 1.3% increase in aggregate HHA reimbursements. Using univariate analyses, which do not control for multiple HHA attributes likely to be associated with PDGM payments, CMS estimates how this increase will generally be distributed across HHAs with various attributes (e.g., freestanding vs. facility-based; urban vs. rural). 2 Our analyses differ from CMS’s in several important ways. First, we provide a multiple regression-based assessment of the independent associations between expected HHA payment changes and HHAs’ Nursing/Therapy quartiles, quality performance, and other attributes. Thus, we calibrate how HHA payments will likely be affected by what is arguably PDGM’s most important innovation—the uncoupling of therapy volume and reimbursements—while simultaneously controlling for other HHA attributes. Second, we examine the association of expected payment changes with several HHA attributes not previously examined by CMS—for example, the typical age, ethnicity, and acuity of patients. Third, we consider associations between HHA payment changes and 3 categories of HHA quality performance (i.e., process, outcome, and patient experience), thereby providing important evidence not reported in any prior studies. By examining these additional HHA attributes not previously studied, our findings provide evidence on the possible implications of PDGM for health equity and quality.
Other HHA stakeholders also provide projections of PDGM’s impact. In recommending HHA payment reductions for 2021, the Medicare Payment Advisory Commission projected average HHA margins of 17% under PDGM in 2020. 26 The Center for Medicare Advocacy disputes the notion that PDGM is a “patient-driven” system, and expects several deleterious consequences of PDGM—for example, those with chronic conditions, severe functional impairments, and comorbidities will be ill-served, access will decline, and therapy will be under-provided. 27 CMS’s PDGM Final Rule for 2020 was favorably received by the National Association For Home Care & Hospice, which nevertheless voiced concerns regarding the potential for errors and the self-fulfilling nature of the Final Rule’s behavioral assumptions. 28 The American Speech-Language-Hearing Association predicted that PDGM may cause front-loading of therapy, retention of patients for unnecessary episodes of care, and an inclination to favor institutional referrals over community referrals. 29 Finally, Dobson DaVanzo & Associates’ analyses of Medicare claims in the first 4 months of 2020 concluded that average home health payments under PDGM are 6% lower than projected, primarily because CMS’s projected “behavioral adjustments” have not materialized. Coupled with a COVID-related shortfall in case volume, total payments in the 4 months have been 21.6% lower than projected. 30
Methods
Data Sources and General Empirical Approach
We use 3 CMS datasets: PDGM Agency-Level Impacts File; Medicare HHA Utilization and Payment Public Use File (PUF) for 2016 (the most recent year available at the time of the study); and Home Health Compare (HHC) quality measures for 2017. 31 The Impacts File uses claims with episodes ending in 2017, and shows the impact that PDGM would have had on HHAs’ number of episodes and Medicare reimbursements. Specifically, it shows a HHA’s actual Medicare reimbursement versus the reimbursement that would have been paid under PDGM, and the actual number of 60-day episodes versus the number of 30-day episodes under PDGM. The file also ranks HHAs into quartiles based on their ratio of Nursing/Therapy visits, with a higher quartile indicating more nursing visits relative to therapy visits. The file also provides HHA descriptive variables, including ownership, urban/rural, facility type, and census division. The PUF includes data on HHAs’ services provided to Medicare beneficiaries, and agency-level data on patient chronic conditions and demographics. Files were merged using HHAs’ CMS certification numbers.
HHC’s process quality measures describe performance on evidence-based processes of care focusing on high-risk or problem-prone areas (e.g., timeliness of immunizations). Outcome of care measures provide evidence on areas such as patient improvement, and are generally risk-adjusted. Finally, HHAs’ patient experience of care measures are survey-based patient (or patient family) feedback on topics for which the patient is the best source of information. There are 7 process measures, 11 outcome measures, and 5 patient experience measures. For each category, we average individual measures, reverse coding measures as necessary.
We first regress HHAs’ Nursing/Therapy quartiles on their other attributes, patient characteristics, and quality measures. Given the dependent variable’s categorical nature (i.e., quartiles), we use ordered logistic regression. Because PDGM deemphasizes therapy in determining payments, a HHA’s Nursing/Therapy ratio is likely the strongest determinant of how its payments will be affected by the PDGM system. Hence, this analysis reveals the attributes of HHAs that are expected to fare either well or poorly under PDGM. Next, we use ordinary least squares regression to regress HHAs’ expected percentage changes in Medicare payments on their Nursing/Therapy quartiles, other attributes, patient characteristics, and quality measures. Given PDGM’s key purpose, we expect a strong positive association between payment changes and Nursing/Therapy quartiles. This analysis also allows us to identify significant independent associations between reimbursement changes and HHA attributes, after controlling for HHAs’ Nursing/Therapy quartiles. All data analyses are conducted with SAS Version 9.4.
Variables
We examine 2 dependent variables taken from CMS’s Impacts file: (1) HHAs’ pre-PDGM Nursing/Therapy quartiles, and (2) HHAs’ expected percentage changes in reimbursements under PDGM. We examine the associations of these dependent variables with 3 categories of independent variables: (1) HHA characteristics, including ownership form (government, not-for-profit, for-profit), location (urban, rural), facility type (freestanding, facility-based), census division (Northeast, Midwest, South, West), and volume—a measure of agency size (log of the number of 60-day episodes); (2) HHA-level patient attributes, including average patient acuity (using the average hierarchical condition category [HCC] score), percentage of dual-eligible patients (i.e., eligible for both Medicare and Medicaid), average patient age, and percentage of black or Hispanic patients; and (3) HHA quality measures relating to HHAs’ process of care, outcome of care, and patient experience of care, as described above.
Sample
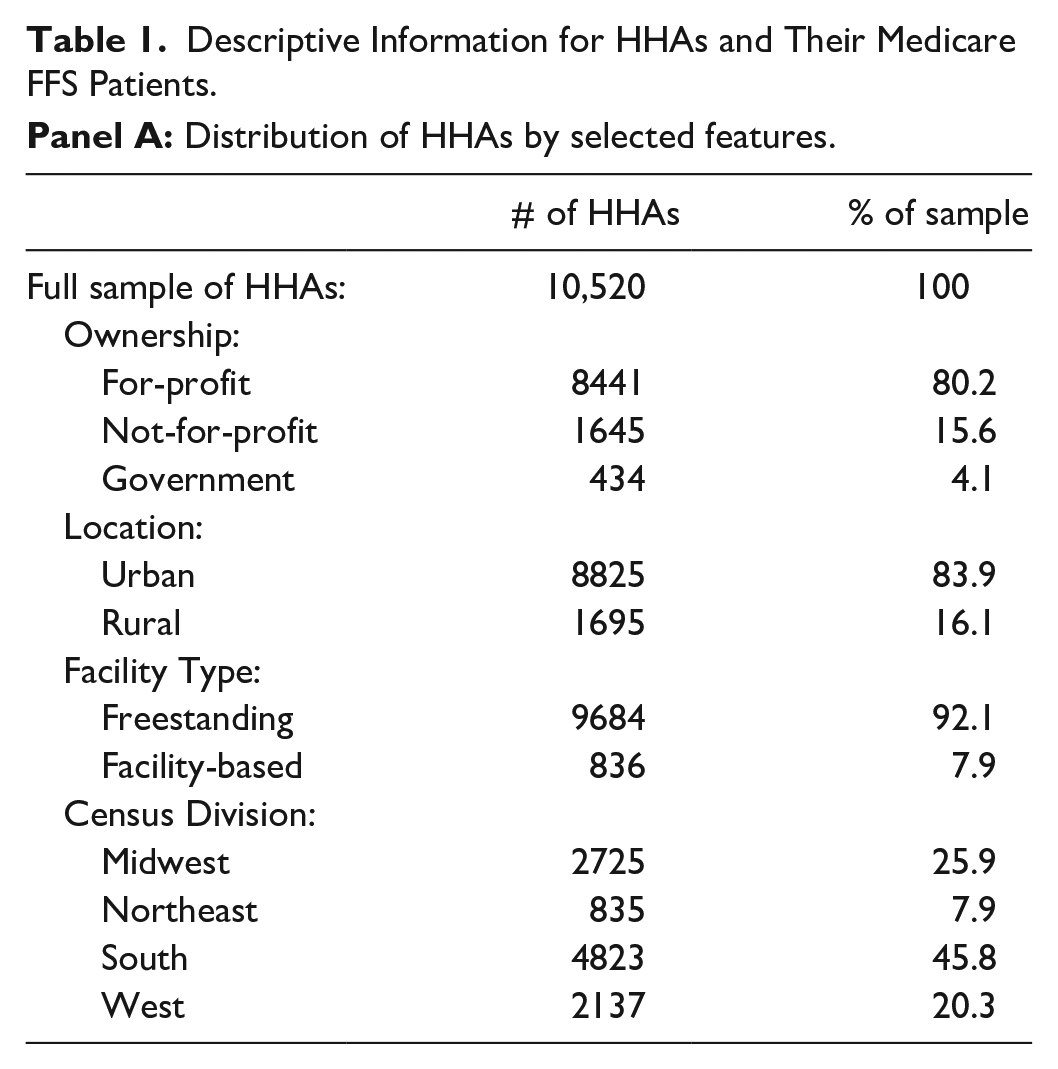
The upper portion of Table 1 (i.e., Panel A) describes the full sample of 10,520 HHAs for 2019. Most HHAs are for-profit (80%), urban (84%), and freestanding (92%). The largest number of HHAs are in the South (46%); the fewest are in the Northeast (8%).
Descriptive Information for HHAs and Their Medicare FFS Patients.
Panel B describes patient characteristics and HHA quality. Patient information is available for 9670 HHAs; quality measures are available for 7580 HHAs. On average, HHAs serve 356 Medicare beneficiaries; average patient age is 76. Patients are predominately white (62%) and female (55%), and 32% are dual-eligible. The average HCC score is 2.32. The HCC score is used to predict how patient spending will compare to average spending for the Medicare population (the population average is set at 1.08).
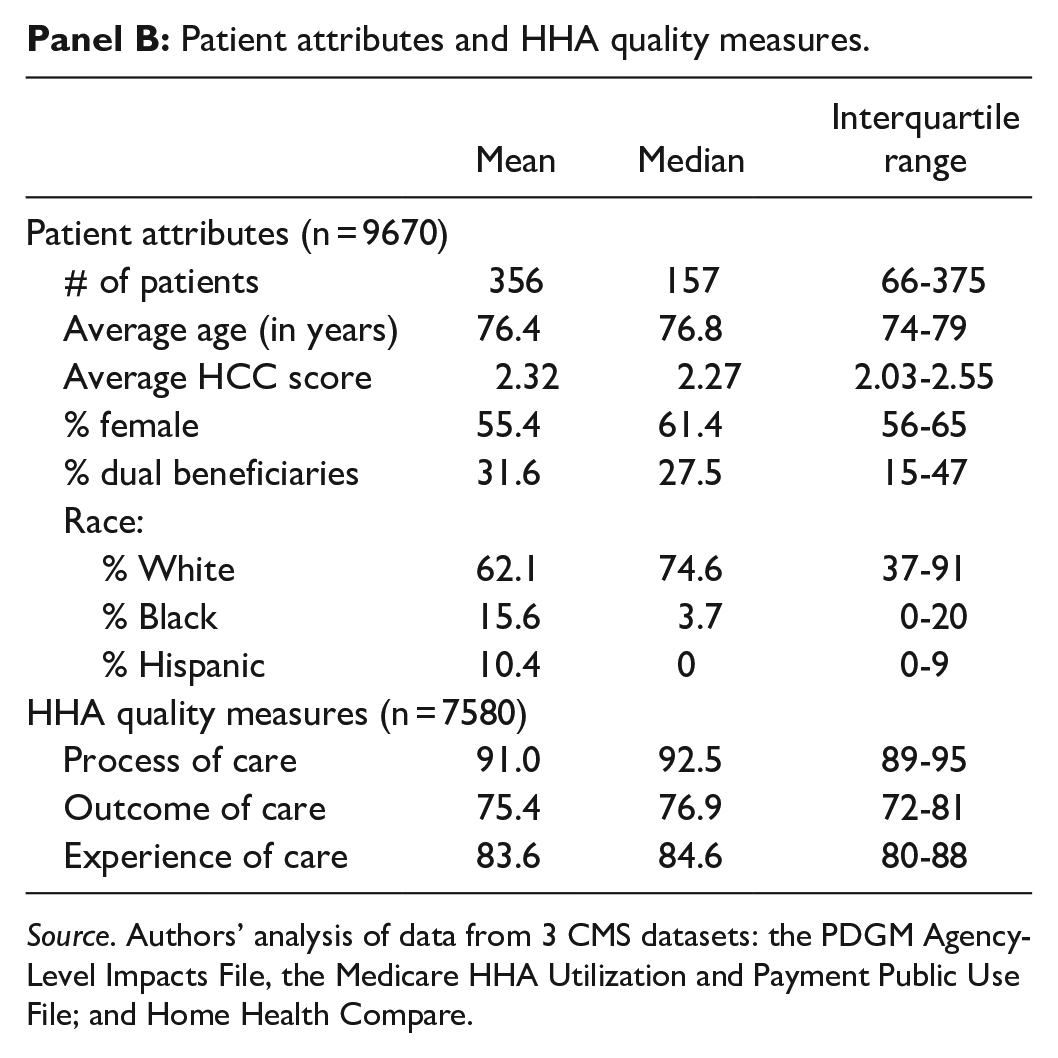
Source. Authors’ analysis of data from 3 CMS datasets: the PDGM Agency-Level Impacts File, the Medicare HHA Utilization and Payment Public Use File; and Home Health Compare.
The last 3 rows present information on quality. Process and outcome measures are frequencies, and are not equally controllable by HHAs. Experience-of-care is patient survey-based. HHAs rate most highly on process quality, executing on important tasks for over 90% of patients. Outcome scores are lowest, with a typical HHA achieving desired outcomes for about 75% of patients. The typical HHA achieves an average score of 84% across 5 patient-experience measures.
Results
Analysis of Prior PPS Payments Versus PDGM Payments, by Nursing/Therapy Quartile
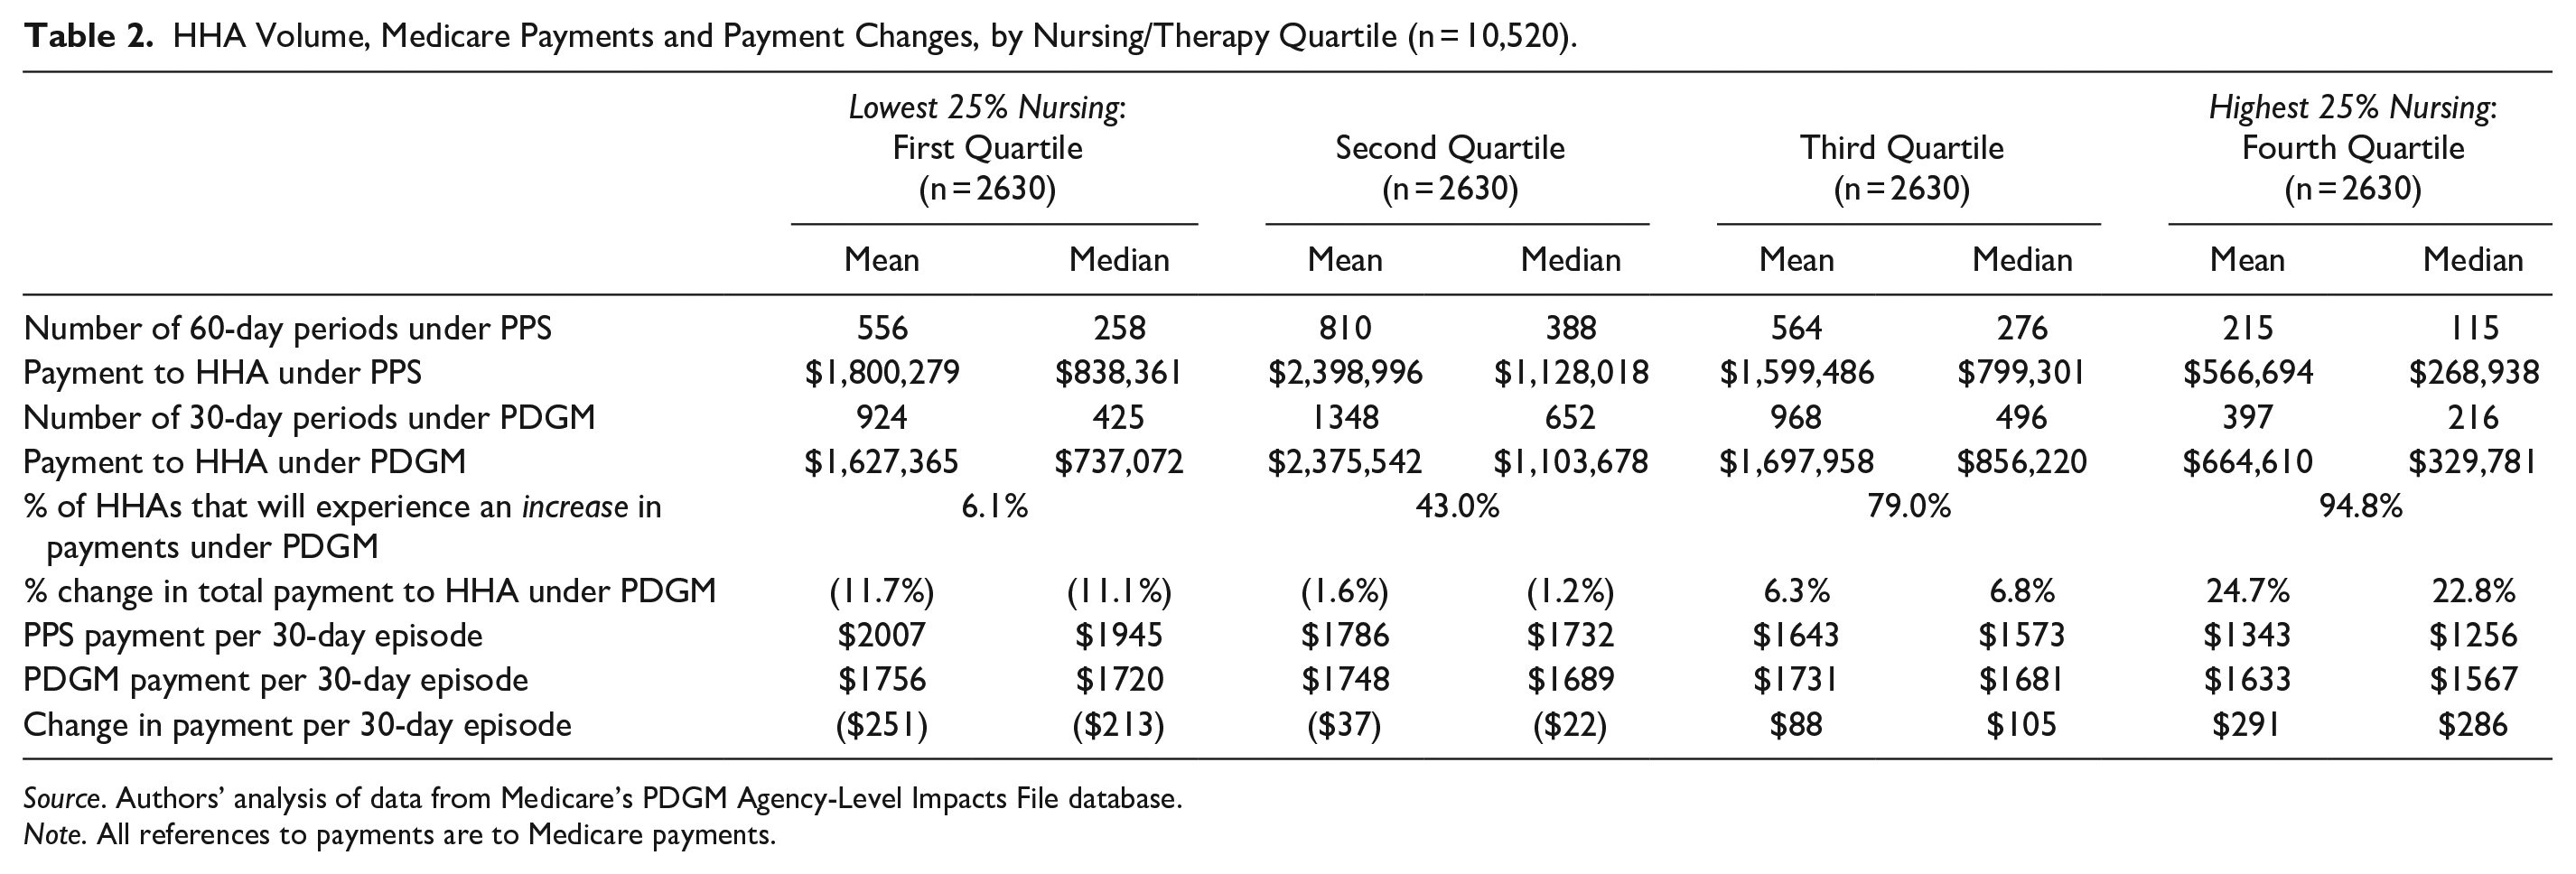
We first summarize how HHAs’ expected reimbursements will generally be affected by the transition from the prior PPS model to PDGM, with particular attention to their pre-PDGM therapy intensities, or Nursing/Therapy ratios. Table 2 provides information, by Nursing/Therapy quartile, on patient episodes and Medicare payments under the prior PPS model (hereafter, PPS) and PDGM. On average, HHAs in lower quartiles are larger than HHAs in higher quartiles. Mean 60-day episodes for HHAs in the bottom 2 quartiles are 556 and 810, compared with 564 and 215 episodes for the top 2 quartiles. The greater volume (agency size) for lower quartiles translates into larger Medicare payments. Under PPS, payments to HHAs in the bottom 2 quartiles average $1.8 million and $2.4 million, compared with $1.6 million and $0.6 million for the top 2 quartiles.
HHA Volume, Medicare Payments and Payment Changes, by Nursing/Therapy Quartile (n = 10,520).
Source. Authors’ analysis of data from Medicare’s PDGM Agency-Level Impacts File database.
Note. All references to payments are to Medicare payments.
The next 2 rows provide analogous forecasted information under PDGM. With patient episodes measured in 30-day periods, the number of episodes necessarily increases. Although payments in the bottom 2 quartiles decrease under PDGM, and increase in the top 2 quartiles, total payments remain larger (on average) for the bottom 2 quartiles.
The next 2 rows summarize how payments are predicted to change under PDGM. By design, PDGM is detrimental to therapy-intensive HHAs (i.e., HHAs in lower Nursing/Therapy quartiles). About 94% of HHAs in the bottom quartile will see lower Medicare payments under PDGM, with an average decrease of 11.7%. Under PDGM, 57% of HHAs in the second quartile will see lower payments, although the average decrease will be small (less than 2%). In contrast, 79% of HHAs in the third Nursing/Therapy quartile, and 95% in the top quartile, will enjoy higher payments under PDGM. On average, payments will increase 6% to 7% for HHAs in the third quartile, while HHAs in the top quartile will see increases of almost 25%.
The last 3 rows of Table 2 present HHA payments, and expected changes in payments, on a per-episode basis. Overall, consistent with CMS’s intent, Table 2 shows that predicted changes in HHAs’ Medicare payments under PDGM are highly associated with their Nursing/Therapy quartiles.
Regression Analysis
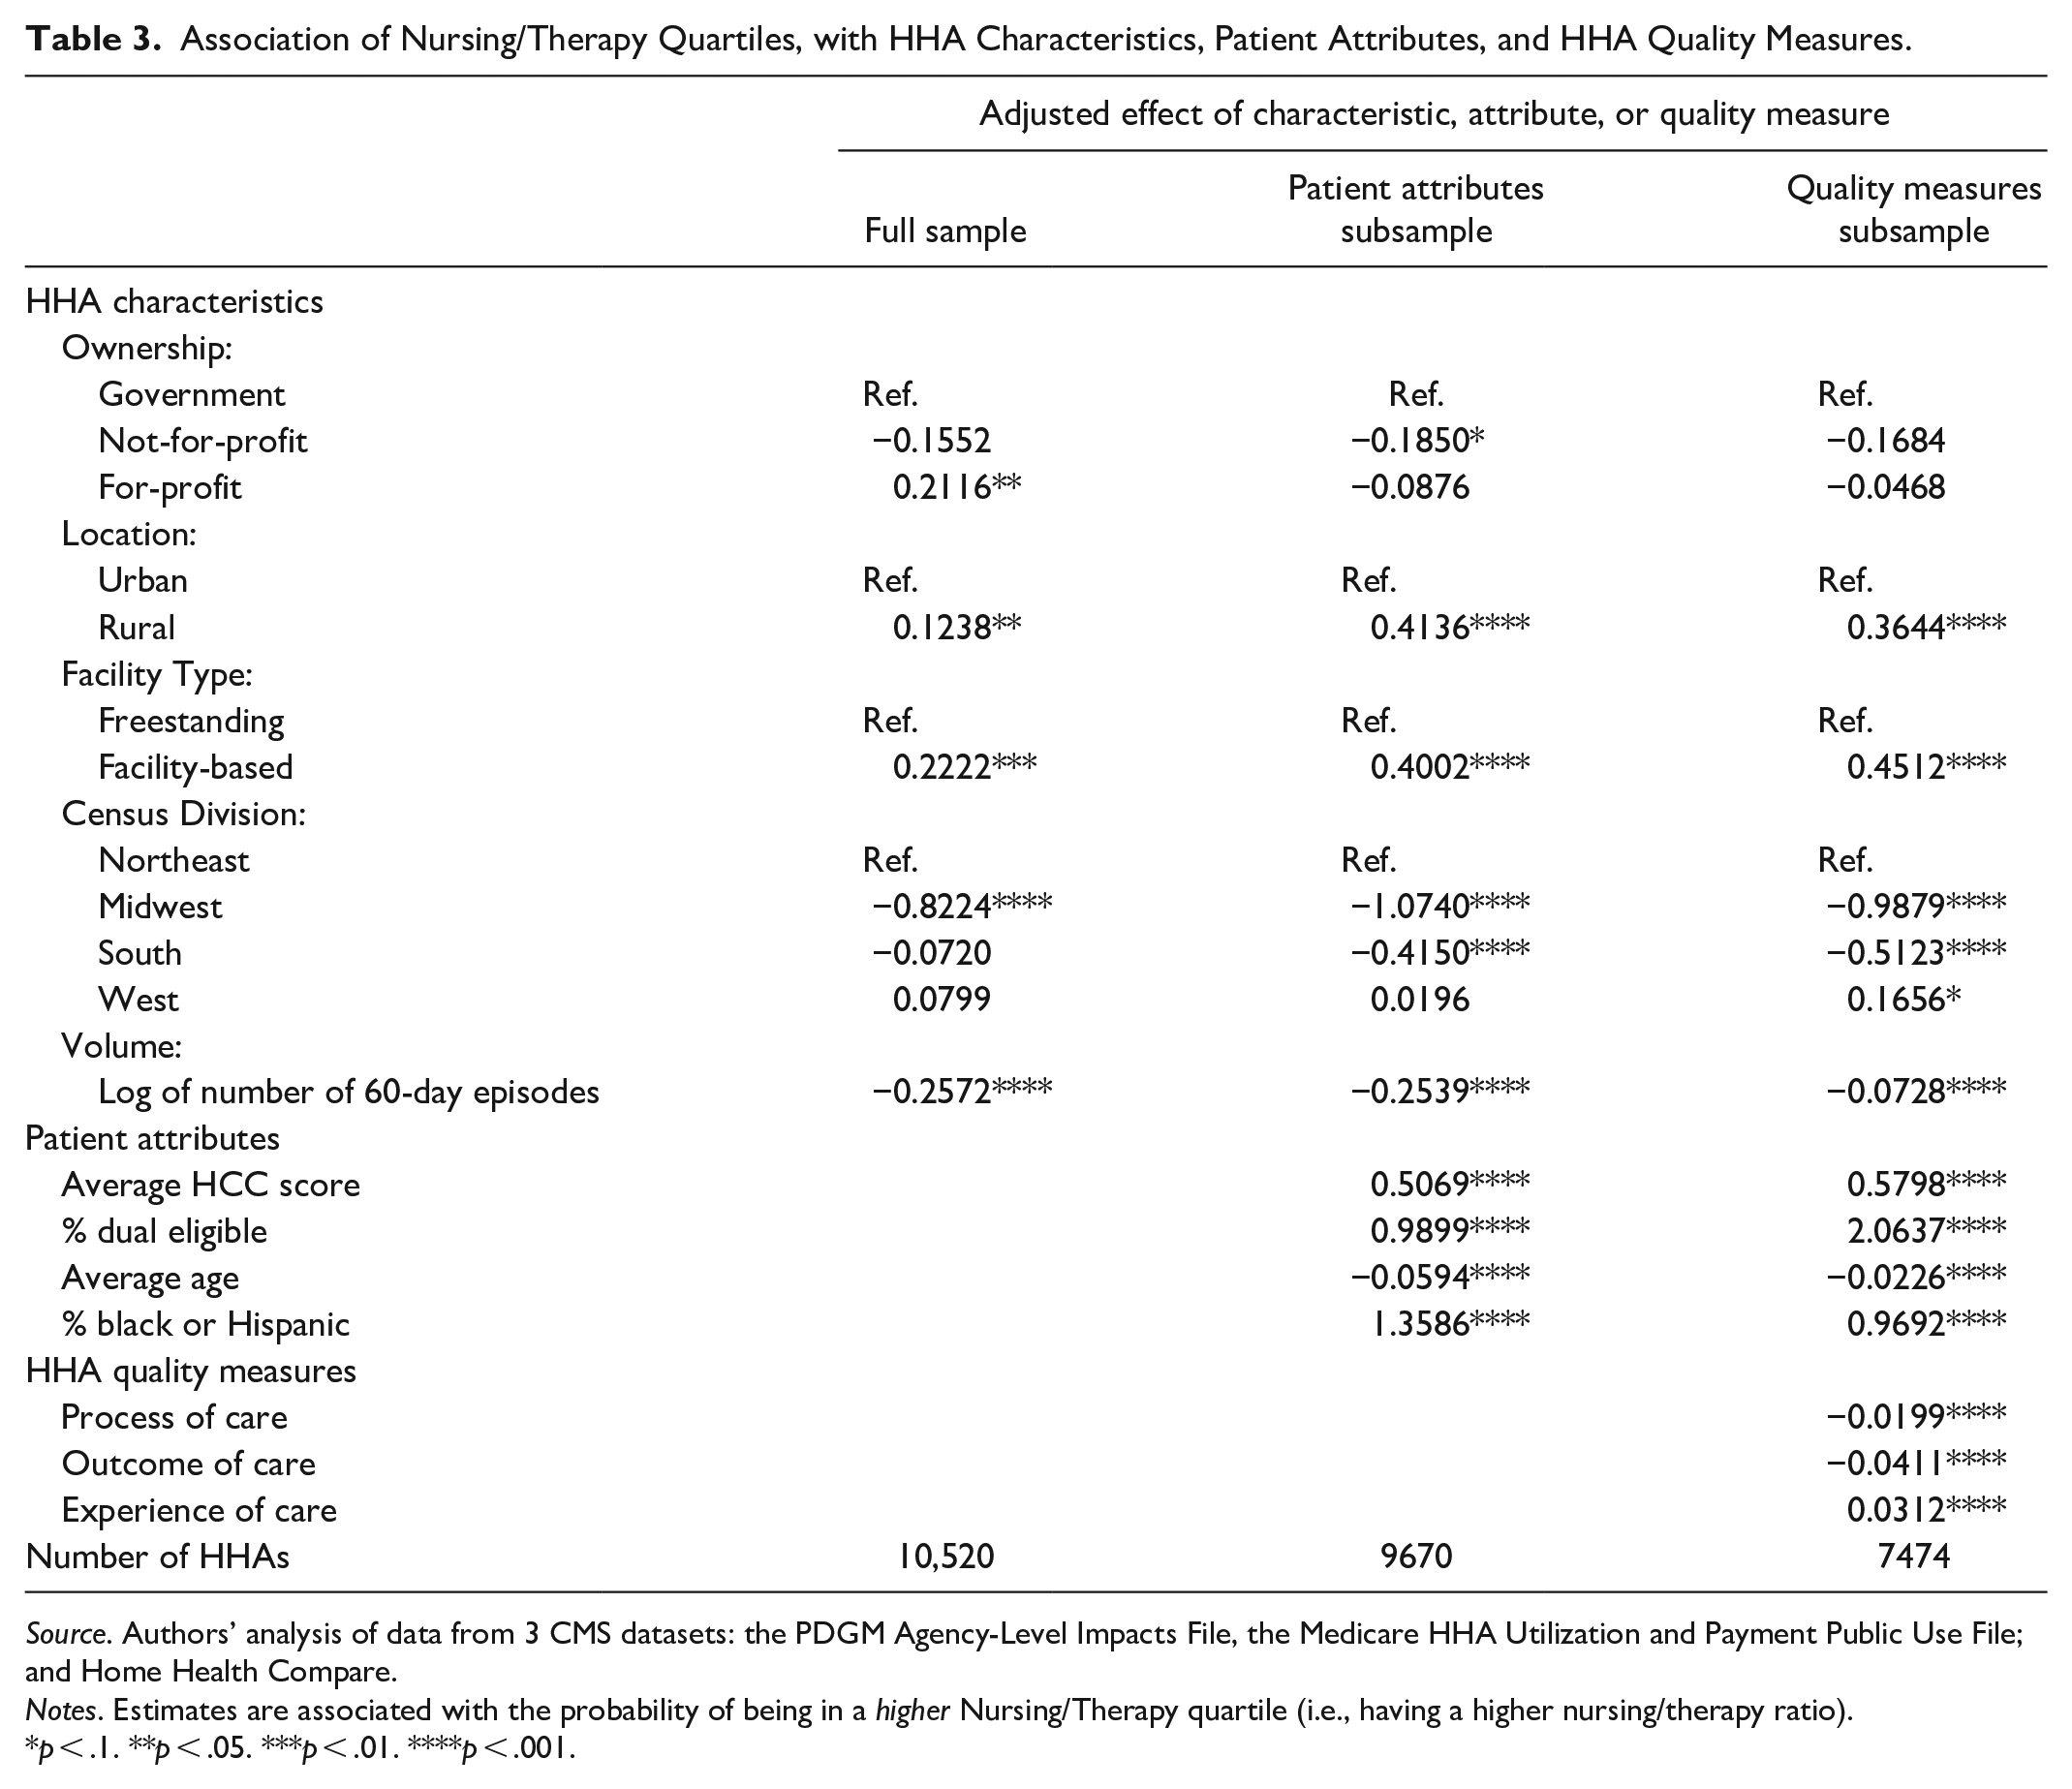
We next examine associations between HHAs’ Nursing/Therapy quartiles and their agency-level characteristics, average patient attributes, and average quality measures. Because not all HHAs have the data necessary to estimate the full model, we estimate abbreviated models using HHAs having the required data. The first column of Table 3 presents results for the full sample; the middle column presents results with patient attributes added; the last column presents results with all variables included. A negative coefficient indicates a variable is associated with a lower Nursing/Therapy quartile (i.e., relatively more therapy visits), which, all else equal, should lead to larger percentage decreases (or smaller increases) in payments under PDGM.
Association of Nursing/Therapy Quartiles, with HHA Characteristics, Patient Attributes, and HHA Quality Measures.
Source. Authors’ analysis of data from 3 CMS datasets: the PDGM Agency-Level Impacts File, the Medicare HHA Utilization and Payment Public Use File; and Home Health Compare.
Notes. Estimates are associated with the probability of being in a higher Nursing/Therapy quartile (i.e., having a higher nursing/therapy ratio).
p < .1. **p < .05. ***p < .01. ****p < .001.
Results are consistent across the full and abbreviated models, so we discuss the full model results only (i.e., the last column of Table 3). Nursing/Therapy ratios are significantly higher for rural HHAs than urban HHAs, and, compared with freestanding HHAs, facility-based HHAs have higher Nursing/Therapy ratios (p < .001 for both results). Thus, given the features of PDGM, rural and facility-based HHAs might be expected to fare relatively well under the new payment system. HHAs in the Midwest and South have lower Nursing/Therapy ratios compared with HHAs in the Northeast and West (p < .001 for the comparisons of Midwest and South to Northeast). Results also show that HHA size (proxied by the log of number of 60-day episodes) is negatively associated with Nursing/Therapy quartile (p < .001). Nursing/Therapy quartiles are higher when patient populations are sicker (average HCC score), dual-eligible, younger, and non-white (p < .001 for all 4 associations). For only 1 of the 3 quality measures—experience of care—are higher Nursing/Therapy ratios associated with higher quality. For outcome and process measures, results suggest that higher Nursing/Therapy ratios are associated with lower quality (p < .001 for all 3 associations).
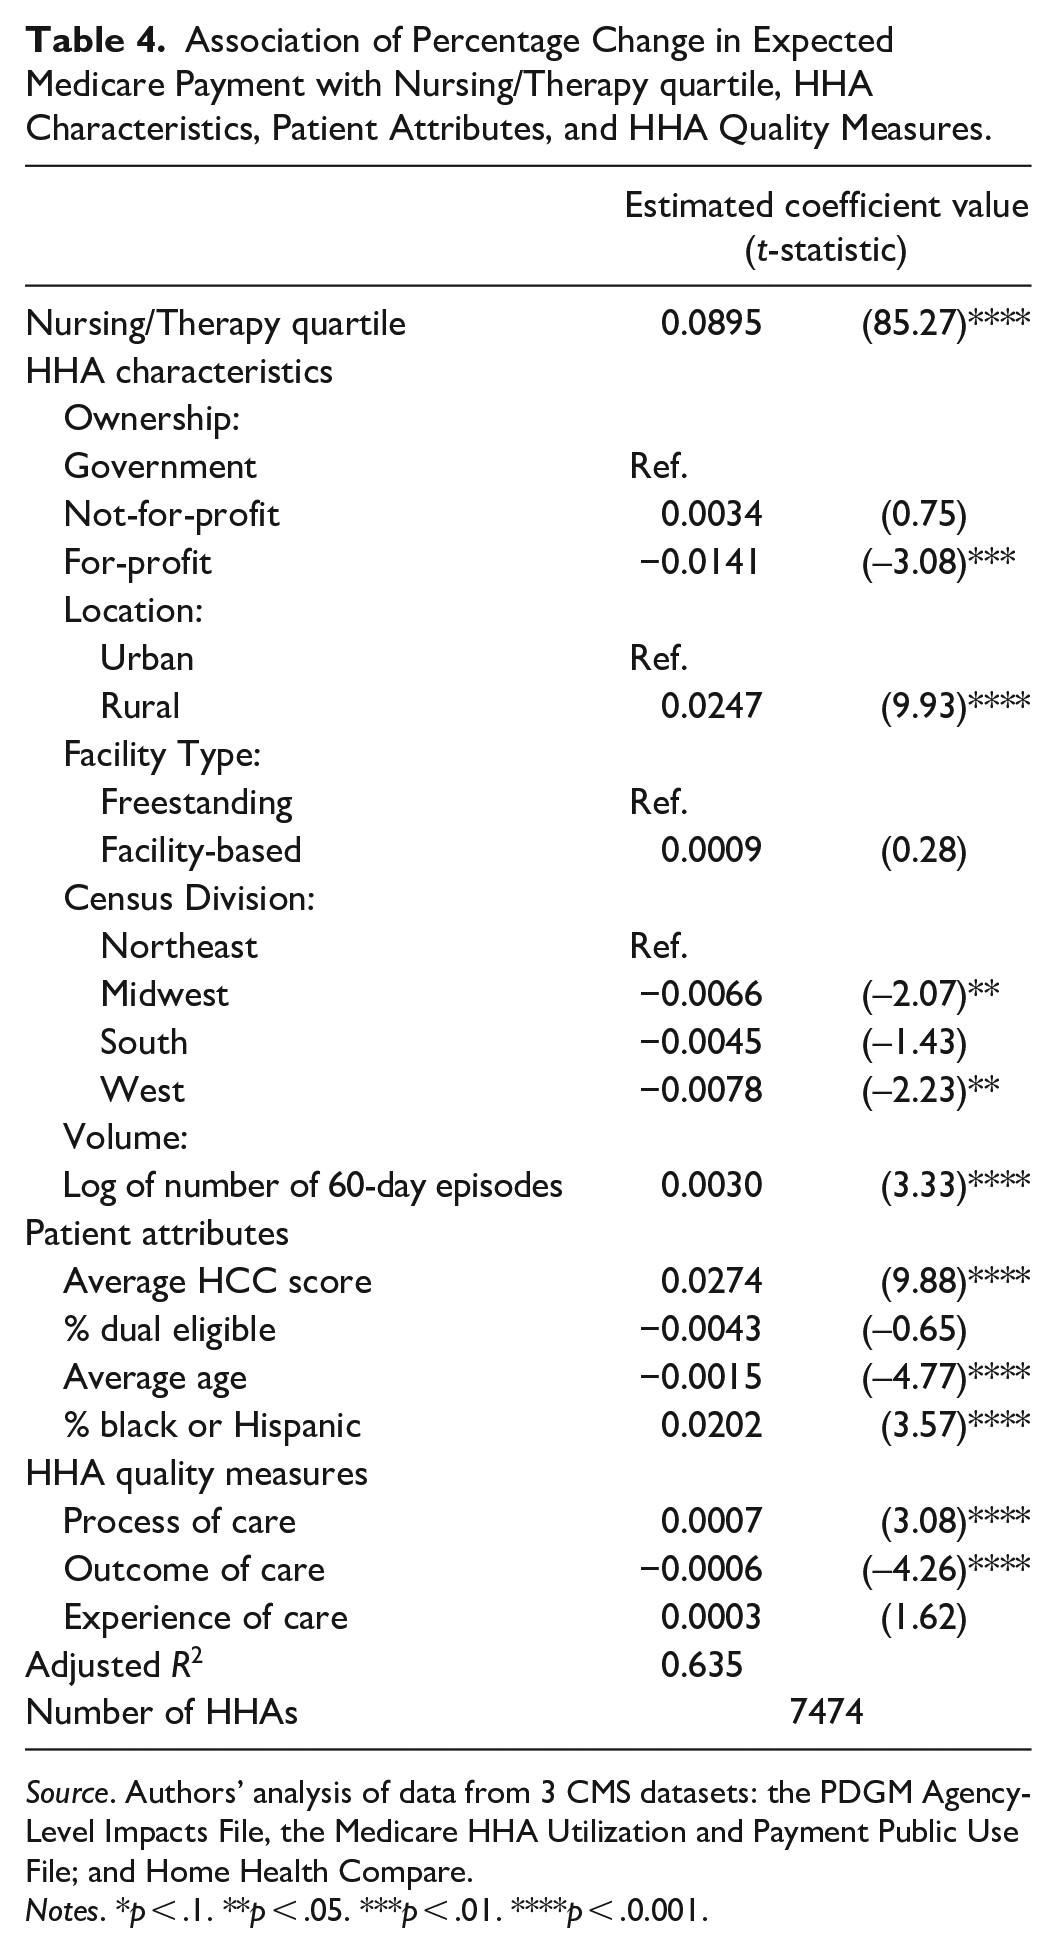
Next, we regress percentage changes in Medicare payments on Nursing/Therapy quartiles and all covariates included in Table 3. Given CMS’s intention to dis-incentivize therapy, we expect a positive coefficient on Nursing/Therapy quartile. Results (Table 4) are consistent with this prediction and indicate the coefficient on Nursing/Therapy quartile is highly significant (t = 85.27; p < .001). In untabulated results that likewise demonstrate the impact of therapy’s removal from the payment formula, we find that dropping Nursing/Therapy quartile from the model reduces its Adjusted R2 from 63.5% to 20.3%.
Association of Percentage Change in Expected Medicare Payment with Nursing/Therapy quartile, HHA Characteristics, Patient Attributes, and HHA Quality Measures.
Source. Authors’ analysis of data from 3 CMS datasets: the PDGM Agency-Level Impacts File, the Medicare HHA Utilization and Payment Public Use File; and Home Health Compare.
Notes. *p < .1. **p < .05. ***p < .01. ****p < .0.001.
The Table 4 results suggest that variation in Nursing/Therapy quartiles largely explains variation in payment changes. But other variables are significant and suggest that certain HHA attributes are independently associated with expected payment changes under PDGM. Rural, compared with Urban, is more highly associated with percentage change in payments (p < .001). The results show that facility type and census division play relatively modest independent roles in payment changes, while the coefficient for HHA volume is significant at p < .001. Among patient attributes, average HCC score, average age, and % black or Hispanic are all significantly associated with payment changes at p < .001. Finally, after controlling for Nursing/Therapy quartiles, expected payment changes are positively associated with process quality, but negatively associated with outcome quality (p < .001 in both cases).
Limitations
The Impacts File has 2 features that affect our analyses. First, while it assumes a HHA’s population remains constant, HHAs may respond to PDGM by substituting nursing-focused patients for therapy-focused patients, or non-therapy services for therapy services. Second, CMS ignores PPS episodes which lack a primary diagnosis acceptable under PDGM, because CMS lacks the information needed to re-code such episodes. Two features of the quality data are noteworthy. First, while the Impacts File data reflect Medicare fee-for-service beneficiaries, the experience of care data reflect patients who completed a survey. Second, HHAs must have at least 20 eligible patients to have a quality measure reported, so small HHAs are un-represented. Our analyses do not incorporate the impact of any behavioral adjustments HHAs may make. Also, our empirical approach required that we use 2 files with 2017 data measures, and 1 file with 2016 measures. Finally, we do not have access to individual patient data, and must instead use HHA-level measures of average patient demographic and medical information.
Discussion and Conclusions
We show that—as intended—PDGM deemphasizes therapy’s role in determining Medicare payments. The Table 4 results indicate that, all else equal, changing a HHA’s Nursing/Therapy quartile by 1 causes a directionally-equivalent, 9 percentage point change in its expected Medicare payments under PDGM.
Table 3’s full model results indicate that ownership status has no significant association with Nursing/Therapy quartile, yet Table 4 suggests that for-profit HHAs, compared with Government and not-for-profit HHAs, might expect relatively lower payment changes under PDGM. Compared with urban HHAs, rural HHAs’ expected payments increase 2.5 percentage points under PDGM (Table 4), in addition to a likely payment increase arising from their relatively high Nursing/Therapy ratios (Table 3). The results in Tables 3 and 4 suggest that the lion’s share of facility type- and census division-related payment effects are not independent, but instead arise from freestanding, Midwestern, and Southern HHAs’ relatively low Nursing/Therapy ratios. High-volume HHAs’ tendency to have lower Nursing/Therapy ratios (Table 3) portends lower payments under PDGM, while the Table 4 results show a positive independent effect of patient volume on payment changes. In contrast, the results in Tables 3 and 4 suggest that HHAs with sicker, younger, and larger black or Hispanic populations will enjoy payment increases related to both high Nursing/Therapy ratios and independent effects. For example, beyond the positive payment effects related to their relatively high Nursing/Therapy ratios (Table 3), HHAs at the 75th percentile of HCC (2.55 from Table 1), compared with HHAs at the 25th percentile of HCC (2.03) might expect additional payment increases of approximately 1.4 percentage points (i.e., [2.55 − 2.03] × 0.0274). Whether these payment changes related to HHAs’ non-therapy attributes conform to CMS’s intentions is unclear. The independent effects of HCC may be particularly important, given CMS’s concerns regarding HHAs’ incentives to be aggressive in coding patients.
Table 3 indicates that outcome and process measures are higher for HHAs with lower Nursing/Therapy ratios. This suggests that, under PDGM, these HHAs are likely to see payment decreases. After controlling for Nursing/Therapy quartiles, Table 4 shows that process measures are positively related to expected payment changes, while outcome measures continue to be negatively associated with payment changes. This suggests that HHAs with higher outcome measures are likely to be negatively affected by PDGM, due to both their relatively low Nursing/Therapy ratios and the negative independent association of outcome measures with expected payment changes. The association of process measures with expected payment changes is more ambiguous. While HHAs with higher process measures may experience lower reimbursements due to their lower Nursing/Therapy ratios (Table 3), the independent association (Table 4) suggests that expected payment changes are higher for HHAs with higher process of care scores.
A negative relation between expected payment changes and outcome and process of care measures contradicts CMS’s push to incentivize value-based healthcare. In particular, outcome measures reflect the results of care, and therapy-focused HHAs produce better outcomes (Table 3). While nursing may drive patient satisfaction (note the positive coefficient on experience of care in Table 3), therapy may drive clinically important outcomes. Yet, Table 4 indicates that, under PDGM, HHAs with higher outcomes of care will receive incrementally lower payments, on top of a likely reduction in payments arising from their relatively low Nursing/Therapy ratios, as indicated in Table 3.
It is unclear why therapy-focused HHAs have better process-of-care, which measures the frequencies with which HHAs provide recommended care. It is possible that therapists perform process-of-care tasks, leading to therapy-focused HHAs’ higher performance on process quality. Future research could assess whether PDGM’s penalization of high-therapy HHAs negatively impacts process quality.
It is noteworthy that PDGM makes no progress toward using bundled payments to improve healthcare.32-36 Diverse patient expectations in post-acute settings make payment bundling challenging. Inpatient rehabilitation serves patients who desire to get well and go home. Long-term care hospitals, SNFs, and HHAs serve some patients who likewise aspire to self-care, but many others with low prospects for self-care due to chronic illness or advanced age. Post-acute care’s payment systems are generally un-bundled, with some (e.g., SNFs) featuring per diem reimbursement and others (e.g., HHAs) using per-episode reimbursement. Rather than segmenting post-acute care providers, future payment system innovations might benefit from segmenting post-acute patients based on their prospects for self-care. Such segmentation and greater payment system integration would reduce cases in which nuances of independent payment systems, rather than clinical factors, drive care choices.10,37 For HHAs, therapy would not be dis-incentivized at the system and agency levels. Instead, the expected patient-level benefits of therapy—including cost savings from preventing transfers to costlier clinical settings—would be compared with therapy costs, and sound, patient-level choices on therapy could be made. Although some healthcare leaders saw momentum in early 2020 for a unified payment model for post-acute care, the pandemic’s effects on these discussions is unclear. 38
Policymakers look to home-based healthcare as a cost-saving alternative to institutional care. Yet, home healthcare faces uncertainty due to payment and other policy changes. These changes may prompt consolidation via closings, mergers, and acquisitions. PDGM will affect this consolidation, as will CMS’s plan to phase out Requests for Anticipated Payments (RAPs) in 2020 and 2021, which portends difficulties for smaller, cash-constrained HHAs. Evolving financial circumstances compound HHAs’ operational challenges in navigating COVID. Future studies should examine whether PDGM accomplished CMS’s goals, and how HHAs fared in navigating the challenges presented by their new environment.
Footnotes
Declaration of Conflicting Interests
The author(s) declared no potential conflicts of interest with respect to the research, authorship, and/or publication of this article.
Funding
The author(s) received no financial support for the research, authorship, and/or publication of this article.