






Abstract
Introduction
The assessment of psychopathology in children and adolescents is particularly susceptible to cultural influences, as adults’ perception and expectations will affect how children’s behaviors are evaluated and reported. Before adopting parent-informant and teacher-informant instruments that have been developed in cultures different from where they are to be used, their applicability will need to be revisited.
Among the many rating scales for the assessment of ADHD in children and adolescents, very few have been validated for Chinese populations. In the late 1980s, Luk, Leung, and Lee (1988) and Luk and Leung (1989) examined the Chinese version of Conners’ Teacher Rating Scale (CTRS) by administering it to children in Hong Kong and found satisfactory reliabilities and validities. More recently, Gau, Soong, Chiu, and Tsai (2006), Gau et al. (2008), and Gau et al. (2009) studied the Revised Short Form of the Parents and Teachers Conners’ Rating Scale and the Swanson, Nolan and Pelham–IV (SNAP-IV) scale among Chinese schoolchildren in Taiwan, and found them to be reliable and valid. Among the behavioral screening instruments that have ADHD as a subscale, Leung et al. (2006) reported on the Chinese version of the Child Behavior Checklist (CBCL; Achenbach, 1991a) and Teacher Report Form (TRF; Achenbach, 1991b), and Lai et al. (2010) examined the Strengths and Difficulties Questionnaire (SDQ; Goodman, 2001). All have satisfactory reliabilities and validities.
Despite the sound psychometric properties of these instruments when applied to Chinese populations, there is a trend among studies carried out in Hong Kong that normative scores are significantly higher than that from the West. Luk et al.’s (1988) study on the CTRS is one such example. Ho et al. (1996), using the parents and teachers Rutter’s questionnaires on more than 3,000 seven-year-old children in Hong Kong, found that Chinese boys had nearly twice the level of questionnaire-rated hyperactivity as compared with the West. In 2010, Lai et al.’s (2010) psychometric study of the SDQ also found normative scores to be significantly and pervasively elevated. Yet, there is no evidence to suggest that the prevalence of disorders are raised, so suggesting that Hong Kong Chinese parents and teachers may be more prone to endorse the presence of problematic behaviors (Leung et al., 2006; Leung et al., 2008). It is likely that by cultural values, Chinese parents and teachers are less permissive than their Western counterparts. Instead, they are more demanding; they emphasize and expect discipline and social order. Inevitably, they have less tolerance for problematic behaviors, which is reflected in ratings in parent-informant and teacher-informant questionnaires (Canino & Alegria, 2008). This highlights the need to reestablish normative data that are relevant to the countries where the questionnaires are to be used.
It is also possible that the design of the questionnaires can influence how ratings are given. Many of the commonly used behavioral rating scales are worded to focus on the presence and/or frequency of problem behaviors. The Chinese collectivistic culture’s emphasis on social harmony has low tolerance of nonconforming behaviors, so that behaviors that are at odds with society’s expectations are considered problematic (Wong & Choi, 1999). Raters’ interpretation of the meaning behind the different response categories, such as frequencies, may similarly be affected (Pace & Friedlander, 1982). Thus, the questionnaires’ emphasis on problems may have inadvertently contributed to the elevated scores given by Hong Kong Chinese parents and teachers. Another potential problem with these questionnaires, as pointed out by Swanson et al. (2005), is that ratings run the risk of being skewed, with a tail toward psychopathology. With statistical analyses that assume a normal data distribution, the skewness may contribute to erroneous results. The use of statistical cutoffs, for example, may lead to over- or underidentification of cases. As attention skills and activity levels are now thought to lie on their respective continuum and ADHD represents the most negative end of this continuum (Levy, Hay, McStephen, Wood, & Waldman, 1997), questionnaires that are designed to capture the severity of pathology have not been written to classify among the nonpathological group those whose attention skills lie on the very positive end of this continuum. This may be a problem for genetic research, when linkage and association studies need to identify extreme discordant pairs.
In his study using the SNAP-IV scale, which is a Diagnostic and Statistical Manual of Mental Disorders (4th ed.; DSM-IV; American Psychiatric Association, 1994)–based rating scale with 18 ADHD items and 8 oppositional items that asks for ratings on symptom severity, Swanson et al. (2005) found that using a statistical cutoff of mean + 1.65 SD identified 1.7 times more participants than the expected 5%. He concluded that this “over-identification is related to reduced variance of summary score in the population” (p. 8). To overcome these flaws, Swanson et al. modified the SNAP-IV to become the Strengths and Weaknesses of ADHD-Symptoms and Normal-Behaviors (SWAN) rating scale. The 18 ADHD items of the SNAP-IV were rephrased into neutral or positive statements, and the 4-point rating was extended into a 7-point scale with an anchor on average behaviors. Scores range from −3 (far above normal) to +3 (far below normal), with 0 denoting average behavior. Informants are asked to compare the index child’s behavior against that of other children of the same age. These changes result in ratings that are normally distributed. Using statistical cutoffs of 1.65 SD above the mean, the SWAN identified 4% of the population, a figure that is much closer to the expected 5% prevalence estimated globally (Polanczyk, de Lima, Horta, Biederman, & Rohde, 2007). Factor analysis identified two factors that exactly matched the DSM-IV diagnostic criteria. A subsequent study of the French version of the scale by Robaey, Amre, Schachar, and Simard (2007) found it to have good internal consistency (Cronbach’s α > .8), validity (area under ROC curve [AUC] = 0.89), and optimal sensitivity (SE) of 0.86 and specificity (SP) of 0.88. Polderman et al. (2007) compared the SWAN rating scale against the CBCL Attention Problem scale and confirmed its usefulness in clinical practice as well as research by identifying those with positive attention skills. The SWAN scale has since been used in the Preschoolers With ADHD Treatment Study (PATS) to guard against overidentification of preschoolers’ attention problems (Abikoff et al., 2007; Vitiello et al., 2007). It has also been used in genetic studies where the ability to capture a continuum of attention skills facilitates a closer examination of the true phenotype of ADHD (Cornish et al., 2005; Hay, Bennett, Levy, Sergeant, & Swanson, 2007). In neuroimaging and neurocognitive studies too, the SWAN scale can provide a continuum of ratings that facilitate the study of correlations between behaviors and brain functioning (Lui & Tannock, 2007; Volkow et al., 2009).
As the SWAN rating scale appears to be a useful addition for the assessment of ADHD behaviors in children, we set out to examine its psychometric properties and normative scores when applied to Chinese children in Hong Kong, with a view to establish its use in Hong Kong.
Method
Instrument
The SWAN rating scale was translated into Chinese by a clinician and back-translated into English by an independent bilingual university graduate. A panel of experienced child and adolescent psychiatrists compared the original English version with the back-translation. Discrepancies were discussed. If necessary, the Chinese translation was revised and back-translated again. The final translated version was approved by consensus.
The questionnaire was scored according to Swanson et al. (2005). A 7-point response ranging from +3 (far below average) to −3 (far above average) was obtained. Mean score of all the 18 items provides the ADHD–Combined (ADHD-C) score, whereas Questions 1 to 9 constitute the ADHD–Inattentive (ADHD-I) score, and Questions 10 to 18 the ADHD–Hyperactivity/Impulsivity (ADHD-HI) score.
Community Sample
The community sample was recruited from government-funded primary schools across the whole of Hong Kong, with the help of the Hong Kong Government’s Education Bureau. Children were selected by random sampling stratified by their school’s achievement bandings and socioeconomic regions. (The Hong Kong education system divides schools into three bands according to their academic standing.) Schools excluded in the sampling were private schools (which are not banded), international schools (whose students are mostly from non-Chinese families), and schools for children with mental or physical disabilities. Out of a total of 675 primary schools for nondisabled children, 44 (6.5%) were private schools and 48 (7.1%) were international schools. From the remaining 583 schools, 130 were invited to join the study. In all, 76 (58.4%) agreed. A second round of invitations was sent to 52 schools, of which 20 agreed. In total, 96 schools participated. Data collection took place in the second term of the school year (April to July) to ensure that teachers had had sufficient time to observe the children’s behaviors.
All primary classes (primary one to six, equivalent to 6-12 years old) were recruited. Two students per class were randomly selected so as not to overload the teachers. Briefing about the study was given to designated senior school personnel who were responsible for coordinating the logistics. Written consent was sought from parents. Should the parents of the selected child decline to participate, the teachers were asked to select the student with the next class number. Participating parents completed the Chinese version of the parent-SWAN scale and returned it to the school in a sealed envelope to ensure confidentiality. The class teachers of participating students completed the Chinese version of the teacher-SWAN scale. In addition, basic demographic information was obtained from the parents, which included the age and sex of the child, and parents’ marital status and level of education. These were deliberately kept to a minimum so that parents would not be put off by having to divulge too much personal information.
A total of 3,722 questionnaires were returned. Feedback from the schools’ coordinators indicated that only very few parents declined. A subset (19) of these participating schools agreed to be involved in the test–retest exercise 2 to 4 weeks later.
Clinic Sample
All children between the ages of 6 and 12 years with a clinical diagnosis of ADHD attending the child and adolescent psychiatry clinic of a university-affiliated district general hospital for the first time during a 1-year study period were recruited. As part of the routine assessment, parents completed the Chinese version of the parent-SWAN scale prior to being seen by a clinician. After this first interview, with parents’ consent, a copy of the Chinese version of the teacher-SWAN scale was given to the child’s class teacher, who was to return the completed questionnaire to the clinic in a sealed addressed envelope.
Data Analysis
SPSS version 14.0 was used to perform the statistical analyses. Reliability was determined by internal consistency and test–retest stability. Validity was assessed by its ability to discriminate between community and clinic samples. Threshold scores and their SE, SP, and positive and negative predictive values were calculated.
Results
Of the 3,722 parent-questionnaires returned by the community sample, 41 (1.1%) had to be discarded because of incomplete data, leaving 3,681 for analysis. Of the 3,722 teacher-questionnaires returned, 63 (1.7%) were discarded for similar reasons, leaving 3,659 for analysis.
The clinic sample consisted of 247 children. Of the parent-questionnaires, 28 were discarded because of incomplete data, leaving 219 for analysis. These same children yielded 146 teacher-questionnaires.
Parents and teachers of 867 students from 19 schools submitted retest ratings. However, 271 of the parent-questionnaires were excluded because either (a) the parents completed the questionnaires outside of the required time frame or (b) different parents completed the questionnaires on the two occasions. That left 596 cases for test–retest analysis. Similarly, 113 of the teacher-questionnaires were excluded, leaving 754 questionnaires for analysis. The mean duration between the two completion dates was 19 days (SD = 7.3 days).
The community sample consisted of 51% boys and had a mean age of 9.1 years (SD = 1.8 years). The clinic sample had 80% boys, and the mean age was 8.5 years (SD = 1.7 years).
Distribution of SWAN Scores and the Gender Effect
As predicted, the distribution of the ADHC-C, ADHD-I, and ADHD-HI scores conformed to a normal distribution, and skewness values were close to zero. The mean scores for the parent- and teacher-questionnaires leaned toward the “better than average” ratings. Significant gender differences were noted. Parents and teachers rated boys to be significantly more problematic than girls across all scores. The effect sizes ranged from small to medium (0.3-0.4 for parent-questionnaire, 0.5-0.7 for teacher-questionnaire). On comparing our teachers’ ratings against that of Swanson’s, we had slightly lower ADHD-C score (−0.69 ± 1.14 vs. −0.57 ± 1.63) and ADHD-HI score (−0.93 ± 1.23 vs. −0.72 ± 1.65). Both were statistically significant but the effect sizes were very small (Cohen’s d = 0.10 and 0.17, respectively). Our ADHD-I score was no different from Swanson’s (−0.45 ± 1.18 vs. −0.43 ± 1.76). As Swanson’s article did not have parent data, we were not able to make comparisons with our parents’ ratings (Table 1).
Means, Skewness, and Gender Differences of the Community Sample.

Cohen’s d.
p = .000.
Cross-Scale Correlations and Interinformant Correlations
The two subscales of ADHD-HI and ADHD-I were highly correlated with each other and with the ADHD-C. For both boys and girls, the correlations between ADHD-C and the subscales ranged from .92 to .95. The correlations between ADHD-I and ADHD-HI ranged from .73 to .80. All were significant at the p < .01 level.
Parent and teacher ratings were moderately but significantly correlated at the p < .01 level (Pearson’s correlations). Among boys, the correlations were .41 for ADHD-C, .40 for ADHD-HI, and .37 for ADHD-I. Among girls, the corresponding figures were .34, .30, and .34.
Reliability
The internal consistency of the scales was examined by Cronbach’s alpha, where a coefficient of .7 or higher is considered “acceptable” in most social science research. Our results found alphas to exceed .9. It was .95 for ADHD-C, .93 for ADHD-HI, and .90 for ADHD-I on the parent-questionnaire, and .98, .97, and .97 on the teacher-questionnaire. The scales are therefore highly consistent.
Test–retest reliability was also confirmed. Intraclass correlations (ICC) of the ADHD-I, ADHD-HI, and ADHD-C of the parent-questionnaire were .87, .84, and .87, respectively, and .91, .90, .92 for the teacher-questionnaire. Using repeated-measures t tests, the teacher-questionnaire did not yield any significant score changes on second administration. On the parent-questionnaire, a significant but small decrease was noted in ADHD-HI scores (p < .01), but the effect size was very small (Cohen’s d = −0.06).
Validity
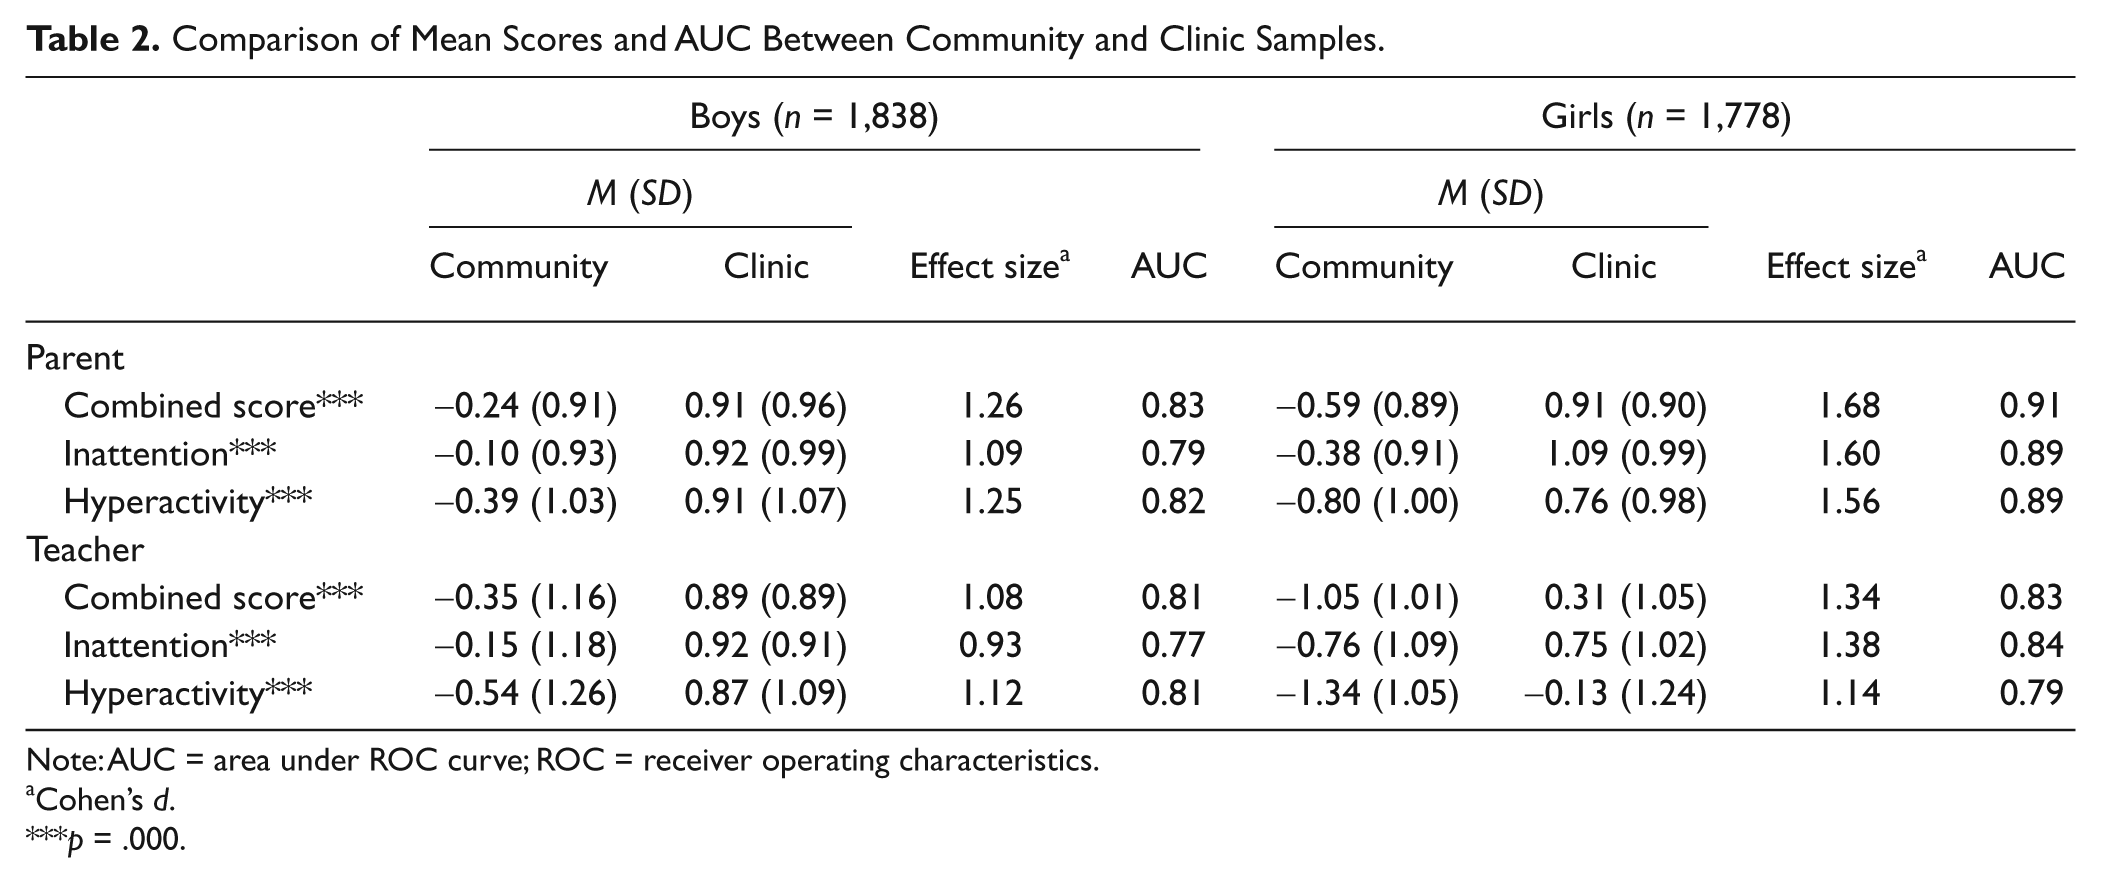
Table 2 summarizes the differences in the mean scores between the community and clinic samples. Expectedly, the clinic sample scored significantly higher than the community sample and the effects sizes of the differences were all very large.
Comparison of Mean Scores and AUC Between Community and Clinic Samples.
Note: AUC = area under ROC curve; ROC = receiver operating characteristics.
Cohen’s d.
p = .000.
Receiver Operating Characteristics (ROC) analysis was used to examine the ability of the subscale and combined scores in differentiating the clinic ADHD sample from the community sample. The resultant AUCs were 0.87 to 0.92 for boys, and 0.79 to 0.91 for girls. Taking an AUC of 0.8 or more to indicate good discriminatory potential, these findings show that subscale and combined scores were all highly discriminatory, which held true whoever the informant.
Factor Analysis
Factor analysis (Table 3) on community sample ratings was carried out using maximum likelihood procedure with Oblimin rotation. Two factors with eigenvalue > 1 emerged, which explained a total of 60.1% variance on the parent-questionnaire, and 81.3% on the teacher-questionnaire. The pattern of the factor loading was a perfect match for the original structure.
Factor structure (highest factor loadings for each of the factors are in bold).

SPs, SEs, and Cutoff Scores
Swanson et al. (2005) placed the cutoff scores at 1.65 SD above the mean scale scores, which was expected to capture 5% of the population. Calculating from our community sample scores and analyzing separately by gender, the respective 1.65 SD above the mean scale scores on the parent-questionnaire were, for boys, 1.26 for ADHD-C, 1.43 for ADHD-I, and 1.31 for ADHD-HI. For girls, these were 0.88, 1.13, and 0.85, respectively. On the teacher-questionnaire, these scores were 1.56, 1.79, and 1.54 for boys, and 0.63, 1.04, and 0.40 for girls, respectively. The corresponding SPs were around 95% whereas the SEs ranged from 16% to 36% in boys and 33% to 48% in girls. Obviously, adopting such high cutoff scores has compromised the SE in favor of the SP (Table 4).
Screening Properties by Maximizing Specificities (SPs) and Sensitivities (SEs).

In order that SPs and SEs fall in a range that is more conducive for screening purposes, we calculated an alternative set of cutoff scores by maximizing the sum of SP and SE. These cutoffs achieved SEs that ranged between 67% and 83% (with the exception of teacher’s hyperactivity scores for girls, which was only 55%), and SPs between 66% and 89%. The scores ranged between 0.5 and 1 SD above the mean.
Discussion
The parent and teacher versions of the SWAN rating scale were translated into Chinese and the psychometric properties examined in a large representative community sample of 6- to 12-year-old Chinese children in Hong Kong. The scale showed excellent internal reliability and test–retest reliability, and has good discriminant validity in differentiating ADHD clinic sample from community sample. Factor analysis showed an exact replication of the original two-factor structure, namely, an Inattention subscale and a Hyperactive-Impulsive subscale, which adds to recent studies that confirm the factor structure of Western instruments when applied to Chinese populations, such as the CBCL and TRF (Ivanova, Achenbach, et al., 2007; Ivanova, Dobrean, et al., 2007) and SNAP (Gau et al., 2008; Gau et al., 2009). Our results not only lend support to the validity of the SWAN rating scale but also, in broad terms, to the validity of the DSM-IV ADHD subclassification into separate clusters of symptoms (American Psychiatric Association, 1994).
As predicted, by anchoring on “average” behaviors, normative scores were normally distributed. Consistent with expectation, boys received significantly higher (more problematic) scores than girls. Our parent ratings were higher than teacher ratings, but the interrater correlations were still higher than that reported by Achenbach in his meta-analysis study on cross-informant correlations (Achenbach, McConaughy, & Howell, 1987).
The similarity between our teachers’ normative scores and that of Swanson et al.’s (2005) distinguishes the SWAN rating scale from other instruments, such as CTRS (Luk et al., 1988), Rutter’s questionnaire (Ho et al., 1996), and SDQ (Lai et al., 2010), all of which found normative ratings among Hong Kong Chinese samples to be significantly higher than Western norms. It is possible that because the SWAN rating scale is worded in a neutral manner and the focus is shifted onto comparing the child’s behaviors against other children of a similar age, raters’ judgments are made differently from when the focus is on the presence of specific behaviors.
By placing the cutoff scores at 1.65 SD above the mean, SPs were in the range of 95%. This compares well with the borderline (T ≥ 67) cutoffs of the Attention Problems Scale of the Chinese CBCL and TRF (Leung et al., 2006). However, the SEs associated with such high cutoff scores were low. By maximizing the SPs and SEs, an alternative set of cutoff scores were derived that yielded a mean (SD) SP of 74 (7) for boys and 79 (8) for girls, and SE of 74 (5) for boys and 74 (10) for girls. These are very similar to that of the Chinese parents and teachers’ Conners Rating Scales–Revised: Short Form, which have been tested among Chinese children in Taiwan (Gau et al., 2006). The corresponding alternative cutoff scores ranged between T-scores of ≥ 5 and 61, with a mean (SD) of 57 (2) for boys and 59 (2) for girls. In Leung et al.’s (2006) study of the Chinese CBCL and TRF, similar calculations yielded cutoff scores of T ≥ 59 on the CBCL and T ≥ 60 on the TRF.
The choice of cutoff scores should be based on a clinical decision about the intended use of the questionnaires. In this study, we adopted a simple rule of balancing the SE and SP, using the sum of both. However, we must note that there are situations when early detection is essential in saving life, as in the case of cancer diseases. In those situations, we may suggest lowering the cutoff to a point that there is close to 100% SE, that is, very few false negatives. The trade-off is a low SP so that there are a fair number of false positives. The consequence is a lot of work for clinicians doing more labor-intensive and expensive diagnostic workup. However, for other conditions, if the less severely afflicted may have a less predictable course of development, we can afford a higher cutoff so that there are missed cases (false negatives) with lower SE. The trade-off is a higher SP so that most cases screened out are genuine problematic cases requiring attention. Given that ADHD is not as urgent and deadly as cancer and that child psychiatric services are inadequate in many countries, particularly the developing countries, we may be impractical to insist on an ADHD screening measure with high SE, as it also brings alongside the shortcoming of a high rate of false positives. We can afford to miss some cases but with fewer false positives so that the already-inadequate child psychiatric services will not be overwhelmed. So, we are suggesting cutoffs in this article to balance the trade-off between SE and SP. In other words, both are equally emphasized and we will not recommend trading one for the other in an ADHD screening measure.
There are several limitations in this study. First, because we have confined ourselves to children between 6 and 12 years old, how the SWAN scale performs for preschool children and adolescents is not known. Our results cannot be generalized to these other age groups because we know that ADHD symptoms change with age, as evidenced by DSM-IV field trials (Lahey et al., 1994; Lahey, Pelham, Loney, Lee, & Willcutt, 2005). Second, without actually interviewing the community subjects, we do not have data pertaining to the external validity of the threshold scores. A two-stage epidemiological approach would have provided more information on the community sample and added to the validity data. Third, although the schools reported low refusal rates by impression, the actual figures were not recorded, so that any bias in participation could not be accurately estimated.
In conclusion, with parents and teachers as raters, and primary school children as targets, the psychometric properties of the Chinese version of the SWAN scale are favorable and confirm its applicability among Chinese children in Hong Kong. Our confidence on the scale as a screening instrument is further enhanced because its items follow closely the meaning of DSM-IV diagnostic criteria, and its scores are normally distributed. The similarity in teachers’ normative scores with Swanson’s U.S. sample distinguishes it from some other Western instruments, whose normative scores among Chinese children in Hong Kong were often found to be much higher. Our data also provide different sets of cutoff scores with their respective SPs and SEs. Having the SWAN scale available in Chinese facilitates future ADHD research among Chinese populations and adds further dimensions in the understanding of ADHD. So far, the psychometric properties of the SWAN scale have not been widely reported. Our study is an attempt to fill this gap.
Footnotes
Acknowledgements
The authors are grateful for the help of the Education Bureau of Hong Kong in the recruitment of participants. Thanks also to Tony Leung for the statistical consultations.
Declaration of Conflicting Interests
The author(s) declared no potential conflicts of interest with respect to the research, authorship, and/or publication of this article.
Funding
The author(s) received no financial support for the research, authorship, and/or publication of this article.