
Abstract
Dysgraphia (impaired handwriting legibility) falls under the rubric of developmental coordination disorder in the Diagnostic and Statistical Manual of Mental Disorders (5th ed.; DSM-5; American Psychiatric Association, 2013) and is common in elementary, middle, and high school students with ADHD (Adi-Japha et al., 2007; Brossard-Racine, Majnemer, Shevell, Snider, & Bélanger, 2011; Brossard-Racine et al., 2015; Mayes, Calhoun, Mayes, & Molitoris, 2012; Racine, Majnemer, Shevell, & Snider, 2008; Rosenblum, Epsztein, & Josman, 2008) and autism (Fuentes, Mostofsky, & Bastian, 2010; Ghaziuddin & Mountain-Kimchi, 2004; Hellinckx, Roeyers, & Van Waelvelde, 2013; Kushki, Chau, & Anagnostou, 2011; Mayes & Calhoun, 2008; Mayes et al., 2012; Myles et al., 2003; Siegel, Minshew, & Goldstein, 1996). Specifically, a study of 724 referred children 6 to 16 years of age reported dysgraphia in 58% of students with ADHD and in 50% of those with autism (Mayes & Calhoun, 2007b). Although multiple studies report that dysgraphia is common at all ages in students with ADHD or autism, no study has yet investigated the prevalence of dysgraphia by age in a single sample of students with ADHD or autism across all grade levels, which is the focus of our study.
Dysgraphia in ADHD and Autism
Relative to the norm and to typical controls, studies show poorer handwriting quality (e.g., legibility, letter formation, alignment, spacing, and sizing) in children with ADHD (Brossard-Racine et al., 2011; Graham, Fisman, Reid, & Hebert, 2016; Racine et al., 2008) and autism (Beversdorf et al., 2001; Cartmill, Rodger, & Ziviani, 2009; Fuentes, Mostofsky, & Bastian, 2009, 2010; Hellinckx et al., 2013; Johnson et al., 2013; Myles et al., 2003), as well as reduced handwriting speed (Brossard-Racine et al., 2011; Graham et al., 2016; Hellinckx et al., 2013; Johnson et al., 2013; Racine et al., 2008).
Dysgraphia causes significant frustration for students and interferes with their ability to learn, complete schoolwork, communicate and record ideas, and demonstrate their knowledge (Tseng & Cermak, 1993), and it negatively affects academic outcomes. Specifically, graphomotor ability was found to contribute uniquely to concurrent reading, math, and written expression achievement test scores in a study of 886 students (6-16 years of age) with ADHD or autism (Mayes & Calhoun, 2007b). Relatedly, difficulty with written expression (spelling and compositional writing skills scored for length of text, theme development, organization, grammar, and mechanics) was a significant predictor of academic achievement 18 months later in 104 middle school students with ADHD, controlling for baseline grade point average, reading ability, ADHD and oppositional defiant disorder symptoms, and medication use (Molitor et al., 2016).
The fact that dysgraphia is common from elementary through high school in students with ADHD or autism suggests that dysgraphia may not resolve, despite increasing maturity and regular handwriting practicing in school. Unfortunately, students with dysgraphia (impaired handwriting legibility) and students with a learning disability in written expression (impaired compositional writing skills scored on the basis of content not appearance) frequently do not receive intervention and accommodations because writing is often neglected in standardized testing assessing student progress (in contrast to reading and math), in school psychological evaluations, and in research (Hooper et al., 1993; Mayes & Calhoun, 2007a). This occurs even though a learning disability in written expression is the most common type of learning disability. In a study of children with learning disabilities (Mayes & Calhoun, 2007a), a learning disability in written expression was approximately 3 times more common (92%) than a learning disability in reading (33%) and math (32%). The prevalence of writing problems throughout the school years is high, even in general population samples. Hooper et al. (1993) found that 35% of students across three middle schools scored more than one standard deviation below the mean on a standardized test of written expression. Writing problems are even more common in referred children with ADHD and autism. In a study by Mayes and Calhoun (2006a), 60% of children with autism and 63% with ADHD had a learning disability in written expression.
Longitudinal Studies of Dysgraphia
Only four known studies investigated the persistence of dysgraphia, but these were limited to elementary school students. One study showed that 16 poor writers (ages: 7-11 years) did not catch up with their peers in writing 1 year later (Smits-Engelsman & Van Galen, 1997). Another study reported that 31 of 110 students (28.2%) with dysfunctional handwriting at the end of first grade continued to have illegible handwriting at the end of fifth grade and that 22 new cases of students with dysfunctional handwriting were identified in Grades 4 or 5 (Karlsdottir & Stefansson, 2002). A third study (Overvelde & Hulstijn, 2011) found a decrease in dysgraphia from the beginning to end of second grade in 70 students and from the beginning to end of third grade in 169 students. However, mean handwriting scores for children with dysgraphia remained below the normal range at all four time points. The fourth study of 121 students evaluated annually in Grades 2 through 6 showed that second graders with dysgraphia continued to have handwriting problems in sixth grade (Hamstra-Bletz & Blote, 1993).
Neurocognitive Abilities and Dysgraphia
Brain imaging studies demonstrate neurological differences between children with and without dysgraphia (Berninger & Richards, 2010; Richards et al., 2015). Dysgraphia can result from acquired neurological damage (Rapcsak et al., 2009; Rapp, Purcell, Hillis, ECapasso, & Miceli, 2016), and dysgraphia and a learning disability in written expression are both associated with executive function and other neurocognitive impairments (Hooper, Swartz, Wakely, de Kruif, & Montgomery, 2002; Mayes & Calhoun, 2007b). Together, these findings point to an underlying neurological basis for dysgraphia. Dysgraphia is linked with fine motor and visual-motor deficits (Brossard-Racine et al., 2011; Fuentes et al., 2009; Kushki et al., 2011; Smits-Engelsman, Niemeijer, & Van Galen, 2001; Tseng & Cermak, 1993). In contrast, motor-free visual perception has little relationship with handwriting (Tseng & Cermak, 1993), and age, gender, overall intellectual ability (IQ), and visuospatial abilities were not predictive of handwriting performance in a study of children with autism (Fuentes et al., 2009). Interestingly, children with ADHD and autism have similar neuropsychological profiles, including a strength in visual reasoning relative to IQ and a weakness in graphomotor skill (Dakin & Frith, 2005; Mayes & Calhoun, 2003a, 2003b, 2004b, 2006b, 2008; Siegel et al., 1996). Research demonstrates that graphomotor, attention, and performance speed weaknesses are likely to coexist and that the majority of students with ADHD and autism have weaknesses in all three areas (Mayes & Calhoun, 2007b). Furthermore, a study of 886 children (6-16 years) with ADHD or autism and normal intelligence showed that the two diagnostic groups did not differ on measures of graphomotor ability, attention, working memory, and processing speed (Mayes et al., 2012).
Purpose
Some teachers and school administrators argue that handwriting problems can be corrected with instruction, practice, and intervention, but empirical support for this is weak and the fact that dysgraphia has been documented at all ages suggests that it may not resolve with age or with years of practice and instruction in school. The purpose of our study is to assess the prevalence of dysgraphia, using the same standardized measures across a broad age range (6-16 years) of students with ADHD or autism to determine whether dysgraphia decreases with age. Several generally small studies of restricted age ranges demonstrate that dysgraphia is identified at all ages. However, no study has investigated the frequency of dysgraphia by age across all grade levels in a single sample of students with ADHD or autism. Ours is also the largest study (N = 1,034) of dysgraphia in students with ADHD or autism, and is novel in that graphomotor ability is assessed relative to the norm, as well as the child’s overall ability (Full Scale IQ), using a discrepancy model. This is important given research showing that children with ADHD and autism and normal intelligence have a strength relative to IQ in visual reasoning (as measured by motor-free tests) and a weakness in graphomotor skill. Therefore, graphomotor ability should be assessed relative to IQ, as well as normative data, to ascertain the extent to which graphomotor ability is below other abilities. Our study aims to determine whether graphomotor standard scores improve with age and whether the discrepancy between IQ and graphomotor ability decreases with age in students with ADHD or autism. Results will have important implications for the assessment and treatment of dysgraphia in schools. If dysgraphia prevalence is high and does not decrease with age, educators and clinicians should address this problem by providing remediation and compensatory strategies and not neglect writing problems in these students.
Method
Measures
Developmental Test of Visual-Motor Integration (VMI)
The VMI-4, -5, or -6 (Beery, 1997; Beery & Beery, 2006, 2010, whichever version was current when the child was evaluated) was administered and scored by the first or third author for all children. Item content is identical for all three VMI versions. The VMI was chosen as the primary instrument for assessing dysgraphia because it is frequently used in handwriting studies (Brossard-Racine et al., 2011; Cornhill & Case-Smith, 1996 ; Hellinckx et al., 2013; Maeland, 1992; Tseng & Cermak, 1993; Tseng & Murray, 1994; Weil & Amundson, 1994; Weintraub & Graham, 2000). Research shows that the VMI is a better predictor of handwriting legibility than standardized fine motor coordination, manual dexterity, movement, and visual perceptual tests (Brossard-Racine et al., 2011; Maeland, 1992; Volman, van Schendel, & Jongmans, 2006).
The VMI requires the child to copy geometric forms with a pencil in a square below each form. The VMI is untimed and is scored using stringent criteria (a ruler and protractor are needed to measure lengths, proportions, and angles). VMI standard scores were calculated using normative data with a mean of 100 and standard deviation of 15, comparable to IQ scores on the Wechsler Scales. A study comparing scores on two early VMI versions (Mayes & Calhoun, 1998) showed a correlation of .99 and a mean difference of only 1.5 points between standard scores.
Coding
The Coding subtest from the Wechsler Intelligence Scale for Children (WISC-III, -IV, or -V; Wechsler, 1991, 1997, 2014, using the version current at the time of the evaluation) was administered and scored by the first or third author for all children. Coding item content is identical for the WISC-III and -IV, whereas most of the discontinuous symbols were replaced with continuous symbols on the WISC-V so that the child could copy the symbols without lifting the pencil. Data presented in the WISC-V manual indicate that Coding scores on the WISC-IV and WISC-V are highly correlated (r = .70) and have similar means (M = 10.0 and 10.7, respectively). Coding is a graphomotor test which was included in our study because Coding scores can be directly compared with IQ (i.e., both scores are derived from the same standardization sample) and to lend validity to findings with the VMI. However, unlike the VMI, Coding is not a pure graphomotor test, as it is confounded by speed and memory because scores are higher for children who are able to complete the test quickly and who can memorize the paired symbols.
Coding is a timed paper-and-pencil task. Children aged 6 to 7 years are given a sheet with a key at the top with five symbols (e.g., oblique line and circle) inside five shapes (i.e., circle, square, triangle, cross, and star). Children are instructed to draw the appropriate symbol inside the corresponding shape (as depicted on the key) on the response sheet. For children aged 7 to 16 years, the key has nine symbols (e.g., oblique line and circle) under the numerals 1 to 9 and the child is instructed to draw the appropriate symbol in the empty square under the corresponding numeral (printed in random order) on the response sheet. The child receives credit for each symbol drawn correctly within the 2-min time limit. Coding is scored less stringently than the VMI. Children receive credit even if the forms are reproduced imperfectly as long as they are “clearly identifiable as the keyed symbol.” Bonus points are awarded if the child correctly draws all the symbols before the time limit has expired. In our study, Coding scaled scores were converted to a standard score with a mean of 100 and standard deviation of 15, so that Coding scores could be compared with Full Scale IQ and VMI scores.
Sample
The 1,034 children were consecutive referrals to our psychiatry child diagnostic clinic evaluated over the past 20 years who had normal intelligence (IQ ≥ 80) and were diagnosed with ADHD–Combined presentation (n = 519), ADHD–Inattentive presentation (n = 227), or autism (n = 288). All children were tested in the morning. Parents of children treated with stimulant medication were instructed not to administer medication the morning of testing. The children ranged in age from 6 to 16 years (M = 9.1, SD = 2.5). In all, 75.5% were male, 92.1% were white, 41.5% had a parent with a professional or managerial occupation, and 36.4% were treated with a psychotropic medication. Children with comorbid diagnoses (e.g., oppositional defiant disorder, anxiety disorder, depression, or learning disability) were not excluded so that the ADHD and autism samples were representative of children referred to a psychiatry diagnostic clinic.
Diagnostic Procedure
Clinical diagnoses of autism and ADHD were made by a licensed PhD psychologist based on a comprehensive psychological evaluation including diagnostic interviews with the parents and child, parent and teacher rating scales, review of educational and medical records, psychological testing (IQ, achievement, attention, and neuropsychological), and clinical observations during the psychological evaluation.
ADHD
All children in the ADHD group had a DSM diagnosis of ADHD and fulfilled the following criteria: (a) symptoms of ADHD observed during psychological testing, (b) low scores on psychometric measures of attention and impulsivity which have empirical support in identifying ADHD (Mayes & Calhoun, 2002; Mayes, Calhoun, & Crowell, 1998, 2001), and (c) ratings of short attention span or distractible as often or very often a problem on the Pediatric Behavior Scale (PBS; Lindgren & Koeppl, 1987) by at least two raters (mother, father, and teacher). Children were classified with ADHD-C if the majority of the mother, father, and teacher impulsive or hyperactive ratings were often or very often a problem. Children were classified with ADHD-I if the majority of impulsive and hyperactive ratings were less than often a problem. These criteria have been used to identify children with ADHD in several publications (Mattison & Mayes, 2012; Mayes et al., 2012; Mayes et al., 2016; Mayes et al., 2015; Waxmonsky et al., 2017). Children with autism who also had an ADHD diagnosis were only included in the autism sample.
Autism
Children in the autism sample were diagnosed with autism and had a score in the autism range on the Checklist for Autism Spectrum Disorder (CASD; Mayes, 2012). The CASD is 30-item checklist normed and standardized on 2,469 children (age: 1-17 years, IQs: 9-146) with autism, other clinical disorders (e.g., ADHD), and typical development (Mayes, 2012). The CASD differentiates children with autism from children with ADHD (99.5% accuracy), speech apraxia (97% accuracy), and typical development (100% accuracy), is equally effective in identifying children with autism who have low and high IQs, has excellent congruence with DSM clinical diagnoses, and has high diagnostic agreement (93%-98%) with other autism instruments, including the Childhood Autism Rating Scale, the Gilliam Asperger’s Disorder Scale, and the Autism Diagnostic Interview–Revised (Mayes & Calhoun, 1999, 2004a; Mayes et al., 2012; Mayes et al., 2009; Murray, Mayes, & Smith, 2011; Tierney et al., 2015; Tryon, Mayes, Rhodes, & Waldo, 2006).
Data Analyses
VMI and Coding standard scores were compared with IQ and the normal mean of 100 using t tests and Cohen’s d. IQ-VMI discrepancy scores were compared between the three diagnostic groups with ANCOVA controlling for age, because children with ADHD-I were older (M = 9.6, SD = 2.6) than children with ADHD-C (M = 9.0, SD = 2.5) and autism (M = 9.0, SD = 2.6), F = 5.0, p = .007. IQ was controlled in the between group analyses by using VMI and Coding IQ discrepancy scores, although the three diagnostic groups did not differ significantly in IQ (F = 1.9, p = .16). The linear relation between age and VMI and Coding scores was investigated with Pearson correlations and explained variance. Three age groups were created that yielded sample sizes as close as possible to each other, that is, 6 to 7 years (n = 343), 8 to 10 years (n = 397), and 11 to 16 years (n = 294). Differences in IQ-VMI and IQ-Coding discrepancy scores between the age groups were analyzed with ANOVA. Percentages of children with dysgraphia (i.e., VMI = 1 standard deviation [15 points] or more below IQ) and whose VMI and Coding scores were below IQ were compared between the age groups using chi-square analysis. VMI and Coding IQ discrepancy scores did not differ between children not treated and treated prior to testing with psychotropic medication (t = 0.1, p = .91, and t = 1.2, p = .22), so the two groups were combined in the analyses. As noted, children treated with stimulant medication did not receive medication the morning of testing. All reported t test p values have a Bonferroni correction controlling for the number of comparisons.
Results
Dysgraphia Prevalence by Diagnosis
For the total sample and each of the three diagnostic groups (autism, ADHD-C, and ADHD-I), VMI and Coding scores were significantly lower than IQ (Table 1). VMI and Coding scores were also significantly below the normal mean of 100 for each diagnostic group (t = 8.5 to 29.0, p < .0001). VMI scores were below IQ and the normal mean of 100 for approximately 90% of children in each group, and were 1 standard deviation (15 points) or more below IQ for more than half of the children (Table 2). The vast majority of children also scored below IQ and the normal mean on Coding, and almost half had Coding scores 1 standard deviation or more below their IQ scores. In the total sample, IQ-VMI discrepancy scores did not differ significantly between the diagnostic groups (F = 0.3 p = .75).
IQ, VMI, and Coding Scores for Referred Children With ADHD or Autism and Normal Intelligence (N = 1,034).
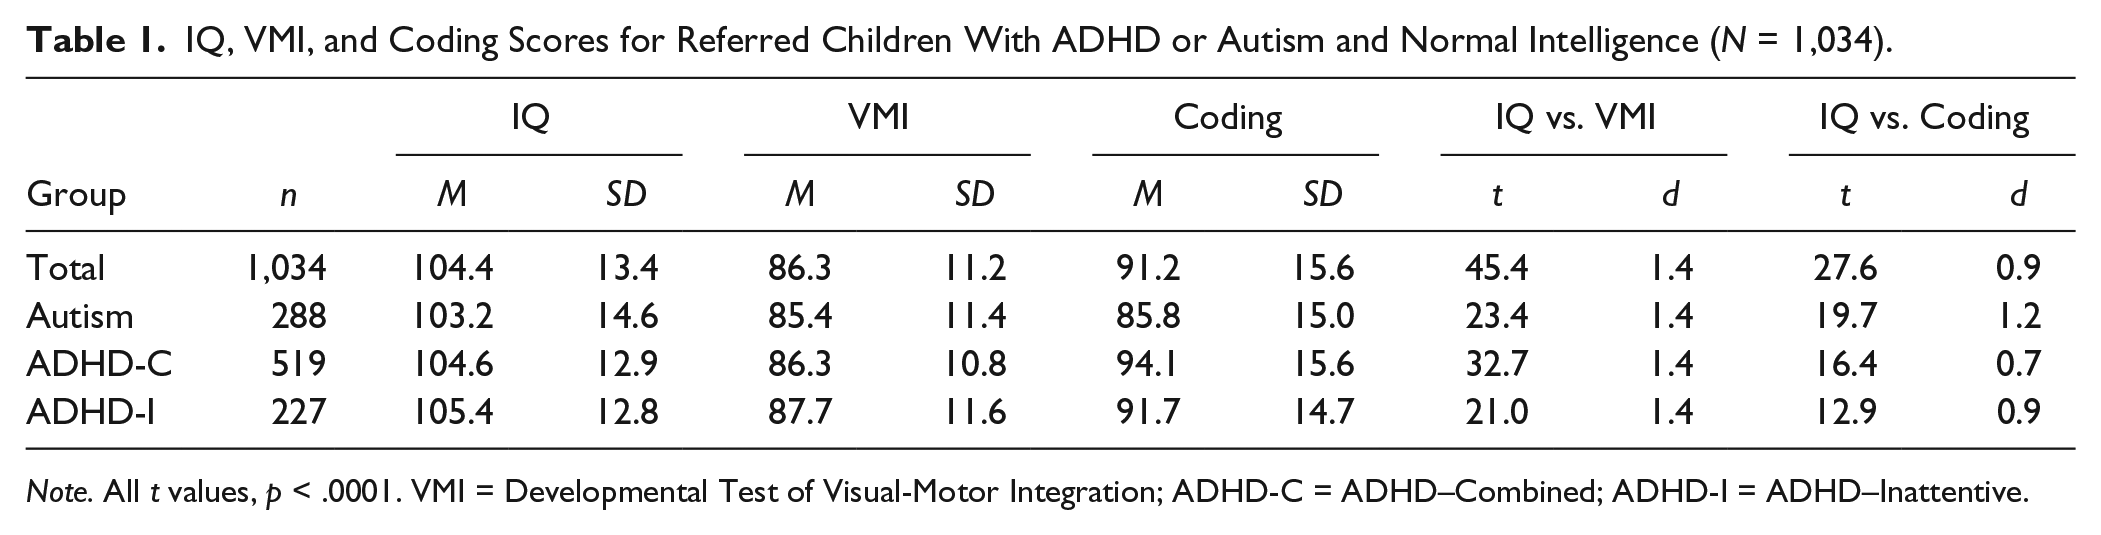
Note. All t values, p < .0001. VMI = Developmental Test of Visual-Motor Integration; ADHD-C = ADHD–Combined; ADHD-I = ADHD–Inattentive.
Percent of Referred Children With ADHD or Autism and Normal Intelligence Scoring Below IQ and the Normal Mean on the VMI and Coding (N = 1,034).
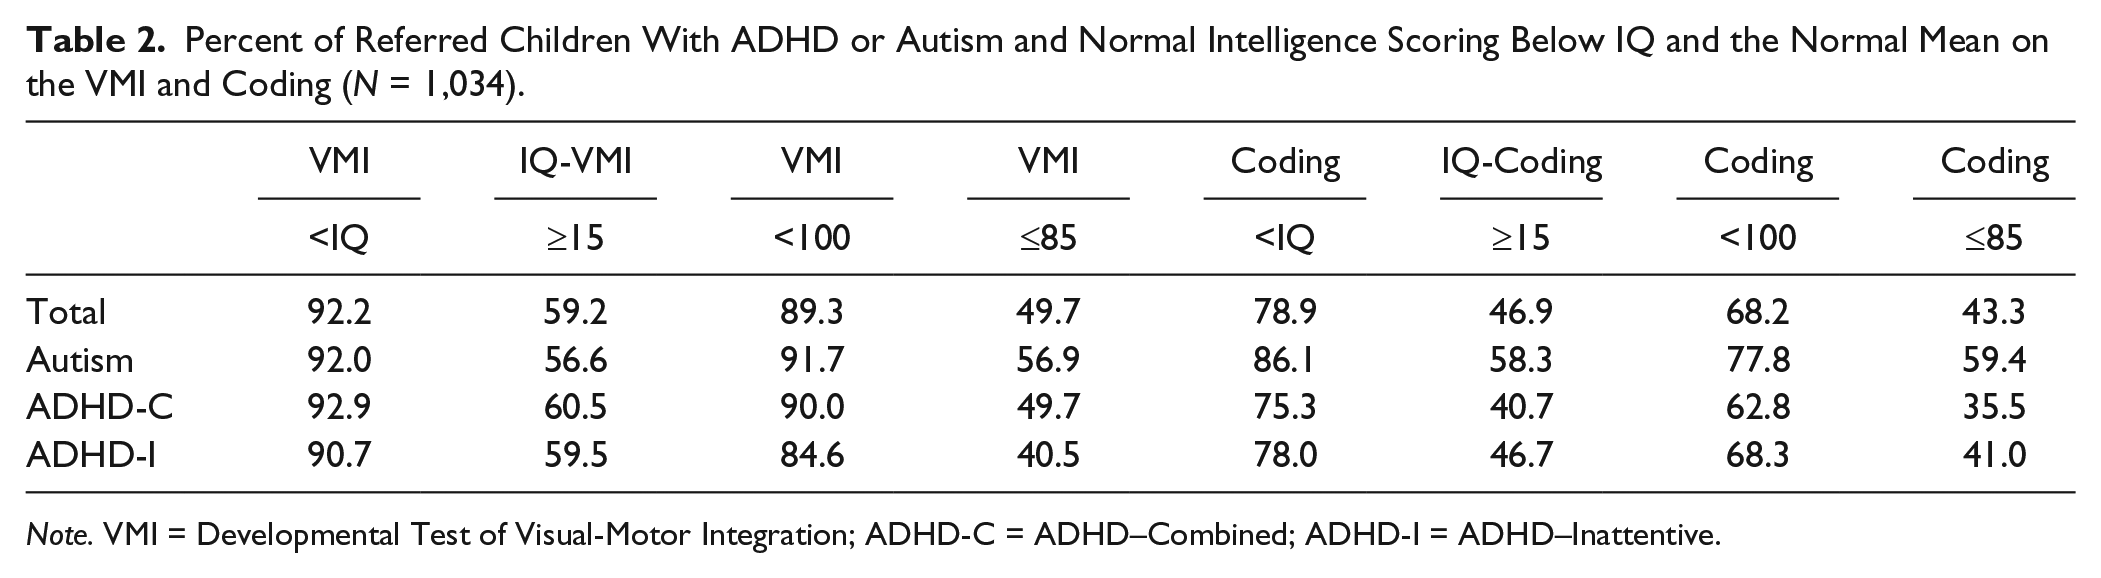
Note. VMI = Developmental Test of Visual-Motor Integration; ADHD-C = ADHD–Combined; ADHD-I = ADHD–Inattentive.
Dysgraphia Prevalence by Age
For the total sample and each of the three diagnostic groups, VMI and Coding IQ discrepancy scores did not differ significantly between the three age groups (Table 3). Similarly, in the total sample, the three age groups did not differ in percentages of children for whom VMI was less than IQ (χ2 = 1.6, p = .45) or Coding was less than IQ (χ2 = 0.3, p = .86). Percentages of children with dysgraphia (VMI 1 standard deviation or more below IQ) in the total sample were 56.0% for 6 to 7 years, 60.5% for 8 to 10 years, and 61.2% for 11 to 16 years, which did not differ significantly from each other (χ2 = 2.2, p = .33). Differences in the prevalence of dysgraphia between age groups also did not differ significantly in each diagnostic group (χ2 = 3.1 to 4.1, p > .13). Correlations between age and VMI and Coding standard scores and IQ discrepancy scores in the total sample and the three diagnostic groups were all small (r = –.20 to .09). Only two correlations were statistically significant. In the total sample and the sample of children with ADHD-C, VMI scores decreased as age increased (r = –.13 and –.20, p < .001), but these correlations explained only 1.6% and 3.8% of the variance, respectively.
VMI and Coding IQ Discrepancy Scores by Age Group for Referred Children With ADHD or Autism and Normal Intelligence (N = 1,034).
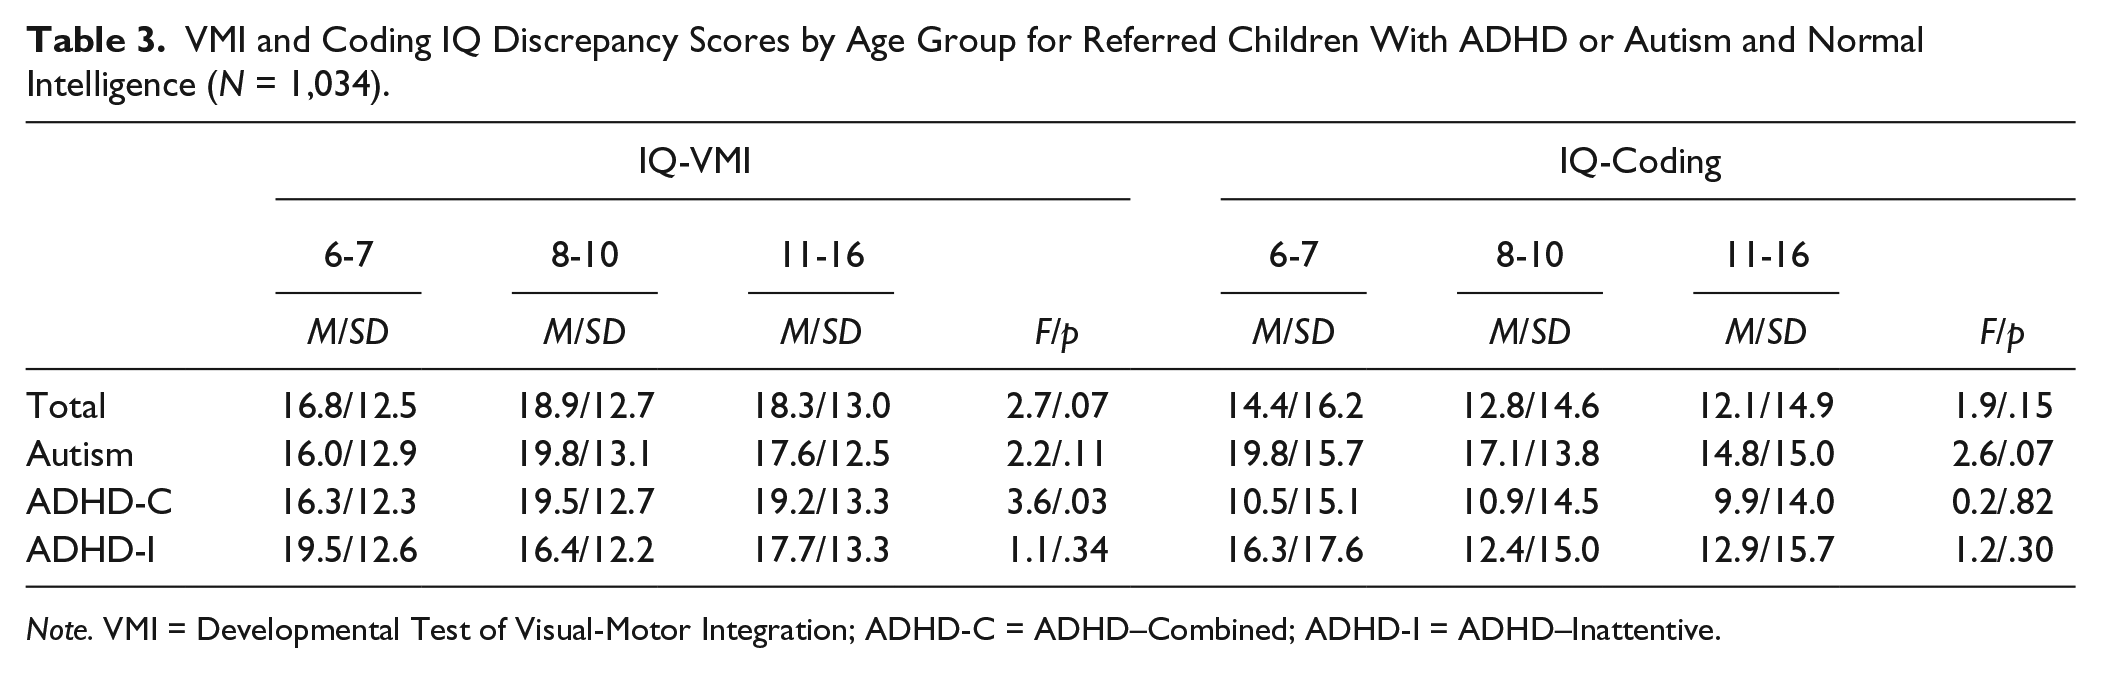
Note. VMI = Developmental Test of Visual-Motor Integration; ADHD-C = ADHD–Combined; ADHD-I = ADHD–Inattentive.
Discussion
More than half (59%) of our sample of students with autism, ADHD-C, and ADHD-I had dysgraphia (i.e., VMI score 1 standard deviation or more below IQ), and 92% had a weakness in graphomotor ability relative to other abilities (i.e., VMI below IQ). Frequency of dysgraphia did not differ significantly between the three diagnostic groups or between the three age groups (6-7 years, 56%; 8-10 years, 60%; and 11-16 years, 61%), indicating that the prevalence of dysgraphia did not decrease with age, despite older children having up to 10 years more writing instruction in school than younger children. Correlations between age and VMI and Coding standard scores and IQ discrepancy scores were all small. The only two correlations that were statistically significant showed that VMI scores relative to age norms did not improve with age but, instead, were actually worse in older students. Our study is the first to demonstrate consistently high levels of dysgraphia across all grades in one large sample of children with ADHD or autism.
Dysgraphia causes significant frustration for students, who consequently find writing unpleasant and something to avoid (Forgrave, 2002; Graham, 1999; MacArthur, 2000). Unfortunately, these students are then sometimes viewed by teachers as lazy and unmotivated. In a study by Weintraub and Graham (1998), students with a learning disability took an average of 50 min to complete a writing task that regular education students completed in 30 min. Students with writing problems cannot keep up with note taking (Graham, 1999), and writing problems negatively affect academic achievement (Mayes & Calhoun, 2007b; Molitor et al., 2016). Dysgraphia causes significant homework stress for parents and has considerable potential psychosocial repercussions for the student, including low self-esteem, anxiety, sadness, and dislike of school. Despite dysgraphia’s high prevalence and negative effects, schools often fail to assess for dysgraphia and fail to provide intervention and accommodations for students who have dysgraphia (Hooper et al., 1993; Mayes & Calhoun, 2007a).
Intervention for Dysgraphia
Studies attempting to remediate dysgraphia are few, often uncontrolled, and involve small sample sizes, attesting to a lack of interest on the part of educators and researchers in addressing this problem. Only two controlled studies were located in our literature search and both showed only small gains (Case-Smith, 2002; Graham, Harris, & Fink, 2000). In a study of students 7 to 10 years of age with poor handwriting, the 29 who received occupational therapy increased handwriting legibility by 14% (in contrast to 5% for the nine students not receiving occupational therapy), which showed a trend toward significance (p = .054), but changes in handwriting speed and numeral legibility did not differ between the occupational therapy and control groups (Case-Smith, 2002). In a study of first graders identified by their teachers as having difficulty with writing, the 19 students randomly assigned to 27 letter writing practice sessions made significantly greater gains in handwriting and compositional fluency immediately following instruction and 6 months later than the 19 control students who received 27 lessons in phonological awareness (Graham et al., 2000). However, the authors noted “For the most part, the overall quality of students’ writing remained poor” (p. 628). Taken together, these two studies suggest that improvement may be achieved for some, but handwriting difficulties often persist.
There is some research suggesting that stimulant medication may improve handwriting in children with ADHD. A study of 12 children with ADHD and developmental coordination disorder and 12 controls (mean age: 9 years) evaluated at baseline and 4 weeks after the children with ADHD started methylphenidate showed a significant improvement in handwriting quality in the ADHD group and a nonsignificant change in the control group (Flapper, Houwen, & Shoemaker, 2006). A meta-analysis (Kavale, 1982) revealed that stimulant medication significantly improved test performance (with moderate to large effect sizes) in children with ADHD on numerous measures (not just handwriting) including continuous performance, vigilance, and reaction time tasks and tests measuring IQ (Full Scale, Verbal, and Performance), academic achievement (both individual and group administered), visual-motor skills (e.g., handwriting, copying forms, and navigating through mazes with a pencil), visual and auditory perception, language, and short-term, long-term, and working memory. Other reviews have also found improvement on tests measuring a variety of cognitive functions (Pietrzak, Mollica, Maruff, & Snyder, 2006; Riccio, Waldrop, Reynolds, & Lowe, 2001; Swanson, Baler, & Volkow, 2011), and a study of children with ADHD showed a significant increase in IQ in the stimulant medication group with a nonsignificant change in the placebo group (Gillberg et al.,1997). The finding that stimulant medication improves performance in children with ADHD in almost every area tested (not just handwriting) using a variety of different instruments suggests that stimulant medication improves test-taking ability and is not limited to specific domains. This may indicate that stimulant medication enhances attention, reduces impulsive responding, increases forethought and planning, and makes tasks easier for students to complete so they are more motivated to try. Furthermore, an uncontrolled study showed that handwriting legibility improved 3 months following treatment with stimulant medication in 49 children with ADHD, but most with poor handwriting legibility at baseline continued to have problems with handwriting legibility at follow-up (Brossard-Racine et al., 2015). Stimulant medication may be an important treatment component for many children with ADHD, but medication alone is clearly not a solution for addressing dysgraphia.
According to Smits-Engelsman and Van Galen (1997), “The common feature of dysgraphic children is that even with the proper amount of instruction and practice, they fail to make sufficient progress in the acquisition of the fine motor task of handwriting” (p. 165). Because dysgraphia is resistant to remediation and is present at all ages, schools should focus on circumventing and compensating for dysgraphia and providing accommodations for students with dysgraphia, as well as trying to improve handwriting. With advances in technology, effective options for doing so are available. Word processing programs enable students to complete tasks legibly and more efficiently and independently and result in improved performance on writing tasks and better grades (Forgrave, 2002). Typing is inherently easier than handwriting (MacArthur, 1996, 2000) and allows students to focus on higher order processes, such as organization and revision, instead of the lower level process of handwriting (Forgrave, 2002). Spelling and grammar checks reduce errors and simplify revising text, which is made even easier without the need for tedious recopying (MacArthur, 1996, 2000) In a single-participant ABAB study of three students with writing disabilities, 12 to 13 years of age, an analysis of academic output produced during class time showed that the students made fewer spelling and reading errors and their work had superior organization and structure when the students used a computer equipped with a word processor than when using paper and pencil (Hetzroni & Shrieber, 2004). MacArthur (1996, 2000) stresses the need, though, for proper instruction in typing and word processing and not simply providing the student with the technology.
Speech recognition software may also help to compensate for writing problems and improve writing skills (Forgrave, 2002). Research shows that dictated compositions are qualitatively superior to and longer than written compositions in students who have a learning disability (MacArthur, 1996). In a study of seventh- and eighth-grade students by Lane and Lewandoski (1994), oral compositions did not differ between students with and without a learning disability, but students with a learning disability produced poorer written compositions.
Limitations
Although several studies show that VMI scores correlate significantly with handwriting legibility, a weakness of our study is the absence of a formal assessment of handwriting. Furthermore, we used different versions of the VMI and Coding (whichever version was current at the time the child was evaluated). It is possible that results could differ by test version, although published data show high congruence between scores obtained on the various versions. Our findings need to be replicated with other samples, and our sample is predominantly White, limiting generalizability of findings to other racial and ethnic groups.
Conclusion
Dysgraphia is common in autism and ADHD at all ages throughout the school years. Although efforts to improve handwriting should continue in school, dysgraphia is a neurologically based weakness that is resistant to remediation, so accommodations and modifications are necessary to improve academic success. When the goal in school is learning, producing text, and measuring knowledge (vs. writing per se), it is essential to take advantage of the student’s strengths and not rely on the student’s weak graphomotor skill for learning, producing academic work, and knowledge assessment. Therefore, students with dysgraphia should be taught keyboarding and word processing skills at an early age and encouraged to use a computer and word processing software when possible for written assignments to narrow the gap between the student’s thoughts and ideas and the student’s ability to express them in writing. Other suggestions for bypassing the student’s graphomotor weakness to maximize academic learning and performance include (a) emphasizing learning activities that are not dependent primarily on writing, (b) reducing the amount of written work and the demand for copying, (c) modifying tests and assignments (e.g., giving multiple choice, true/false, and fill-in-the-blank questions and not open-ended written questions), (d) providing class notes, outlines, and study guides so that the student does not need to rely solely on the student’s own note taking, (e) allowing dictated performance and testing (e.g., oral spelling tests) and the use of speech recognition software for written assignments, and (f) grading on the basis of content and not neatness.
A major goal is to enhance and maintain the student’s enthusiasm and motivation toward school and academic learning and to minimize the frustration, low morale, and poor self-esteem that students with dysgraphia may develop. In this respect, it is important to teach to and reinforce the student’s strengths, recognize that dysgraphia is a neurological problem, and offer incentives and reinforce the student for applying himself or herself and completing work despite the difficulty. Students with dysgraphia need external support and reinforcement to maintain their motivation and effort and help them succeed in school.
Footnotes
Declaration of Conflicting Interests
The author(s) declared no potential conflicts of interest with respect to the research, authorship, and/or publication of this article.
Funding
The author(s) received no financial support for the research, authorship, and/or publication of this article.