
Abstract
Until recently, the history of medical treatment is essentially the history of the placebo effect.
Introduction
Broadly defined as the response to the healing situation (Harrington, 1999), it seems that the placebo response has by now completed the three phases in the life of an artifact (McGuire, 1968): first ignored, then controlled for, and, at last, studied in its own right. Narrowly defined, the placebo response (PR) is all outcomes that follow administration of “an inert treatment or substance,” whether induced by the placebo or not. The placebo effect (PE), however, describes only those outcomes thought to be caused by the placebo itself and not by other aspects of the clinical context. The two main mechanisms currently thought to mediate the PE are expectancy and conditioning (Murray & Stoessl, 2013). The different pathways and effector mechanisms lying between these constructs and the clinical PE, as well as the PR, have only partly been elucidated (Weimer et al., 2015).
The PR in ADHD has mainly been studied in relation to its effects on clinical symptoms, which are by definition assessed subjectively, based on ratings derived from standardized rating scales or interviews. These ratings may be associated with neurocognitive impairment, but do not necessarily indicate such impairment (Ben-Sheetrit et al., 2018). However, data derived from various trials, as reviewed and meta-analyzed by Losier et al. (1996), that was done in children, reveals that drugs (e.g., methylphenidate) and placebos do differ in their effects on neurocognitive performance, and that these differences can be detected using continuous performance tests (CPTs). Losier et al.’s (1996) data arguably show that methylphenidate reduces omissions and commissions by 39% and 29% (respectively) compared with placebo. However, using the signal detection theory paradigm, their graphic data (Figure 2b and c, Losier et al.,1996, p. 984) show that the overall accuracy, in terms of differentiating between targets versus nontargets, is, surprisingly, almost unaltered compared with placebo. This suggests that the PR is more prominent in some measures of CPTs than in others, yet the pattern of PR in different measures of CPTs has yet to be thoroughly investigated.
This apparent lacuna in the literature has several important implications for both clinical research and practice. Regarding research, differentiating between drug and PRs has long become the gold standard of clinical trials (the randomized placebo-control paradigm), and some have suggested that the increasing PR over the years has hindered our ability to aptly detect and employ novel therapeutic strategies (Ben-Sheetrit et al., 2018; Fava et al., 2003), although this is controversial (Khan et al., 2017). Identifying the patterns by which specific neurocognitive outcomes are improved due to PR could aid in discriminating between drug response and PR, and thus could improve the decision-making process of the treatment in the clinic.
Therefore, the main objective of this study was to investigate the PR as observed in a continuous performance test, namely, the Test of Variables of Attention (TOVA), using data from a randomized placebo-controlled trial in adults with ADHD with metadoxine treatment. Metadoxine was chosen for this analysis as it is a nonstimulant and its side effects are not prominent (in contrast to methylphenidate [MPH]), and the PR to metadoxine according to the Conners’ Adult ADHD Rating Scale (CAARS) was found to be quite high in a previous study (Ben-Sheetrit et al., 2018). The rational was comparing the “cognitive” PR to the “symptomatic” one in order to identify differences in the two measurements. We were specifically interested in (a) discriminating the PR characteristics of metadoxine as compared with methylphenidate challenge response (MPH-R), one of the most efficient medications, as assessed by the TOVA; (b) assessing whether symptomatic improvement with placebo as measured by the CAARS is associated with improved neurocognitive performance on the TOVA; (3) determining which variables of the TOVA are more sensitive to PR.
Method
Participants
This was a retrospective analysis of data pooled from a 10-week randomized, multicenter, double-blind placebo-controlled clinical trial of metadoxine-ER (1400 mg/day) conducted in 2016 in adults with ADHD.
One hundred thirty-nine adults (70 women) out of 283 participants of the metadoxine study, aged 37.4 ± 10.5, were treated by placebo and they were included in the analysis of the PR (Table 1). The study was approved by the institutional review boards (IRBs) of all the centers involved. All participants provided informed consent to participate in the study. The main inclusion criteria were a Diagnostic and Statistical Manual of Mental Disorders (5th ed.; DSM-5; American Psychiatric Association, 2013) diagnosis of ADHD as assessed by the Adult ADHD Clinician Diagnostic Scale (ACDS version 1.2) modified for DSM-5, and at least moderate clinical severity; Clinical Global Impression–Severity score ≥4 and Conners’ Adult ADHD Rating Scale–Investigator rated (CAARS-Inv) >24. The main exclusion criteria were any major psychiatric or general medical comorbidity, any significant visual impairment, previous resistance to ADHD medications, or any known allergies to the study drug ingredients. There were no overlaps in study participants between this study and past studies of metadoxine-ER. We included in the current data analysis only participants who completed the entire study period and were treated by placebo.
Demographic and Clinical Characteristics of the Study Sample.
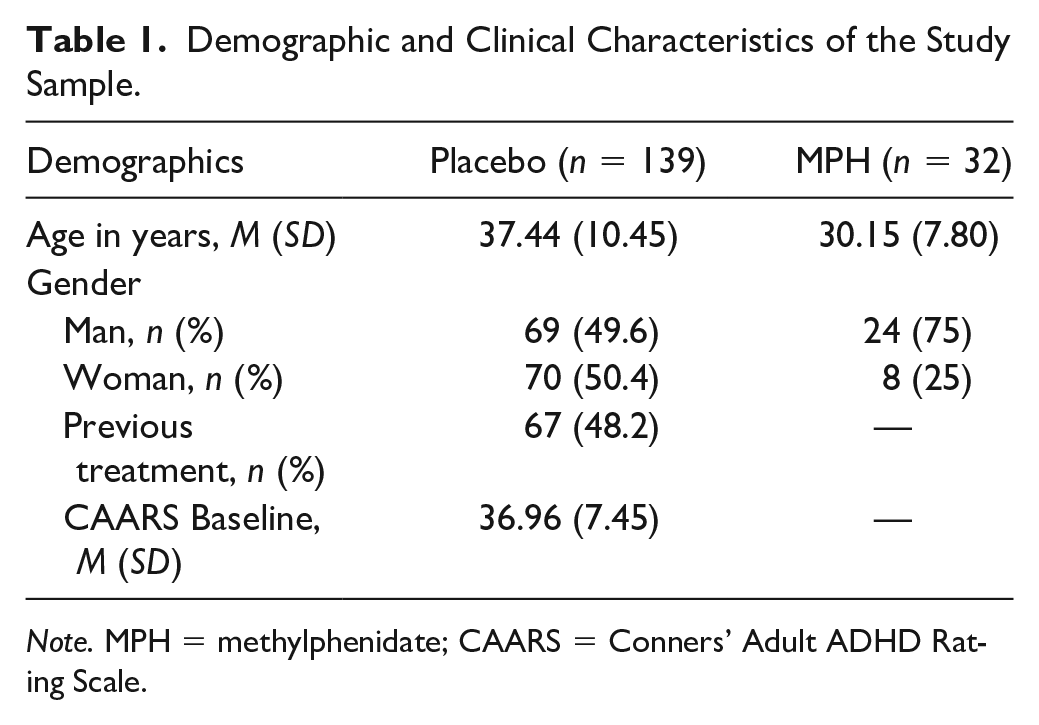
Note. MPH = methylphenidate; CAARS = Conners’ Adult ADHD Rating Scale.
Procedure
The CAARS-Inv was recorded at baseline and its improvement was used as a primary end point. The timing of the end point was Week 10. The TOVA was conducted 3 times: at baseline, at Week 4, and at Week 10 (the final visit).
Measures
TOVA
The TOVA is among the most commonly used CPTs and has been studied and normed in both children and adults (Greenberg et al., 1994; Greenberg & Waldmant, 1993). The TOVA is used as an aid for diagnosis (Forbes, 1998) as well as for the assessment of treatment response (Fuchs et al., 2003). The main indices of the TOVA include omission errors (O), a measure of inattention; commission errors (C), a measure of response inhibition or impulsivity; reaction time (RT), which measures speed of information processing and motor response; RT variability (RTV), calculated as the standard deviation of RT, and considered to reflect consistency or variability of attention; D prime (dʹ) or response sensitivity, considered as a measure of attentional performance decrement, or the rate of deterioration of attentional performance over time; and the Attention Comparison Score (ACS), a measure of the subject’s overall performance on the TOVA compared with other individuals diagnosed with ADHD (Greenberg & Waldman, 1993). Thus, all numerical data regarding the TOVA indices refer to the standard scores of these measures (e.g., O means O-Standard Score, C means C-Standard Scores).
In a previous study, no significant practice effect was detected in any of the variables in repeated administrations of the TOVA (Rotem et al., 2019). Although the sensitivity of the TOVA is reasonably good (80%–85%), it is limited in terms of specificity, with about 30% false-positives found in at least two studies in children (Forbes, 1998; Schatz et al., 2001), which makes the TOVA impractical as a single measure for determination of diagnosis.
CAARS-Inv
The CAARS-Inv (Conners et al., 1999) was used in this study for baseline assessment. The CAARS includes the inattentive (Subscale A, or CAARS-A), hyperactive-impulsive (Subscale B, or CAARS-B) and total ADHD (Subscale C, or CAARS-C) scores, and the ADHD index (Subscale D, or CAARS-D). CAARS-A and -B are based on the DSM-5 criteria of the inattentive presentation and the hyperactive-impulsive presentation, respectively, and CAARS-C is the summary of both presentations’ DSM-5 criteria. The PR as measured by the CAARS (CAARS-PR) was defined and analyzed in a former paper (Ben-Sheetrit et al., 2018). These data were used in this study to compare the CAARS-PR to the patterns of the PR according to the TOVA (TOVA-PR).
To compare the TOVA-PR to those of MPH-R in adults with ADHD, a subanalysis was conducted. The data for the subanalysis were pooled from a database of adults with ADHD who were diagnosed in the ADHD Clinic of Geha MHC during the same years (retrieved randomly). Thirty-two adults were included in the subanalysis. The inclusion criteria were adults of the same age groups, a diagnosis of ADHD according to DSM-5, and improvement in response to MPH as part of the TOVA assessment during the baseline evaluation. Dosages of the single-dose challenge were weight-adjusted (0.3 mg/kg). Exclusion criteria were major comorbid psychiatric or general medical diagnoses; use of medications other than oral contraceptives; alcohol or drug use disorders. The data collection was approved by the IRB of Geha MHC.
Statistical Analysis
Analyses were performed using SPSS for Windows ver. 22 (IBM Inc., Chicago, IL, USA). The prespecified end point was TOVA performance at Week 10. To evaluate changes in TOVA scores between baseline and end point and determine whether there were differences in the concomitantly changed number of improved TOVA variables, an independent-sample t test was performed. When the assumption of homogeneity of variances as assessed by the Levene’s test for equality of variances was violated, a Welch t test was used. The association between TOVA-PR and CAARS-PR was measured using a chi-square test. Phi (φ) strength was considered weak, moderate, or strong if phi was in the range of 0.1 to 0.39, 0.4 to 0.69, or 0.7 to 0.99, respectively (Dancey & Reidy, 2004). Moderation analysis was performed using Moderation Model 1 of Hayes PROCESS (Hayes, 2013), and the Johnson-Neyman analysis (Johnson & Fay, 1950) was used to identify the value of the moderator at which the association became significant. Results are presented as rates (%) and/or mean ± standard deviation, as appropriate. A p value <.05 was considered statistically significant.
Results
Between-Visits Changes in TOVA Variables
The change in each of the TOVA variables between the baseline visit and the end point was analyzed using a paired-sample t tests. As displayed in Table 2, statistically significant differences were found for C (t = −4.32, p < .001) and dʹ (t = −2.13, p = .03), but not for other variables. In contrast to the TOVA-PR, the TOVA-MPH-R changes were both statistically and clinically significant for all its variables, as all the standard scores were normalized (Table 3).
Descriptive Statistics and Paired Sample t Test Results for Each TOVA Index.
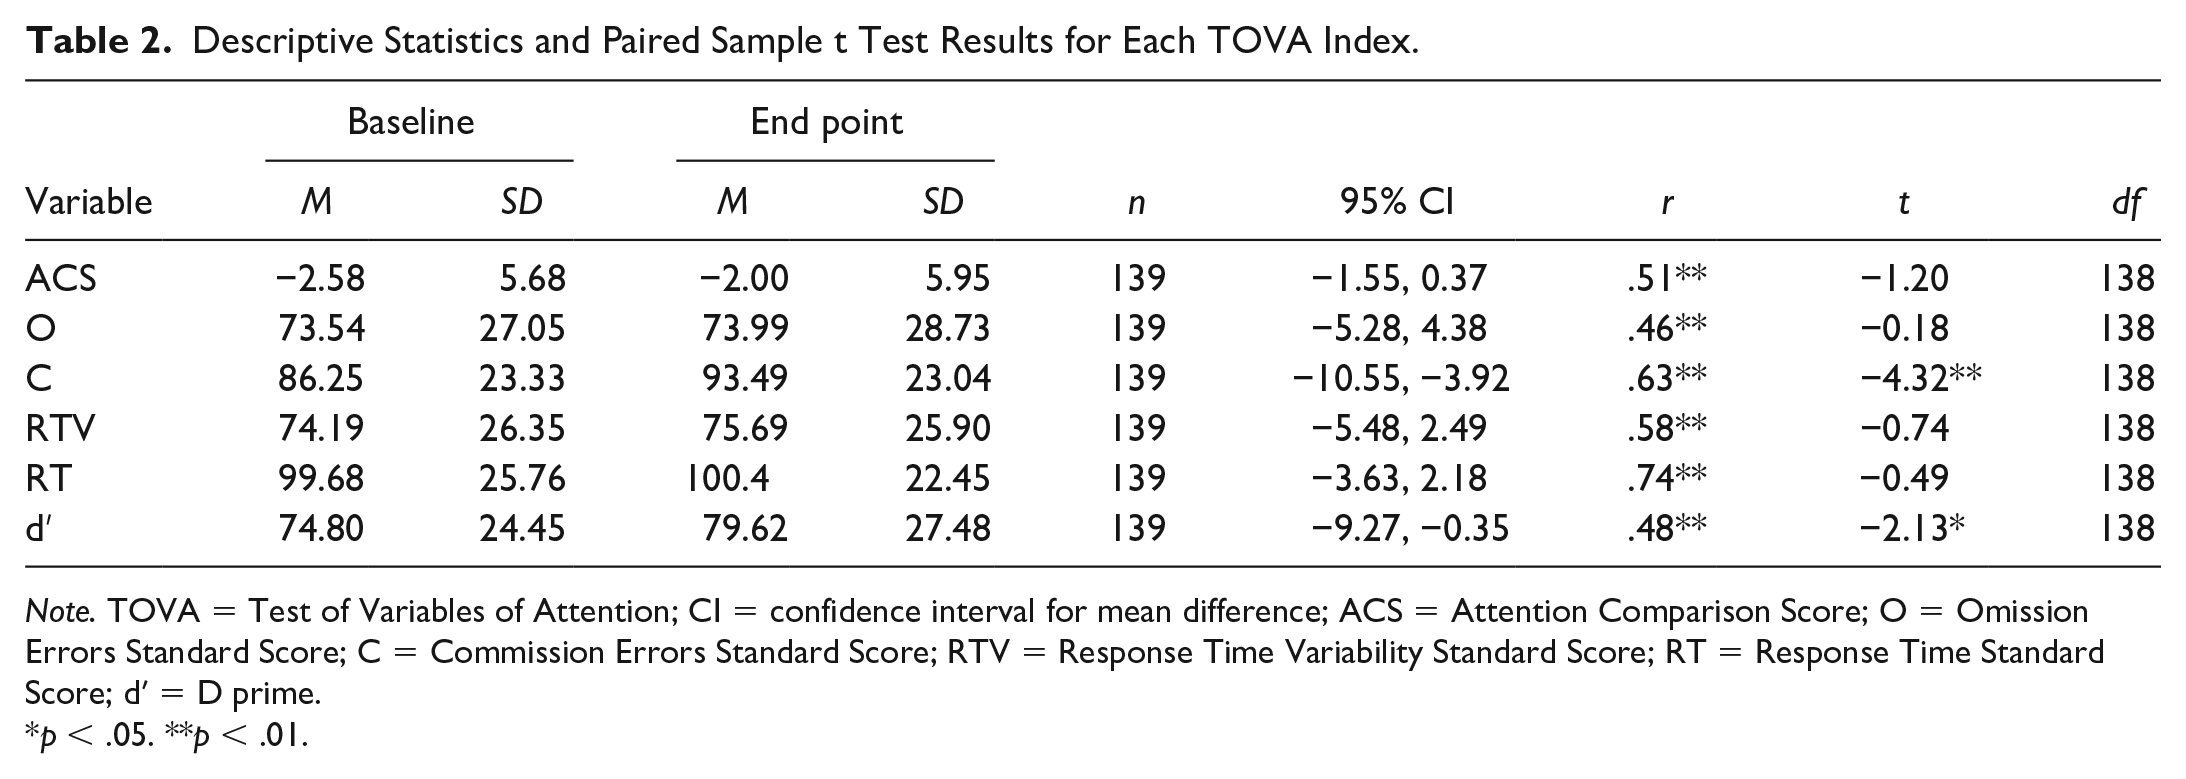
Note. TOVA = Test of Variables of Attention; CI = confidence interval for mean difference; ACS = Attention Comparison Score; O = Omission Errors Standard Score; C = Commission Errors Standard Score; RTV = Response Time Variability Standard Score; RT = Response Time Standard Score; dʹ = D prime.
p < .05. **p < .01.
The Magnitude of Change Between the Baseline Score and the End Point Score in MPH Population.
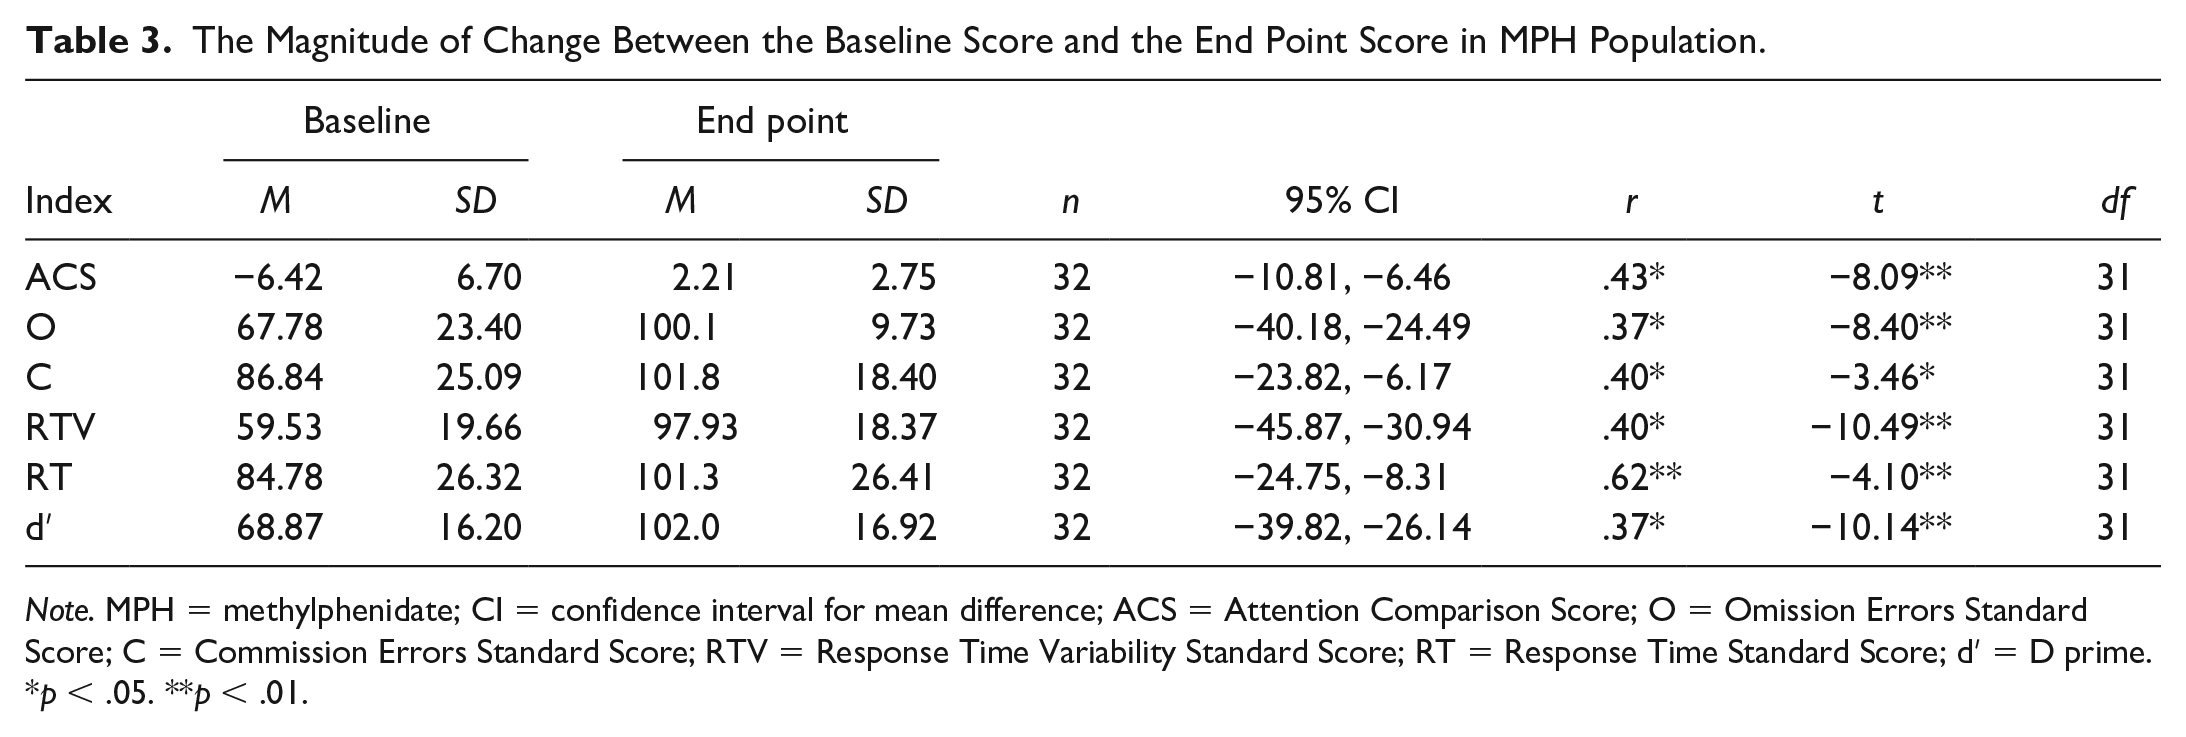
Note. MPH = methylphenidate; CI = confidence interval for mean difference; ACS = Attention Comparison Score; O = Omission Errors Standard Score; C = Commission Errors Standard Score; RTV = Response Time Variability Standard Score; RT = Response Time Standard Score; dʹ = D prime.
p < .05. **p < .01.
The abovementioned analyses were repeated in a subgroup using only data from participants who responded to placebo (n = 75; defined as >25% improvement in CAARS scores). The results remained unchanged (not shown).
Age, gender, and other demographic baseline characteristics were not predictive of a PR (data not shown).
The Proneness of Different TOVA Variables to Display a PR (PR-Proneness)
The tendency of different TOVA variables to exhibit a Placebo response (PR-proneness), is measured in this study by the percentage of participants who exhibited a PR on the same TOVA variable. A comparison of PR-proneness to MPH-proneness (defined using the same logic as described above for PR-proneness) was conducted using a cutoff of an improvement of a magnitude of at least 2 standard deviations as an indicative factor (Figure 1). The test of two proportions used was the chi-square test of homogeneity, unless otherwise specified. The ACS was the most PR-prone of all the TOVA variables. This was also true in the MPH group (albeit much stronger), a statistically significant difference in proportions of .66 (p < .001). However, the drug–placebo difference in proportions became much more evident in several other variables, with statistically significant drug–placebo differences in O (p < .001), RTV (p < .001), and dʹ (p < .001). Due to small sample sizes in C and RT, Fisher’s exact test was conducted, revealing a significant drug–placebo difference in RT (p = .011), but not in C (p = .256) (Figure 1).
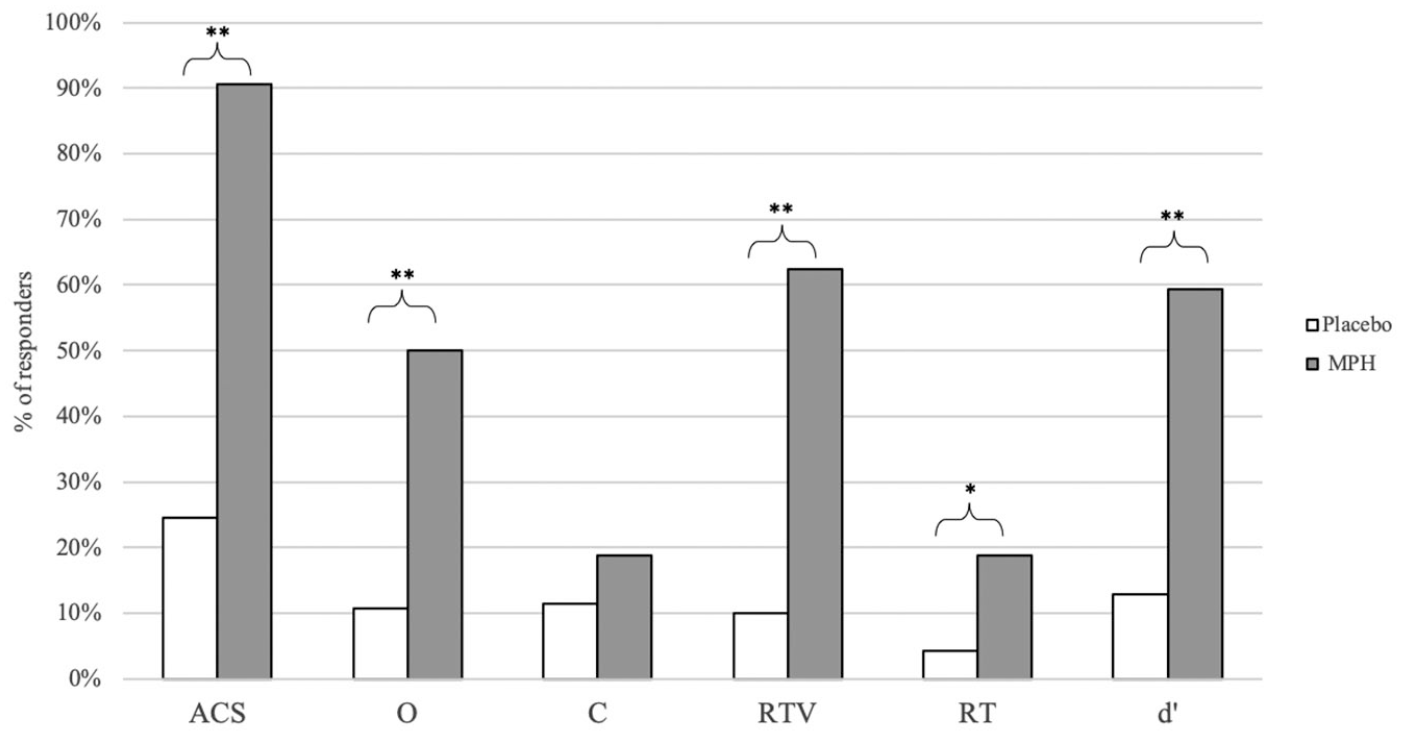
Comparison of placebo response and MPH response according to the TOVA indices.
How Many TOVA Variables Co-Improve in a Response to Placebo Versus MPH?
Table 4 presents the number of co-improved TOVA variables in PR and MPH-R, from one variable to all six. About 15% of the participants displayed a PR in one index, but when PR was defined as a concomitant improvement in >1 indices, the rates decreased rapidly, reaching 0.7% when all six variables were required to be improved significantly (Table 4). In contrast, MPH response resulted in significantly more indices improving concomitantly, had the largest rate of 3 to 4 variables concomitantly, with a prevalence of 31.3% and 28.1%, respectively (Table 4, Figure 2).
Comparison of PR and MPH Response According to the TOVA Number of Indices They Responded by and the ACS.
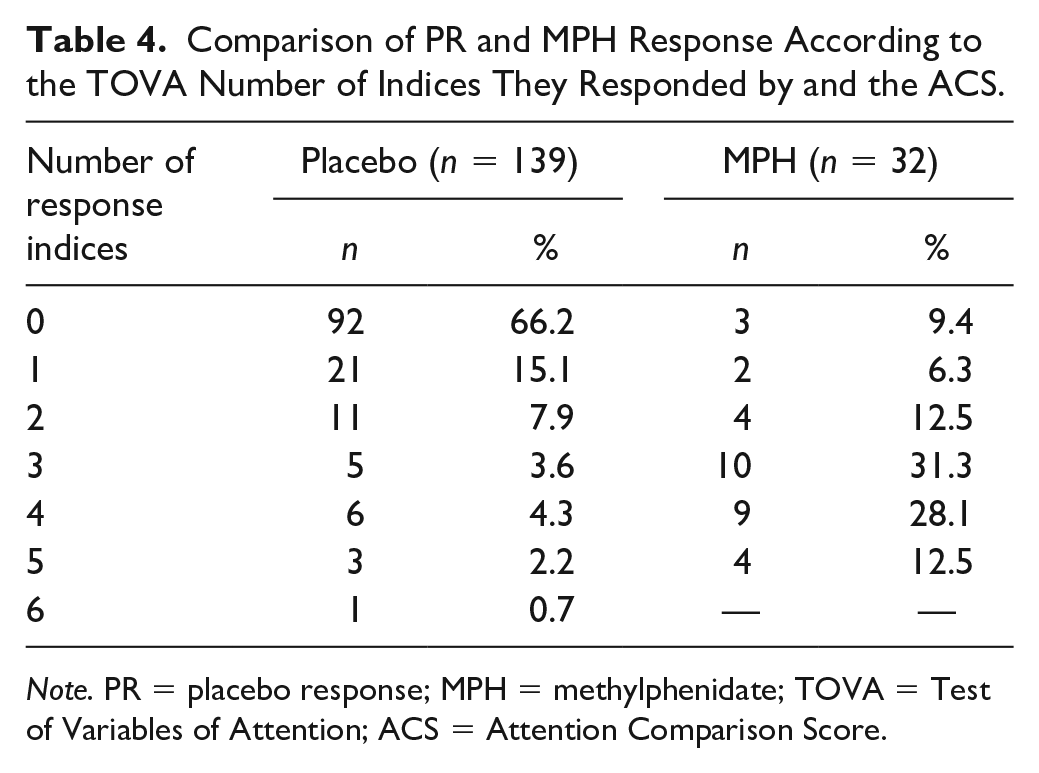
Note. PR = placebo response; MPH = methylphenidate; TOVA = Test of Variables of Attention; ACS = Attention Comparison Score.
An independent-samples t test was conducted to determine whether there were drug–placebo differences in the mean cumulative number of co-improved TOVA variables. MPH mean number of co-improved TOVA variables (M = 3.00, SD = 1.44) was higher than placebo (M = 0.74, SD = 1.32), a statistically significant difference, M = 2.26, 95% CI [1.74, 2.78], t(169) = 8.58, p<.001.
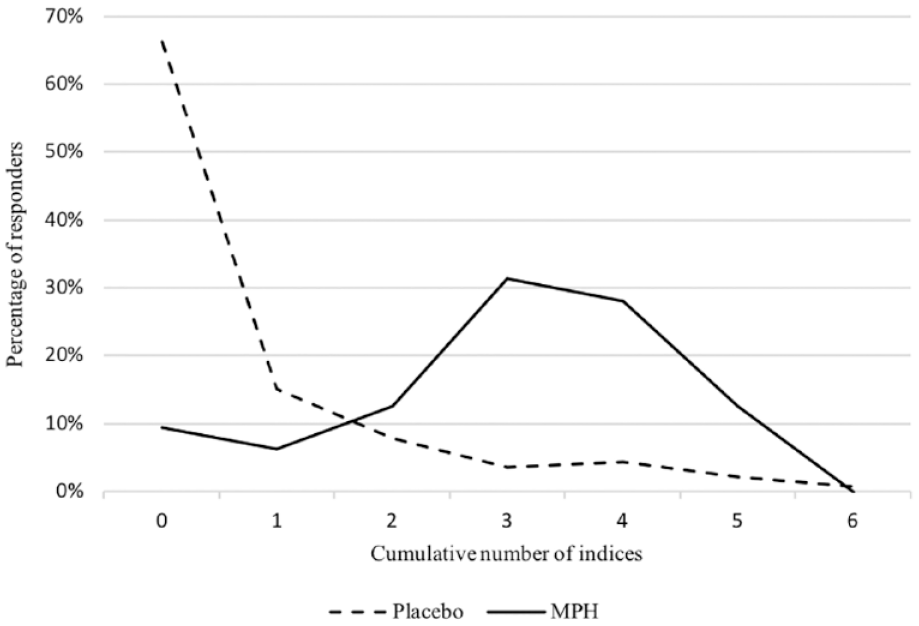
Comparison of PR and MPH response according to the TOVA number of indices they responded to.
Is There a Correlation Between the CAARS-PR and the TOVA-PR?
Table 5 presents the frequencies of PR and nonresponse (NPR) as assessed by each of the TOVA variables in CAARS-Inv responders versus nonresponders. To investigate the relationship between response to placebo according to CAARS-Inv (defined as an improvement of 25%) and response to placebo according to each of the TOVA variables (defined as improvement of 2SD), a chi-square test for association was conducted. There was a statistically significant association between O, PR, and CAARS-Inv PR, χ2(1) = 4.59, p = .032, indicating this association to be weak, φ = 0.182, p = .032.
The Association Between Placebo Response in CAARS-Inv and Placebo Response in TOVA (n = 139).
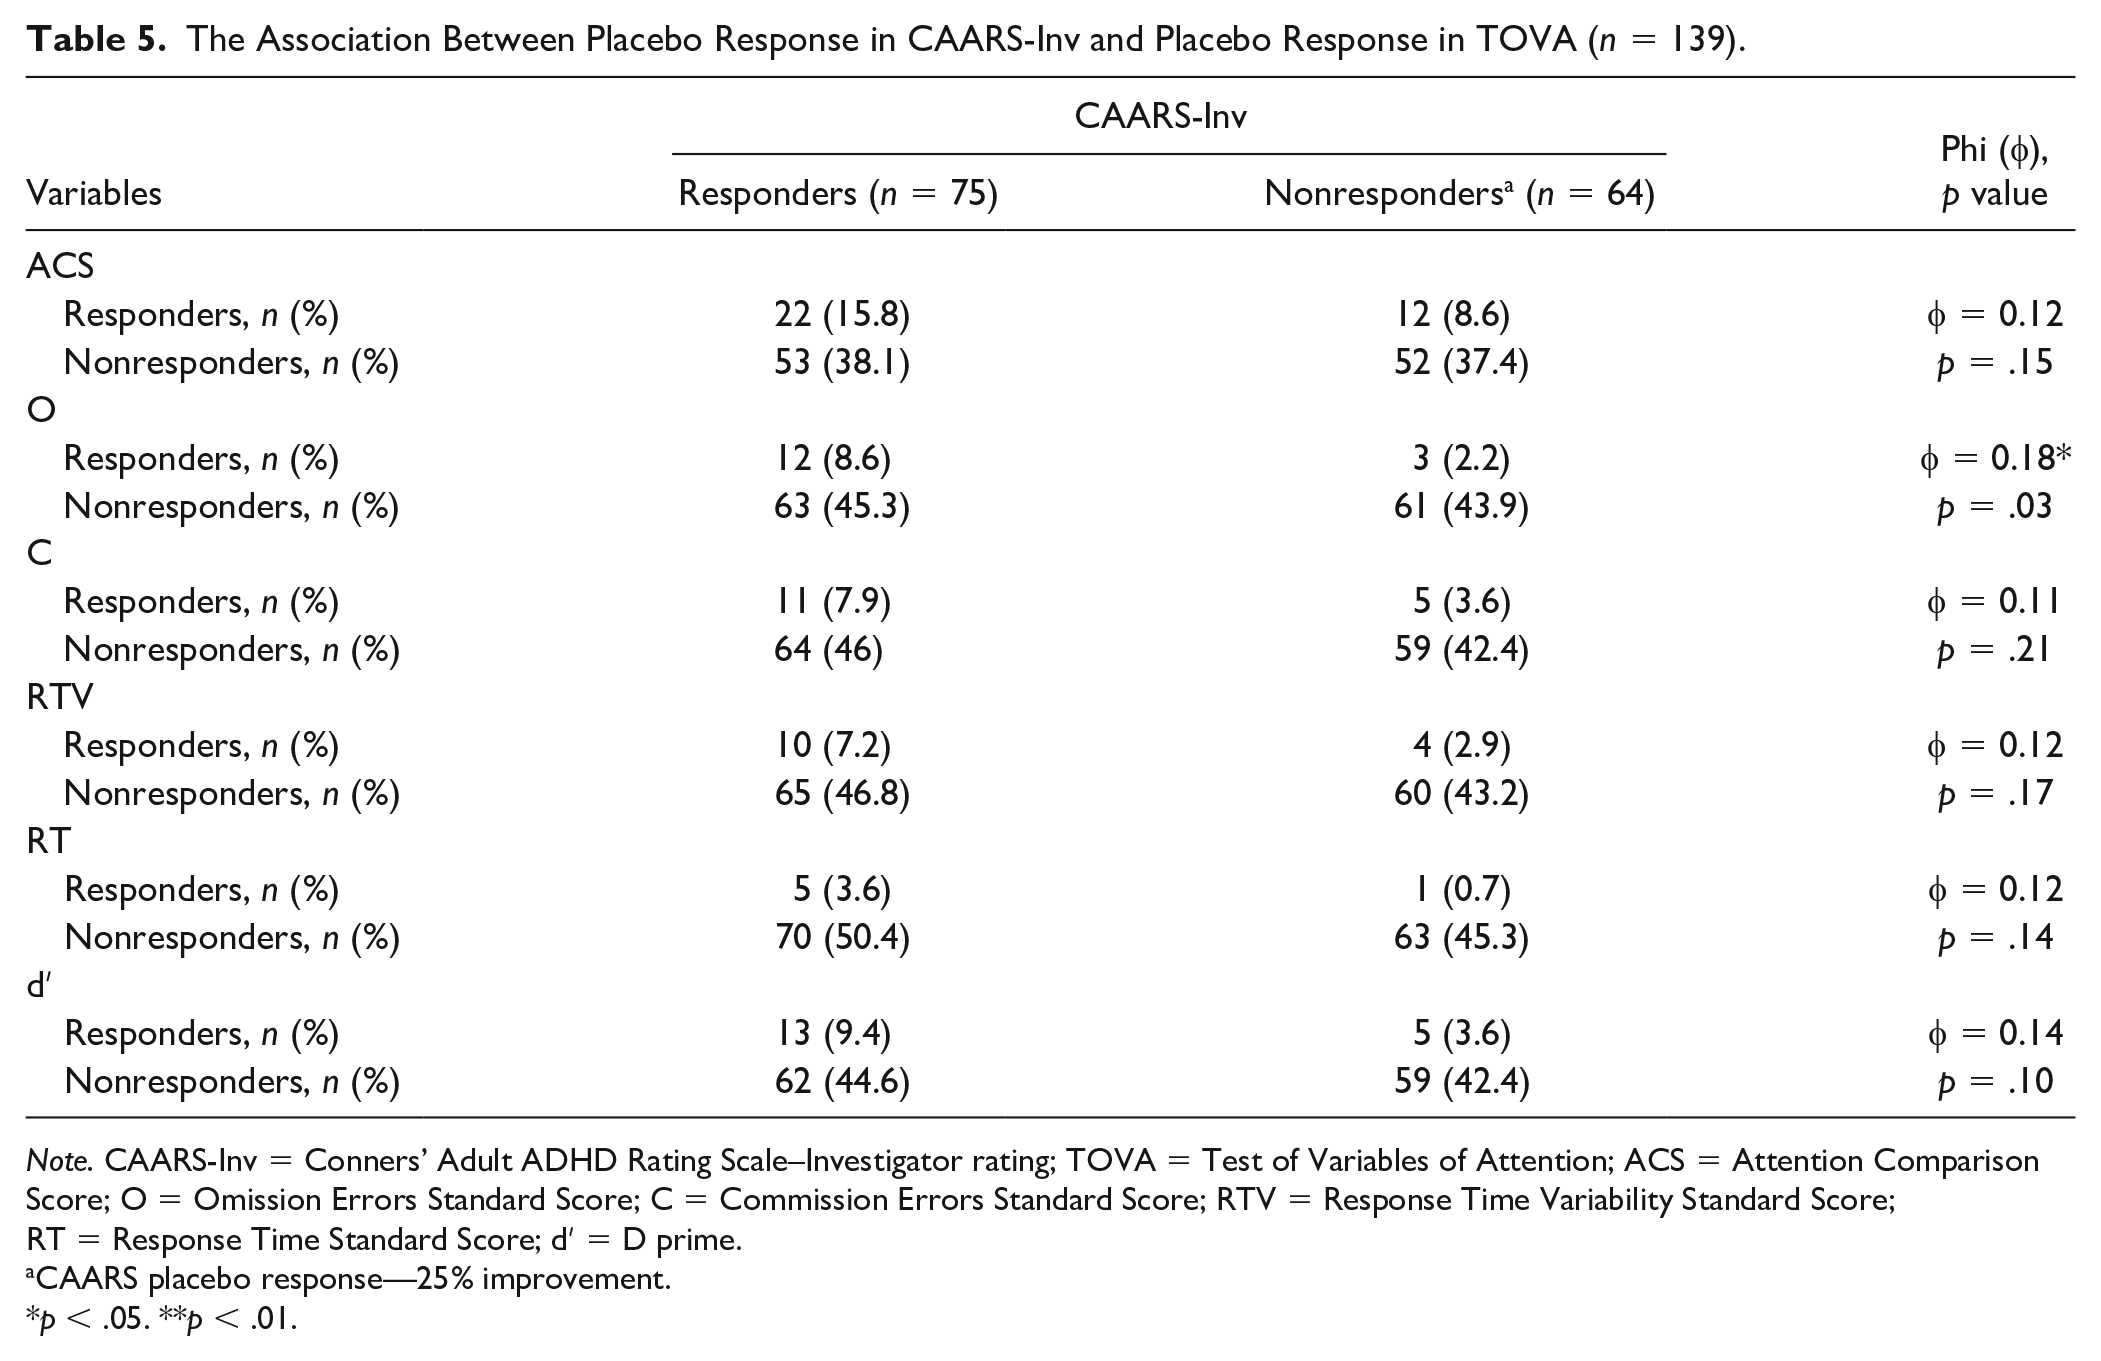
Note. CAARS-Inv = Conners’ Adult ADHD Rating Scale–Investigator rating; TOVA = Test of Variables of Attention; ACS = Attention Comparison Score; O = Omission Errors Standard Score; C = Commission Errors Standard Score; RTV = Response Time Variability Standard Score; RT = Response Time Standard Score; dʹ = D prime.
CAARS placebo response—25% improvement.
p < .05. **p < .01.
Does Age Moderate the Correlation Between the CAARS PR and TOVA PR?
Moderation Model 1 of Hayes PROCESS (Hayes, 2013) was used to investigate whether the relationship between the CAARS-PR and the TOVA-PR (defined as the cumulative number of variables that improved by at least 2SD) was moderated by age. The analysis revealed a significant interaction, b = .0007, SE = 0.0002, t(136) = 3.44, p < .001, indicating that the effect of the TOVA-PR on the CAARS-PR was mediated by age.
The Johnson-Neyman analysis (Johnson & Fay, 1950) was used to identify the value of the moderator (age) where the association between the TOVA-PR and the CAARS-PR became significant. As can be seen in Figure 3, above the age of 31 years the relationship became significantly positive (p ≤ 0.05).
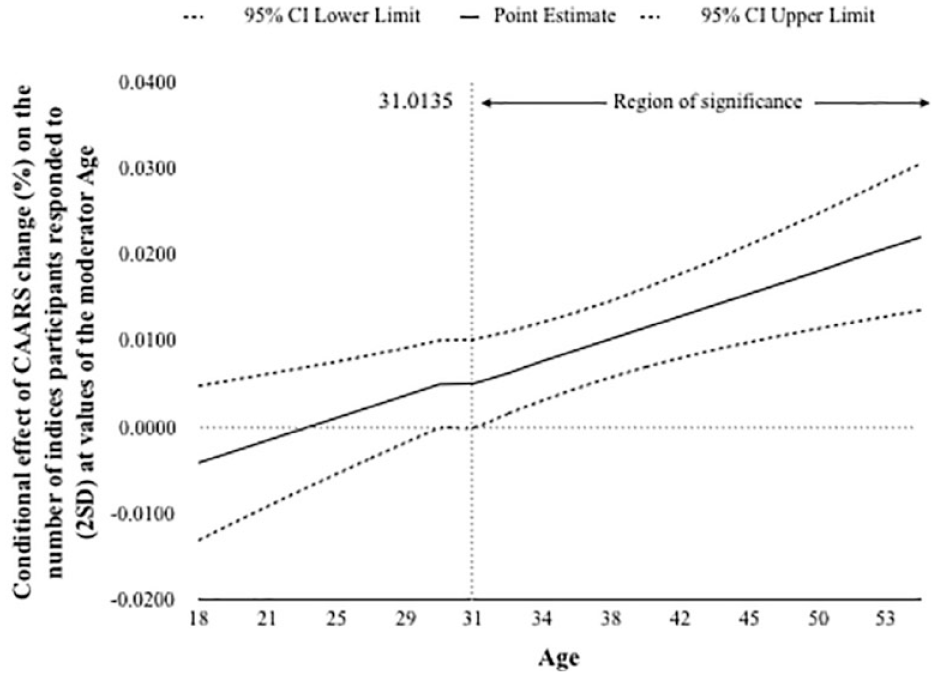
The moderation model: The effect of age on the correlation between the PR of CAARS (%) and the PR of TOVA (measured by indices number).
Discussion
As was mentioned earlier, in a previous study, no statistically significant practice effect was found in any TOVA variable (Rotem et al., 2019). As such, the findings in this study are attributed to the PR.
Major Findings
The identification of the critical indices that comprise the TOVA PR
It was found that the ACS is a less reliable outcome measure due to its high sensitivity to the PR. On the other hand, C and RT are insensitive to both MPH and PRs. Thus, it appears that three indices—O, RTV, and dʹ—should be considered as the prominent markers for the assessment of a specific response to treatment (Tables 2 and 3, Figure 1).
TOVA-PR versus CAARS-PR
The association between the PR in the TOVA (TOVA-PR) and the CAARS (CAARS-PR) is weak and exists only in some of the variables, reflecting the dissociation between the symptomatic response and the change in the degree of the cognitive impairment (Barkley et al., 2006; Gordon et al., 2006). It is of note that only one index, the O that was already mentioned above, correlated significantly with the CAARS-PR (Table 5). Looking at the correlations between CAARS-PR and TOVA-PR according to the participants’ age, it seems that until the age of 31 years there is a dissociation between the two. A statistical correlation between the two PR values is obtained only later in life (Figure 3).
Comparison between the TOVA-PR and the TOVA-MPH-R
As was mentioned above, the TOVA-PR varied among the TOVA variables. TOVA performance under placebo was improved in only a minority of the participants (Table 4), and when improved statistically, the improvement tended to be nonclinically meaningful (Table 2). Concomitant improvement in more than one TOVA variable was uncommon: the mean number of variables changed together was 0.79. In comparison, the TOVA response to MPH was much more consistent: the change from baseline to end point was also clinically meaningful. The mean number of variables concomitantly improved was 3. Furthermore, the TOVA response to MPH was much more pronounced, when using a cutoff point of 2SD (Figures 1 and 2).
It should be noted that the immediate response to MPH is likely to include also a PE. However, the significant difference between the MPH-R and the PR according to the TOVA was beyond the statistical level and reached the normal range, supporting the possibility of a meaningful efficacy.
Interpretation of the Findings
The analysis of the PR according to the change in different variables from one visit to the next revealed, too, that C, dʹ and ACS showed significant improvements under placebo while the other indices did not. It should be noted, however, that these changes were statistically significant, but their clinical relevance, according to the TOVA definitions, was less significant, as they remained in the abnormal to borderline range. It could be concluded that according to the small magnitude of the response achieved by placebo, the TOVA PR is not clinically meaningful, despite the statistical significance of the changes.
The same picture is found when the proneness of the different variables to PR was studied. A proneness to exhibit a PR is the percentage of participants who exhibited a PR in the specific variable. It is suggested to be an indicator of the insensitivity of a variable to discriminate between a PR and a medication effect. Again, a significant difference was found among the variables. It appears that ACS remained the most prone to exhibit a PR. C and dʹ variables were shown to be more sensitive to placebo. In contrast, RT was found to be the most resistant-to-placebo variable (Figure 1).
Exploring the different variables, the significant difference between the sensitivity of ACS compared with the indices is prominent and, marks it as a sole nonspecific indicator. It suggests that the ACS, the composite score, is a less reliable variable as a medication-response measurement than all the TOVA variables. It also implies that the PR as it is measured by the ACS is of a less specific nature, as it is a general composite score. As such, and in contrast to the TOVA indices, it does not reflect any specific executive function.
Trying to figure out the resistance of RT and C, it should be noted that these findings are relevant to adults, who were the study population. C is an index of impulsivity; thus, it is reasonable to assume that the age-related decline in hyperactivity impulsivity is responsible for the loss of its sensitivity to therapeutic interventions (Biederman et al., 2000). It is likely that the C, as well as the C PR, is more sensitive during childhood and adolescence. Identifying age-dependent differences in test–retest in all TOVA measures, including C, merits a further investigation.
The apparent insensitivity of RT to PR could be related to its being a low-level executive function (EF) (Coghill et al., 2018). Furthermore, as this study was conducted in adult population, it could be that the response time and not the impulsivity may be the main weakness, suggesting that this index becomes more stable in adults, than in younger population. On the other hand, O, dʹ, and most of all RTV tend to be associated with high leveled EFs (Coghill et al., 2018). It is suggested that this may explain their higher capacity to discriminate between PR and drug response.
O was also the index, which was best correlated with the changes in CAARS. Thus, it is suggested that O, as the index of sustained inattention, is a better correlate of the CAARS symptomatic measurement.
The weak association between the TOVA-PR and the CAARS-PR could reflect another aspect of the dissociation between cognitive impairment and clinical symptoms, which is consistent with the literature (Hall et al., 2016; Wang et al., 2015). It could also reflect the difference between the use of objective measures as opposed to subjective ones. It seems that subjective measures are more prone to respond to placebo than the objective, cognitive measures. It may be related to the inconsistency of subjective self-assessment of the response.
Coghill et al. (2019) as well as Weiss et al. (2018) assessed the relationships between treatment-associated changes in different measures of ADHD that reflected symptoms and functional impairments. They showed that significantly fewer participants responded functionally compared with symptomatically, and that different measures captured “distinct but interconnected aspects” of treatment response. Van Lieshout et al. (2019) showed that the outcomes of ADHD varied among the neurocognitive measures from “catching up” to impaired. They concluded that change in neurocognitive functioning was not related to ADHD outcomes and therefore posed a question about the etiological link between neurocognitive deficits and ADHD outcomes. These findings indicate that ADHD is a multidimensional construct that comprises separate, partially associated, though inter-linked domains, including symptoms, cognition, and functional status. Thus, it is suggested that different types of measurements are needed to capture all of these aspects of the disorder.
Looking at the correlations between CAARS-PR and TOVA-PR according to the participants’ age, it seems that until the age of 31 years there is no correlation between the two. A statistical correlation between the two PR values appears only later in life (Figure 3). It was suggested already that the cognitive impairment is less sensitive to environmental factors, compared with the symptoms (Buitelaar et al., 2012). It is possible that the older the adults become, they have to deal with more demands in their life, including occupational, familial, and social factors. The putative larger load on their executive functions, as well as being less flexible, and in a worse shape to use compensatory mechanisms, leads to a higher synergy between the symptoms and the cognitive impairment.
TOVA-PR versus MPH-PR
As expected, in contrast to placebo, after an MPH challenge, the extent of the change of the different TOVA variables was much larger. The proneness of the TOVA variables to have a response to MPH was also much more pronounced. An interesting difference between the PR and the MPH response is the variability of response among the different indices in the MPH group in contrast to the “flat” PRs, which again might point to the weakness of this response. A graphic summary of these findings is depicted in Figure 4.
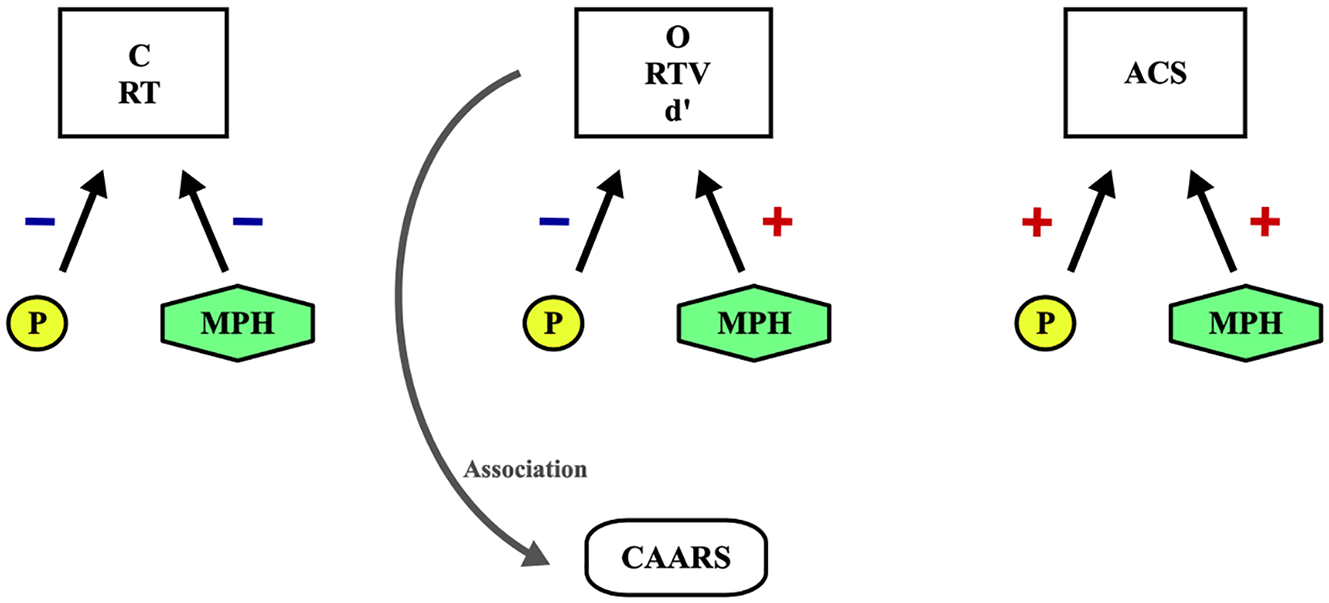
The efficacy of the different TOVA variables.
It seems that TOVA variables differ in their sensitivity to PR, as well as to MPH, and thus should not be counted on the same level of importance. More than that, such differences may reflect a variability in the sensitivity to PR of the different executive functions, as they are represented by the distinct variables of TOVA.
The importance of a composite score
As shown above, there is a pronounced variability in the response to therapeutic interventions among the standard scores and there is a persistent similar sensitivity and specificity of “the usual suspects” (O, RTV, dʹ). Thus, it is suggested that a larger emphasis on these variables and a re-calculation that will consider their reliability may improve the composite score. It is suggested that more studies should be done in an attempt to clarify the importance of each TOVA variable, their meaning in ADHD, and a possible creation of a more representative composite score.
Limitations
The major limitations of the study are the relatively small sample size, the retrospective nature of the study, and the comparison between responses to different measures that were obtained in different context.
The response to MPH was measured only once, during a one-time challenge; thus, it could create some bias, including a PR that is immersed in the total response.
We referred only to MPH response, with no comparison to other stimulants. However, MPH was the gold standard for ADHD treatment in Israel during these years.
Conclusion
The PR according to the TOVA is weaker than the CAARS-PR, and their interaction is partial. On the same time, the TOVA response to MPH, compared with placebo, may be understood as a more specific and authentic response; the indices’ sensitivity to inattention compared with the nonspecific sensitivity of the composite score makes this specific score much more vulnerable to PR. It seems that the TOVA could be used to reduce PR obtained by clinical ratings. It is also suggested that the indices, and not the ACS, should be considered, and that a composite score should be re-calculated of the important indices in an attempt to better discriminate between PR and drug response. From the clinical perspective, it is suggested that the TOVA, as an objective measure, could guide the clinician in the selection of the optimal pharmacological treatment. As such, it is recommended to be included in the pretreatment assessments. Furthermore, large-scale studies are needed to show the benefit of objective measures in clinical practice and clinical trials of novel anti-ADHD agents.
Footnotes
Declaration of Conflicting Interests
The author(s) declared no potential conflicts of interest with respect to the research, authorship, and/or publication of this article.
Funding
The author(s) received no financial support for the research, authorship, and/or publication of this article.