






Abstract
Objective:
Positive attitudes toward one’s clinical condition may contribute to resilience and well-being. Although qualitative studies suggest that individuals with attention-deficit/hyperactivity disorder (ADHD) may perceive positive aspects of their condition, no quantitative measure has been available to assess these attitudes. This study aimed to develop a self-report measure of positive attitudes toward ADHD and examine their associations with ADHD symptom dimensions.
Method:
Across three independent adult samples, participants completed measures assessing ADHD symptom frequency and attitudes toward their own ADHD. Positive attitudes were assessed using the newly developed Positive Attitudes Toward ADHD Scale (PATAS), which demonstrated high test–retest reliability (r = .89). The samples included participants from two language groups and an international sample spanning 24 countries.
Results:
Greater frequency of hyperactive/impulsive symptoms was consistently associated with more positive attitudes toward ADHD across all three samples. Inattention symptoms showed a tendency toward a negative association with positive attitudes, although this pattern was not consistent across samples. Participants also varied considerably in how positively they perceived their ADHD.
Conclusion:
Individuals with ADHD differ substantially in their attitudes toward their condition, and these attitudes are differentially associated with ADHD symptom dimensions. Hyperactive/impulsive symptoms were consistently associated with more positive attitudes, whereas the association with inattention was less consistent. Further research is needed to clarify the mechanisms underlying these associations and determine whether they can inform individually tailored interventions.
Keywords
Introduction
Attention-deficit/hyperactivity disorder (ADHD) is a neurodevelopmental condition with a childhood onset (Faraone et al., 2021) that has high persistence rates into adulthood (Sibley et al., 2016). It is characterized by developmentally inappropriate symptoms of inattention and/or hyperactivity/impulsivity (American Psychiatric Association, 2013), and it has been shown to significantly impact various aspects of an individual’s life. Globally, ADHD affects an estimated 5% of youth and 2% of adults (Faraone et al., 2021). To date, mainstream research studies have explored the negative impacts of the condition, leading to a portrayal of it as maladaptive, dysfunctional, and costly (Cortese et al., 2023). For example, studies have found an association between ADHD and cognitive control deficits (Pitzianti et al., 2016, 2020; Willcutt et al., 2005), as well as difficulties with emotional regulation (Barkley, 2015; Beheshti et al., 2020; Graziano & Garcia, 2016). Furthermore, cohort and clinical studies alike have identified its disruptive effects on daily-functioning and its negative impacts on long-term development (Harpin et al., 2013; Sjöwall & Thorell, 2019). ADHD has also been found to be associated with challenges in family and peer relationships (Ros & Graziano, 2017), an increased risk of school bullying (Becker et al., 2016; Caci et al., 2014; Lebowitz, 2013), and academic and professional struggles (Fleming et al., 2017). In general, ADHD has been linked to diminished quality of life across physical, emotional, social, and academic domains (Coghill & Hodgkins, 2015; Danckaerts et al., 2009; Lee et al., 2016; Pongwilairat et al., 2005).
The recent rise of the neurodiversity movement has encouraged researchers to explore beyond just the negative and consider the more positive aspects of living with ADHD (Sonuga-Barke & Thapar, 2021). Specifically, positive attitudes toward one’s clinical condition have been shown to contribute to increased resilience, well-being, and self-compassion, particularly in the context of mental health (Baul et al., 2023; Kotera et al., 2020; Latifian et al., 2024; Mesman et al., 2021; Wu et al., 2020). In line with these claims, qualitative studies exploring the personal experiences and subjective viewpoints of individuals with ADHD have found evidence of themes associated with more positive aspects of ADHD (Holthe & Langvik, 2017; Mahdi et al., 2017; Nordby et al., 2023; Schippers et al., 2022; Sedgwick et al., 2018). For example, Holthe & Langvik, 2017 interviewed successful individuals with ADHD and found that they valued characteristics in themselves, which they viewed as ADHD-related, including creativity, determination, a keen interest in novelty, adventurousness, and a willingness to take risks. Whether individuals perceived ADHD as either “a gift” or “a curse” influenced their understanding of their condition and its impact on their lives. Similarly, Schippers et al. (2022) performed a qualitative analysis of responses from a larger and more diverse sample of individuals with ADHD and found various aspects endorsed by participants as advantageous, including creativity, dynamism, flexibility, social skills, and higher-order cognitive skills like “quick-thinking” and attention to detail. We note that qualitative reports that highlight favorable characteristics associated with ADHD are all restricted to self-report measures. Therefore, these should be considered addressing individuals’ attitudes or opinions toward their own condition, rather than necessarily reflecting objective behavioral or cognitive estimate regarding adaptive or positive traits.
Evidence for positive aspects of ADHD derived from quantitative research specifically examining associations between ADHD and advantageous traits or characteristics remains limited. Some studies have reported associations between ADHD traits and creativity or divergent thinking (Ek et al., 2007; Groen et al., 2020; Grotewiel et al., 2022; Hoogman et al., 2020), although findings are inconsistent and appear sensitive to measurement approaches, sample characteristics, and study design. In addition, emerging work has suggested that individuals with ADHD may exhibit heightened sensory processing sensitivity, potentially reflecting increased responsiveness to relevant environmental information (Panagiotidi et al., 2018, 2020; Schippers et al., 2024). Overall, however, quantitative evidence for systematically positive attributes associated with ADHD remains mixed and conceptually fragmented.
Taken together, the qualitative studies reviewed thus far provide evidence that some individuals with ADHD associate their condition with desired and favorable qualities. However, little is known about individual differences in how people with ADHD perceive their condition or about the characteristics that might predict more positive attitudes. In this work, we explored this question by focusing on the influence of symptom profile (frequency and type) on the extent to which an individual views their ADHD more or less positively. There is substantial between-subject evidence indicating that higher frequency and severity of ADHD symptoms, including both inattention and hyperactivity/impulsivity, are associated with greater functional impairment and more negative life outcomes (e.g., Barkley, 2015; Faraone et al., 2015, 2021; Willcutt et al., 2012). At the same time, experimental and within-subject studies have shown that increased motor activity may, under specific conditions, be associated with improved cognitive performance or attentional regulation, particularly for individuals with ADHD (e.g., Kofler et al., 2016; Rapport et al., 2008; Sarver et al., 2015).
To test this hypothesis, we first designed a novel self-report questionnaire called the Positive Attitudes Toward ADHD Scale (PATAS). This scale was specifically constructed to measure individuals’ positive perceptions about their own ADHD based on themes identified in the qualitative studies previously discussed. Next, we recruited a discovery sample followed by two validation samples. We estimated the associations between symptom frequency across the two ADHD symptom dimensions (inattention and hyperactivity/impulsivity) and positive attitudes toward one’s own ADHD among adults.
Method
Participants
In-Lab Discovery Sample (Sample 1)
Eighty-four young adults (Table 1) completed the study online in return for course credit or a payment of 20 NIS (~5 Euros). Participants were asked to provide documentation of their prior ADHD diagnosis, including the name and credentials of the diagnosing clinician. These materials were reviewed to ensure that the diagnosis originated from a licensed mental health professional. Participants were included only if they reported the absence of neurological disorders (e.g., head injuries, epilepsy), alcohol or drug addictions, ASD, schizophrenia, severe visual impairments, any other co-occurring mental disorder and age below 18. The socioeconomic status of our study participants was inferred from their upbringing locations, as determined by city rankings provided by Israel’s Central Bureau of Statistics. Rankings range from 1 (lowest score) to 10 (highest score); participants reflected the spectrum of socioeconomic conditions (M = 7.08, SD = 1.4, range: 3–10).
Sample Characteristics Across Three Samples.
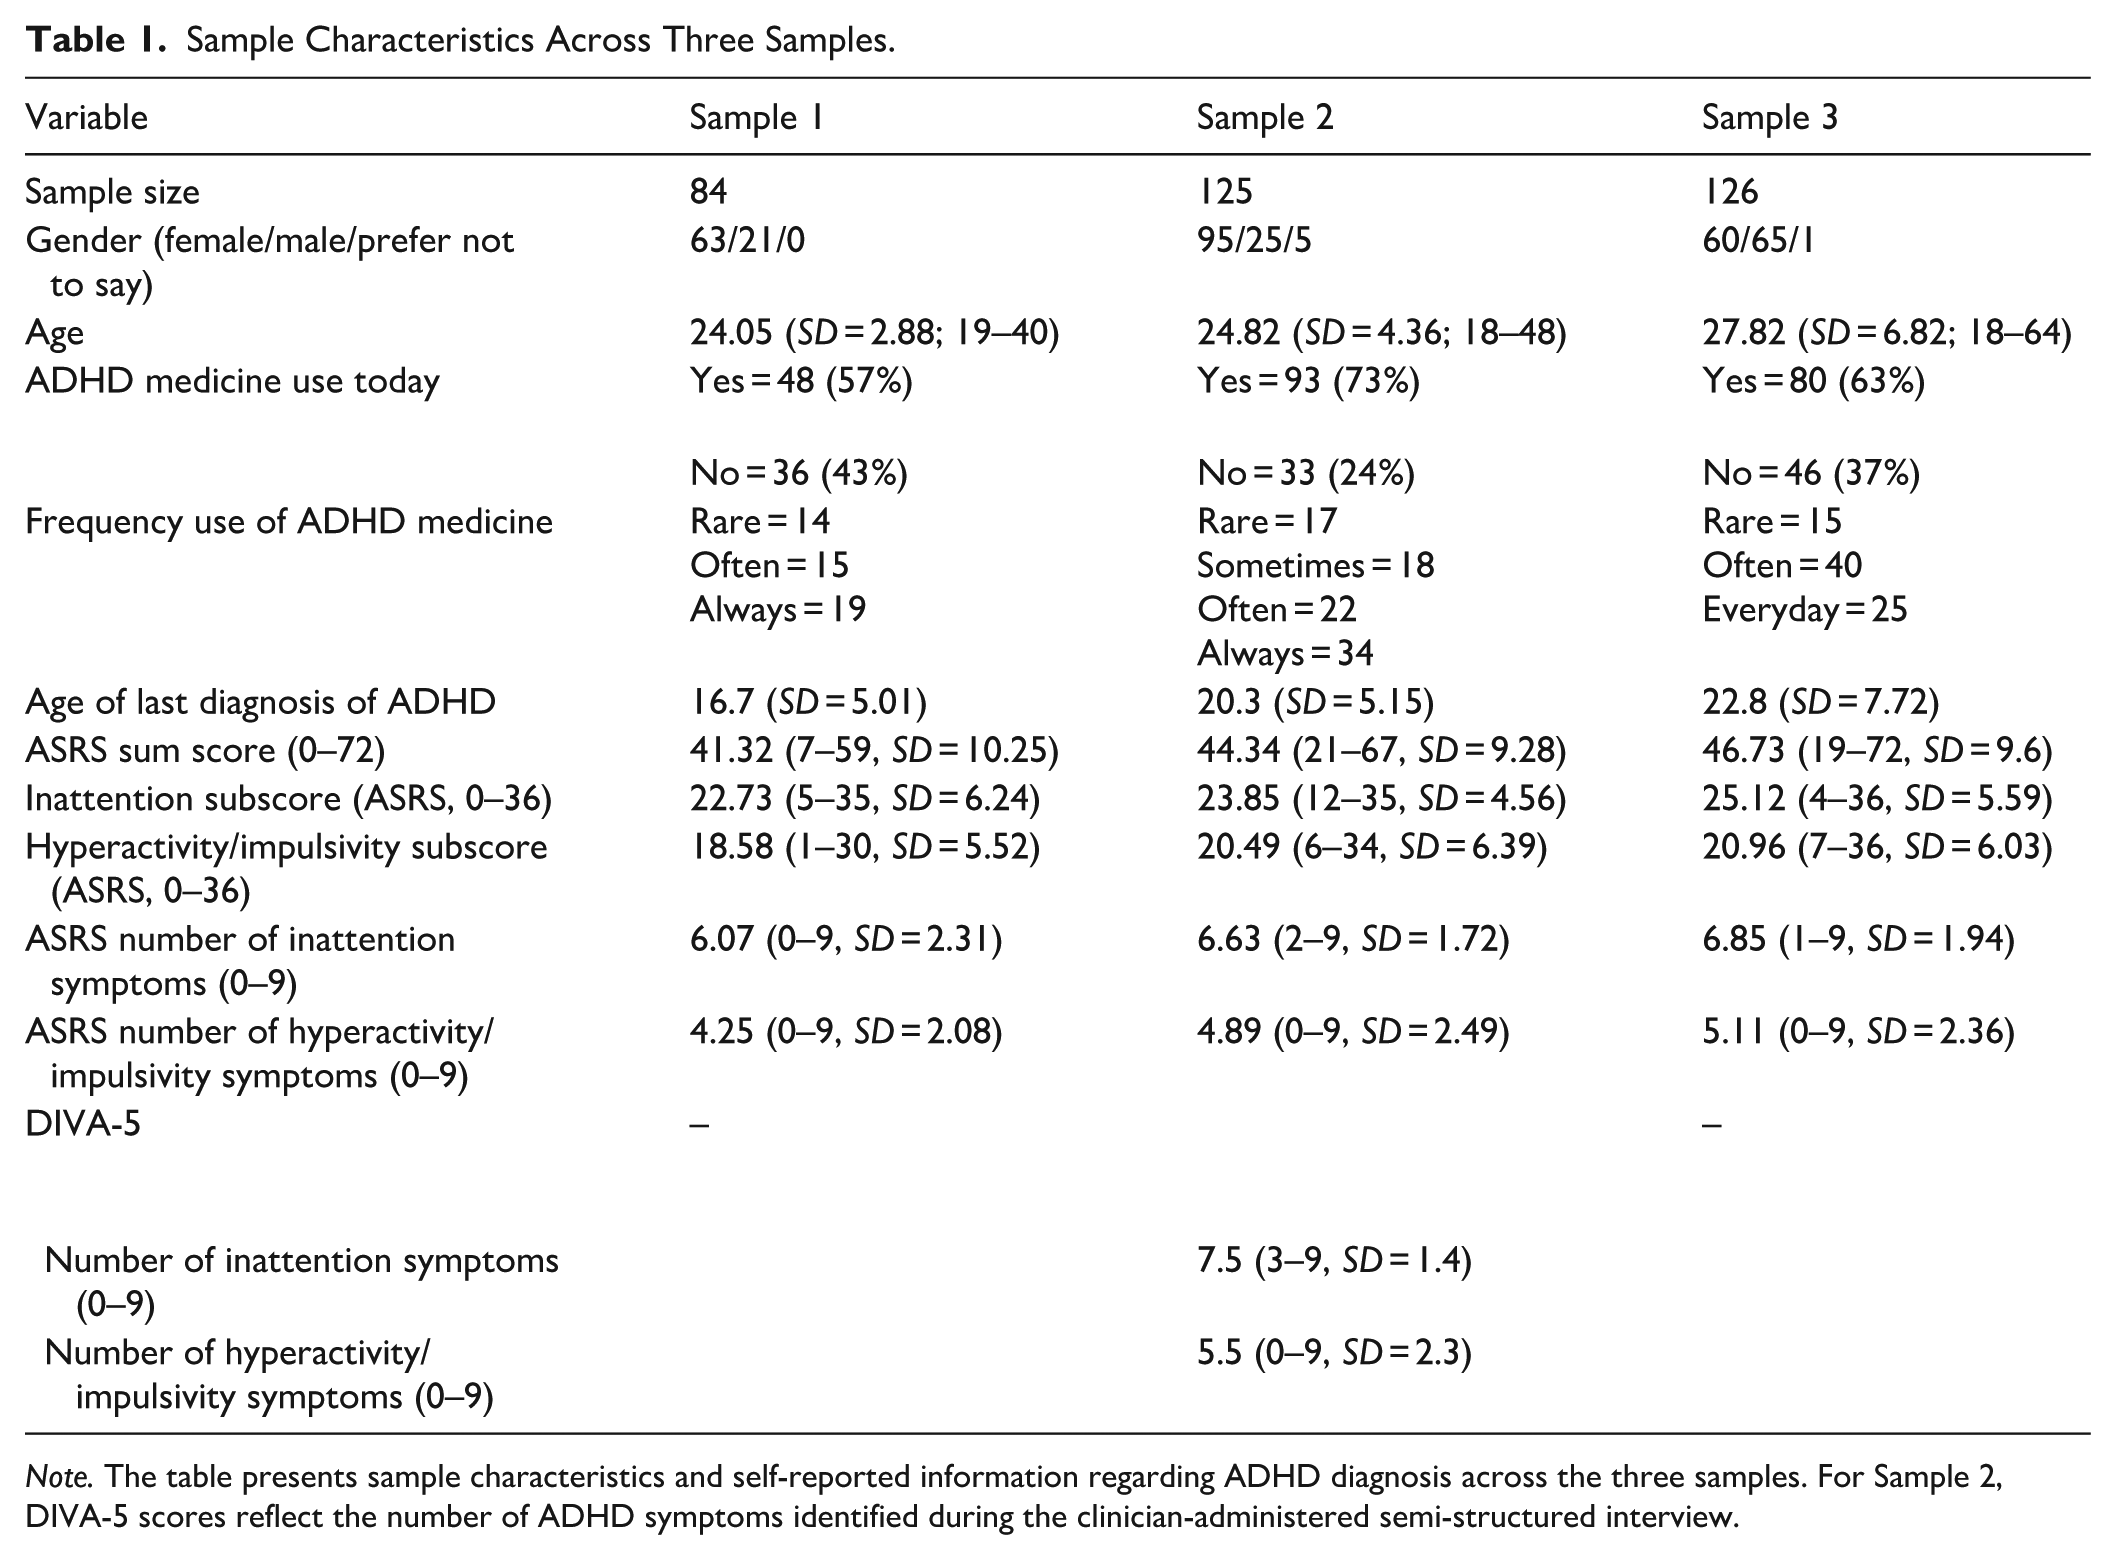
Note. The table presents sample characteristics and self-reported information regarding ADHD diagnosis across the three samples. For Sample 2, DIVA-5 scores reflect the number of ADHD symptoms identified during the clinician-administered semi-structured interview.
In-Lab Clinical Replication (Sample 2)
One hundred and twenty-five participants participated in the study (see Table 1 for sample characteristics) in return for course credit or a payment of 40 NIS (~10 Euros). Inclusion criteria required a formal ADHD diagnosis by a licensed mental health professional (i.e., psychiatrist/clinical psychologist; note that in Israel, this authority is restricted to these specialists that above their practice license also hold a specific training in ADHD diagnosis). Participants were asked to provide documentation of their prior ADHD diagnosis, including the name and credentials of the diagnosing clinician. These materials were reviewed to ensure that the diagnosis originated from a licensed mental health professional. Furthermore, participants were included only if they reported the absence of neurological disorders (e.g., head injuries, epilepsy), alcohol or drug addictions, ASD, schizophrenia, severe visual impairments, any other co-occurring mental disorder and age below 18. One hundred and ninety-one participants were within criteria and were invited for the study. From these participants, 33 participants were above the cutoff in cannabis/alcohol self-report measures (Alcohol Use Disorder Identification Test, AUDIT [Babor et al., 2001], Cannabis Use Disorder Identification Test-Revised, CUDIT-R [Adamson et al., 2010]), indicating heavy use, and were excluded from the study. Furthermore, to validate that all participants met ADHD criteria at time of testing, participants were further assessed using the Diagnostic Interview for ADHD in Adults (DIVA-5; Kooij et al., 2019), a semi-structured clinical interview that follows DSM-5 criteria for diagnosing ADHD. The interviews were conducted by graduate students in clinical PhD training and undergraduate students in the last year of their program, under the direct supervision of a clinical psychologist specializing in ADHD (the last author N.S), ensuring diagnostic consistency. These clinical interviews revealed 22 participants that did not meet the clinical cutoff for ADHD and were therefore omitted, 11 more participants did not complete the PATAS and other self report questionnaires and therefore were excluded from the study (see Table S1 for self report sample characteristics).
Online Replication (Sample 3)
One hundred and twenty-six participants (see Table 1 for sample characteristics and Table S2 for country of residence at time of testing) completed the online study in exchange for a payment of ~1.5 Euros. Participants were recruited from the Prolific platform and reported being fluent in English. Only participants who reported having an ADHD diagnosis were included in the study. To gauge reporting validity, participants were asked to provide free-text information regarding their reasons for seeking ADHD diagnosis, the current type, frequency, and dosage of treatment, details about their assessment processes, and any additional psychiatric diagnoses. Participants were tested in two different sessions, up to 2 weeks apart. Of the 149 participants who completed Session 1, 12 of them did not answer the free-text questions about ADHD condition and diagnosis process, and were removed from the analysis. Of the 137 participants who completed Session 1,126 also completed the second session (average of 9.33 days apart, range: 6.8–14.0 days); only participants who completed both sessions were included in the analysis. We asked participants to report co-occurrence of additional mental health conditions, including depression (53%), anxiety (50%), obsessive-compulsive disorder (13%), autism spectrum disorder (9%), post-traumatic stress disorder (9%), and eating disorders (9%), while schizophrenia was not reported (0%). Additionally, 23% preferred not to disclose their condition, and 7% reported no co-occurring.
Measures
Positive Attitudes Toward ADHD
Attitudes toward ADHD were measured using a newly developed scale designed to assess perceptions of the disorder, particularly beliefs in its positive and adaptive aspects. To develop the items, two authors (M.H. and N.S.) generated as many as possible items that were believed to reflect positive aspects associated with ADHD. These resulted in 20 items that were constructed based on themes reported in qualitative studies examining possible positive aspects of ADHD from the perspective of adults with the condition (Holthe & Langvik, 2017; Mahdi et al., 2017; Nordby et al., 2023; Schippers et al., 2022; Sedgwick et al., 2018). These themes included creativity and divergent thinking (Holthe & Langvik, 2017; Mahdi et al., 2017; Nordby et al., 2023; Schippers et al., 2022; Sedgwick et al., 2018), cognitive flexibility (Nordby et al., 2023; Schippers et al., 2022), energy (Holthe & Langvik, 2017; Mahdi et al., 2017; Sedgwick et al., 2018), resilience (Nordby et al., 2023; Sedgwick et al., 2018), adventurousness and curiosity (Holthe & Langvik, 2017; Nordby et al., 2023), authenticity (Mahdi et al., 2017), success due to being diagnosed with ADHD (Holthe & Langvik, 2017), and sensory processing sensitivity (Schippers et al., 2024). Items that seemed to the authors poorly articulated or repetitive out of the initial 20 items were omitted/merged with other items, resulting in 13 items that the authors believed were well captured positive aspects of ADHD while maintaining clarity and avoiding redundancy. The measure instructions asked participants to rate their agreement with each statement on a 5-point Likert scale, ranging from 0 (“Not at all”) to 4 (“Very much”). The PATAS was initially constructed in Hebrew by N.S and M.H. To generate an equivalent English version, we performed a back translation of the PATAS into English. Specifically, a professional language editor native in English and fluent in Hebrew translated the PATAS items to English. Two students then translated from English back to Hebrew, and slight adjustments were made to minimize gaps. The Hebrew and English versions are publicly available (https://osf.io/7sd8x/).
ADHD Symptoms
Self-Report Measures
The ASRS-v1.1 Symptom Checklist was used to assess ADHD symptom burden in adults. This 18-item measure aligns with DSM criteria, with nine items evaluating inattention and nine assessing impulsivity/hyperactivity. Part A consists of six items validated as a screening tool for identifying individuals at risk for ADHD, while Part B includes 12 additional items that provide a broader assessment of symptom frequency. Participants rated each item based on how often they experienced the symptom in the past 6 months, using a scale from 0 (never) to 4 (very often). As this study focused on overall ADHD symptom burden rather than subtype classification, total scores were calculated by summing responses across all 18 items, yielding a range of 0 to 72. Table 1 presents the ASRS sum score for all three samples, and the results section reports analyses using this score. However, Table 1 also provides sample characteristics based on symptom count, estimated according to ASRS item cutoffs. Specifically, items 1 to 3, 9, 12, 16, and 18 were considered present if rated as “sometimes,” “often,” or “very often,” while the remaining items required a rating of “often” or “very often” to be considered present. ASRS symptom subtype scores ranged from 0 to 9, with a threshold of 6 or higher in either category indicating significant symptom presence. The ASRS-v1.1 has demonstrated strong internal consistency (Cronbach’s α = .88–.89) across community and clinical samples, regardless of administration method, with test–retest reliability ranging from 0.58 to 0.77 (Adler et al., 2018; Kessler et al., 2005; van de Glind et al., 2013).
DIVA-5 Interview for DSM-5 ADHD Symptoms
Participants in Sample 2 underwent an ADHD diagnostic evaluation using the Diagnostic Interview for ADHD in Adults (DIVA-5; Kooij et al., 2019), semi-structured interview designed to assess ADHD symptoms in both childhood and adulthood according to DSM-5 criteria. The DIVA-5 systematically evaluates the two core symptom domains, inattention and hyperactivity/impulsivity, as well as associated functional impairments across major life areas. The interview typically requires approximately 90 min and includes a structured scoring system with explicit behavioral examples for each DSM-5 criterion. The DIVA-5 has demonstrated high diagnostic accuracy, with sensitivity around 90% to 91% and specificity ranging from 72.9% to 93.6% (Hong et al., 2020; Pettersson et al., 2015; Zamani et al., 2020). Additional evidence demonstrates strong diagnostic agreement with other structured ADHD assessments, including 81.7% agreement with the SCID-5 (First et al., 2015) and 100% agreement with the CAADID (Epstein et al., 1999), as well as good to excellent test-retest and inter-rater reliability (Ramos-Quiroga et al., 2016; Zamani et al., 2020).
Procedure
All procedures were approved by the Tel Aviv University Research Ethics Council. Participants provided informed consent before beginning the study (written consent for Samples 1 and 2; electronic consent for Sample 3). For Samples 1 and 2 (In-lab studies) participants were recruited through online and campus bulletin board announcements. A research assistant contacted each enrolled participant to confirm eligibility. Participants were asked to submit documentation of their previous ADHD diagnosis. These materials were reviewed to ensure that the diagnosis was made by a licensed mental health professional. Participants then completed addiction screening questionnaires (AUDIT and CUDIT-R) to verify that they met the study’s criteria for alcohol and cannabis use. For Sample 2, participants also completed a DIVA-5 diagnostic interview by phone (~90 min). These interviews were conducted by trained graduate and senior undergraduate students, under the supervision of a licensed clinical psychologist, to confirm that participants met DSM-5 criteria for ADHD at the time of testing. Eligible participants then completed the self-report battery, which included the ASRS and the PATAS. All questionnaires were administered in Hebrew.
For Sample 3 (Online replication) participants were recruited through Prolific platform and completed the study in two online sessions. Participants first reported details about their ADHD diagnosis, including reasons for seeking evaluation, current treatment, and assessment procedures. Responses were reviewed to confirm that participants held a formal ADHD diagnosis. Participants then completed the same self-report measures used in the in-lab studies (ASRS and PATAS), administered in English. Only participants who completed both sessions were included in the analysis.
Statistical Analysis
Exploratory Factor Analysis (EFA), alongside examination of internal consistency, were initially conducted with data gathered from the discovery Sample 1, while a further psychometric assessment of the scale’s test-retest reliability was conducted using Sample 2 and Sample 3. To investigate the construct validity of the scale, we examined how positive attitudes toward ADHD relate with ADHD symptom scores in Samples 1 to 3. Bayesian analysis was used to estimate population regression coefficients on the scaled data. Given current statistical guidelines, we avoided hypothesis testing driven analysis relying solely on sample size–based inference as in frequentist statistics, and instead provide full information regarding the uncertainty estimation of regression parameters (Amrhein et al., 2019; McElreath, 2020; Wasserstein et al., 2019; Wasserstein & Lazar, 2016). For each coefficient of interest, such as a Pearson’s correlation or a regression coefficient being estimated within the theoretical population, we provide the median estimation of the posterior, a 95% credible interval (CI95%), and the probability of direction (pd). The posterior distribution represents the updated probability of the latent parameter’s value after the observed data has been integrated with prior information, providing a complete map of uncertainty rather than a single point estimate. Within this posterior distribution, we report the median as the most likely value for the parameter. The 95% credible interval defines the range within which there is a 95% mathematical probability that the latent parameter resides, offering a direct measure of the estimation’s precision and the range of plausible values for the effect in the population. Finally, the probability of direction quantifies the proportion of the posterior distribution that carries the same sign as the median, effectively measuring the certainty that an observed effect is strictly positive or negative. For example, if we report posterior estimates for a Pearson correlation as having (posterior median = 0.50, CI95% [0.40, 0.60], pd = 99%) this indicates that the most likely value for the theoretical population parameter is 0.50, that there is a 95% probability the true correlation falls between .40 and .60, and that there is a 99% probability the true correlation is positive. Technical details regarding these distinctions can be found in foundational texts by Gelman and Shalizi (2012), Kruschke (2014), and McElreath (2020). Data and regression analysis codes are publicly available on https://osf.io/7sd8x/.
Results
We first describe the reliability estimates of the newly developed PATAS, followed by an analysis into the association of positive attitudes toward ADHD and frequency symptoms.
Psychometric Properties of the Positive Attitudes Toward ADHD Scale
Across three independent samples, the PATAS demonstrated a stable unidimensional structure, high internal consistency, and strong test–retest reliability. These findings provide converging evidence that the scale captures a coherent and reliable construct across languages, recruitment methods, and participant characteristics. Having established the psychometric validity of the PATAS, we next examined its associations with ADHD symptom dimensions and related individual differences.
Internal Consistency
We used the data from Sample 1 to estimate internal consistency for the newly developed PATAS. We first examined the descriptive statistics of each of the 13 item version and the sum score in the positive attitudes questionnaire to make sure that it was not limited by restricted variability. The 13-item version of the PATAS was designed to vary between 0 and 52 and was empirically found to have adequate variance; overall scores ranged from a minimum of 2 to a maximum of 46, with a mean of 22.83 and a standard deviation of 9.95 (see Figure 1A). We further examined each item separately and found adequate variability for each individual item (Figure 1B). Next, we examined and found a good internal consistency (Cronbach’s α = .88). We identified that one (item-13) was weakly correlated with the other items in the questionnaire (see Table S3 in the Supplemental Material for all internal consistency estimates when each item is dropped), leading to a potential compromise in internal consistency. We decided to remove item-13 from the questionnaire and found that Cronbach’s alpha coefficient improved slightly to .89 (Cronbach’s alpha coefficient for Sample 2 is .87 and for Sample 3 is .79).
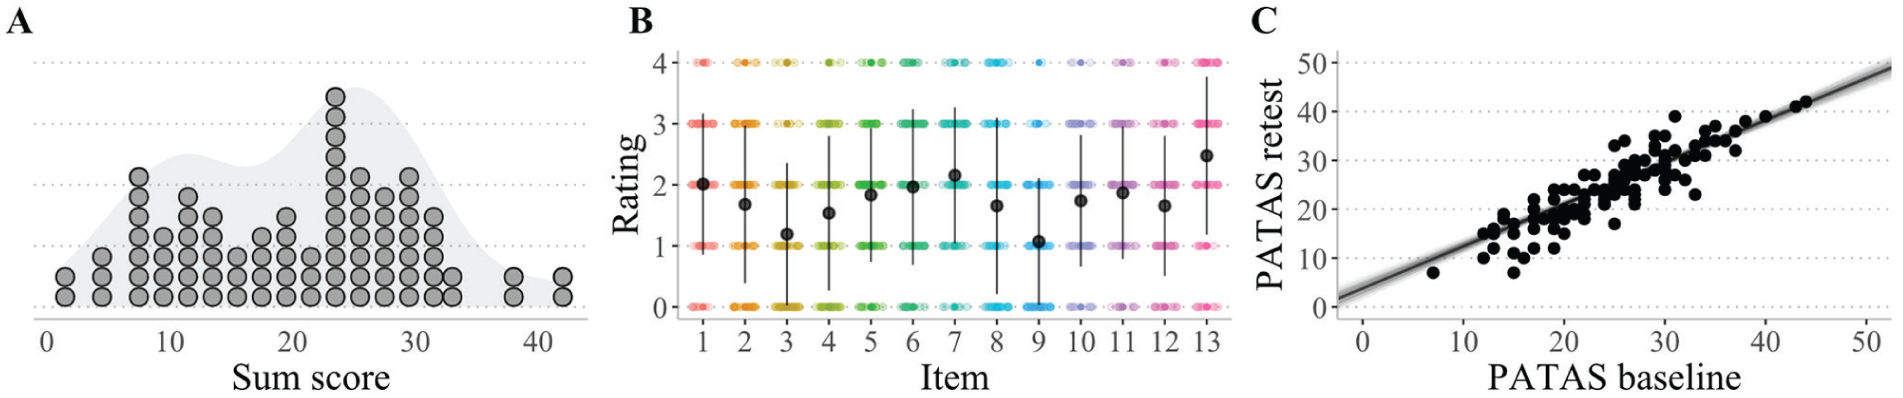
Psychometrics of the Positive Attitudes Toward ADHD Scale (PATAS). (A) Histogram and density for the sum score of the questionnaire (each dot represents one individual; Sample 1). (B) Raw observations for each item in the questionnaire. Bars represent 1 standard deviation around the mean. Overall, we found heterogeneity among participants and item ratings, suggesting that the questionnaire demonstrates widespread variability (Sample 1). (C) Paired scatter plot for PATAS at the first (baseline), and second session. Solid lines represent scaled coefficient samples from the posterior distribution denoting the uncertainty in the association. Filled dots represent the empirical data and unfilled dots represent the linear model posterior predictive predictions. Overall, we found a high test-retest reliability of r = .89 (Sample 3).
Exploratory Factor Analysis (EFA)
To confirm that all items assessed the same latent quality, we further performed an EFA using the psych package in R. In line with conventional criteria (Cattell, 1966; Kaiser, 1960), the number of factors was determined by inspecting the scree plot and applying the eigenvalue >1 rule (see Table S4). In Sample 1, only the first factor exceeded an eigenvalue of 1, and all items showed substantial loadings on this factor (loadings = 0.46–0.82; see Table S4). The first eigenvalue was 4.98, accounting for 41.5% of the variance, supporting a clear one-factor solution. To confirm the stability of this structure, we repeated the EFA in Sample 2 and Sample 3. In both samples, the same pattern emerged: only the first factor had an eigenvalue greater than 1, and all items loaded substantially on this single factor (Sample 2 loadings = 0.46–0.80, eigenvalue = 4.46, variance explained = 37.2%; Sample 3 loadings =0 .31–0.82, eigenvalue = 3.16, variance explained = 26.4%). To further address concerns regarding sample size and factor stability, we conducted an exploratory factor analysis on the combined sample across studies. Results supported a single-factor solution, consistent with the findings observed within each individual sample (see Supplemental Information for full details). Together, these analyses consistently support a unidimensional structure for the PATAS across all three. Therefore, these results suggest that the measured construct is unidimensional, with strong factor loadings and a well-defined structure.
Test-Retest Reliability
We conducted a Bayesian correlation analysis on scaled data from Sample 3, in which participants completed the 12-item English version of the PATAS across two sessions separated by up to 2 weeks. We found a high test-retest correlation between PATAS scores at the first and second session (r = .89, CI95% [0.81, 0.97], pd ~ 100%; see Figure 1C). For comparison purposes we also analyzed and replicated the test-retest of the ASRS total score (r = .82, CI95% between 0.71 and 0.92, pd ~ 100%) and subtypes (inattention: r = .76, CI95% between 0.65 and 0.88, pd ~ 100%; hyperactivity/impulsivity: r = .79, CI95% between 0.68 and 0.90, pd ~ 100%).
Having established the psychometric validity of the PATAS, we next examined its associations with ADHD symptom dimensions and related individual differences.
Associations Between Positive Attitudes Toward ADHD and Symptoms Estimates
We first examined the association between overall ADHD symptom severity and positive attitudes toward ADHD, as indexed by PATAS scores.
Contrary to our hypothesis, positive attitudes toward ADHD were associated with a higher ASRS total score (See Figure 2). Overall, the association was consistent in direction across samples; however, the estimate in Sample 3 was weaker and accompanied by slightly greater uncertainty than in Samples 1 and 2. Specifically, we found across three samples that more frequent symptoms predicted more favorable attitudes toward ADHD among participants diagnosed with the condition (Sample 1: posterior median r = .25, CI95% [0.04, 0.46], probability of direction (pd) = 99.12%; In-lab clinical replication Sample 2: posterior median r = .35, CI95% [0.18, 0.51], pd ~ 100%; Online replication Sample 3: posterior median r = .17, CI95% [−0.01, 0.35], pd = 96.83%).
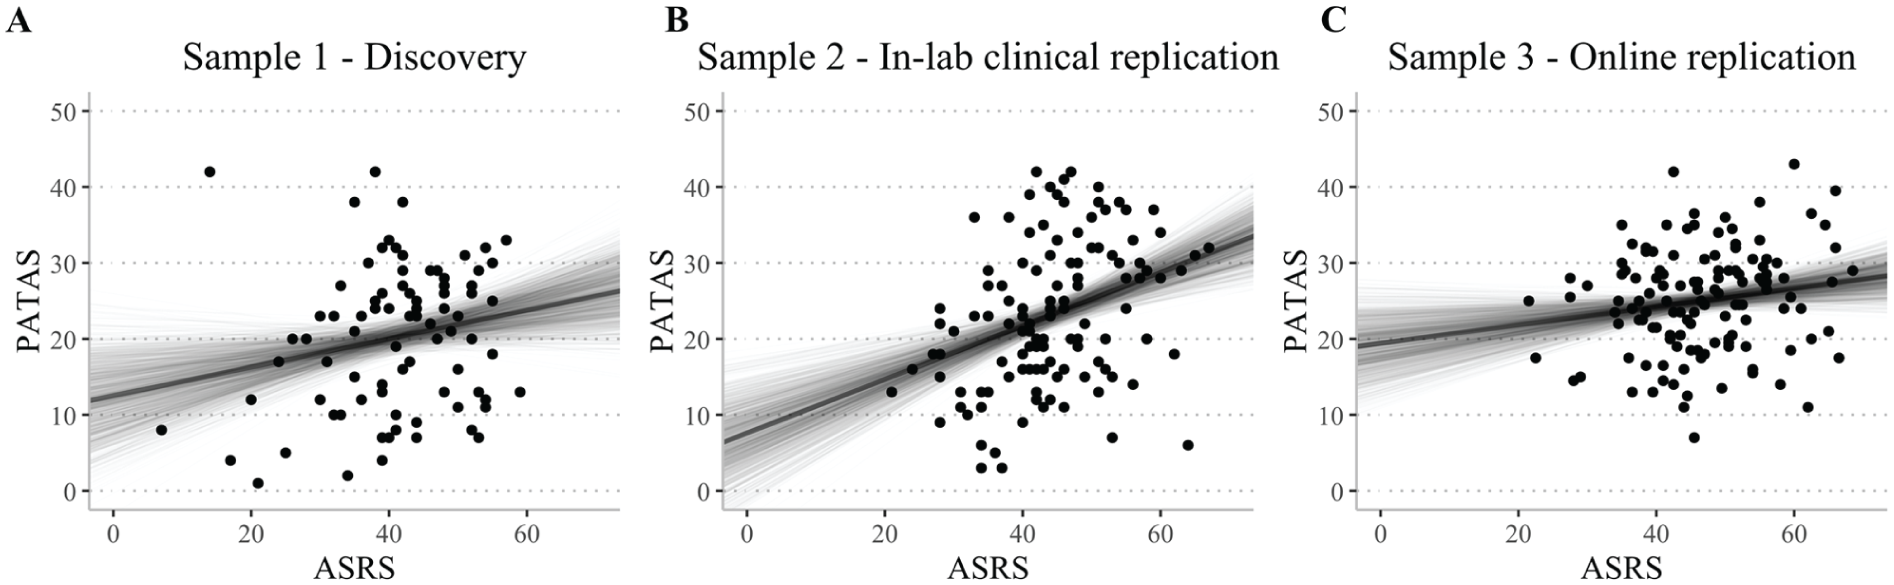
Pearson correlations between positive attitudes toward ADHD (PATAS) and ADHD symptoms (ASRS). (A–C) Scatter plots representing the association between Positive Attitudes Toward ADHD (PATAS) and ADHD symptoms (ASRS) across the three studies. Solid lines represent Pearson’s correlation samples from the posterior distribution, denoting the uncertainty in the association after observing the data. Overall, across all three studies, we found that more frequent ADHD symptoms were associated with more favorable attitudes toward ADHD (as represented by ASRS scores).
Differential Associations With Inattention and Hyperactivity/Impulsivity
Given evidence that ADHD symptom dimensions may show distinct functional correlates, we next examined whether associations between PATAS scores and ADHD symptoms differed across inattention and hyperactivity/impulsivity dimensions.
To explore the unique contribution of the two ADHD subdomains, we performed a multiple Bayesian regression analysis on the scaled scores with inattention and hyperactivity/impulsivity scores as predictors of the PATAS scaled score (see Figure 3). Notably, the hyperactivity/impulsivity and positive attitudes association is also evident at the zero-order level (Table S6) and remains when controlling for inattention in the multivariable model, indicating a unique association of hyperactivity/impulsivity with positive attitudes beyond shared variance with inattention. We found a clear differentiation in the direction of the association between ADHD symptom dimensions across all three samples. Specifically, we found a strong positive association between hyperactive/impulsive scores and positive attitudes (Sample 1: posterior median = 0.43, CI95% [0.19, 0.67], pd = 99.95%; In-lab clinical replication Sample 2: posterior median = 0.34, CI95% [0.15, 0.52], pd ~ 100%; Online replication Sample 3: posterior median = 0.57, CI95% [0.37, 0.76], pd ~ 100%). In contrast, inattention showed a tendency toward a negative association with positive attitudes, but this pattern was not consistent across samples (Sample 1: posterior median = −0.19, CI95% [−0.44, 0.05], pd = 94.33%; In-lab clinical replication Sample 2: posterior median = 0.06, CI95% [−0.12, 0.24], pd = 72.22%; Online replication Sample 3: posterior median = −0.39, CI95% [−0.59, −0.20], pd = 99.98%; for Pearson correlation between each ASRS subscale to PATAS scores for each Sample see Table S6).
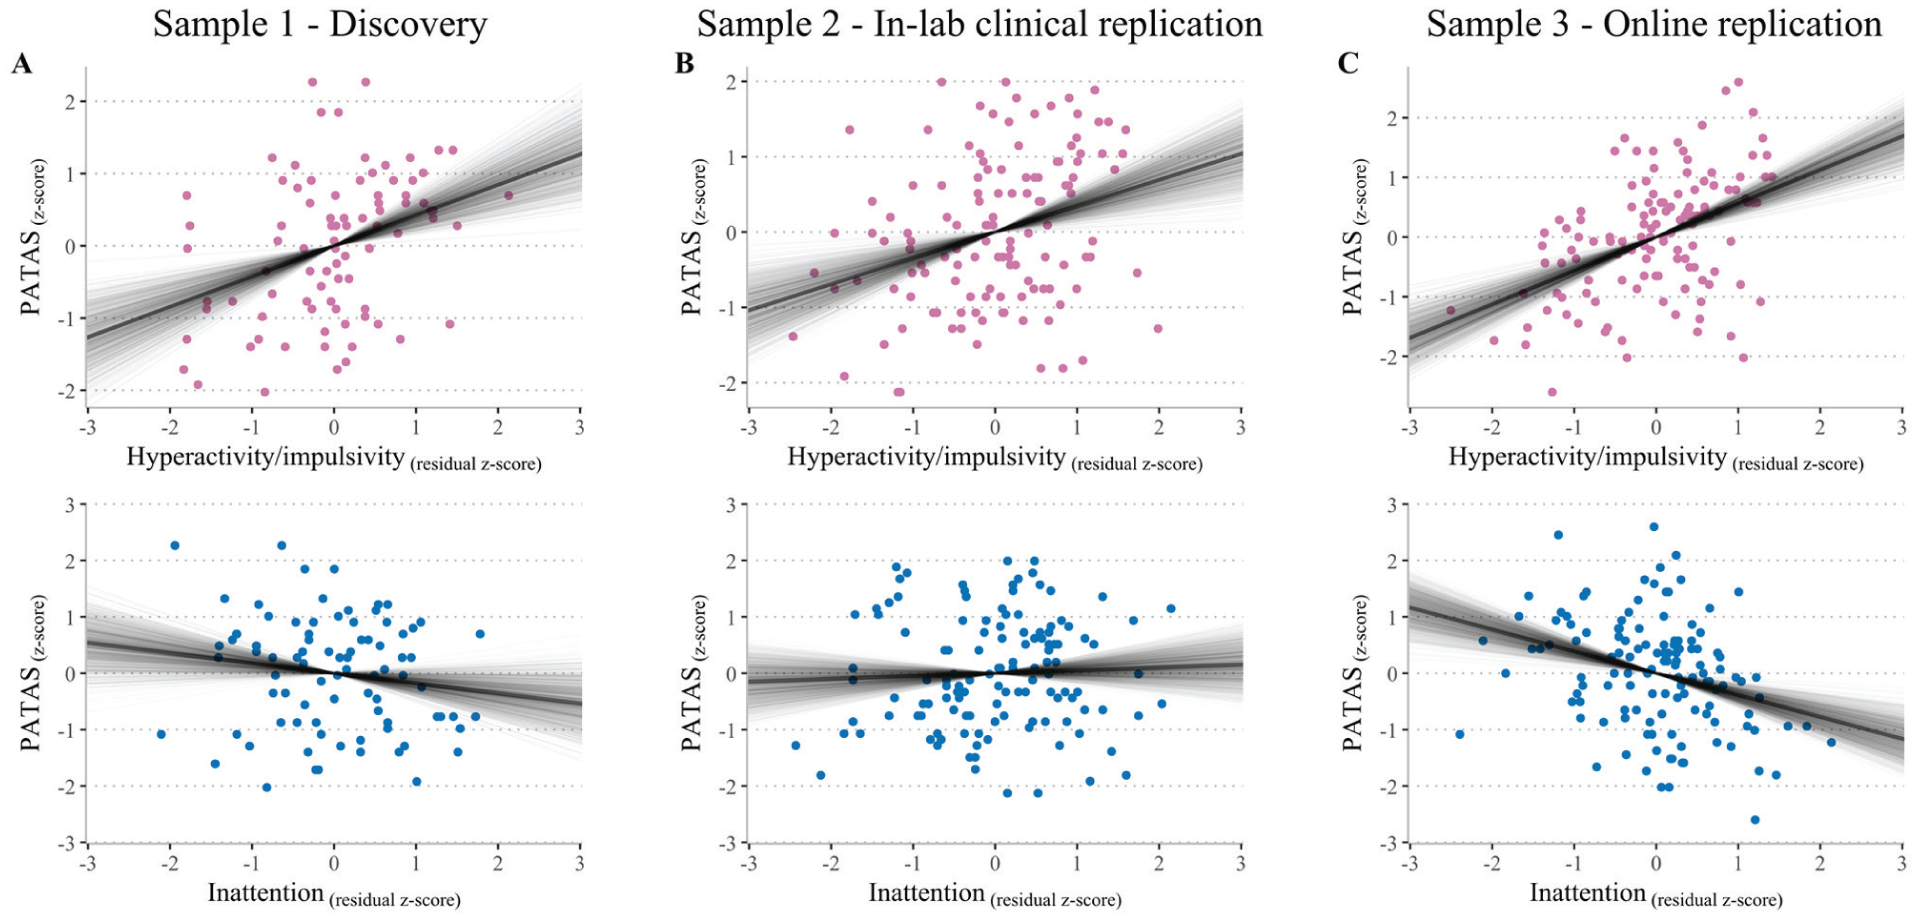
Associations between ADHD symptom dimensions and positive attitudes toward the condition. (A–C) Scatter plots depicting the unique contribution of hyperactivity/impulsivity (pink) and inattention (blue) symptom estimates to positive ADHD attitudes across the three studies. The y-axis denotes the scaled measure of positive attitudes toward ADHD (i.e., PATAS score). The x-axis represents the scaled residual score of each ASRS subdomain (i.e., inattention after partialling out the association with hyperactivity/impulsivity, and vice versa). Solid lines represent coefficient samples from the posterior distribution, denoting the uncertainty in the association after observing the data.
Controlling for General Life Satisfaction
During the review process we were asked to show that our results do not convey an association between general life satisfaction and ADHD symptoms. For this aim we conducted an additional follow-up assessment among participants from Sample 2. Thirty-five participants completed the Satisfaction With Life Scale (SWLS; Diener et al., 1985), a widely used measure of general life satisfaction. We conducted a multiple Bayesian regression analysis using scaled scores, with inattention × SWLS and hyperactivity/impulsivity × SWLS scores as predictors of PATAS. Therefore, here any association of ADHD symptoms with PATAS scores reflects the marginalized association after partialing out shared variance with SWLS. We found clear evidence for a unique association between hyperactivity/impulsivity and PATAS, independent of SWLS. Specifically, hyperactivity/impulsivity scores were positively associated with positive attitudes toward ADHD (posterior median = 0.38, CI95% [−0.03, 0.79], pd = 96.67%). In contrast, neither SWLS scores nor their interactions with inattention or hyperactivity/impulsivity were associated with PATAS (See Table S7). These results suggest that PATAS captures a more specific construct than general life satisfaction that seems to be particularly linked to the hyperactivity/impulsivity dimension of ADHD.
Discussion
Not much is known regarding the attitudes that ADHD individuals hold regarding their own condition, and how these attitudes may be associated with ADHD symptoms. Here, we hypothesized that within an adult ADHD population, more frequent ADHD symptoms across both dimensions would lead to less favorable attitudes toward one’s own ADHD, thereby emphasizing its maladaptive characteristics. Remarkably, we found that individuals’ ADHD symptom dimensions had contrasting influences on their attitudes toward their condition. Higher levels of hyperactive/impulsive symptoms predicted more favorable attitudes toward ADHD, whereas evidence for a negative association with inattention was weaker and not consistent across all samples. This striking distinction between symptom subtypes and attitudes replicated across three independent samples, two languages, a broad adult age range, and an international sample representing 24 countries.
Why do individuals with more hyperactive/impulsive ADHD symptoms show more positive attitudes toward the condition? One possibility is that the greater presence of symptoms leads to a higher level of psychological engagement with ADHD. Specifically, those with more pronounced symptoms likely experience more frequent and noticeable life events associated with the specific dimension of ADHD, making them “experts” in its various aspects (Ericsson et al., 1993). This engagement may allow them to more easily recognize positive attributes alongside the challenges. Our findings align with qualitative studies linking positive aspects such as energy, enthusiasm, spontaneity, humor, and curiosity with hyperactivity/impulsivity rather than inattention (Ginapp et al., 2022; Jones & Hesse, 2014; Nordby et al., 2023; Schippers et al., 2022, 2024). It is possible that the same factors responsible for hyperactive and impulsive symptoms may also foster curiosity and creativity (Boot et al., 2017; Heilman, 2016; Hoogman et al., 2020). The notion of positive aspects in ADHD resonates well with the neurodiversity movement (Schippers et al., 2022), which frames ADHD as a distinct manifestation of natural variations in brain structure and functioning, leading to unique thought patterns and behaviors (Sonuga-Barke & Kostyrka-Allchorne, 2022). These findings call for a more refined approach that considers both primary maladaptive aspects (associated with inattention symptoms according to DSM-5 [2013]) and mixed maladaptive and positive aspects (associated with hyperactive/impulsive symptoms [American Psychiatric Association, 2013; Sonuga-Barke & Kostyrka-Allchorne, 2022]) in ADHD research.
Furthermore, the observed positive association between positive attitudes toward ADHD and hyperactivity/impulsivity may be understood in light of prior experimental and within-subject research linking elevated motor activity or hyperactivity to improved cognitive performance, attentional engagement, or arousal regulation in individuals with ADHD, particularly in children and adolescents (Dekkers et al., 2020; Hartanto et al., 2015; Kofler et al., 2016; Rapport et al., 2008; Sarver et al., 2015), with evidence suggesting similar patterns in adults (Hudec et al., 2013; Kofler et al., 2016). Importantly, however, this literature has focused primarily on objective or performance-based outcomes rather than on subjective evaluations of the condition itself. Thus, while positive functional correlates of hyperactivity have been previously documented, the present findings extend this work by suggesting that hyperactivity/impulsivity symptoms may also be associated with more positive self-perceptions of ADHD. Furthermore, the current design was not aimed disentangle hyperactivity and impulsivity which might also have yielded a more nuanced understanding of how specific movement related behaviors drive these perceptions. Future studies using more granular measures could isolate these constructs to determine if these positive associations are specifically linked to hyperactivity as predicted by theoretical models.
Another possible explanation for the contrasting associations could be that the observed positive association between hyperactivity/impulsivity and favorable attitudes toward ADHD was driven by participants’ positive cognitive bias. Such bias may entail selective remembrance of positive experiences or the overestimation of one’s positive characteristics. Among some people with ADHD specifically, a cognitive thinking style termed “positive illusory bias” has been reported in both children and adults. Positive illusory bias involves the overestimation of one’s own skills or abilities, even in the absence of genuine positive attributes. Evidence suggests that children with ADHD often evaluate their competencies more positively than objective measures would suggest (Hoza et al., 2000, 2010; Owens et al., 2007). In adults with ADHD, such bias might foster favorable attitudes toward ADHD. This bias may potentially reflect individuals’ use of coping mechanisms (Schippers et al., 2022) to boost their sense of self-worth and self-efficacy (Sonuga-Barke & Thapar, 2021) and serve as a “defense” against the challenges and stigma associated with ADHD (Abu-Ramadan et al., 2023). However, to our knowledge, no study to date has explored whether there is a selective link between hyperactivity-impulsivity and positive illusory bias in adults. Therefore, future research should investigate whether positive illusory bias mediates the relationship between symptom frequency and positive attitudes toward one’s own ADHD.
It is important to note that our study focuses on subjective attitudes toward one’s own ADHD rather than evaluating whether ADHD confers objective positive benefits. Because PATAS specifically measures individuals’ opinions of their own ADHD condition, self-report is the direct and ecologically valid method for assessing this construct. However, it is important to distinguish these attitudes from behavioral evidence that ADHD is associated with observable strengths such as creativity or spontaneous idea generation. Behavioral studies suggest that, in some samples, individuals with ADHD or elevated ADHD traits show enhanced divergent thinking, reduced constraint from prior knowledge, and higher creative achievement, even though convergent thinking is often unchanged or weaker (Abraham et al., 2006; Hoogman et al., 2020; Stolte et al., 2022; White & Shah, 2006, 2011). These findings speak to adaptive traits at the level of behavior, but they do not imply that every person who endorses positive beliefs about their ADHD on the PATAS necessarily exhibits such advantages in everyday functioning. At the same time, qualitative and strength-focused research indicates that recognizing ADHD-related positives such as cognitive dynamism, energy, and resilience can support identity, coping, and flourishing, even when these strengths are defined primarily in subjective terms (Niemiec & Tomasulo, 2023; Schippers et al., 2022; Sedgwick et al., 2018). Therefore, we assert that the study of opinions and attitudes toward one’s own ADHD condition is important in its own right.
Given that the PATAS is a self-report measure (rather than a behavioral one) it also holds to validity issues that are known to be associated with self-reports. These can include inattentive responding, social desirability, or general positivity. While these concerns are known in self-report research, several lines of evidence suggest that these factors are unlikely to account for our findings. First, PATAS scores showed substantial variability across individuals, consistent with meaningful differences rather than uniform or biased responding. Second, we observed a very high test-retest reliability, indicating that responses were stable over time and not driven by momentary lapses in attention or inconsistent self-evaluation. Third, broad response tendencies, whether due to inattentiveness, impression management, or a general positive-response style, would be expected to influence both ADHD symptom dimensions similarly. Yet only hyperactivity/impulsivity showed a consistent association with positive attitudes, whereas inattention did not. This striking dissociation is incompatible with nonspecific noise or global bias. Finally, although life satisfaction was modestly associated with PATAS scores, the link between hyperactivity/impulsivity and positive attitudes toward ADHD remained unique and independent, suggesting that the PATAS captures ADHD specific positive perceptions rather than merely reflecting general well-being or diffuse positivity. Therefore, these findings support the interpretation that the PATAS taps a specific component of how individuals with ADHD perceive their condition, rather than artifacts of self-report bias.
Overall, our findings suggest that the PATAS is a useful tool for exploring favorable attitudes of people with ADHD toward their own condition. Moreover, the utility of the PATAS may extend to clinical settings. For instance, evidence suggests that maintaining positive attitudes toward one’s own condition is crucial for treatment success (Bekle, 2004; Hatzenbuehler et al., 2013). Therefore, the PATAS can be utilized to examine how individuals cope with their self-perception after receiving a diagnosis and during treatment, as these attitudes may have profound implications for their mental well-being and their ability to accept or embrace the diagnosis (Schippers et al., 2022).
Limitations and Future Research
Several limitations should be noted. Most PATAS items appear to align more closely with hyperactivity/impulsivity traits rather than inattention, reflecting themes identified in previous qualitative research. However, few quantitative studies have examined this issue. Additionally, item selection was constrained by the authors’ ability to generate suitable measures. In retrospect, the absence of items addressing hyperfocus may have introduced a bias away from inattention symptoms. Therefore, further evaluation and refinement of the items, including the addition of new ones, is warranted. Future research may also explore the development of a parent-report version. Second, while our findings suggest differential associations between ADHD symptom dimensions and positive attitudes toward the condition, reliance on self-report measures introduces the possibility of domain-specific reporting biases. Specifically, ADHD symptom domains may differ in their social salience and perceived acceptability. For instance, more obtrusive or disruptive hyperactive/impulsive symptoms (e.g., verbal or behavioral intrusions) may be subject to greater social desirability bias compared to inattention symptoms like mind wandering or “spacing out,” which might be perceived as more socially acceptable. While the consistency of our findings across samples and their robustness when controlling for general life satisfaction suggest that a global response bias is unlikely to be the sole driver of these patterns, we cannot definitively rule out the influence of these domain-specific biases. Future research incorporating multi-informant reports (e.g., peer or clinician ratings) or objective behavioral measures will be essential to further disentangle these symptom-specific effects. Third, our findings do not clarify the underlying mechanisms of the differential association between ADHD symptom dimensions and positive attitudes toward the condition. One possibility is that the perceived benefits of ADHD among individuals with hyperactivity/impulsivity are mediated by mood traits more strongly linked to hyperactivity/impulsivity than inattention. For example, a heightened state of positive mood may be more common among individuals with frequent hyperactive/impulsive traits compared to those with inattention, potentially leading to a more positive perception of ADHD. However, further studies are needed to rigorously test this hypothesis. Fourth, a primary limitation is that we cannot determine if the analyzed participants differed significantly from those excluded from the study. Because participants were removed at different stages of the protocol we lack comprehensive demographic or clinical data for the excluded group which may limit the generalizability of our findings. Furthermore, although high internal consistency indicates a coherent construct, very high Cronbach’s alpha values may also suggest some degree of item redundancy. Future studies could therefore examine shortened versions of the PATAS that preserve its psychometric strength while improving efficiency.
In addition, there are limitations regarding diagnostic reporting sources. While participants in Sample 1 and 2 held an official ADHD diagnosis upon study entry, we cannot verify if those prior clinical assessments included corroborating data from parents or teachers at the time the diagnosis was made. Furthermore, although we conducted our own structured diagnostic interviews (DIVA-5) with Sample 2 participants, the childhood symptom component relied solely on their retrospective self-reports. This was also true for the WURS used to estimate childhood symptoms across our samples. This is an important consideration, as research suggests that self-reports can sometimes underestimate ADHD persistence compared to informant reports (Barkley et al., 2002, 2010). Future research incorporating multi-informant and multi-method diagnostic approaches will be helpful to see if these patterns generalize to the broader ADHD population.
Additionally, the role of psychological engagement and positive cognitive biases in shaping these associations could be further explored in future research using objective cognitive measures and/or multiple informant reports (e.g., family members or friends). While ADHD diagnoses were based on structured DIVA-5 interviews conducted by trained interviewers, formal inter-rater reliability estimates were not collected, and their inclusion in future studies could further strengthen diagnostic confidence. Finally, despite having relatively large and heterogeneous samples in terms of country of residence, language, age, and gender, our results are specific to the adult population alone.
Conclusions
In conclusion, we developed a self-report measure of positive attitudes toward ADHD that demonstrates excellent internal and test-retest reliability. Our findings consistently revealed a contrasting effect of symptom dimensions on positive attitudes toward ADHD. Further studies should explore whether the contrasting associations between the two symptom dimensions and positive attitudes are also observed in adolescents and children, and in their caregivers. Finally, longitudinal designs would be valuable for understanding how positive attitudes develop over time and how such attitudes may promote well-being in individuals with ADHD.
Supplemental Material
sj-docx-1-jad-10.1177_10870547261463814 – Supplemental material for ADHD Individuals’ Positivity About Their Condition Varies by Their Levels of Hyperactivity/Impulsivity Versus Inattention Symptoms
Supplemental material, sj-docx-1-jad-10.1177_10870547261463814 for ADHD Individuals’ Positivity About Their Condition Varies by Their Levels of Hyperactivity/Impulsivity Versus Inattention Symptoms by Gili Katabi, Merav Huss, Steve Lukito, Tycho J. Dekkers, Edmund Sonuga-Barke and Nitzan Shahar in Journal of Attention Disorders
Footnotes
Acknowledgements
We would like to acknowledge Shira Amir, Kamil Swissa, and Achia Minzer for their hard and dedicated work in data collection.
Author’s Note
Edmund Sonuga-Barke is now affiliated with Department of Child and Adolescent Psychiatry, Aarhus University, Aarhus, Denmark. Department of Psychology, Hong Kong University, Hong Kong, China.

Ethical Considerations
The study was approved by Tel-Aviv University’s IRB ethics committee.
Consent to Participate
All participants provided electronic/written informed consent after receiving a complete description of the study.
Author Contributions
G. Katabi: Writing – original draft, Writing – review and editing, Formal analysis, Methodology, Visualization. M. Huss: Writing – original draft, Writing – review and editing, Conceptualization. S. Lukito: Writing – review and editing. T. Dekkers: Writing – review and editing. E. Sonuga-Barke: Writing – review and editing. N. Shahar: Writing – original draft, Writing – review and editing, Conceptualization, Funding acquisition, Supervision.
Funding
The authors disclosed receipt of the following financial support for the research, authorship, and/or publication of this article: This work was funded by an Israeli Science Foundation grant (grant no. 2536/20) (NS), and by the Mario Adler Center for Child Development.
Declaration of Conflicting Interests
The authors declared no potential conflicts of interest with respect to the research, authorship, and/or publication of this article.
Supplemental Material
Supplemental material for this article is available online.
Author Biographies
References
Supplementary Material
Please find the following supplemental material available below.
For Open Access articles published under a Creative Commons License, all supplemental material carries the same license as the article it is associated with.
For non-Open Access articles published, all supplemental material carries a non-exclusive license, and permission requests for re-use of supplemental material or any part of supplemental material shall be sent directly to the copyright owner as specified in the copyright notice associated with the article.
