






Abstract
Objectives:
This study characterized variation in rates of new medical diagnoses of ADHD among kindergartners and identified factors associated with diagnosis rates.
Methods:
This study analyzed 87,383 kindergartners who were not diagnosed with ADHD prior to kindergarten who attended at least one of 490 elementary schools in Arkansas. The study examined five kindergarten cohorts from the 2015/16 to 2019/20 academic years, assessing school-level variation in ADHD diagnosis rates. Schools were categorized by quintiles of their ADHD diagnosis rates. A mixed-effects logistic regression model was used to examine individual-level factors associated with new ADHD diagnosis.
Results:
Diagnosis rates varied 570% across school quintiles. Schools with higher rates of ADHD diagnoses served a higher percentage of African American children, children from lower-income families, and children living in neighborhoods with lower Child Opportunity Index (COI) scores. Results of an individual-level logistic regression analysis indicated children in census tracts with very high or high social and economic COI scores had lower odds of having new ADHD diagnoses compared to those from very low COI neighborhoods. Children who were young-for-grade had higher odds of an ADHD diagnosis. Children who were in schools providing universal free school meals had lower odds of an ADHD diagnosis, despite these schools serving more children from families with lower incomes, a finding that warrants further exploration.
Conclusions:
New ADHD diagnoses in kindergarten varies substantially across schools.
Introduction
Attention-deficit/hyperactivity disorder (ADHD) is the most common childhood neurodevelopmental disorder in the United States affecting 10% of children of elementary school age (Bitsko et al., 2022). School systems play an important role in the identification and diagnosis of childhood ADHD. DSM-5 (American Psychiatric Association, 2013) criteria for diagnosis of ADHD require several symptoms to be present in two or more settings (e.g., home and school). School staff, such as teachers, can be influential in the referral of children for ADHD evaluation (Wolraich et al., 2019). Once referred, it is recommended that ADHD evaluations for children include perspectives from teachers or other school staff (Martel et al., 2021; Wolraich et al., 2019). Moreover, the classroom and school environment (e.g., level of structure, use of positive behavioral interventions) are important for outcomes of children with ADHD (Fabiano & Pyle, 2018; Wolraich et al., 2019).
Existing literature documents geographic variation in the prevalence of ADHD in children in the United States (Zgodic et al., 2023), Norway (Hofstad et al., 2025), and Denmark (Madsen et al., 2015). For example, Zgodic et al. (2023) found that county-level prevalence of parent-reported childhood ADHD diagnoses in the United States ranged from 11% or lower to 20% or higher. Other studies have examined variability in ADHD diagnosis at the primary care practice level; these have observed substantial variability in the ADHD diagnosis across primary care practices (Bannett et al., 2020; Mayne et al., 2016). However, little is known about the extent to which incident ADHD diagnoses varies across schools. This is an important gap in the literature because schools are an important context for the diagnosis and management of ADHD. If rates of ADHD diagnosis are distributed unevenly across schools, this may signal potential inequities in identification processes, school environments, and/or community-level factors that contribute to ADHD prevalence rates. Given educational resources required to manage ADHD are substantial (Schein et al., 2022), this also may have implications for the equitable distribution of resources to support students with ADHD.
Geographic variation in the prevalence of ADHD has been attributed to a wide range of factors, including those at the macro level such as education and health care system policy (Danielson et al., 2024; Fulton et al., 2015); those related to clinicians such as availability of trained providers, clinicians’ attitudes and practice styles (Lyhmann et al., 2022; Widding-Havneraas et al., 2022); and those related to population demographics and social determinants of health such as poverty rates and access to community resources (Bozinovic et al., 2021; Russell et al., 2015). Multifactorial genetic and environmental risk factors are thought to interact to shape ADHD risk (Rattay & Robinson, 2024). Indeed, social determinants of health within residential neighborhoods have been shown to be associated with ADHD (Winders Davis et al., 2021; Zhao et al., 2023). These associations may reflect disparities in underlying risk as well as disparities in identification, diagnosis, and treatment access processes, and have been attributed to a wide array of potential factors, including imbalanced community resources, exposure to stress, environmental exposures, healthcare access, and sociocultural expectations (Bozinovic et al., 2021; Dimitrov et al., 2023; Morgan et al., 2013; Zhang et al., 2022). Because schools tend to serve student populations grouped by geography, neighborhood-level factors may lead to school-level variation in ADHD diagnosis.
At the school level, there are several factors that may be important for diagnosis and outcomes of children with ADHD and could lead to school-level variation in diagnosis rates (DuPaul et al., 2014; Felt et al., 2014). First, some children access preventive and diagnostic care directly through school-based health clinics (Zwiebel & Thompson, 2022). Second, In the United States, children obtain up to 58% of their daily caloric intake from school meals (Cullen & Chen, 2017), which are required to conform to federal nutrition standards (Tiehen, 2020) and compare favorably to meals brought from home in terms of overall nutritional quality (Caruso & Cullen, 2015; Farris et al., 2014; Hubbard et al., 2014), but vary across schools (Joyce et al., 2018, 2020; Schneider et al., 2021). Based on recent systematic reviews, the evidence supporting a link between healthy diets (Chaulagain et al., 2023; Del-Ponte et al., 2019), sugar consumption (Farsad-Naeimi et al., 2020), and ADHD diagnosis is not conclusive. However, this literature primarily addresses individual dietary factors rather than school-level processes that facilitate participation in child nutrition programs. Using difference-in-differences designs, recent studies have shown that disciplinary infractions decline when schools adopt policies that facilitate participation in child nutrition programs (Cuadros-Meñaca et al., 2022; Gordon & Ruffini, 2021), which could impact diagnosis rates through lower referrals for screening. Third, there is strong evidence for relative age effects in ADHD diagnoses with younger children being more likely to receive an ADHD diagnosis than older children in a grade cohort (Elder, 2010; Evans et al., 2010; Frisira et al., 2024; Layton et al., 2018). Teacher ratings for ADHD-related symptoms often diverge from parent ratings for children who are young-for-grade (Elder, 2010; Frisira et al., 2024), highlighting the importance of developmental maturity within the school context in establishing ADHD diagnoses. School policies around discipline may also be relevant to ADHD diagnosis and management. Students with ADHD are more likely to receive referrals and sanctions that include exclusionary discipline (Martin, 2014), which is linked to a host of negative outcomes, such as involvement with the justice system and risky behaviors (Gerlinger et al., 2021). Recent evidence also suggests that attending a school using a specific evidence-based positive behavior support framework (i.e., School-Wide Positive Behavioral Interventions and Supports) reduces the likelihood of a student receiving pharmacotherapeutic treatment for ADHD, especially for at-risk students in schools with high implementation fidelity (Borgen et al., 2021). Although not definitive, these results raise the possibility that aspects of the school environment (e.g., level of proactive and positive behavioral support) may influence symptom presentation, impairment, or behavior at school for children with or at-risk for ADHD (Bozinovic et al., 2021; Winders Davis et al., 2021; Zhao et al., 2023).
Despite the myriad of factors that could lead to school-level variability in rates of ADHD diagnosis (Bozinovic et al., 2021), no existing studies have investigated school-level variation in children receiving new ADHD diagnoses in their medical claims in the United States. Such studies are inherently difficult due to federal and state privacy laws and regulations for both educational and medical records, and the challenges in data access and linkage for epidemiologic studies. This study is the first to report findings from such data, which allow us to simultaneously adjust for both individual- and school-level factors. Participation in kindergarten is the norm across the United States (Fabina et al., 2023) and represents the first encounter with public-school systems for many children, which makes it the ideal setting to examine school-level variation in ADHD diagnoses. The aims of this cross-sectional study are to (1) describe school-level variation in rates of new ADHD diagnoses among kindergarteners across public elementary schools; (2) examine child-level, school-level, and neighborhood-level factors associated with kindergarten diagnosis rates.
Methods
Design, Setting, and Participants
The study covered five first-time public-school kindergarten cohorts enrolled in Arkansas public schools during the 2015/16 through 2019/20 academic years. This time frame was selected to mitigate the influence of the COVID-19 pandemic, which caused disruptions to the delivery of academic programs, potentially introducing confounding factors that could bias estimation. The study involved the retrospective analysis of administrative datasets from the Arkansas Department of Education (ADE) that were linked by subject identifiers to the Arkansas All-Payer Claims Database (AR-APCD) through an honest data broker arrangement and were then de-identified. Claims data, such as those in the AR-APCD, reflect the billing system used in US healthcare, which is comprised of a fragmented, multi-payer system that encompasses private insurers, employer-sponsored insurance plans, and public insurance (e.g., Medicaid). Claims reflect billing information such as diagnostic codes (i.e., International Classification of Disease (ICD) codes) and procedure codes recorded and billed by clinicians and prescriptions billed to insurance payers. Since the data available to the research team was de-identified, the study received a not human subject research determination by the Institutional Review Board (University of Arkansas for Medical Sciences IRB# 275801).
Medical claims were evaluated over a 22-month period from September 1st of the year prior to the year of kindergarten enrollment through June 30th of the year after enrollment. This comprised a 12-month lookback period prior to entering kindergarten ending August 31st of the year of kindergarten enrollment and a 10-month study period corresponding to the kindergarten academic year. The validity of this approach is supported by earlier work showing positive predictive values for ADHD cases identified in claims data are high when cross checked against medical records (Straub et al., 2021).
We identified 116,350 first-time kindergartners during the study period (Figure 1). Children were excluded for the following reasons: (1) The child did not have continuous representation in the AR-APCD as defined by a coverage gap of no more than two consecutive months during the 22-month lookback and study period (28,569 excluded). (2) To identify incident ADHD, children with an ADHD diagnosis in the 12 months prior to September 1 of the kindergarten year (4,939 excluded). (3) The child attended very small schools that had fewer than 25 kindergartners enrolled during the 5-year period (398 excluded). These small schools were excluded to avoid small-numbers bias in the school-level variations analysis. (4) The child was missing study measures (37 excluded).
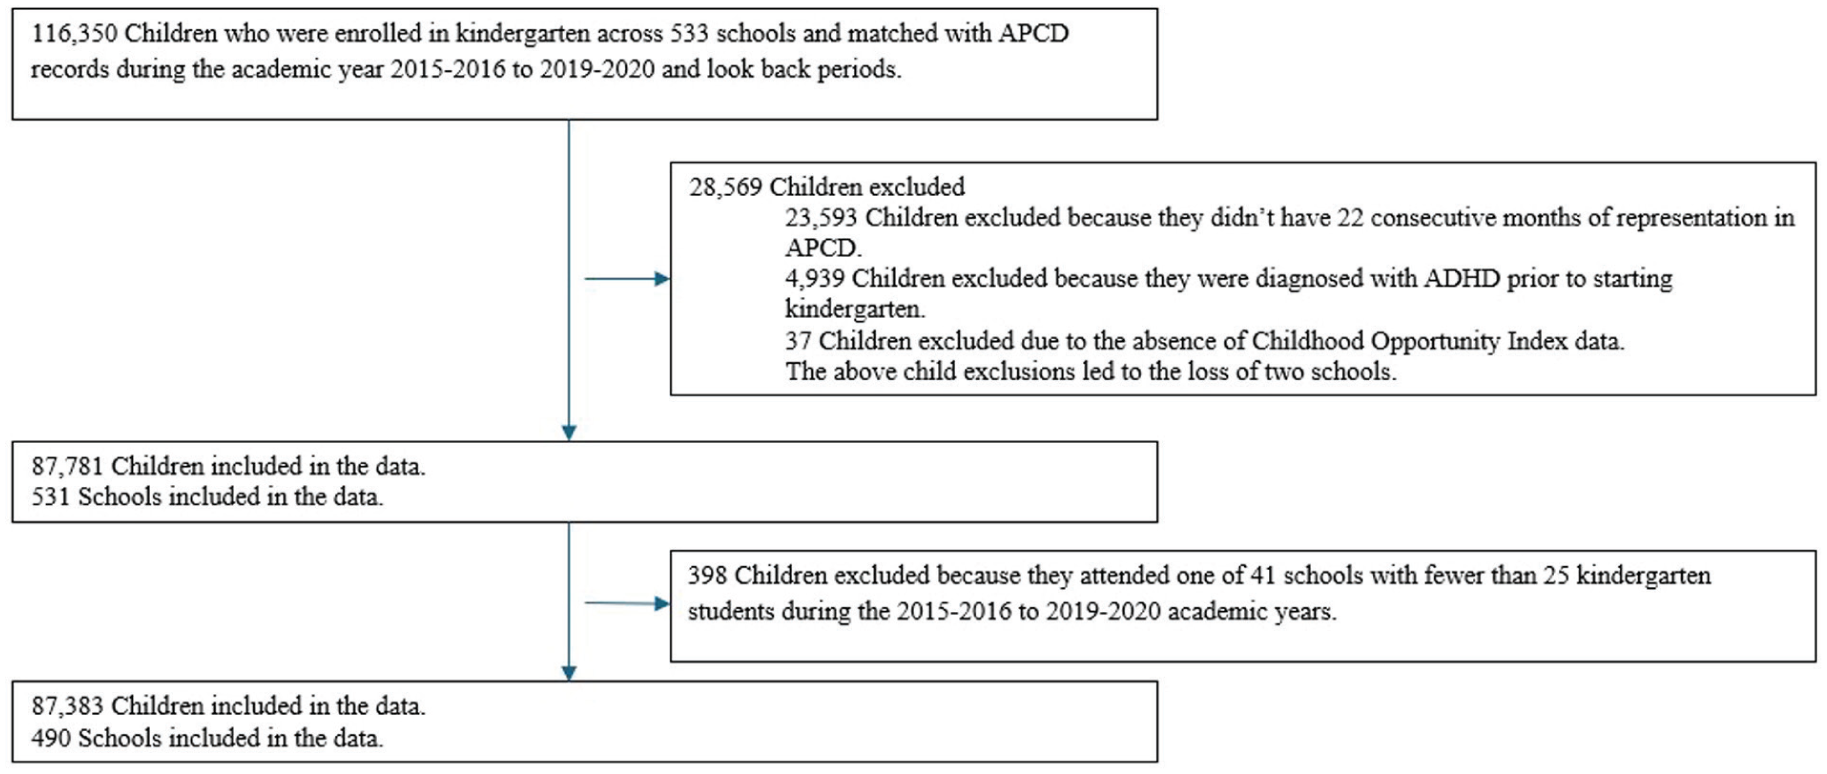
Subject Attrition diagram.
Diagnoses
We identified an ADHD diagnosis as either (1) a diagnostic code on two or more distinct dates or (2) a diagnostic code plus a prescription for a psychotropic stimulant (Morkem et al., 2020). This approach will identify cases where stimulants are not used to manage ADHD while reducing false positives that could have occurred in inpatient settings, probable but not confirmed cases, or because of “rule out” codes that may have been used prior to transitioning to the ICD-10-CM guidelines. Diagnostic codes that were used to define ADHD were ICD-9-CM codes of 314.00, 314.01, 314.0 and ICD-10-CM codes of F90.0, F90.1, F90.2, F90.8, F90.9. Psychotropic stimulants were defined as one or more prescriptions filled for amphetamine and mixed amphetamine salts, dexmethylphenidate, dextroamphetamine, lisdexamfetamine, methamphetamine, and methylphenidate (Straub et al., 2021). New cases diagnosed during kindergarten were defined as those where the first diagnostic code or prescription occurred on or after September 1st of the year the child entered kindergarten.
Co-occurring conditions (oppositional defiant disorder, other disruptive behavioral disorders, autism spectrum disorder, major depressive disorder, anxiety disorders, stress disorders, specific learning disorders, and tic disorders) were identified as one or more diagnostic codes within the 22-month combined lookback and study periods. Other disruptive behavioral disorders were comprised primarily by diagnostic code F91.9 (“conduct disorder unspecified”). A complete list of diagnostic codes for these conditions is provided in eTable 1 in Supplement 1. To account for potential variation in diagnoses across medical providers, each child was assigned to a provider who appeared most frequently in their history of medical claims for ambulatory care during the 12-month lookback period. There were 3,579 distinct providers.
Child-Level Factors
Child-level measures were assessed using the ADE’s Statewide Information System (Arkansas Center for Health Improvement, n.d.). Based on enrollment records, gender was coded as male or female and four classifications were used for race/ethnicity: non-Hispanic White, non-Hispanic African American, non-Hispanic of another race (including more than one race), or Hispanic. Indicators were assigned to children using a school-based health center or receiving special education services any time during an academic year. An indicator for school mobility was used to flag children who attended more than one school during the year. For purposes of the analysis, the child flagged as mobile were assigned to the school where they spent the most time during the academic year. Children were classified as young-for-grade if they had birthdays in May, June, July, or August and were born exactly 5 years before the year they entered kindergarten. An indicator was used to measure whether the child received one or more disciplinary referrals during the school year. Lastly, to measure socioeconomic status, indicators of eligibility for free or reduced-price meals, were used to identify students from families below 130% and 185% of the federal poverty threshold, respectively. For context, in 2018, the mid-year of our study, the federal poverty threshold for a family of four was $25,100 per annum and the median household income was $63,179 per annum (Semega et al., 2019).
Neighborhood-Level Factors
Childhood Opportunity Index (COI) scores were taken from the Child Opportunity Index 2.0 Database. Child opportunity was measured for the child’s census tract using COI component scores across three subdomains: (1) education, (2) health and environment, and (3) economic and social opportunities/resources, each ranging from 1 to 100, with higher numbers indicating higher opportunity (Acevedo-Garcia et al., 2020). Region indicators used by the Arkansas Center for Health Improvement were used to capture broad differences in rurality and economic opportunity across the state (eFigure 1 and eTable 2 in Supplement 1).
School-Level Factors
Data on school meal policies were obtained from ADE’s Child Nutrition Unit and the Arkansas Hunger Relief Alliance. The study included two measures related to use of school meal-delivery options that have been shown to increase access and participation to school nutrition. Indicators were used to identify schools that provided universal free meals (UFM) to all enrolled children and schools that provided “breakfast after the bell” (BAB), a meal delivery option that makes breakfast available after the instructional component of the school day begins.
Statistical Methods
Descriptive statistics were computed across all children. Variation across schools was assessed by averaging study measures by school over the five academic years, which provided a rate of new ADHD diagnoses by school. In the school-level analysis 5-year averages were used to ensure that a sufficiently large numbers of individuals were included to compute stable diagnosis rates by school. Schools were then assigned to quintiles based on this rate. Trend tests were used to assess significance in rates of ADHD diagnosis and the various child-level, neighborhood level, and school-level measures described above across lowest and highest incidence schools. The Cochran-Armitage test for trend was used for categorical variables and the Jonckheere–Terpstra test for trend was used for continuous variables.
A mixed-effects logistic regression model with random effects for school, region, and provider was used to examine the association between child-level ADHD diagnosis and the child-level measures described above. Co-occurring conditions, the use of prescription stimulants, and indicator for disciplinary infractions were excluded from this model because they were likely to be codetermined with an ADHD diagnosis. The estimated model was used to adjust school-level diagnoses rates. To align with the school-level analysis, conditional, model-adjusted, individual-level predictions were averaged by school and then compared to the unadjusted diagnosis rates.
All analyses were conducted using R version 4.4.0.
Sensitivity Analysis
Two sensitivity assessments were conducted. The first relaxed the 22-month continuous enrollment exclusion requirement. This requirement was to reduce false-negatives, but could impact sample composition. The second assessment involved estimation of two additional mixed-effects logistic regression models, one excluding provider random effects and the other excluding school random effects. These were to assess sensitivity to inclusion random effects for provider and school.
Results
Study Population
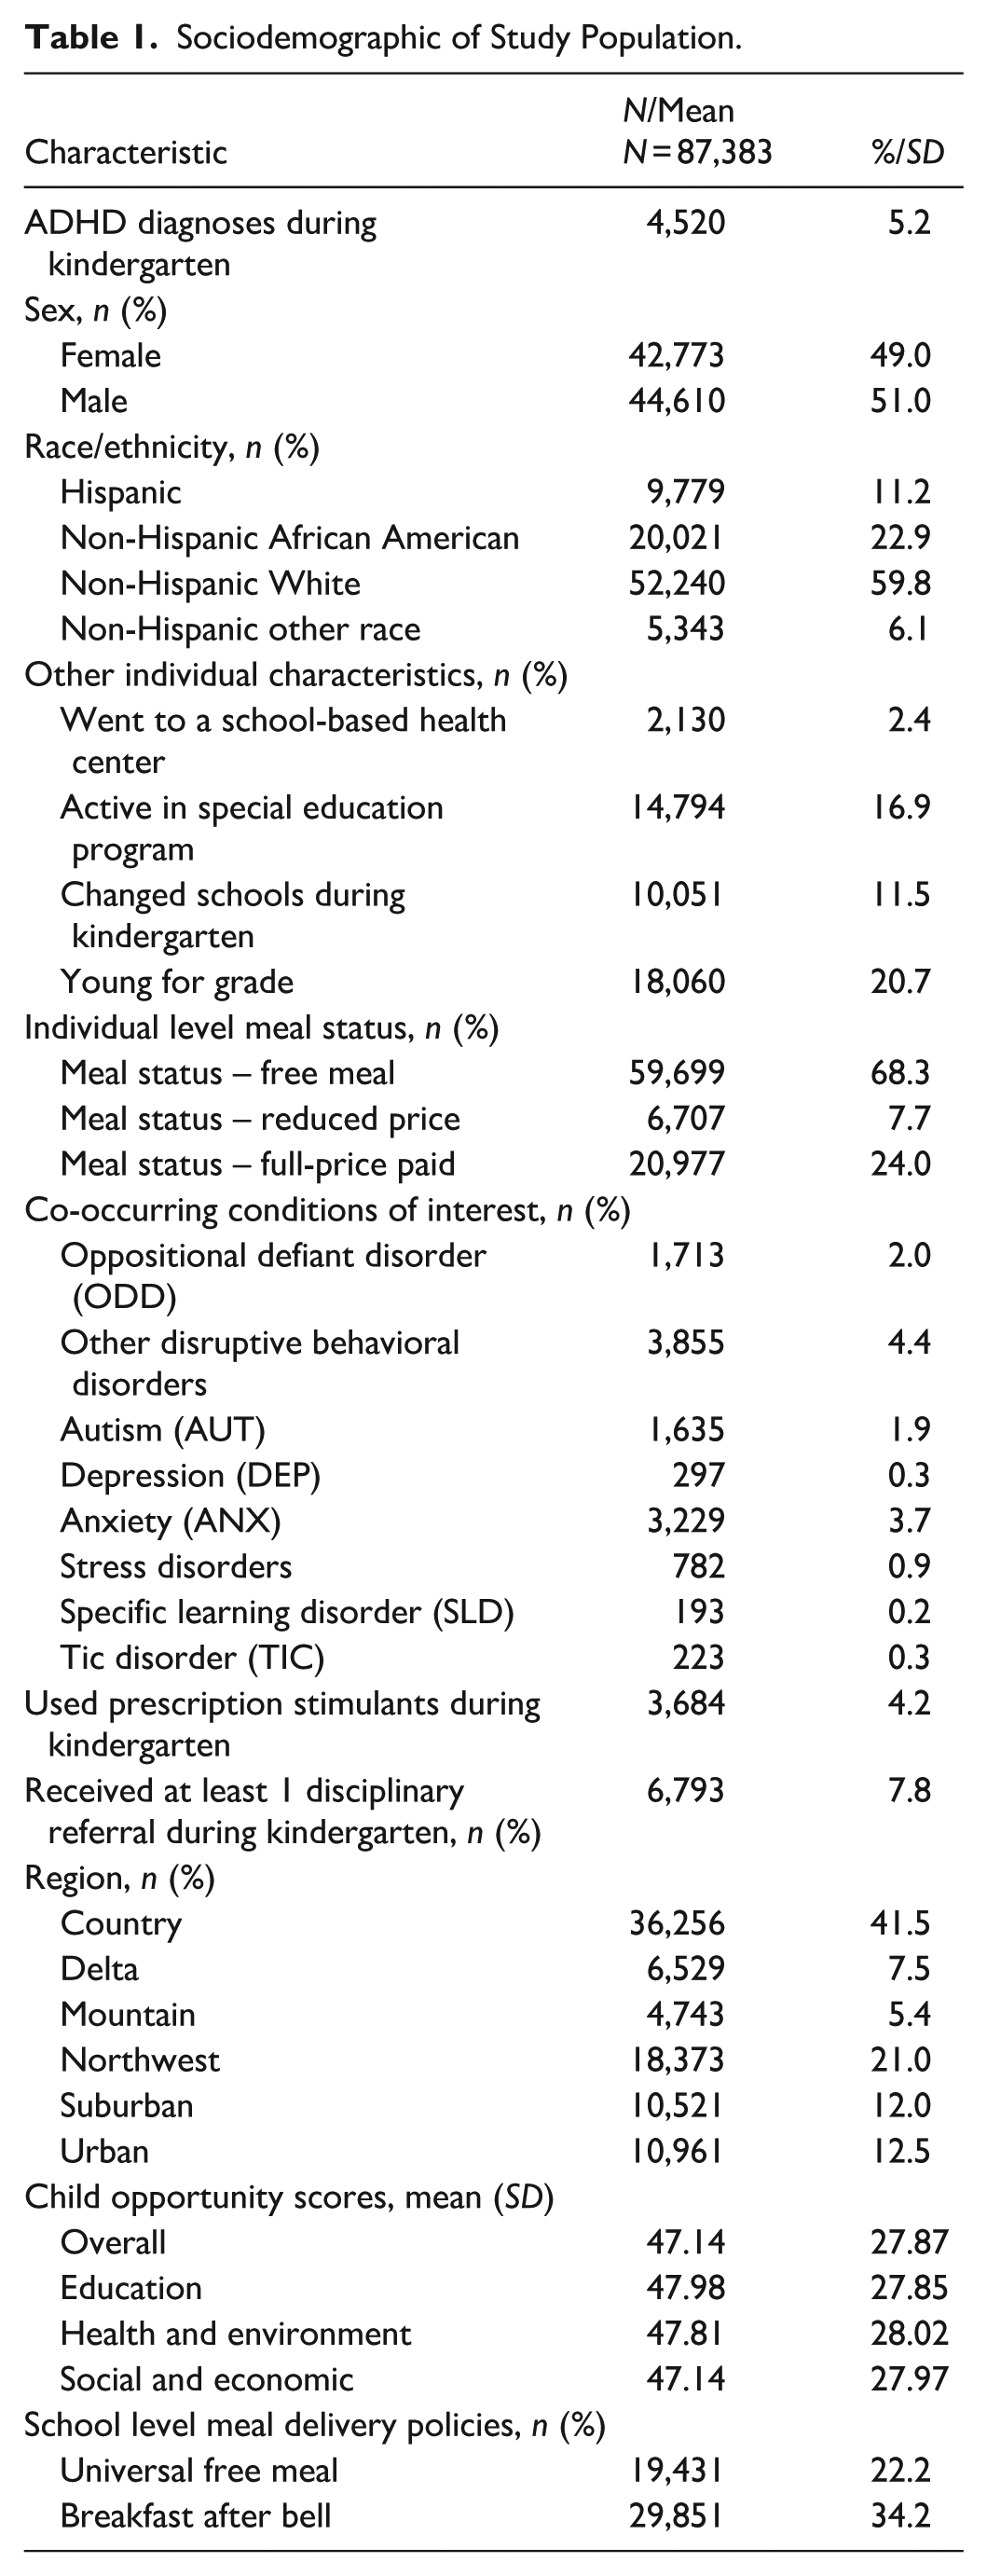
After applying the exclusion criteria (Figure 1), the analytic sample contained 87,383 kindergartners. Supplemental material shows that those excluded were less likely to qualify for free meals and were less likely to be racial and ethnic minorities (see eTable 3 in Supplement 1). Three out of four Arkansas kindergartners were from families with incomes below 185% of poverty as indicated by eligibility for free or reduced-price school meals, with most kindergartners (68%) falling below the free-meal threshold (130% poverty; Table 1). Approximately 22% of kindergartners attended a school that offered UFM, 34% attended schools that offered BAB and 8% of kindergartners received one or more disciplinary referrals.
Sociodemographic of Study Population.
Variability in ADHD Diagnoses by School
Across all schools, 5.2% of kindergarteners were newly diagnosed with ADHD (Table 1). This varied from 1.7% in the lowest quintile of schools to 10.0% in the highest quintile of schools, a nearly six-fold difference (Table 2). Schools in the highest quintile served a higher percentage of students who qualified for free school meals and who lived in neighborhoods with lower child opportunity scores across all domains. African American children and children from the Mississippi Delta region were more prevalent in the highest quintile of schools. A smaller percentage of students in the highest quintile received care through a school-based health clinic (1.6% vs. 2.3%) while a higher percentage of students in the highest quintile were in schools that provided UFM (31.5% vs. 16.9%). The prevalence of co-occurring conditions, especially ODD and CD, increased from the lowest to highest quintiles as did the use of stimulant medications. A similar trend across quintiles was observed with respect to disciplinary referrals and use of special education services.
School Characteristics by Quintile of Schools Based on Rates of Children Within the School Newly Diagnosed With ADHD During Kindergarten.
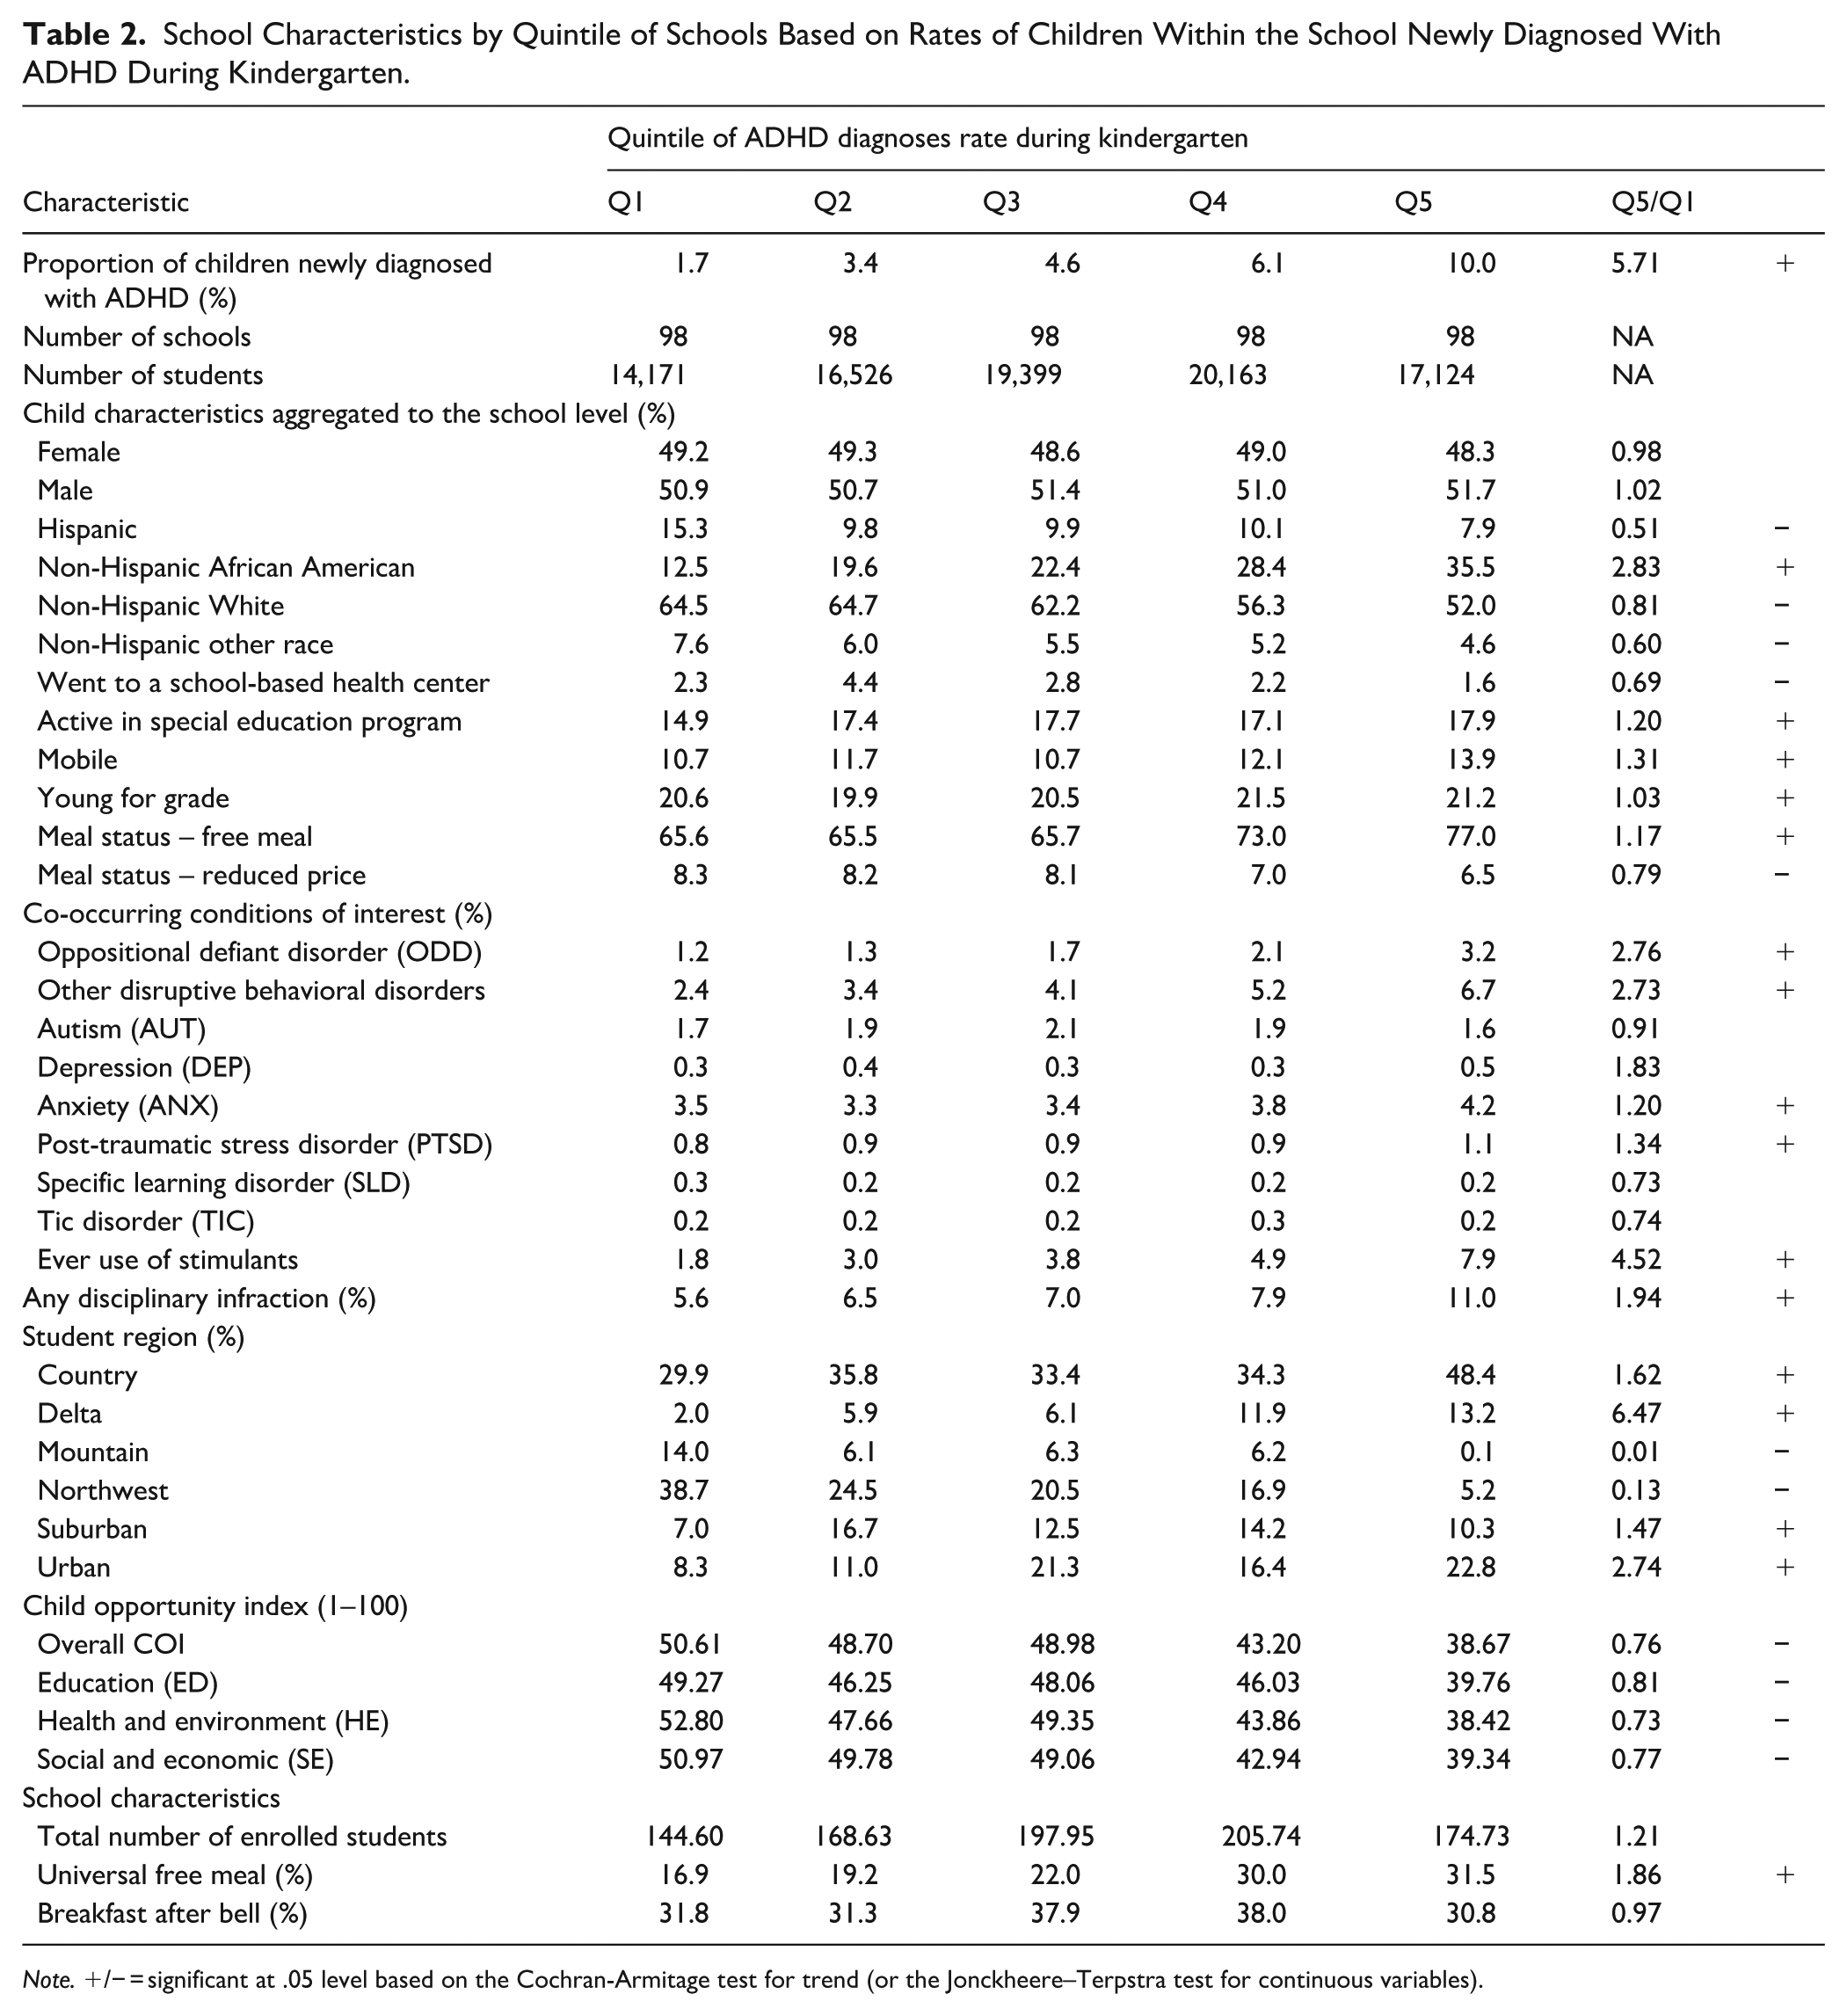
Note. +/− = significant at .05 level based on the Cochran-Armitage test for trend (or the Jonckheere–Terpstra test for continuous variables).
Associations With ADHD Diagnoses
Table 3 presents the odds ratios (OR) and 95% confidence intervals (CIs) estimated from the mixed-effect logistic regression model to predict individual ADHD diagnoses. To facilitate convergence, COI levels were included in the model instead of continuous index scores. Multicollinearity was low based on an assessment of variance inflation factors. Female children, Hispanic children, non-Hispanic children of other races, children living in neighborhoods with very high COI levels in the social and economic domain, and children attending schools offering UFM had lower odds of being newly diagnosed with ADHD during kindergarten compared to their respective reference groups. Conversely, students eligible for free or reduced-price meals, those who transferred between schools, and those who were young-for-grade had significantly higher odds of being diagnosed with ADHD compared to their reference groups.
Adjusted Odds Ratios From Mixed-Effects Logistic Regression Model for the Outcome of ADHD Diagnoses During Kindergarten.
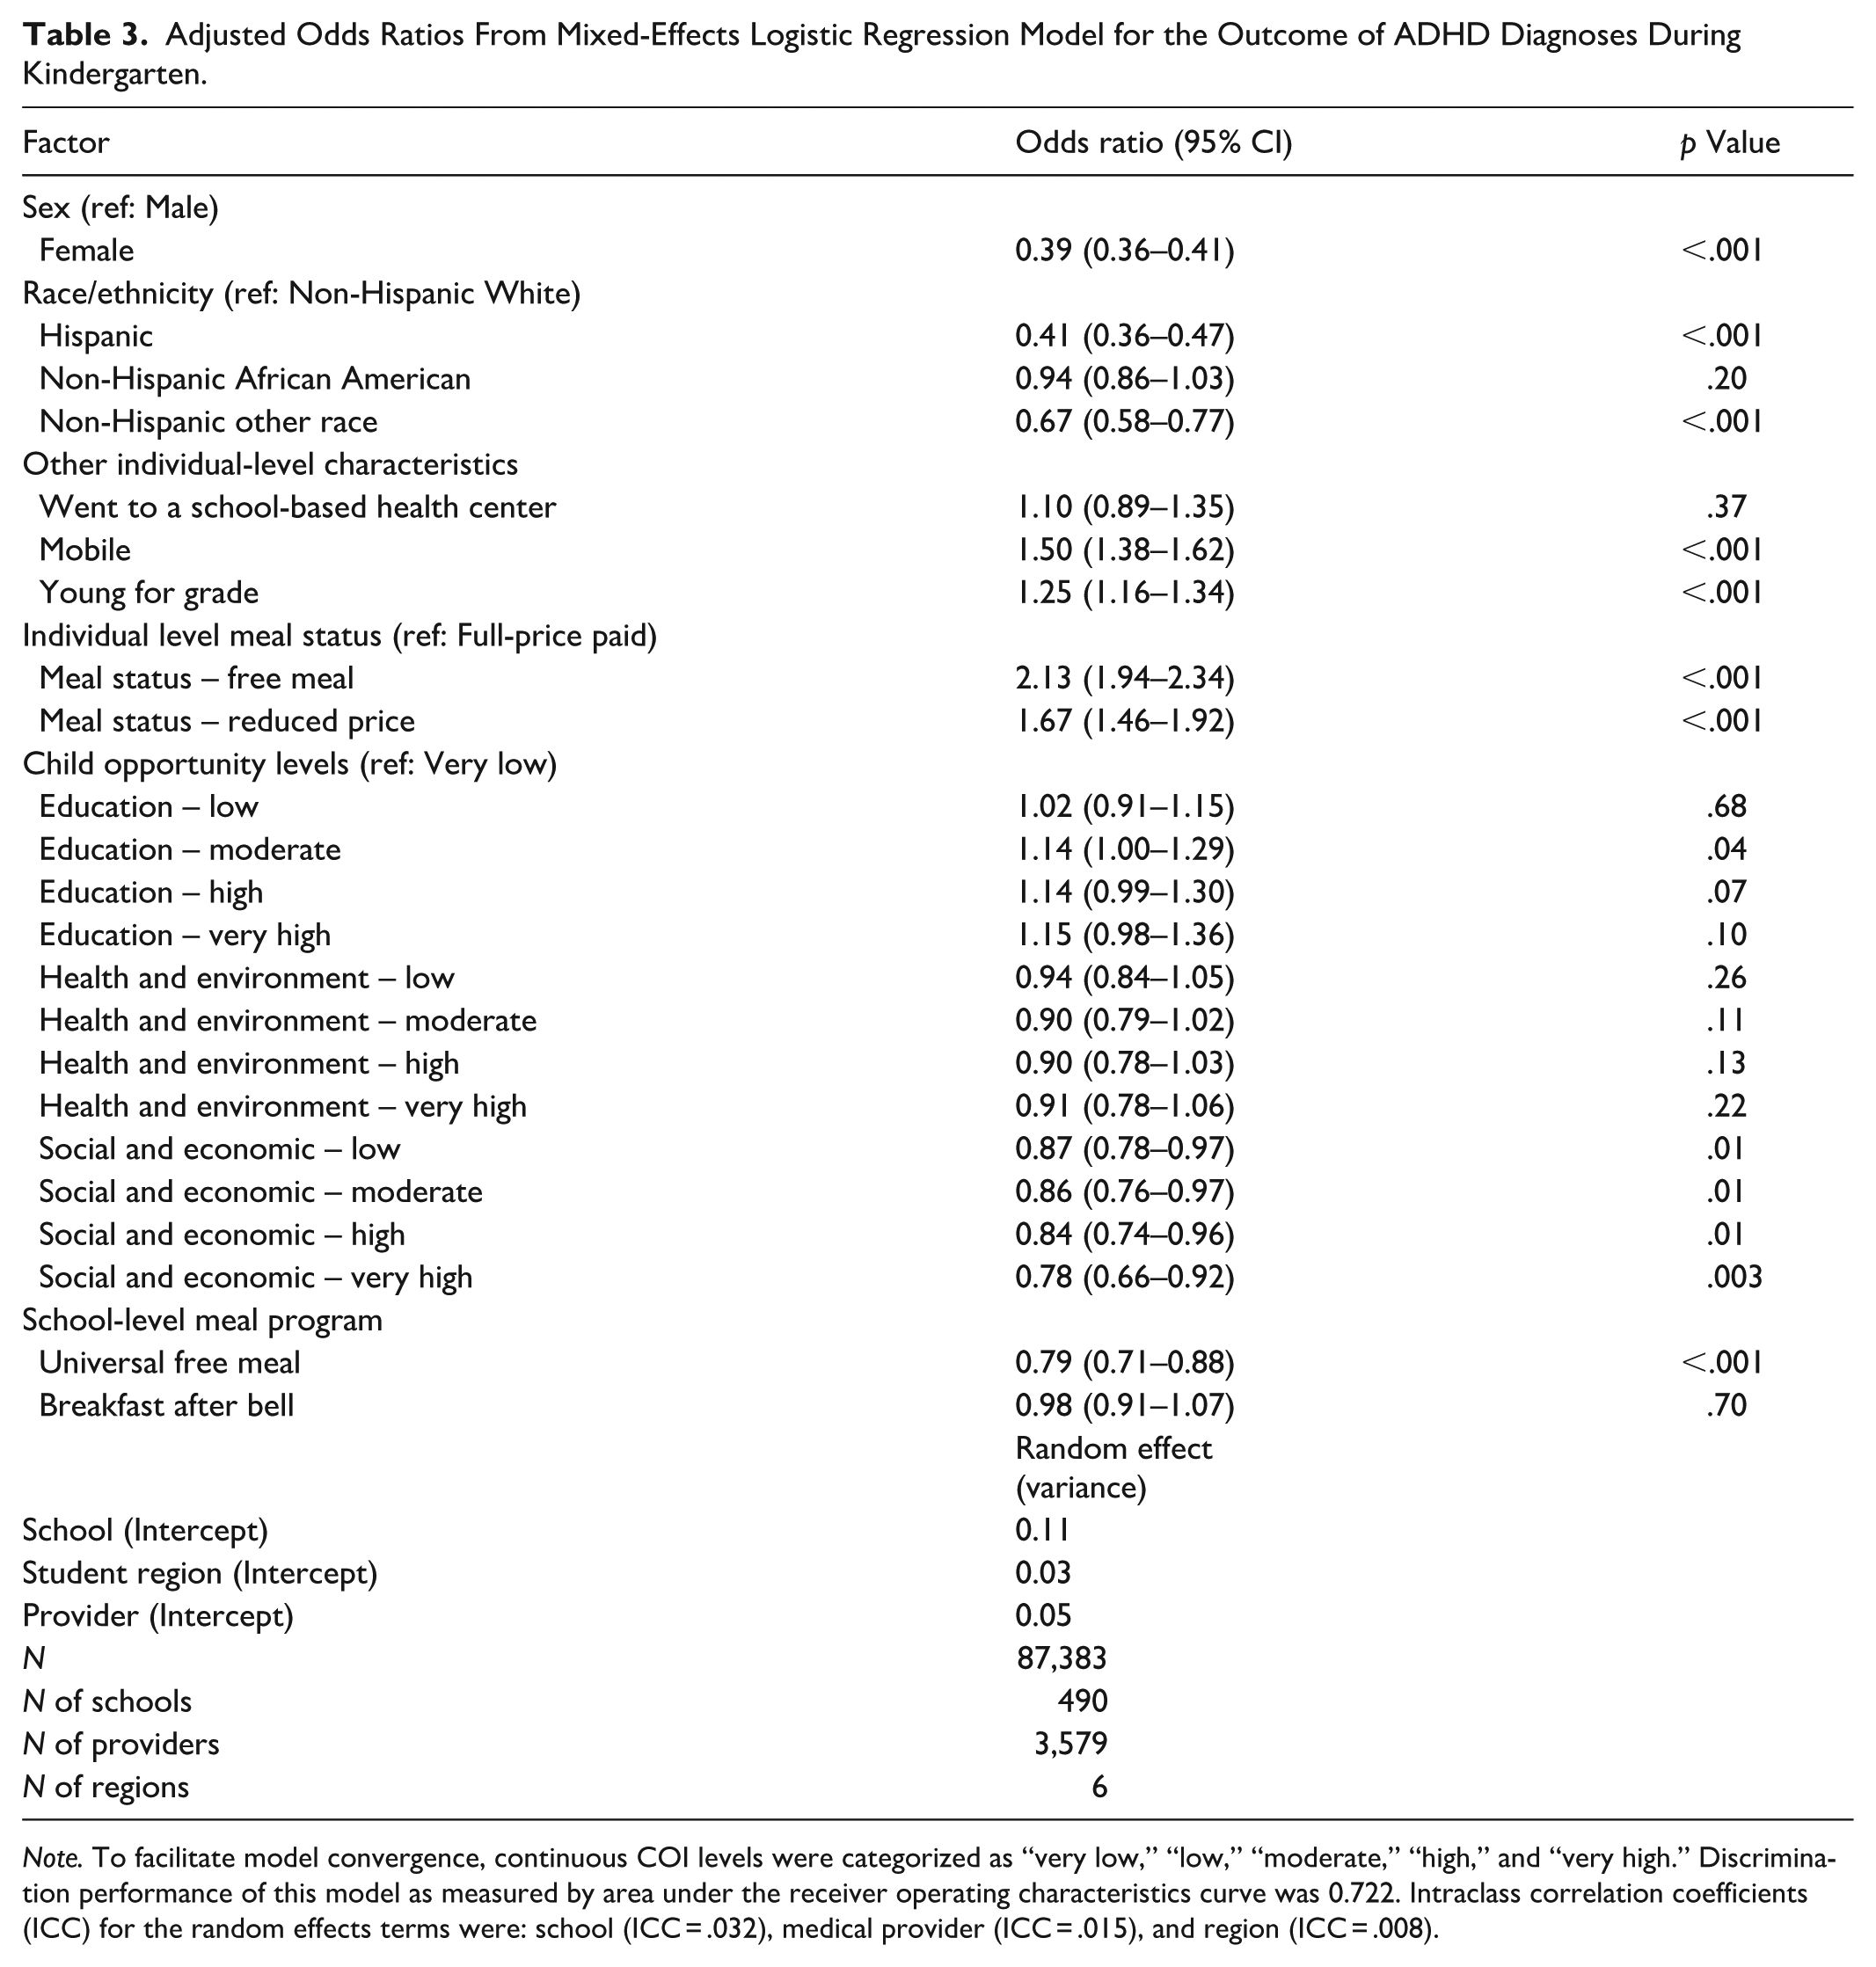
Note. To facilitate model convergence, continuous COI levels were categorized as “very low,” “low,” “moderate,” “high,” and “very high.” Discrimination performance of this model as measured by area under the receiver operating characteristics curve was 0.722. Intraclass correlation coefficients (ICC) for the random effects terms were: school (ICC = .032), medical provider (ICC = .015), and region (ICC = .008).
Figure 2 shows unadjusted (panel A) and model-adjusted (panel B) rates of ADHD diagnosis across the 490 schools. Figure 2 shows that the median observed ADHD diagnosis rate shows a 4.9-times difference between the 10th and 90th percentiles whereas the median model-adjusted ADHD diagnosis rate shows a 2.2-times difference between the 10th and 90th percentiles.
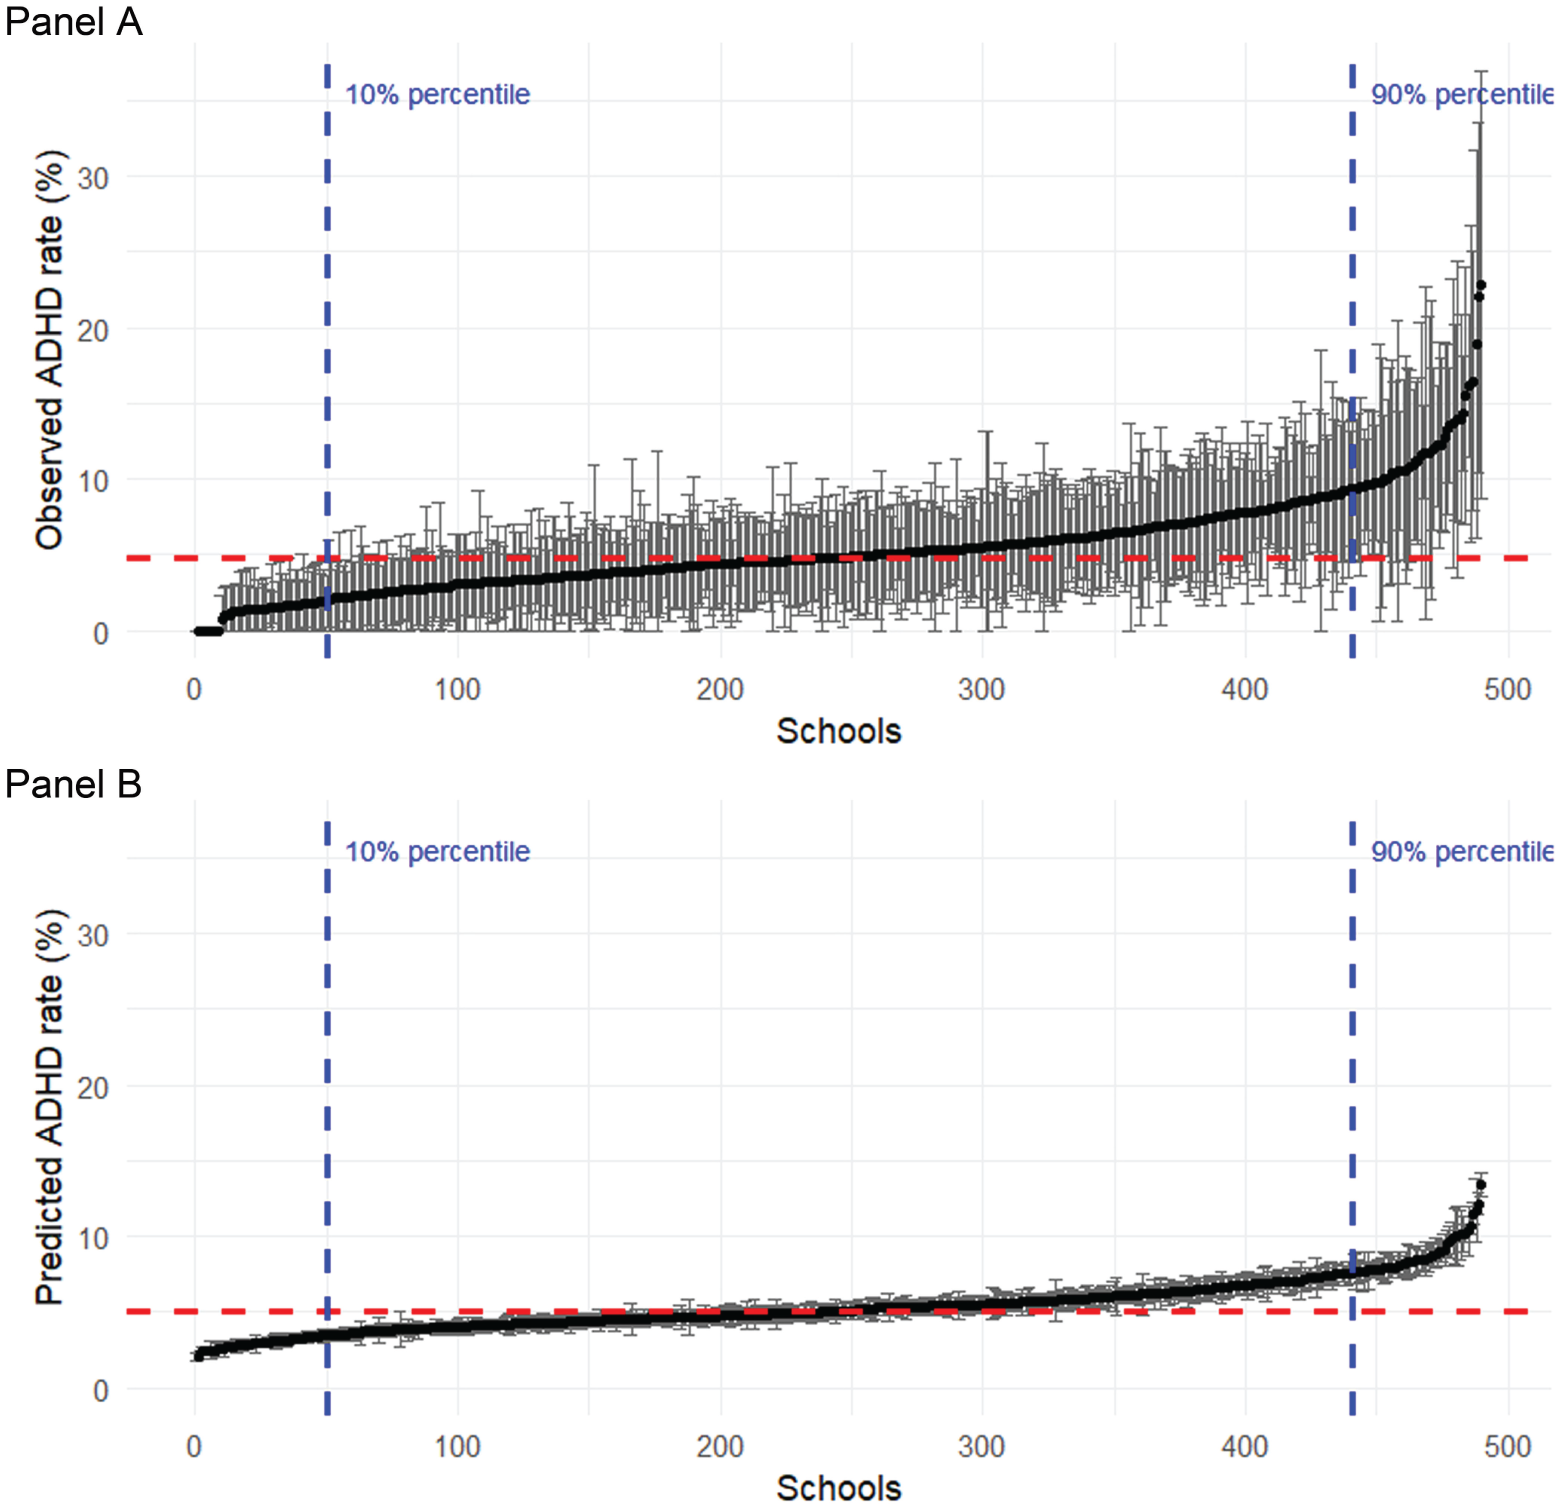
Unadjusted and model-adjusted rates of ADHD diagnosis.
Sensitivity Analysis
A comparison of findings including children without continuous coverage in the 12-month lookback and 10-month study periods are reported in eFigure 2 and eTables 3 to 5 in Supplement 1. As expected, diagnosis rates were lower without the continuous coverage requirement, but primary findings align with those reported above. Associations from mixed-effects logistic regression models were robust to the exclusion of provider effects or school effects. However, the model included both school and provider effects had a lower Akaike Information Criterion, indicating better model fit (eTable 6 in Supplement 1).
Discussion
This study extends the literature on variability in ADHD diagnoses by examining school-level variability in new medical claims-based ADHD diagnoses among kindergarteners using a novel dataset with linked administrative educational and medical claims data for children in Arkansas. We found substantial school-level variability: Schools in the highest quintile of new ADHD diagnoses had a diagnosis rate nearly six times higher than those in the lowest quintile. Compared to schools in the lowest quintile, schools in the highest quintile included a higher proportion of African American children and children eligible for free or reduced-price school meals. We also observed several factors to be significantly associated with child-level odds of receiving an ADHD diagnosis during kindergarten. After adjusting for these factors, the difference in diagnostic rates across the 10th to 90th percentile of schools was reduced by half. These results suggest potential factors to examine in future research designed to examine causal relationships between school-level factors and rates of ADHD diagnoses.
The current findings extend prior work demonstrating variability in rates of childhood ADHD diagnoses based on geography (Zgodic et al., 2023) and primary care practice (Mayne et al., 2016) both within and outside of the United States. Previous research in Norway has demonstrated geographical variability in ADHD diagnoses with evidence that variability in this context may be driven by clinician attitudes and local practice styles (Arruda et al., 2022; Bannett et al., 2020; Lyhmann et al., 2022; Widding-Havneraas et al., 2022). However, our findings that mixed-effect models were robust to inclusion of provider effects suggest that the school-level variation observed in Arkansas is unlikely be explained solely by providers.
Although the associations observed here do not establish causal relationships, they do have potential implications for policies that may promote equity in diagnoses. The school-level variability in ADHD diagnoses observed here occurred in the context of school-level disparities in resources and child academic and disciplinary outcomes observed in the literature (Jain et al., 2015; Owens, 2021; Skiba et al., 2014; Welsh & Little, 2018). Rates of ADHD diagnoses may interact with these school-level disparities in complex ways. Indeed, schools with the highest ADHD diagnosis rates also had higher rates of disciplinary referrals. Exclusionary discipline in elementary school contributes to an escalation of behavioral issues, which may predispose the child to an ODD or CD diagnoses and/or interactions with the juvenile justice system (Jacobsen et al., 2018). Additionally, although UFM schools generally serve children from neighborhoods facing economic disadvantage, we also found that attending a school with UFM was associated with 21% lower adjusted odds of receiving an ADHD diagnosis, which is an intriguing finding. There is a need for further probe and test mechanisms through which school meal policy could impact diagnosis or outcomes for children with ADHD. Finally, our results also replicate well-established findings about relative age effects (Elder, 2010; Evans et al., 2010; Frisira et al., 2024; Layton et al., 2018; Schnorrbusch et al., 2020) on ADHD diagnosis, where children who are young for their grade level are more likely to be diagnosed, which highlights the potential importance of ensuring that ADHD screening protocols are cognizant of the child’s developmental stage relative to their classroom peers.
This study has several limitations. Although it is the first to link claims data to educational records on school enrollment, it does not contain information on children who attended kindergarten in private schools, who did not have insurance, or who were covered under a self-insured employer plan that was not required to report to the AR-APCD. The use of claims data poses limitations related to gaps in patient history, exclusion of cash payments, and inability to assess adherence to recommendations and medications. In particular socioeconomic status can affect medical coverage gaps and, in the data reported here, socioeconomic indicators were significant predictors of an ADHD diagnosis. Because we required continuous coverage for inclusion in the study, our data are likely over-represents children on public insurance and children who were consistently on private insurance at the lower and upper ends of the socioeconomic gradient, respectively. This study also did not capture related educational classifications (e.g., Other Health Impairment) or ADHD-related services that were not reflected in health insurance claims, which means that the overall rates of ADHD observed here may be an underestimate. While the study draws data from a diverse statewide school system including both urban and rural areas, findings from one state may not apply generally to other areas of the US or elsewhere in the world, especially as healthcare access and educational policy vary across states and countries. Finally, it is important to emphasize that the associations observed in this study are observational and may be influenced by unmeasured confounding, so these associations cannot be interpreted as causal.
Conclusion
Although many studies have observed variation in ADHD diagnoses, our contribution lies in highlighting how this variation manifests at the school level in the United States and generates new approaches for equitable diagnoses. Schools with the highest incidence of ADHD diagnoses served children from less affluent families living in neighborhoods with lower economic opportunity, which is broadly consistent with the idea of social determinants of health risk factors that may interact with biological risk for ADHD (Chaulagain et al., 2023). Across schools, higher incidences aligned with a larger percentage of children being cited for one or more disciplinary infractions, highlighting the importance of initiatives that prevent escalation of behavioral problems.
Supplemental Material
sj-docx-1-jad-10.1177_10870547261465052 – Supplemental material for Variation in Rates of ADHD Diagnoses Across Public Schools in Arkansas
Supplemental material, sj-docx-1-jad-10.1177_10870547261465052 for Variation in Rates of ADHD Diagnoses Across Public Schools in Arkansas by Xueying Ma, Gwendolyn M. Lawson, Joe Sundell, Bradley C. Martin, Shahed Md Abu Sufian, Joseph W. Thompson, John Mick Tilford and Michael R. Thomsen in Journal of Attention Disorders
Footnotes

Funding
The authors disclosed receipt of the following financial support for the research, authorship, and/or publication of this article: Research reported in this publication was supported by the National Institute of Mental Health of the National Institutes of Health under Award Number R01MH133857. The content is solely the responsibility of the authors and does not necessarily represent the official views of the National Institutes of Health.
Declaration of Conflicting Interests
The authors declared the following potential conflicts of interest with respect to the research, authorship, and/or publication of this article: Dr. Lawson reported receiving grants from the National Institute of Mental Health outside of the submitted work. Dr. Martin receives royalties from TrestleTree LLC for the development of an opioid risk prediction tool, which is unrelated to this investigation. Dr. Martin reports grants from the UAMS Translational Research Institute (National Center for Advancing Translational Sciences) and has a research grant from the National Institute on Drug Abuse and the Eunice Kennedy Shriver National Institute of Child Health and Human Development. Dr. Thompson reported receiving research grants from the National Institute of Drug Abuse and the National Science Foundation outside of the submitted work. Dr. Tilford receives royalties from TrestleTree LLC for the development of an opioid risk prediction tool, which is unrelated to this investigation and consulting fees from Merck. Dr. Tilford also reported grants from the UAMS Translational Research Institute (National Center for Advancing Translational Sciences), Centers for Disease Control and Prevention, and the National Institute of Diabetes and Digestive and Kidney Diseases. Dr. Thomsen reported grants from the National Institute on Minority and Health Disparities, the Robert Wood Johnson Foundation, and the United States Department of Agriculture outside of the submitted work.
Data Availability Statement
Data used in this study are governed under data sharing agreements between the University of Arkansas for Medical Sciences (UAMS) and the Arkansas Department of Education (ADE) and between UAMS and the Arkansas Insurance Department (AID) through the Arkansas Biosciences Institute. The authors are unable to share data given these agreements. Researchers seeking access to these data will need independent permissions from both AID and ADE. Both departments have transparent DSA processes in place. The study PI, Dr. Thomsen, will provide reasonable assistance to facilitate this approval for other researchers.
Supplemental Material
Supplemental material for this article is available online.
Author Biographies
References
Supplementary Material
Please find the following supplemental material available below.
For Open Access articles published under a Creative Commons License, all supplemental material carries the same license as the article it is associated with.
For non-Open Access articles published, all supplemental material carries a non-exclusive license, and permission requests for re-use of supplemental material or any part of supplemental material shall be sent directly to the copyright owner as specified in the copyright notice associated with the article.
