
Abstract
Activation of the antioxidant response element (ARE) upregulates enzymes involved in detoxification of electrophiles and reactive oxygen species. The induction of ARE genes is regulated by the interaction between redox sensor protein Keap1 and the transcription factor Nrf2. Fluorescently labeled Nrf2 peptides containing the ETGE motif were synthesized and optimized as tracers in the development of a fluorescence polarization (FP) assay to identify small-molecule inhibitors of the Keap1-Nrf2 interaction. The tracers were optimized to increase the dynamic range of the assay and their binding affinities to the Keap1 Kelch domain. The binding affinities of Nrf2 peptide inhibitors obtained in our FP assay using FITC-9mer Nrf2 peptide amide as the probe were in good agreement with those obtained previously by a surface plasmon resonance assay. The FP assay exhibits considerable tolerance toward DMSO and produced a Z′ factor greater than 0.6 in a 384-well format. Further optimization of the probe led to cyanine-labeled 9mer Nrf2 peptide amide, which can be used along with the FITC-9mer Nrf2 peptide amide in a high-throughput screening assay to discover small-molecule inhibitors of Keap1-Nrf2 interaction.
Introduction
The upregulation of oxidative stress response enzymes by natural products from fruits and vegetables represents the focus of current chemoprevention research. 1 The expression of genes that encode these enzymes are regulated through a cis-acting element, the antioxidant response element (ARE) found in the promoter region of these genes. 2 Nuclear factor E2-related factor 2 (Nrf2), a member of the Cap n’ Collar (CNC) family of proteins, plays a major role in the oxidative stress response as the transcription factor that binds to the ARE to induce the coordinated expression of antioxidant and cytoprotective genes.3–5 It contains a highly conserved basic leucine zipper (bZIP) structure characteristic of the CNC transcription factors and requires a small Maf protein as a partner for nuclear transport and DNA binding.6,7 The interaction of the Nrf2-Maf heterodimer with the cis-acting ARE is essential for the upregulation of oxidative stress response by Nrf2. 8 Nrf2 is the central transcription factor that interacts with ARE to induce the expression of cytoprotective genes.1,3,9
By comparing the amino acid sequences of Nrf2 across different species, six conserved homologous domains (Neh1 to Neh6 domains) of Nrf2 have been identified. 10 Of these domains, the C-terminal Neh1 contains the bZIP domain for DNA binding and dimerization with Maf, and the N-terminal Neh2 domain acts as the regulatory domain by interacting with the cytoplasmic redox sensor protein Keap1 (Kelch-like ECH-associated protein 1). Keap1 is a BTB-kelch protein consisting of five distinct domains: NTR (N-terminal region), BTB (broad complex, tramtrack, and brick a’ brac), intervening region (IVR), double glycine repeat or Kelch, and C-terminal region (CTR). The Kelch domain is a six-bladed β-propeller in which each blade is composed of four β-strands. Along with the CTR domain, the Kelch domain contributes to complex formation with the N-terminal Neh2 domain of Nrf2. 11 The BTB domain of Keap1 is a protein-protein interaction motif involved in the homodimer formation.12–14
The N-terminal BTB domain of Keap1 interacts with Cul3, a member of the cullin family of E3 ubiquitin-protein ligases. Thus, Keap1 acts as the substrate adaptor protein that bridges the interaction between Cul3 and Nrf2 through its N-terminal BTB and the C-terminal Kelch domains. 15 Normally, this Cul3-based E3 ubiquitin ligase complex functions to sequester Nrf2 in the cytoplasm by targeting multiple lysine residues in the Neh2 domain of Nrf2 for ubiquitination.16,17 The IVR domain of Keap1 contains a cysteine-rich region that acts as the primary sensor of oxidative stress response. Specifically, the modification of two highly reactive cysteine residues, C273 and C288, is believed to lead to the dissociation of Keap1-Nrf2 complex, the subsequent translocation of Nrf2 into the nucleus, and the ultimate activation of ARE genes.10,18,19 Disrupting the Keap1-Nrf2 complex may increase the body’s defense against carcinogens and reactive oxygen species generated during oxidative stress by inducing the expression of ARE-regulated genes and upregulating the expression of oxidative stress response enzymes.18,20,21 Thus, the Keap1-Nrf2 complex in the ARE signaling pathway is believed to be the key target for cancer chemoprevention and inflammation.22,23
The DLG and the ETGE motifs within the Neh2 domain of Nrf2 are two evolutionary conserved motifs of the CNC family of proteins. The DLG motif has been reported to be involved in ubiquitin-dependent degradation of Nrf2, whereas the ETGE motif has been reported to be essential for the Keap1 regulation of Nrf2 activity.24,25 Although both motifs bind to the same site in Keap1, the ETGE motif was reported to be approximately 100-fold stronger in affinity to Keap1 than the DLG motif. 14 Several different ETGE-containing Nrf2 peptides have been reported to displace Nrf2 from Keap1. 26 The longer ETGE-containing 14mer and 16mer Nrf2 peptides (H-LQLDEETGEFLPIQ-OH and H-AFFAQLQLDEETGEFL-OH) were able to effectively displace the Nrf2 protein from the Keap1:Nrf2 complex; the binding affinity (Kd) between the longer Nrf2 peptides and Keap1 Kelch domain was found to be as low as 20 nM, as measured by isothermal titration calorimetry (ITC).14,26 The shorter 10mer Nrf2 peptide (H-LDEETGEFLP-OH) also displaces the Nrf2 protein from the complex, although it is much less effective than the longer Nrf2 peptides. With the exception of these Nrf2-derived peptides, there are currently no known small molecules that can directly interfere with the protein-protein interaction between Keap1 and Nrf2.
We have recently reported the development of surface plasmon resonance (SPR)–based assays to examine the interactions between Keap1 Kelch domain and Nrf2, to measure the inhibitory activity of Nrf2 peptides against the Keap1-Nrf2 interaction and to determine the minimal Nrf2 peptide sequence required for Keap1 binding. 27 Despite their advantages of label-free detection, full automation, and real-time monitoring of binding interactions, the SPR assays require separate injections for each test sample, are of relatively low throughput, and do not meet the throughput requirement for high-throughput screening (HTS) applications. To facilitate the discovery of small-molecule inhibitors of Keap1-Nrf2 interaction, we report the development of a homogenous fluorescence-based competition assay that can be adapted to the high-throughput screening of chemical libraries. This assay uses a peptide tracer selected from a series of Nrf2 peptides of varying length based on the high-affinity ETGE motif in the Neh2 domain of the Nrf2 protein. We demonstrated that the assay can distinguish inhibitory Nrf2 peptides that have varying affinities. The assay is robust and can be adapted to a high-throughput format for the discovery of small-molecule inhibitors of the Keap1:Nrf2 complex. Molecules that interfere with the Keap1:Nrf2 complex formation can be used to induce the expression of ARE genes and could potentially be developed into chemopreventive and therapeutic agents.28,29
Materials and Methods
Peptide Synthesis
All peptides were synthesized and purified as described previously. 27 Briefly, standard Fmoc chemistry was used for the synthesis of Nrf2 peptides on either Wang or 2-chlorotrityl chloride (2CTC) resin. After cleavage, the peptides were purified on a Gilson preparative high-performance liquid chromatography (HPLC) system using a reversed-phase BDS-Hypersil C18 column (150 × 20 mm). The peptides were obtained at >95% purity and their identities confirmed by LC-MS and high-resolution mass spectrometry.
Peptide Modification and Labeling
Fluorescein-labeled peptides were prepared by modification of purified peptides with fluorescein isothiocyanate (FITC) according to the manufacturer’s standard protocol. Briefly, the peptide (1 mg) was dissolved in 0.5 mL of 100 mM sodium carbonate buffer at pH 8.5, and FITC (2 eq.) was added to the solution. The reaction was stirred at room temperature for 12 h while protected from light. The progress of the labeling reaction was monitored by the disappearance of the starting peptide using LC-MS. A 1 N solution of sodium bisulfate (NaHSO4) was added to reduce the pH of the reaction to 2, and the precipitated crude modified peptide was collected by centrifugation. The product was purified by reversed-phase HPLC. For labeling of the 9mer Nrf2 peptide amide (H-LDEETGEFL-NH2) with N-hydroxy succinimide (NHS) esters of BODIPY-FL, Cy3B and Cy5, the peptide was first dissolved in anhydrous DMSO containing 5 eq. of triethylamine, which was then followed by the addition of the NHS ester (1.2 eq.) in one portion. The reaction mixture was stirred for 12 h at room temperature protected from light. The reaction was acidified with formic acid before the mixture was diluted with water for reversed-phase HPLC purification.
The N-biotinyl 16mer Nrf2 peptide for the SPR binding assay was prepared on a solid phase as previously described. 27 Briefly, 2CTC resin-bound 16mer Nrf2 peptide (20.0 mg) was reacted with a 1 mL solution of biotin (12.4 mg, 5 eq.) preactivated with 2-(1H-benzotriazole-1-yl)-1,1,3,3-tetramethyluronium hexafluorophosphate (19.3 mg, 5 eq.) in N-methylpyrrolidone (NMP) containing N, N-diisopropylethylamine (10.7 µL, 6 eq.). The biotinylated 16mer Nrf2 peptide was cleaved from the resin by a 3 h treatment of the resin-bound peptide with 95% trifluoroacetic acid (TFA) containing 2.5% triisopropyl silane (TIS) and 2.5% water. The crude peptide obtained after ether precipitation was redissolved in 50% acetonitrile in 10 mM ammonium acetate and purified on a reversed-phase HPLC.
The N-acetylation of the 9mer Nrf2 peptide and 9mer Nrf2 peptide amide was performed on the resin-bound 9mer Nrf2 peptides as previously described. 27 Briefly, the resin was preswollen in DCM for 30 min and washed 3 times with NMP. The resin was treated with acetic anhydride (5 eq.) and pyridine (5 eq.) in NMP for 30 min, and the capping reaction was monitored by ninhydrin test. The crude peptide was cleaved from the resin with TFA containing 2.5% TIS and 2.5% water as the scavengers. The peptide was purified on a reversed-phase HPLC.
Peptide Concentration Determination
The concentrations of unlabeled Nrf2 peptide solutions were determined by amino acid analysis through acid hydrolysis and o-phthaldialdehyde/N-Boc-L-cysteine derivatization as described previously. 30 The concentrations of fluorescently labeled Nrf2 peptides were determined based on the absorbance of the fluorophores at their characteristic λmax. Each of the fluorescently labeled Nrf2 peptides was dissolved in 10 mM HEPES buffer, pH 7.4, to give an estimated concentration of 1.0 mM. For fluorescein-labeled peptides, the ultraviolet (UV) absorbance of a diluted sample (50–100× dilution) was measured in triplicate at λmax = 494 nm (ϵ = 68 000 M−1cm−1). For BODIPY, Cy3B, and Cy5-labeled Nrf2 peptides, the UV absorbances were measured at 504 nm, 563 nm, and 646 nm, respectively; the concentrations were calculated using molar extinction coefficients of 87 000 M−1cm−1, 130 000 M−1cm−1, and 250 000 M−1cm−1, respectively. These diluted samples were used as stock solutions for the fluorescence polarization assays.
Protein Expression and Purification of Human Keap1 Kelch Domain
The recombinant human Keap1 Kelch domain was expressed and purified as previously described.31,32 Briefly, the Kelch domain (residues 321–609) was cloned into a Novagen pET15b vector (EMD Chemicals, San Diego, CA) between an NdeI site and a BamHI site. The vector construct was then used to transform Escherichia coli BL21(DE3)pLysS cells, and the cells were grown to an optical density of ~0.6 at 595 nm. The expression of the Keap1 Kelch domain was induced by the addition of isopropyl-β-D-1-thiogalactopyranoside to a final concentration of 1 mM. Cells were harvested 3 to 4 h after induction and stored at 4 °C. The Kelch domain was purified to homogeneity on an ÄKTA FPLC system (Pharmacia, now GE Healthcare, Piscataway, NJ) using an Ni-NTA column (Novagen) followed by a Mono Q column (Pharmacia). The molecular weight of the purified protein was confirmed by MALDI-TOF mass-spectrometric analysis.
Anisotropy Measurements
All fluorescence polarization (FP) assays were performed on a Wallac Victor 3V multilabel counter/plate reader (PerkinElmer, Shelton, CT) using the excitation and emission filters appropriate for each fluorophore used in the binding experiment. The plates used for the FP measurements were the black nonbinding surface Corning 3650 96-well or Corning 3575 384-well plates, loaded with 80 or 40 µL of assay solution per well. For fluorescein and BODIPY, 485 nm excitation and 535 nm emission filters were used. For Cy3B, excitation and emission filters of 560 nm and 650 nm were used, respectively. For Cy5, 579 nm excitation and 670 nm emission filters were used. The FP assays were performed in 10 mM HEPES buffer, pH 7.4, containing 50 mM EDTA, 150 mM NaCl, and 0.005% Tween-20. All aqueous solutions were prepared using deionized water collected from a Millipore water purification system.
FP was determined by measuring the parallel and perpendicular fluorescence intensity (F║ and F┴) with respect to the linearly polarized excitation light. The fluorescence polarization (P) and the anisotropy (A) are expressed by equations 1 and 2, respectively, and the anisotropy A is related to the P value by equation 3.


We elected to use anisotropy in our quantitative analysis because anisotropy values can be combined additively. In addition, total fluorescence (F║ + 2F┴) was calculated for each well to ensure that the fluorescence intensity was consistent with the amount of fluorescent probes used across all assay wells.
Measurement of Binding of Fluorescent Peptide Probes to the Keap1 Kelch Domain
The binding of the fluorescently labeled Nrf2 peptides to the Keap1 Kelch domain was determined by dose titration of the fluorescent peptide probes with varying concentrations of Keap1 Kelch domain protein. The maximum anisotropy achieved at a high concentration of Keap1 Kelch domain protein defines the upper end of the dynamic range for the peptide probe, and the total fluorescence (F║ + 2F┴) at the high concentration of Keap1 Kelch domain protein can be used to calculate the Q value, the quantum yield ratio of the bound and the free fluorescent peptide probe. Equation 4 is used to calculate fb, the fraction of the bound probe, at a given concentration of Keap1 Kelch domain protein:
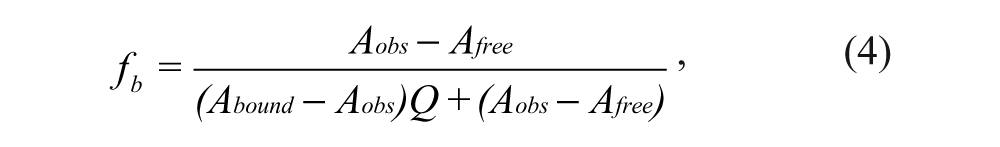
where Aobs, Abound, and Afree refer to the observed anisotropy at the given concentration of Keap1 Kelch domain protein, the anisotropy of probe when it is bound to the Keap1 Kelch domain protein, and the anisotropy of the free probe, respectively. The fb data obtained can be fitted to the quadratic equation 5 to derive Kd using SigmaPlot (SPSS, Chicago, IL):
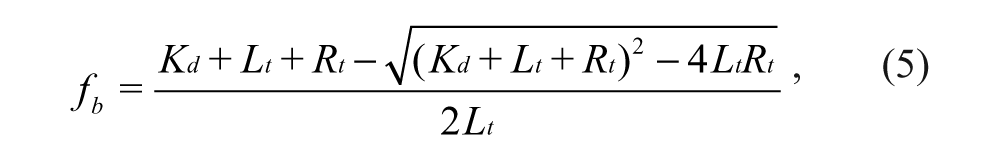
where Lt is the concentration of total peptide probe used, which was fixed at 10 nM, and Rt is the concentration of Keap1 Kelch domain protein, which varied between 0 and 2 µM.
FP Competition Assays to Determine the Inhibitory Potency of the Keap1-Nrf2 Interaction
A competition assay using the conditions described above was established and miniaturized to a 384-well plate format to determine the potency of inhibitors of the Keap1-Nrf2 interaction. A Packard Bioscience (now PerkinElmer) Multiprobe II HT EXpanded liquid-handling robot was used to deliver small volumes of solutions to each of the 384 wells. Each well had a final volume of 40 µL that consisted of 10 µL of 40 nM FITC-9mer Nrf2 peptide amide and 10 µL of 400 nM Keap1 Kelch domain protein, 10 µL of HEPES buffer, and 10 µL of an inhibitor sample of varying concentrations. The binding experiments were performed in triplicates, with initial concentration of the inhibitor typically set between 10 µM and 100 µM depending on the inhibitor potency and serially diluted twofold to give a concentration range down to 0.5 nM or 5 nM. The plate was centrifuged at 370 g for 2 min to get rid of any air bubbles in the assay solution and to ensure thorough mixing. The plate was covered and allowed to equilibrate for 30 min at room temperature. The plate was centrifuged again prior to FP measurements.
The percentage inhibition of the competitor at each concentration point was determined by using equation 6, and the IC50 of an inhibitor was determined from the plot of %inhibition against inhibitor concentration using equation 7.
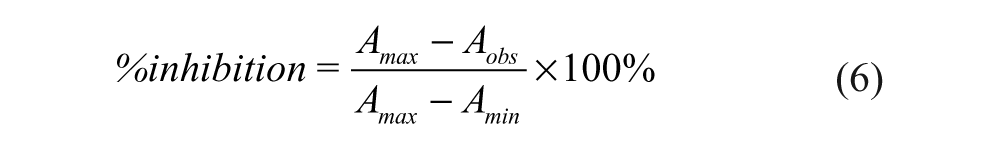

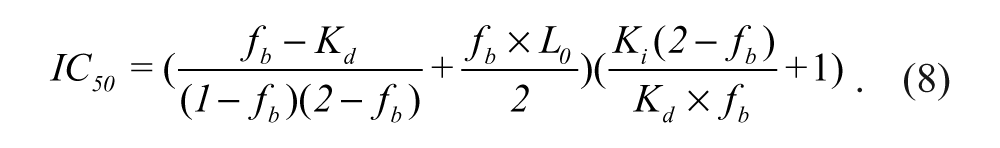
IC50 is the concentration of an inhibitor needed to inhibit 50% binding of the fluorescently labeled peptide probe, and x is the log of the inhibitor concentration. The values of Amax, Amin, and Aobs in the equations refer to the anisotropy of the wells containing Keap1 and the probe, the anisotropy of the free probe, and the observed anisotropy for the wells containing the inhibitors at a range of concentrations under the assay conditions. The IC50 values determined were used to derive Ki of the inhibitors using equation 8 with f b set at 0.75. 33
For the measurement of Z′ factor, a 384-well plate was prepared with 10 nM FITC-9mer Nrf2 amide and 100 nM Keap1 Kelch domain in 10 mM HEPES buffer in the presence or absence of 1 µM of N-acetyl 9mer Nrf2 amide (44 replicates each). From the anisotropy of 10 nM FITC-9mer Nrf2 peptide amide in the presence of 100 nM Keap1 Kelch domain (~75% bound, as the negative control) and the anisotropy of 10 nM FITC-9mer Nrf2 peptide amide in the presence of 100 nM Keap1 Kelch domain and 1 µM N-acetyl-9mer-Nrf2 peptide amide (~80% inhibition, as the positive control), the Z′ factor was calculated by the equation

where µ c1 and µ c2 are the mean values of the positive control and negative control wells, respectively, and σ c1 and σ c2 are the standard deviation of the positive and negative control wells, respectively. When comparing the different fluorescent probes, only the top and bottom replicates were used to derive the Z′ factor.
The Effect of DMSO on Anisotropy Measurement
The effect of DMSO on our FP assay was determined by measuring the anisotropy change of the Keap1-bound and free fluorescent probe in the presence of DMSO in the assay solutions at concentrations up to 20%. Briefly, 20 µL of the assay buffer containing varying concentrations of DMSO and 10 µL of 40 nM FITC-9mer Nrf2 peptide amide was added to a Corning 3575 384-well plate. Then, either 10 µL of 400 nM Keap1 Kelch domain protein or 10 µL of buffer was added to each well, and the plate was centrifuged for 2 min at 370 g. The plate was incubated for 30 min in the dark at room temperature prior to the anisotropy measurement.
SPR Binding Assay
The SPR competition binding assay was carried out on a Biacore 3000 biosensor (GE Healthcare) using the immobilized N-biotinylated 16mer Nrf2 peptide as the ligand and Keap1 Kelch domain as the analyte. 27 Briefly, the streptavidin surface on a CM5 chip was slowly saturated by the biotin-labeled Nrf2 peptide, and the maximum immobilization level of ~300 RU was finally achieved. Fc1 of the chip without the Nrf2 peptide was used as the blank surface. All interactions between the Keap1 Kelch domain and the immobilized biotin-16mer Nrf2 peptide were carried out with a 1 min association time and a 3 min dissociation time at a flow rate of 30 µL/min. The sensor chip surfaces were regenerated with a 0.5 min injection of 1 M NaCl at a flow rate of 30 µL/min. The regeneration step was followed by two buffer washes of IFC and the needle. The data analysis was performed using BIAevaluation software v4.1 by measuring the slope of the initial association phase from the SPR sensograms after double subtraction of responses from the reference surface and the zero blank in the absence of the Keap1 Kelch domain. To calculate the concentrations of free (i.e., unbound) Keap1 Kelch domain, a standard curve was constructed using serially diluted solutions of Keap1 Kelch domain with concentrations covering the observed Keap1 Kelch domain concentrations in the competition assay. For the competition binding assay, a solution of Keap1 Kelch domain at a fixed concentration of 20 nM or 40 nM and various concentrations of inhibitory Nrf2 peptides ranging from 0 nM to 1 µM was introduced over each surface (Fc1 and Fc2). The slopes of initial association phase obtained from sensograms were used to calculate the concentrations of free Keap1 Kelch domain and the fraction of Keap1 Kelch domain (fb) bound to the inhibitory peptides. The fb data obtained was fitted to the quadratic equation 5 to derive Kd using SigmaPlot (SPSS), where Rt is the concentration of Keap1 Kelch domain used, which was fixed at 20 nM or 40 nM, and Lt is the concentration of each inhibitory Nrf2 peptide.
Pilot Screen of the NCI Diversity Set II and Clinical Collection
Test compounds were dissolved in DMSO to give 10 mM stock solutions like most library compounds are. The pilot screen was performed in duplicates at 100 µM of test compound, 100 nM Keap1 Kelch domain, and 10 nM FITC-9mer Nrf2-NH2 in 10 mM HEPES buffer, pH 7.4, containing 2% DMSO with a total volume of 40 µL in 384-well Corning 3650 plates. N-acetyl-9mer-Nrf2 amide was used as the positive control. The plates were covered and centrifuged for 2 min at 370 g, then left to equilibrate in the dark for 30 min at room temperature prior to the anisotropy measurement. The compounds were considered hits when the average %inhibition > mean + 3 SD. The %inhibition was calculated by using equation 6.
Results and Discussion
Selection of the FP Assay Conditions
Nrf2 peptides of different length (8mer to 16mer) based on the ETGE motif were synthesized using Fmoc chemistry. The ETGE motif is known to bind to Keap1 with 100-fold higher affinity than the DLG motif 14 ; thus, we hypothesized that fluorescently labeled peptides based on the ETGE motif could be used as the probe with high binding affinity to the Keap1 Kelch domain. The length of the Nrf2 peptides also affects Keap1 binding with the ETGE-containing 16mer Nrf2 peptide (H-AFFAQLQLDEETGEFL-OH) reported to have a Kd of approximately 20 nM, 26 whereas the shorter 10mer Nrf2 peptide (H-LDEETGEFLP-OH) was reported to have weaker binding affinity. The Nrf2 peptides synthesized were cleaved from the resin prior to FITC labeling to avoid the Edman degradation of the FITC-labeled Nrf2 peptides during TFA cleavage of the peptides from the resin. 34
To determine the optimal conditions for our FP assay, we used the FITC-labeled 16mer Nrf2 peptide as the initial fluorescent probe to explore different assay conditions. We measured the anisotropy of the fluorescently labeled 16mer Nrf2 peptide as a function of its concentration to select the optimal concentration of the probe for use in our FP binding assays. Anisotropy is a size-dependent, not concentration-dependent, property, and the observed anisotropy in the presence of protein is related to the amount of the protein-bound probe relative to the free probe. However, too low of a probe concentration would lead to increased errors in anisotropy measurements. It is thus necessary to select a probe concentration that will provide reliable anisotropy signal. As shown in Figure 1A , 10 nM of the FITC-16mer Nrf2 peptide gave a reliable anisotropy measurement that is within the fluorescence linear range. Concentrations higher than 10 nM did not significantly improve the error of anisotropy measurement, while at lower concentrations, the anisotropy signals fluctuate as the errors become more prominent due to background noise in the fluorescence measurements.
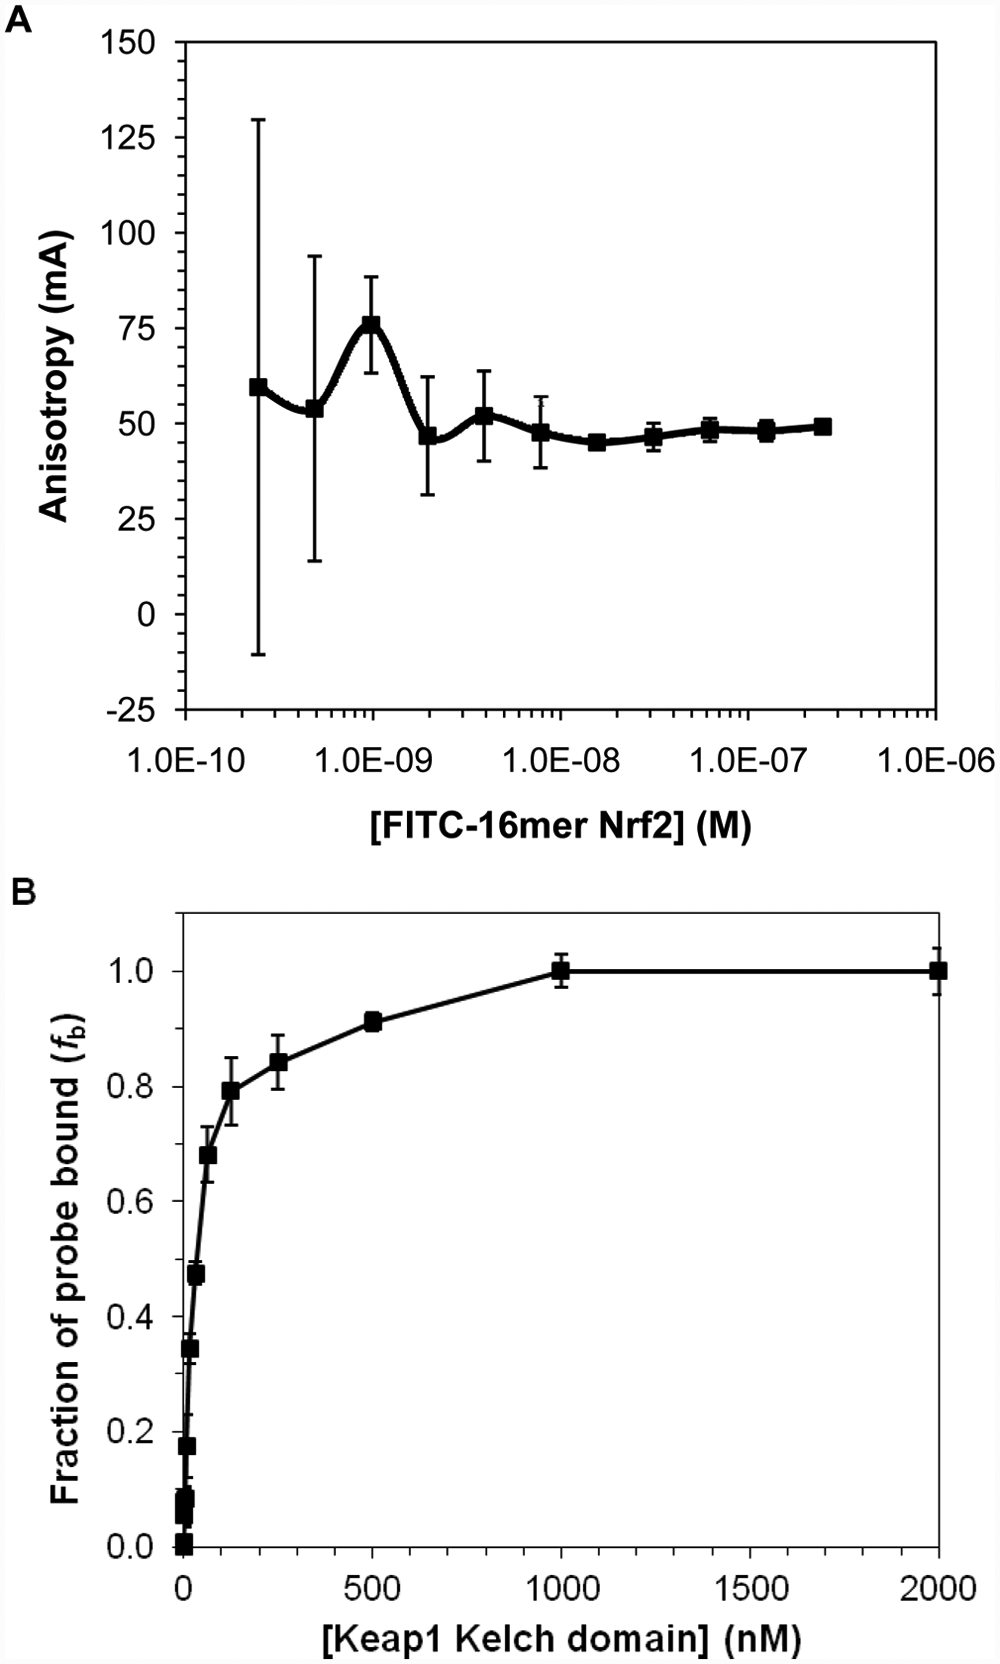
(A) The anisotropy of FITC-labeled 16mer Nrf2 peptide as a function of peptide probe concentration and (B) the plot of fraction bound of FITC-16mer Nrf2 peptide to Keap1 Kelch domain against Keap1 concentration. For the fluorescence polarization assay shown in (B), a fixed concentration (10 nM) of FITC-16mer Nrf2 peptide was incubated with a range of concentrations of Keap1 Kelch domain for 30 min at room temperature. The assay plate was centrifuged at 370 g for 2 min prior to anisotropy measurement. Fraction of the probe bound to Keap1 Kelch domain, fb, was calculated using equation 4, as discussed in the Materials and Methods section. Error bars represent the standard deviations of triplicate measurements.
The equilibration time required for the assay was determined by following the increase in anisotropy signal every 10 min over a 3 h incubation period after mixing the human Keap1 Kelch domain protein with the fluorescent probe. The time it took for the anisotropy signal to plateau was used as the binding period for all of the assays. The equilibration was complete within 30 min at room temperature, which was selected as the incubation time for our FP assay.
Based on the FP binding assay shown in Figure 1B , the FITC-labeled 16mer Nrf2 peptide has a Kd of 28.7 nM. This level of affinity is in good agreement with the Kd obtained using ITC. 26 Although the FITC-labeled 16mer Nrf2 peptide has good binding affinity, the dynamic range of the 16mer peptide (ΔmA = 80.1 mA) was relatively small. We decided to shorten the sequence to obtain peptide probes with similar binding affinity but with a larger dynamic range. In principle, the ideal peptide probe for the FP assay should be relatively short in length to avoid the “propeller effect” caused by the flexibility of the fluorescent dye on a tracer, which depolarizes the fluorescence signal of the bound complex.35,36 Therefore, it is preferable to attach the fluorescent dye as close as possible to the peptide binding site to increase the tracer rigidity without adversely affecting the peptide’s binding affinity.
Optimization of Fluorescently Labeled Nrf2 Peptide Probes for the FP Assay
The X-ray crystal structure of 16mer Nrf2 peptide-Keap1 Kelch domain complex has shown that the 16mer Nrf2 peptide is much longer than the DxETGE motif that is needed for binding to the Keap1 Kelch domain. 26 Several N-terminal residues extend out away from the binding surface of the Kelch domain and make contact with symmetry-related molecules in the crystal. Therefore, the shorter DxETGE-containing Nrf2 peptides could retain the strong binding affinity to the Keap1 Kelch domain and provide a higher dynamic range for our FP assay. In the optimization of the fluorescent Nrf2 peptide probe, we successively deleted the N-terminal residues in the 16mer Nrf2 peptide and compared the Keap1 Kelch domain binding affinity and the FP dynamic range for the resulting shortened Nrf2 peptide probes.
As shown in Table 1 and Figure 2A , the binding of the FITC-labeled 8mer Nrf2 peptide (FITC-DEETGEFL-OH) to the Keap1 Kelch domain was too weak for regression analysis (estimated K d of ~0.75 µM). Interestingly, the binding of the FITC-labeled 9mer Nrf2 peptide (FITC-LDEETGEFL-OH) to the Keap1 Kelch domain was much stronger (K d = 65.1 nM) than the FITC-labeled 8mer Nrf2 peptide, although both peptides contain the necessary DxETGE motif. This suggests that the fluorescent dye could be too close to the binding site in the case of the FITC-8mer Nrf2 peptide and adversely affected the binding of the peptide to the Keap1 Kelch domain and also that the 8mer Nrf2 peptide was not sufficient for binding to the Keap1 Kelch domain, as discussed later. The binding affinity of the FITC-16mer Nrf2 peptide was the highest, with a K d of 28.7 nM, which was approximately twofold stronger in affinity to the Keap1 Kelch domain as compared with the shorter FITC-9mer Nrf2 peptide. The equilibrium dissociation constants for the longer FITC-labeled Nrf2 peptides (11mer–14mer) were very close to that of the FITC-9mer Nrf2 peptide, suggesting that most of the bonding interactions between the Keap1 Kelch domain and Nrf2 reside in the 9mer Nrf2 peptide (LDEETGEFL), and the binding affinity is not significantly affected by the peptide length as long as the peptide contains the nine amino acids in the DxETGE motif.
The Binding Affinities and Dynamic Range for FITC-Labeled Nrf2 Peptides a
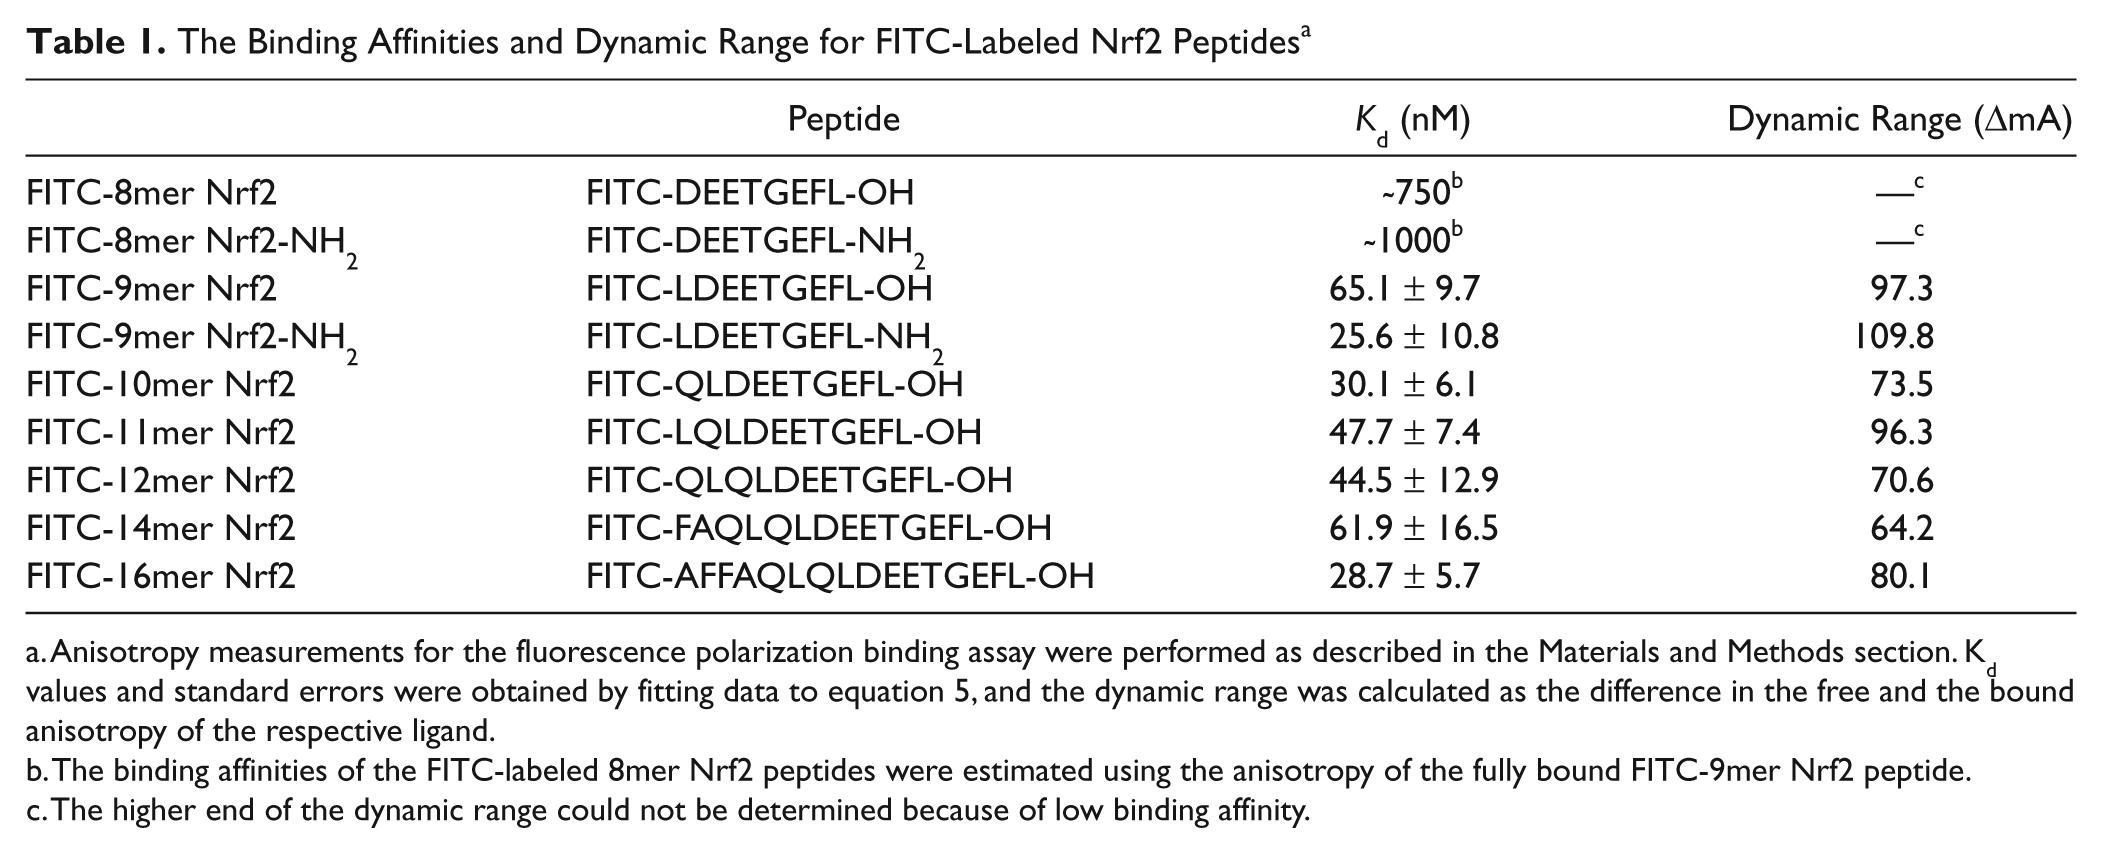
Anisotropy measurements for the fluorescence polarization binding assay were performed as described in the Materials and Methods section. Kd values and standard errors were obtained by fitting data to equation 5, and the dynamic range was calculated as the difference in the free and the bound anisotropy of the respective ligand.
The binding affinities of the FITC-labeled 8mer Nrf2 peptides were estimated using the anisotropy of the fully bound FITC-9mer Nrf2 peptide.
The higher end of the dynamic range could not be determined because of low binding affinity.
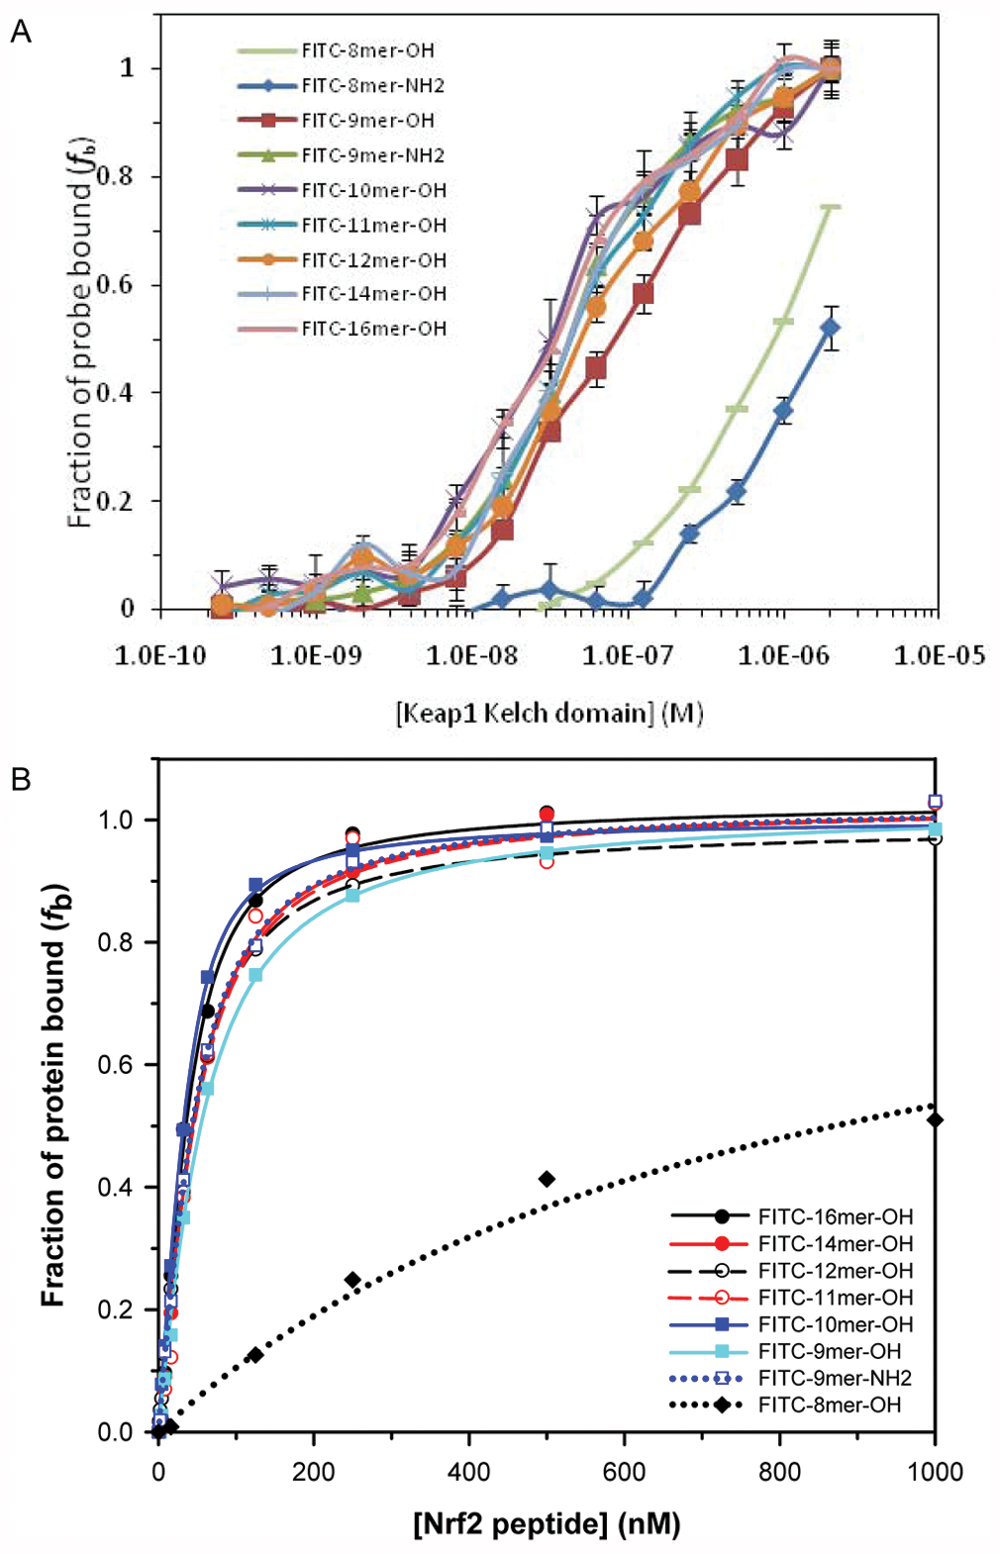
(A) The fraction bound of various FITC-labeled Nrf2 peptides to the Keap1 Kelch domain against the Keap1 Kelch domain concentration based on fluorescence polarization. Each of the fluorescent probes (10 nM) was incubated with varying concentrations of Keap1 Kelch domain (0.2 nM to 2 µM) for 30 min at room temperature before anisotropy measurement. The anisotropy was adjusted with the G-value determined from the literature value of free fluorescein, and the fraction bound (fb) for each point was calculated using equation 4. For FITC-8mer Nrf2 peptide, the value of fb was estimated using FITC-9mer Nrf2 peptide as 100% bound at 2.0 µM Keap1 Kelch domain. Error bars represent the standard deviations of triplicate measurements. (B) The plot of fractions of Keap1 Kelch domain bound to FITC-labeled Nrf2 peptides against FITC-labeled Nrf2 peptide concentrations using the surface plasmon resonance assay. The fraction of Keap1 Kelch domain bound to a given FITC-labeled Nrf2 peptide at various concentrations (0 to 1 µM) was determined using a fixed concentration of Keap1 Kelch domain at 40 nM, as described in the Materials and Methods section.
We have demonstrated in our recent study of the binding of Nrf2 peptides to the Keap1 Kelch domain using an SPR solution competition assay that the binding affinity of the 9mer Nrf2 peptide to the Keap1 Kelch domain can be increased by the N- and C-terminal end capping with the acetyl and amide group, respectively. 27 The N-acetylation of the 9mer Nrf2 peptide by acetic anhydride yielded a short Nrf2 peptide capable of inhibiting the interaction between the Keap1 Kelch domain and Nrf2 at an IC50 similar to the 12mer and the 14mer Nrf2 peptides. End capping is a common technique used in peptide chemistry to obtain peptides that better resemble proteins by removing the otherwise ionizable end groups of the peptide fragments.
To test the effect of C-terminal end capping of the FITC-labeled Nrf2 peptides, the FITC-8mer and FITC-9mer Nrf2 peptide amide were synthesized using the Rink amide resin. As shown in Table 1 and Figure 2A , the effect of N-terminal FITC labeling is similar to the effect of N-acetylation of 9mer Nrf2 peptide, and the FITC-labeled Nrf2 peptides longer than eight amino acids in length differ slightly in terms of their binding affinities to the Keap1 Kelch domain. In addition, the C-terminal end capping of the FITC-9mer Nrf2 peptide as the amide increased the binding affinity of the probe by twofold as compared with the FITC-9mer Nrf2 peptide. However, a similar increase in binding affinity to Keap1 was not observed between the FITC-8mer Nrf2 peptide and the FITC-8mer Nrf2 amide.
As shown in Table 1 , the dynamic range of the FITC-9mer Nrf2 peptide amide (FITC-LDEETGEFL-NH2) was the highest among FITC-labeled Nrf2 peptides tested with 107.8 mA increase in anisotropy upon binding to the Keap1 Kelch domain. The FITC-14-mer Nrf2 peptide (FITC-FAQLQLDEETGEFL-OH) was shown to have the smallest dynamic range of 64.2 mA increase in anisotropy upon binding with a Kd of 61.9 nM, and the FITC-16-mer Nrf2 peptide (FITC-AFFAQLQLDEETGEFL-OH) based on the reported sequence exhibited a mediocre dynamic range of ΔmA = 80.1 mA but a good binding affinity with a Kd of 28.7 nM.
The relatively high dynamic range of the FITC-11mer Nrf2 peptide (ΔmA = 96.3 mA) as compared with some of the shorter peptides was unexpected because of the additional amino acids outside of the DxETGE sequence. The dynamic range for the longer peptides was expected to be lower because the longer peptides contain several residues that extend out of the binding site of the DxETGE motif of Nrf2 and are exposed to solvent. Therefore, the expected decrease in dynamic ranges of the assay for the longer peptides would have been due to the propeller effect, in which the fluorophore extends out of the binding pocket and the flexibility of the fluorophore depolarizes the bound probe. The data shown in
Table 1
do indicate an overall trend that the dynamic range decreases with increasing length of the peptide. From these studies, it was clear that the FITC-9mer Nrf2 peptide amide has the strongest binding affinity to the Keap1 Kelch domain, with a Kd of 25.6 nM and the highest dynamic range of all FITC-labeled Nrf2 peptides synthesized with a ΔmA of 107.8 mA (288.5% increase in anisotropy upon binding). Using N-acetyl-9mer Nrf2 amide as the inhibitor positive control and 75% bound probe in the absence of inhibitors as the negative control, we obtained a Z′ factor of 0.70, as shown in
SPR Binding Assay of FITC-Labeled Nrf2 Peptides to the Keap1 Kelch Domain
The binding affinities of FITC-labeled Nrf2 peptides were confirmed by an SPR binding assay. As shown in Figure 2B and Table 2 , the general trend for the binding affinities of the Nrf2 peptides was similar to the results obtained using our FP assay. Although the binding affinities of the 10mer and 12mer Nrf2 peptides were better than expected, the general trend shows that the binding affinity increases with increasing peptide length. The SPR data also support that most of the binding interaction between the Keap1 Kelch domain and FITC-Nrf2 peptides is within FITC-9mer Nrf2 peptide, as the binding affinities of 9mer to 16mer Nrf2 peptides to the Keap1 Kelch domain are quite similar. Consistent with the FP assay, the 8mer Nrf2 peptide binds weakest to the Keap1 Kelch domain, and the binding affinity is more than 20-fold weaker than that of the FITC-9mer Nrf2 peptide.
The Binding Affinities of FITC-Labeled Nrf2 Peptides Determined by Surface Plasmon Resonance a
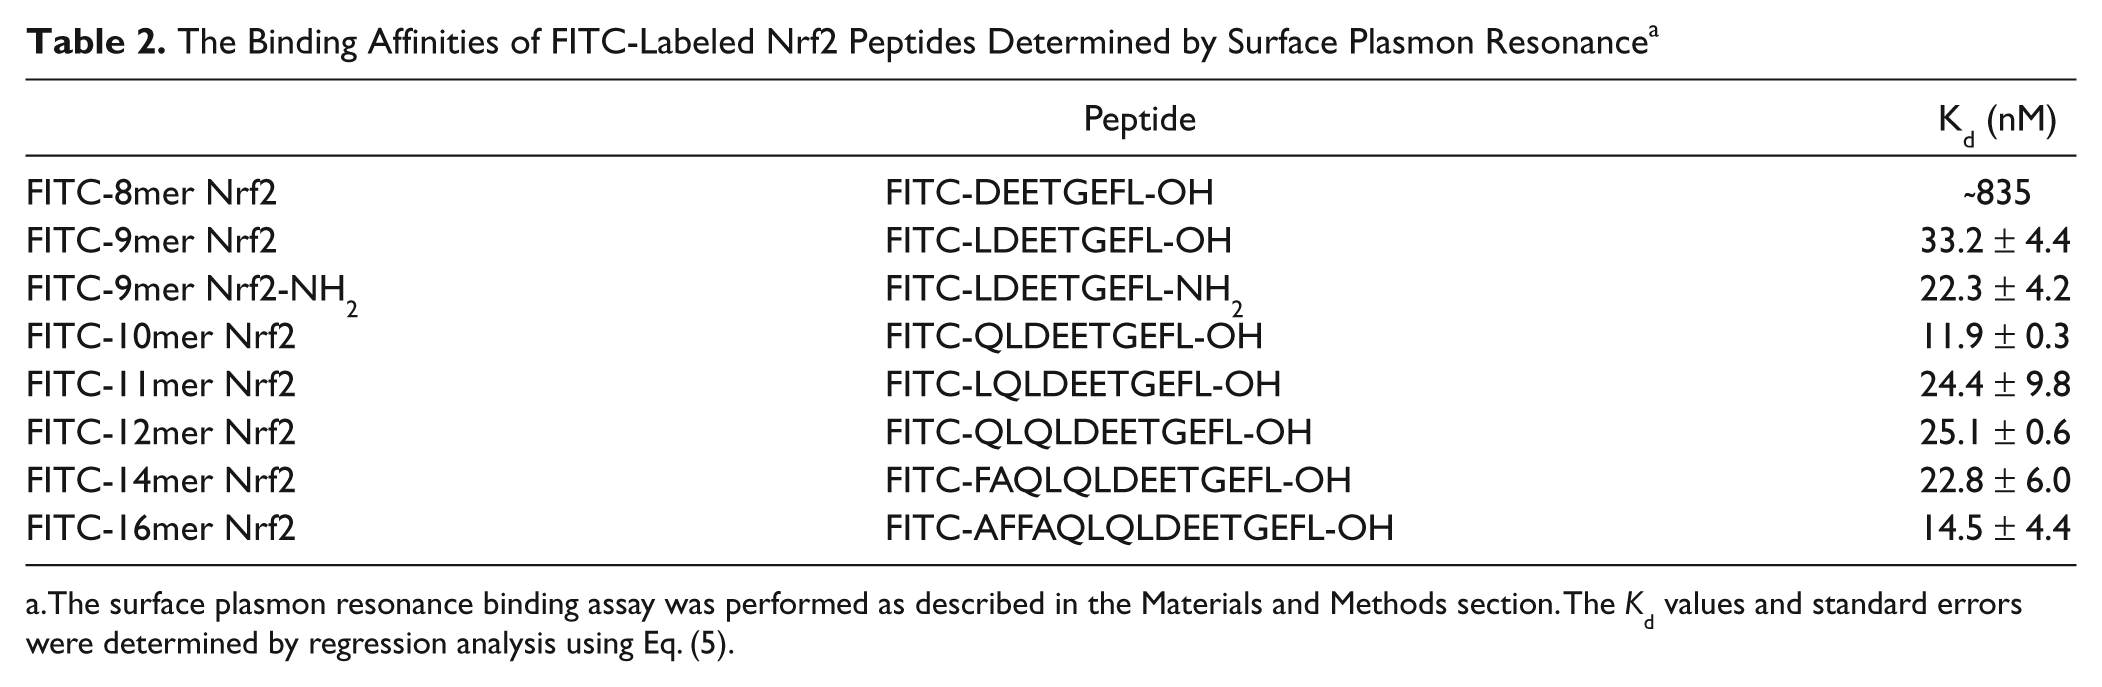
The surface plasmon resonance binding assay was performed as described in the Materials and Methods section. The Kd values and standard errors were determined by regression analysis using Eq. (5).
FP-Based Competition Binding Assay
Our FP assay using FITC-9mer Nrf2 peptide amide as the probe was used to differentiate a series of Nrf2 peptide as inhibitors of the Keap1-Nrf2 interaction in a competition binding assay. The concentration of the Keap1 Kelch domain was fixed at 100 nM to give an fb between 0.7 and 0.8 at a fixed FITC-9mer Nrf2 peptide amide probe concentration of 10 nM (<<2Kd) to satisfy nonstoichiometric titration conditions and achieve sufficient anisotropy level. 33 The results from the competition assay are summarized in Table 3 and Figure 3A . The binding affinities of the Nrf2 peptides against the Keap1 Kelch domain determined by the FP competition assay were similar to the trend in binding affinities for the series of Nrf2 peptides we have previously obtained by the SPR method. 27 The inhibitory activity of the Nrf2 peptide increases with increasing peptide length, as evidenced by the higher IC50 values for the shorter 8mer and 9mer Nrf2 peptides (IC50 = 21.7 and 3.48 µM, respectively) and lower IC50 values for the longer 10mer to the 16mer Nrf2 peptides.
The Inhibition of the Keap1 Kelch Domain-Nrf2 Interaction by Different Nrf2-Peptides as Determined Using the FP-Based Competition Assay Developed a
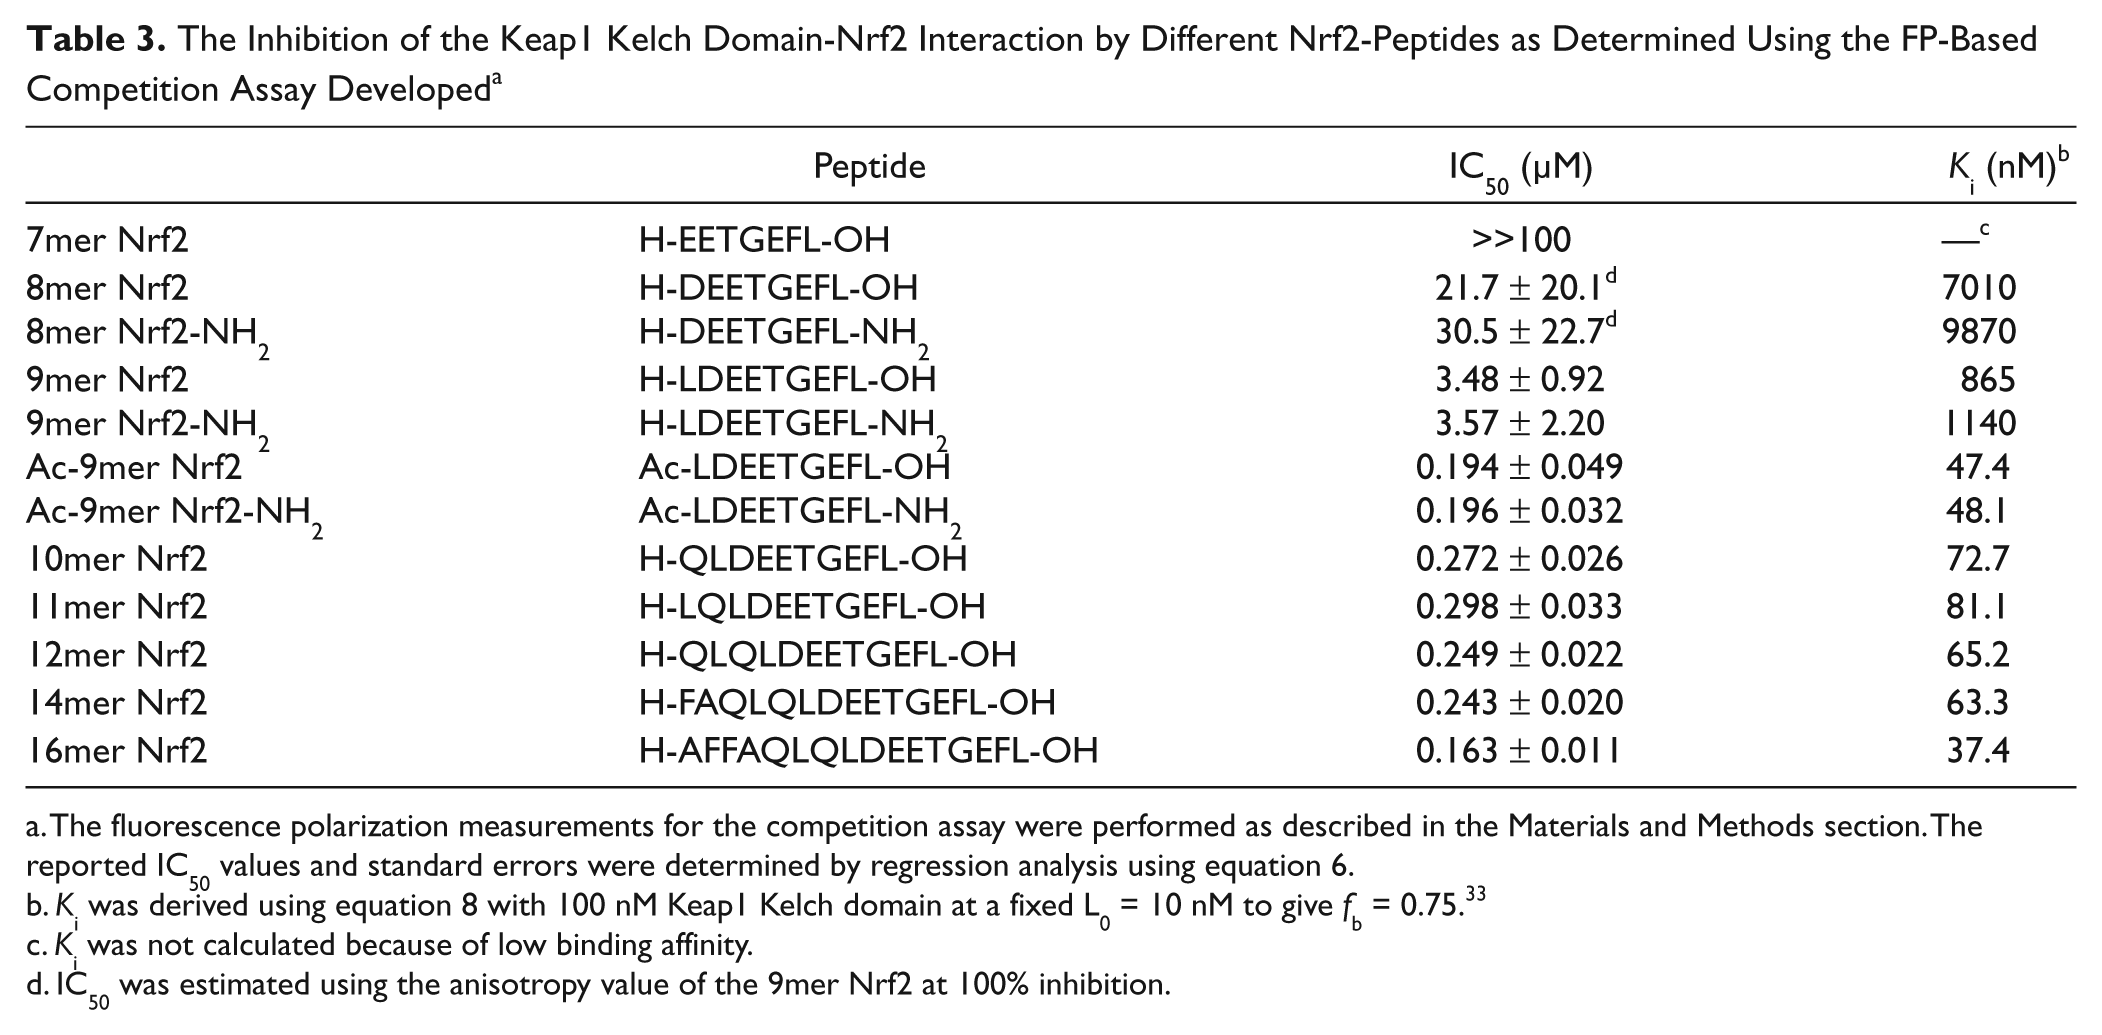
The fluorescence polarization measurements for the competition assay were performed as described in the Materials and Methods section. The reported IC50 values and standard errors were determined by regression analysis using equation 6.
Ki was derived using equation 8 with 100 nM Keap1 Kelch domain at a fixed L0 = 10 nM to give fb = 0.75. 33
Ki was not calculated because of low binding affinity.
IC50 was estimated using the anisotropy value of the 9mer Nrf2 at 100% inhibition.
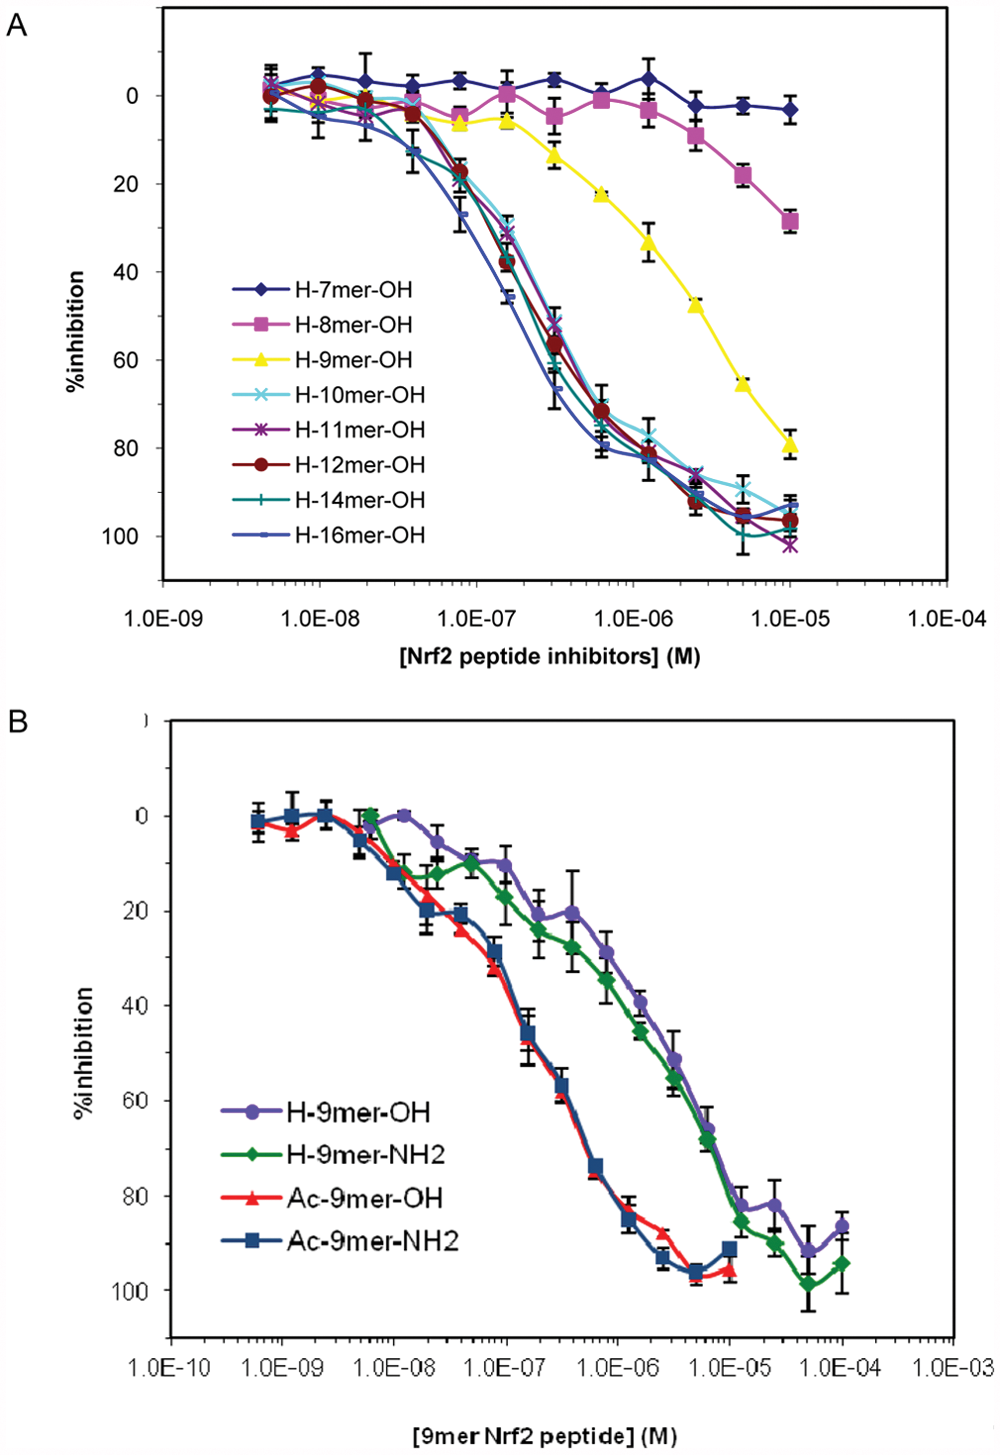
The inhibition of binding of FITC-9mer Nrf2 amide to the Keap1 Kelch domain by (A) Nrf2 peptides and (B) a series of 9mer Nrf2 peptides as determined in the fluorescence polarization–based competition assay. The assay was performed at room temperature using 10 nM FITC-9mer Nrf2 peptide amide as the probe and 100 nM Keap1 Kelch domain in the presence of varying concentrations of the inhibitory Nrf2 peptides. Error bars represent the standard deviations of triplicate measurements.
Our FP data also indicate that the binding affinity of the 16mer Nrf2 peptide is stronger than the shorter Nrf2 peptide and is in good agreement with the previously reported value.26,27 The binding of the 16mer Nrf2 peptide (AFFAQLQLDEETGEFL) was the strongest in our assay, with an IC50 of 163 nM and a calculated Ki of 37.4 nM. The resolution of inhibitor potencies by an FP assay under nonstoichiometric conditions may be limited by the Kd of the probe used. 33 When the inhibitor potency is much stronger relative to the probe (Ki << Kd), the Kd in equation 8 is in linear relationship with the IC50 value. Thus, the IC50 of potent inhibitors will be independent of inhibitor potency and become directly proportional to the Kd of the probe used. However, the trend in binding affinities of Nrf2 peptide inhibitors determined by the FP assay was in good agreement with the results previously obtained by the SPR assay, which indicates that the resolution of binding affinities between the Nrf2 peptides is not limited by our FP competition assay conditions. The assay is able to clearly differentiate the binding affinities of Nrf2 peptides of varying length.
The inhibitory activities of the N- and or C-terminal–capped 9mer Nrf2 peptides were also determined by the FP competition assay. As shown in Figure 3B , a significant 14× increase was observed as a result of N-terminal acetylation of 9mer Nrf2 peptide (IC50 = 194 nM). A similar increase of 18× was observed for the N-acetylation of 9mer Nrf2 peptide amide (IC50 = 196 nM). Although the effect of neutralizing the positive charge at the N-terminus of 9mer Nrf2 peptides by acetylation was obvious, the C-terminal capping as an amide had no effect on the binding affinity. It is believed that the N-terminal labeling of the Nrf2 peptides by fluorescent reagents such as FITC similarly increased the binding affinities of the shorter Nrf2 peptides as N-acetylation.
Comparison of Fluorophores for the FP Assay
To select the best fluorophore for our FP assay, the 9mer Nrf2 peptide amide was also labeled with BODIPY-FL, Cy3B, and Cy5. The BODIPY-FL dye is a known replacement for fluorescein with a higher extinction coefficient (>80 000 M−1cm−1), high quantum yield (1.0 in water), insensitivity to environment such as pH, 37 and sharp excitation and emission bands. The cyanine dyes, Cy3B and Cy5, are also known for their excellent fluorescence properties and high water solubility, which may improve the solubility of the labeled compound in aqueous assay buffers. 38 The Cy3B dye is a “brighter” derivative of Cy3 and could be better suited for FP application due to its increased quantum yield and fluorescence lifetime. The ranking of the fluorophores for FP assay application was determined by determining the K d and dynamic range of each probe to the Keap1 Kelch domain under the same assay conditions developed for FITC-labeled Nrf2 peptides. To determine the dynamic range for each of the probes, 10 nM of each probe was incubated with Keap1 Kelch domain at varying concentrations for 30 min at room temperature.
As shown in Table 4 and Figure 4 , BODIPY-labeled 9mer Nrf2 peptide amide gave the lowest dynamic range of the four fluorescently-labeled peptides with an assay window of 66.5 mA. The FITC-labeled 9mer Nrf2 amide gave the third largest assay window, with an anisotropy change of 109.8 mA, whereas the Cy3B and Cy5-labeled peptides gave assay windows of 167.7 and 143.2 mA, respectively. Interestingly, the cyanine-labeled peptides had slightly higher binding affinity to the Keap1 Kelch domain, whereas the BODIPY-9mer Nrf2 peptide amide showed similar binding affinity to the FITC-labeled peptide.
The Dynamic Ranges, Assay Quality, and Binding Affinities of the 9mer Nrf2 Peptide Amide Probes with Different Fluorophores under Fluorescence Polarization Assay Conditions Developed a
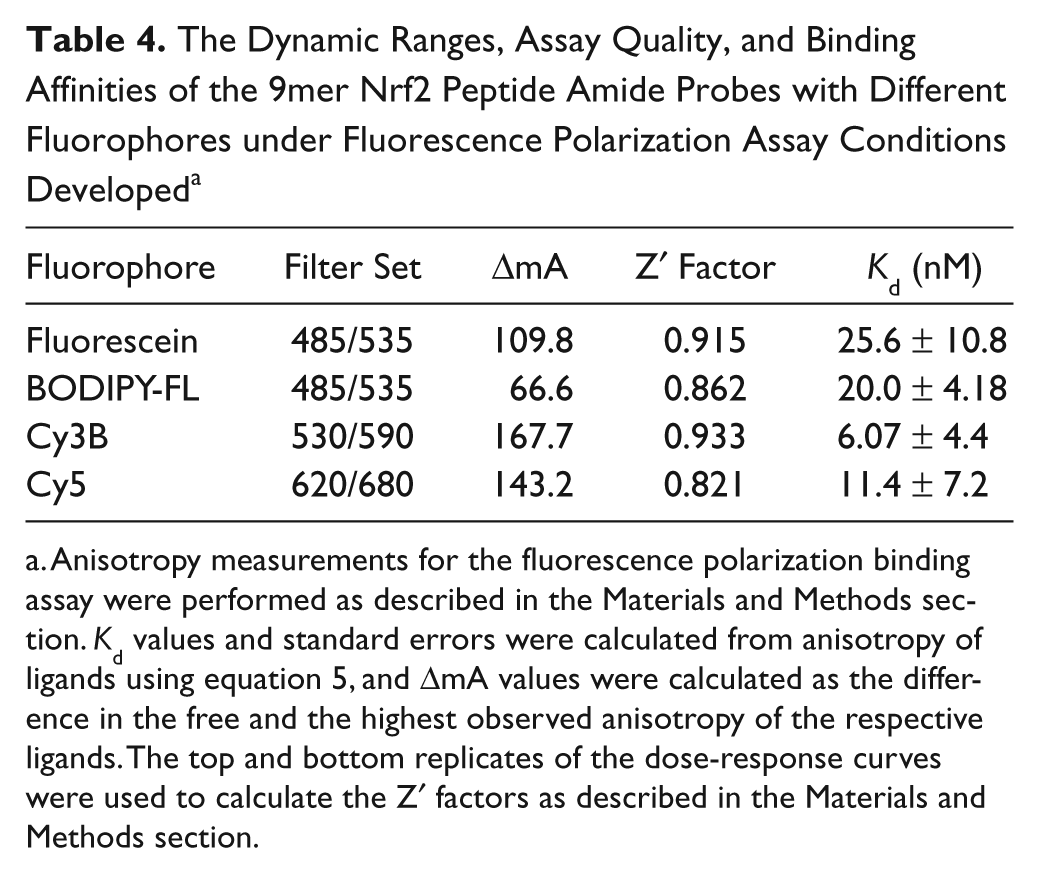
Anisotropy measurements for the fluorescence polarization binding assay were performed as described in the Materials and Methods section. Kd values and standard errors were calculated from anisotropy of ligands using equation 5, and ΔmA values were calculated as the difference in the free and the highest observed anisotropy of the respective ligands. The top and bottom replicates of the dose-response curves were used to calculate the Z′ factors as described in the Materials and Methods section.
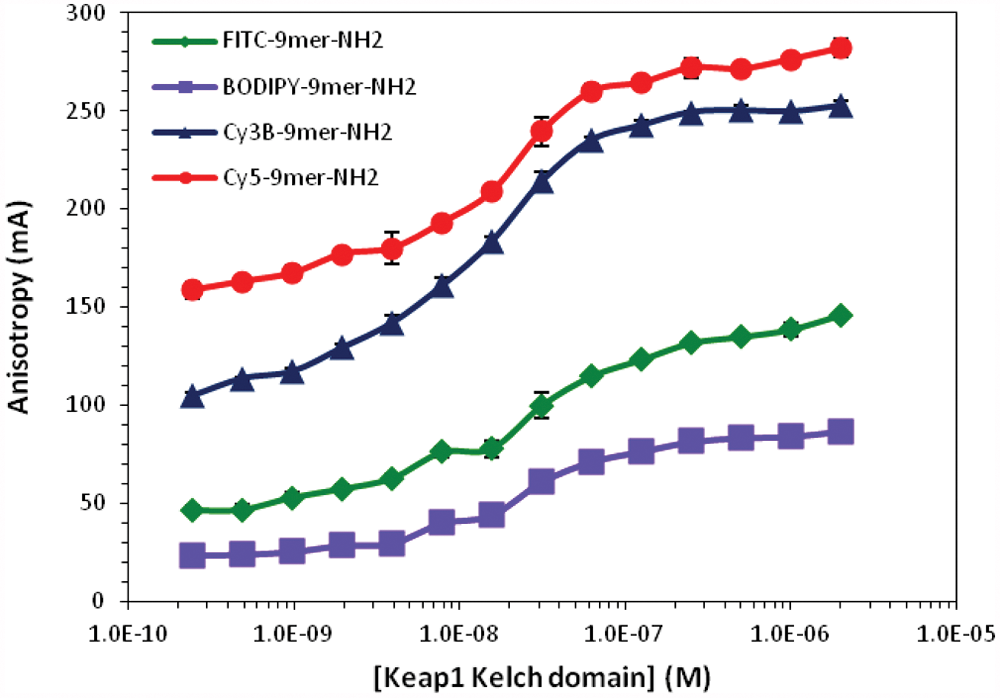
The anisotropy of four 9mer Nrf2 peptide probes plotted as a function of Keap1 Kelch domain concentrations. Each fluorescent probe at a fixed concentration (10 nM) was incubated with varying concentrations of Keap1 Kelch domain (0.24 nM to 2 µM) for 30 min at room temperature. The anisotropy values of each fluorophore were not adjusted by the G-value.
To compare the performance of fluorophores for our assay, the Z′ factor was calculated for each probe. 39 The Z′ factor is a measure of assay performance that incorporates the assay window and the random error present in the FP measurement. According to the Z′ factor model, values greater than 0.5 indicate good assays that may be readily adapted to high-throughput applications. As shown in Table 4 , all of the fluorophores perform well under our assay conditions with the Z′ factors greater than 0.8. Considering the cost of Cy5 and Cy3B label reagents, FITC-labeled peptide is still a viable option for HTS application, as evidenced by the relatively high Z′ factor.
Effect of DMSO on the FP Assay
Compounds in chemical libraries used in HTS are often dissolved in DMSO. Typically, the DMSO concentration for biochemical HTS assays range from 0.5% to 5%, and for FP-based assays, increasing the viscosity of the solution is not desirable, as the polarization of the fluorescent molecules may increase due to slower rotation in viscous solution. The increase in concentration of DMSO does not significantly affect the anisotropy of the bound state of the ligand, whereas the anisotropy of the free ligand slowly increases with increasing concentration of DMSO (
Pilot Screen of NCI Diversity Set II and Clinical Collection Using the FP Assay
We applied the FP assay in a 384-well format in a pilot screen of the NCI Diversity Set II of 1364 compounds and the NIH Clinical Collection (NCC) of 446 compounds. Initial screening of the 1810 compounds in duplicate at 100 µM using %inhibition >20% (mean + 3SD) for hit calling identified 31 primary hits (hit rate 1.7%) after excluding fluorescent compounds based on total fluorescence. The Z′ factors for this pilot screen (26 plates) averaged 0.60 ± 0.05; even though the retest of the 31 primary hits at 10 µM in duplicates did not result in any confirmed hits from this small library of 1810 compounds, this pilot screen did demonstrate that the FP assay is robust and suitable for HTS.
In summary, we optimized the fluorescent probe based on the DxETGE motif of Nrf2 and successfully developed a Keap1 binding FP assay. Our design of the fluorescently labeled probe is based on the 16mer Nrf2 peptide reported, and the probe for the assay was selected based on the binding affinity (K d) and dynamic range (ΔmA) of the assay. We sequentially shortened the Nrf2 peptide and found that the shortest FITC-labeled Nrf2 peptide that retains a strong binding affinity to the Keap1 Kelch domain was FITC-9mer Nrf2 peptide. The modification of FITC-9mer Nrf2 peptide by C-terminal amidation increased the binding affinity by twofold as compared with the FITC-9mer Nrf2 peptide with a free C-terminal carboxylic acid. Our data indicate that there is a general trend in the dynamic range as ΔmA decreases with increasing peptide length due to the “propeller effect.” Considering the binding affinity and dynamic range, we selected FITC-9mer Nrf2 peptide amide as the assay probe in developing the FP assay; FITC-9mer Nrf2 peptide amide has the largest assay window and a binding affinity that rivals the longer FITC-16mer Nrf2 peptide. In addition, we have modified the 9mer Nrf2 peptide amide with three additional fluorophores and found that the assay windows of cyanine-labeled 9mer Nrf2 peptide amides were greater than that of the FITC-9mer Nrf2 amide, suggesting that they could be used as probes in secondary confirmation FP assays to rule out the false-positives.
The competition binding assay using FITC-9mer Nrf2 amide as the probe was used to rank the binding affinities of 7mer to 16mer Nrf2 peptide inhibitors. The binding affinity of the 16mer Nrf2 peptide (H-AFFAQLQLDEETGEFL-OH, Ki = 37.4 nM) was consistent with the reported value and is the strongest in affinity to Keap1 in our FP-based competition assay. 14 The FP assay results show that the binding affinities of 7mer and 8mer Nrf2 peptides are significantly lower than the longer peptides, indicating an overall trend that the binding affinity increases with increasing peptide length. The FP assay of the N-acetylated 9mer Nrf2 peptides showed similar binding affinities to the longer peptides with Keap1. We have successfully used our FP assay developed here in the screening of the NCI Diversity Set II of 1364 compounds and the NCC of 446 compounds, and the FP assay has also been adapted to the 1534-well format and successfully used by the Broad Institute in the screening of the MLPCN library of 330 000 compounds for the discovery of small-molecule inhibitors of Keap1-Nrf2 interaction. Nrf2 is the principle mediator of ARE expression; thus, the disruption of the Keap1:Nrf2 complex is believed to be an effective strategy in inducing the expression of antioxidant and cytoprotective genes.
Footnotes
The authors declared no potential conflicts of interest with respect to the research, authorship, and/or publication of this article.
The authors disclose receipt of the following financial support for the research and/or authorship of this article: This work was supported by grants CA133791, CA125868, and MH093197 from the National Institutes of Health.
References
Supplementary Material
Please find the following supplemental material available below.
For Open Access articles published under a Creative Commons License, all supplemental material carries the same license as the article it is associated with.
For non-Open Access articles published, all supplemental material carries a non-exclusive license, and permission requests for re-use of supplemental material or any part of supplemental material shall be sent directly to the copyright owner as specified in the copyright notice associated with the article.