
Abstract
Coastal community water infrastructure is increasingly vulnerable to climate-sensitive coastal hazards. Tides, storm surges, rainfall, and salt intrusion affect infrastructure and human health. In case studies of Charleston, South Carolina, and Morehead City, North Carolina, USA, this project sought to advance risk assessment of urban water and wastewater infrastructure and identify linkages to human health impacts as risk evolves with sea level rise. The methodology integrates community infrastructure, health care, emergency resources, geospatial simulation, and a tabletop exercise with planners, emergency managers, public utilities, and health care providers. Resilience is assessed by community participants using interactive online maps, susceptibility indices, and a resilience matrix. Results highlight differential vulnerability, population susceptibility, and elevation uncertainty. We observe similar trends of increasing magnitude, frequency, and impact of flood events on water infrastructure and public health as sea level rises. Implications for tackling challenges across sectors are highlighted for improving coastal resilience.
Introduction
Urban coastal areas are adjacent to waters that sustain commerce, attract tourism and recreation, and provide vital estuarine and marine resources. These waters and adjoining low-lying coastal plains also constrain and present hazards of coastal flooding and rising sea level. Coastal water infrastructure provides essential water supply, wastewater treatment, and control of stormwater runoff. However, this infrastructure has also come to be recognized as vulnerable to sea level rise and potential amplification of existing recurrent flooding hazards. Storm surges, extreme rainfall, and tidal flooding may become chronic and severe with rising sea level. Hence, sea level rise presents a broad array of climate change–related impacts on human health, ranging from water quality and supply, changes in disease vector ecology, environmental and mental health, and direct physical impacts of flooding from hurricanes and coastal storms (Luber et al., 2014). The approach of mainstreaming climate adaptations and policies and measures provides a theoretical and integrative basis for long-term sustainability investments and imminent hazards alike. Mainstreaming also encourages holistic rather than individualized, sectoral engagement, which can impel more efficient and effective financial investments (Uittenbroek, Janssen-Janson, & Runhaar, 2013). In low-lying coastal locations, threats to water infrastructure such as loss of hydraulic head and pumping pressure, groundwater infiltration (and salinization), and reverse flows of “tailwater” from outlet water bodies with increasingly saline waters and corrosion not only require risk identification and investments for these infrastructure and services but also present linkages to human health and disaster resilience. Such connections can be direct and overwhelm stormwater and wastewater infrastructure, as with environmental exposure to untreated wastewater, or indirect, as when prolonged disruption of potable water supply leads to extended closure of hospital and other health facilities. Clearly, the public health of coastal communities is dependent on this infrastructure, and if services are reduced or fail, cascading health impacts may ensue. Most cities are ill-prepared to deal with changing weather patterns, salt intrusion, storm surges, and extreme rainfall (Susskind, 2010). This unpreparedness is reflected not only in infrastructure improvements lagging behind threats or performance criteria but also in the financial investment and social and health dimensions (National Academies, 2012).
Port cities present a prime area for research on sea level rise impacts on public health (U.S. Environmental Protection Agency [U.S. EPA], 2008). Risk assessments in urban coastal areas have highlighted the increasing vulnerability to street-level spring (perigean) tides or “sunny day” flooding with sea level rise (Sweet & Marra, 2016). Port cities have also seen greater attention to study of sea level change, including social and economic vulnerabilities (Akukwe & Ogbodo, 2015), storm surges and city-scale planning for sea level rise (Hallegatte et al., 2011), and variability and extremes in weather and climate (Hanson et al., 2011). Infrastructure risk assessments in port cities pointed out an increased need for numerical modeling of flooding and wave action (Rajabalinejad & Demibilek, 2013) and the potential of lower probability or extreme scenario events (Hinkel et al., 2015). Overtopping of flood walls, caissons, and other large structures, for instance, underscores increasing vulnerabilities when changing sea level and wave climate are added to simulations of existing risks (Sierra, Casanovas, Mosso, Mestres, & Sanchez-Arcilla, 2016). Hazardous material releases are also a connection between port infrastructure and coastal flood disasters, such as Santella, Steinberg, and Sengul (2010) finding that significant oil and hazardous material spills following Hurricane Katrina in 2005 reduced recovery time.
The nexus of water infrastructure, public health, and climate change effects on increasing sea levels has received less attention in the literature. While it is difficult to understate the historic impact of improved sanitation and water supply on human health, systems that were constructed many decades ago may not adequately handle the increased variability and extremes of rainfall, tidal flooding, and storm surges anticipated to affect coastal cities. Outbreaks of communicable disease could be mitigated if water supplies and proper wastewater treatment systems are adapted for improved resilience, financial gaps in capital improvement are addressed, and the treatment of sewage is elevated among competing municipal priorities (De Anda & Shear, 2008). Morris (2017) points out that neglect and lack of investment in municipal water infrastructure can be evidenced by disasters ranging from Katrina’s flooding of New Orleans to the fateful cost-saving attempts contributing to the water contamination crisis of Flint, Michigan.
Focusing on coastal wastewater treatment systems, Hummel, Berry, and Stacey (2018) uncover significant underestimation of population vulnerability to direct flooding as well as loss of wastewater services in the San Francisco Bay as sea level rise exacerbates coastal flooding. Their study highlights the potential far-reaching impacts of wastewater infrastructure disruption to services far beyond actual floods. Water utility and wastewater treatment systems may have storage systems, pipes, and pump stations that flood or fail owing to increased salinity of marine flooding and groundwater salinization (Flood & Cahoon, 2011). Although studies at a regional and national scale are informative to the scope of the problem (Heberger, Cooley, Herrera, Gleick, & Moore, 2011; Karamouz, Rasoulnia, Zahmatkesh, Olyaei, & Baghvand, 2016), the nexus of the threats to water supply and wastewater infrastructure and public health susceptibility in coastal cities invites the study and synthesis of a comparative, integrated assessment. In addition, cities that are prone to sea level rise owing to low-lying elevation and/or subsidence should also be investigated for interacting and cumulative risks arising from future conditions of tidal flooding, storm surges, extreme rainfall, and groundwater elevation. In addition, a case study presented by Uittenbroek et al. (2013) noted that divergent institutional responsibilities can arise with organizations, such as a municipality having unclear responsibility for water storage versus maintenance (leading to adoption of short-term, cheaper solutions).
This article describes a project using geospatial analysis to examine key stakeholders’ views of vulnerability of community water infrastructure and public health susceptibility to impacts across a range of coastal flood hazards, including tidal flooding, storm surges, extreme rainfall, and future sea level rise. Secondarily, the study sought to advance integrative methods and derive comparative insights by focusing on two coastal cities, Charleston, South Carolina, and Morehead City, North Carolina. Parallel case studies were chosen to gauge differential susceptibility by hazard, infrastructure type, geographical setting, and local community capacity for resilience. The use of comparative case studies has been encouraged by other researchers (cf. Uittenbroek et al., 2013) who recommend it for expanding knowledge of barriers as well as opportunities to integrate planning and problem-solving across sectors. Collaborative research was also a goal, to make meaningful strides in raising awareness and enhancing cross-sector dialogue and capacity of decision-making agencies charged with managing infrastructure, emergencies, and planning for coastal development. Toward this goal, we used multiple methods of engagement to collect data, document practices, and promote exchange of multiple perspectives among participants from public works and water utilities, hospitals and public health agencies, emergency managers and public safety, and urban and regional planning. Key foundations of our approach include (a) use of collaborative geographic information systems (GIS) for risk mapping, (b) spatial analysis of the exposure of community water infrastructure to flooding hazards, and (c) development of a public health susceptibility index and application of a resilience matrix framework through a participatory tabletop exercise. Tabletop exercises are a tool for emergency preparedness that are adaptable to climate-sensitive hazards planning and disaster resilience (Chandra et al., 2015; U.S. EPA, 2010). Results demonstrate and emphasize the value of cross-sector and integrated vulnerability and susceptibility assessment, the role of GIS in vulnerability and resilience assessment, and the increasing exposure of water infrastructure and dependent coastal populations with rising sea level. We conclude with comparison of insights between case studies and lessons learned from the exercise simulating a major future flood event.
Conceptualizing Susceptibility, Vulnerability, and Resiliency
To apply an integrative perspective, we operationalized key concepts to enable participating communities to assess hazard exposure and identify risks. “Exposure” to a given coastal threat is operationalized as a quantitative measure of assets, infrastructure, or population where a coastal flood may occur, a necessary first step to quantifying resilience (Karamouz et al., 2016). We defined “Susceptibility” as the degree to which a system is open, liable, or sensitive to climate stimuli, like sensitivity, with connotations toward damage and/or disruption or reduced level of service or function (cf. Cardona et al., 2012). This term augments our operational concept of “Vulnerability” or the degree to which a system is susceptible to, or unable to cope with, adverse effects of climate change, including climate variability and extremes—a function of the character, magnitude, and rate of climate variation to which a system is exposed, its sensitivity, and its adaptive capacity (Melillo, Richmond, & Yohe, 2014, p. 672). In the process of our risk mapping and application to a tabletop exercise, we also applied the concept of “Resiliency,” as a capability to anticipate, prepare for, respond to, and recover from significant multihazard threats with minimum damage to social well-being, the economy, and the environment (Melillo et al., 2014, p. 672).
Integration of public health risk management requires bringing together stakeholders and synthesizing multiple perspectives and information and operational processes across many sectors (Briggs, 2008). Our focus on storm surge flooding, tidal flooding, and their mutual interacting effects with future sea level rise meant we needed to bring together several sectors of coastal government and public and private services. The municipal sector comprises the government buildings, staff, and services that include police and fire, emergency management, and general public works and transportation infrastructure. Water infrastructure sector included the agencies responsible and infrastructure such as potable water supply, pumps and lift stations, water and wastewater treatment plants, wells and storage tanks, and critical facilities supporting these. The health sector includes the hospital facilities (urgent care centers, pharmacies, renal or indigent care) and tertiary treatment centers (outpatient and therapeutic care), many public agencies and private treatment centers (e.g., rehabilitative and mental health counseling), and, most certainly, the regional hospitals, primary trauma centers, and their secondary treatment support.
Integrated Water and Health Risk Assessment
To emphasize integrated assessment, community water infrastructure vulnerabilities were linked with population-level susceptibilities in a logic model (Figure 1). This figure was used to broadly conceptualize potential risks and pathways for exposure that might affect public health. Boxes reflect the nominal threat or receptor systems, with arrows denoting interactions or feedbacks that allow for cascading or cumulating risks, exposure, and impacts. In the community vulnerability submodel, we characterize hurricanes and coastal storms effecting flooding and the potential for future increasing magnitude, frequency, and impacts owing to sea level rise. First, the threat of extreme rainfall is recognized increasingly as its own hazard, and recent flooding in the Southeastern United States demonstrates that non-archetype tropical precipitation events must be considered. For instance, 2015 Hurricane Joaquin was well offshore the coast, yet troughing and tropical moisture combined to produce extremely high rainfall along the Piedmont and coast of South and North Carolina. This event was magnified by the onshore winds and tidal flooding. Similar flooding also occurred in September 2016 as Hurricane Matthew, despite tracking well offshore Cape Lookout, North Carolina, contributed to an extensive plume of tropical rainfall that produced extensive flooding. Furthermore, storm surges may be amplified by the shifted, higher tidal range in the future, increased tidal amplitude, or interaction with increased extreme rainfall (e.g., warm rainfall processes, back-to-back storms or antecedent rain, and soil moisture saturation). These multihazard processes are represented in the conceptual model to produce variable flooding, the timing, spatial extent, and duration of which can yield myriad impacts on coastal communities. Hence, these impacts are represented in a separate submodel, allowing the damage (direct or indirect) to be assessed from the subsector domains of water utility providers, health care, sanitation, or integrated effects. In the population susceptibility submodel, our logic focuses on the interruption or loss of critical public health functions that have historically led to increased morbidity and mortality. Further in the project, we describe a series of scenarios and tabletop exercises that produce modeled impacts that would be experienced in current or future conditions across each of these systems. As with other disasters, coastal flooding impact factors are organized by time-delimited exposure and impacts, which can greatly assist during the mitigation, preparedness, response, and recovery phases. Applying our logic model, we further developed a conceptualization of the temporal linkages of community vulnerabilities and susceptibilities as they affect public health (Figure 2). This perspective recognizes a role for antecedent conditions to affect health, particularly the loss of potable water, wastewater and sewage overflows, and later stage vector-borne diseases and mental health. This temporal dynamic is oftentimes the focus of emergency management and syncs with both the emergency operations plans (EOPs) of emergency management, hospitals, and other agencies. Moreover, the scope of time mimics the duration of a disaster event, extending the onset to antecedent conditions that may prime the region for excess flooding (e.g., high soil moisture and/or elevated shallow water tables) through the prolonged recovery phase of a disaster (e.g., lagged effects such as surface water contamination, mold, or the 10+ day effects of a mosquito population bloom). This temporal characterization of impacts can also be represented spatially in maps during tabletop exercises.
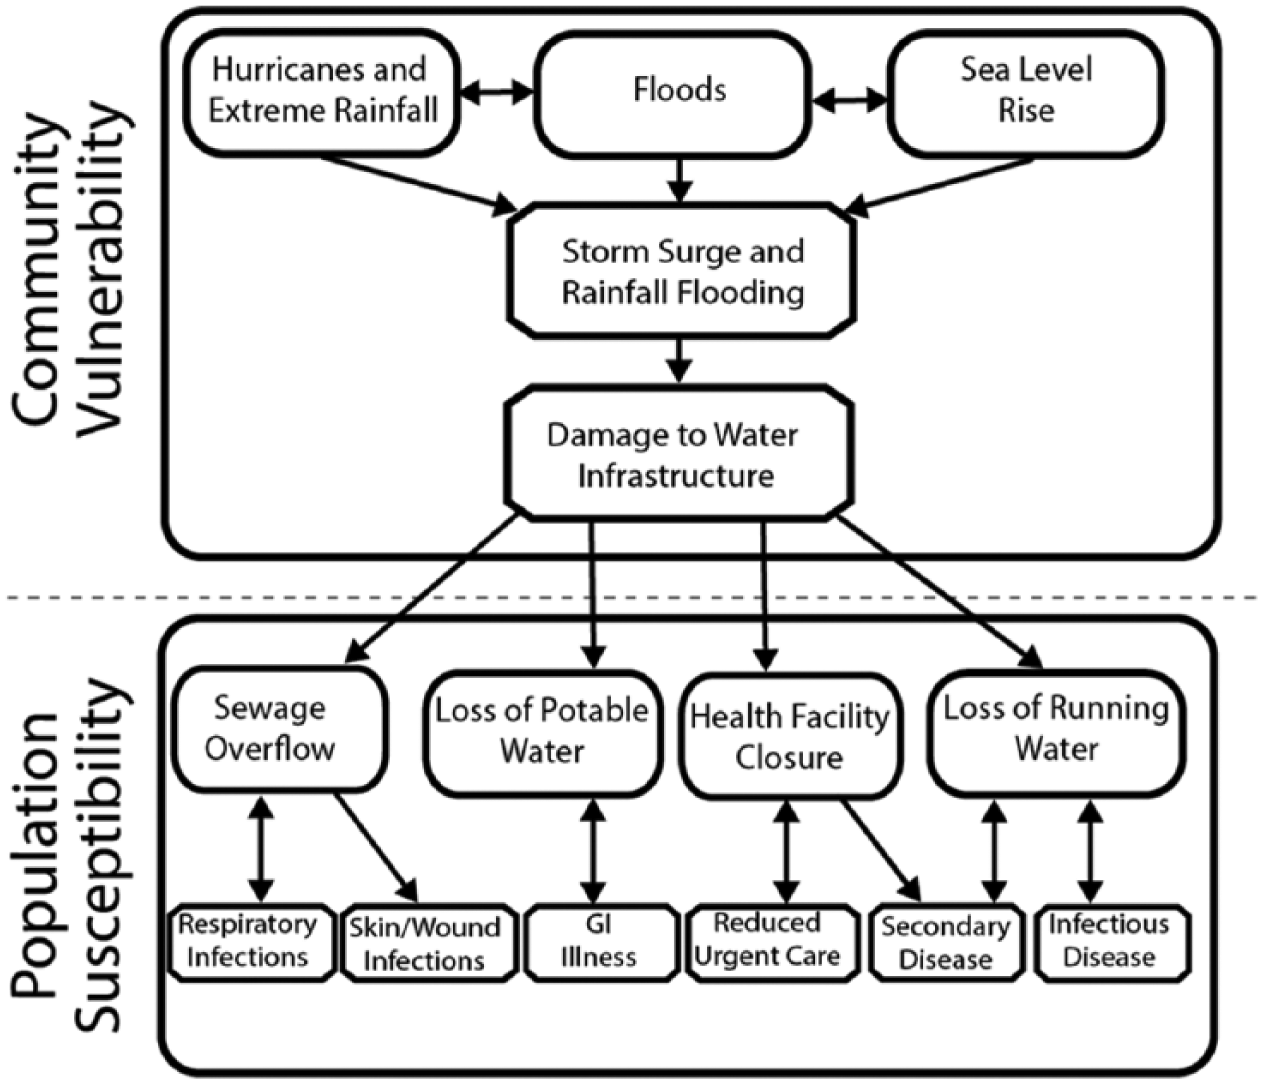
Logic model of conceptual community vulnerability and population public health susceptibility. This model links water infrastructure assets and supporting services exposed to flood threats and other storm damage to pathways of disease morbidity or mortality.
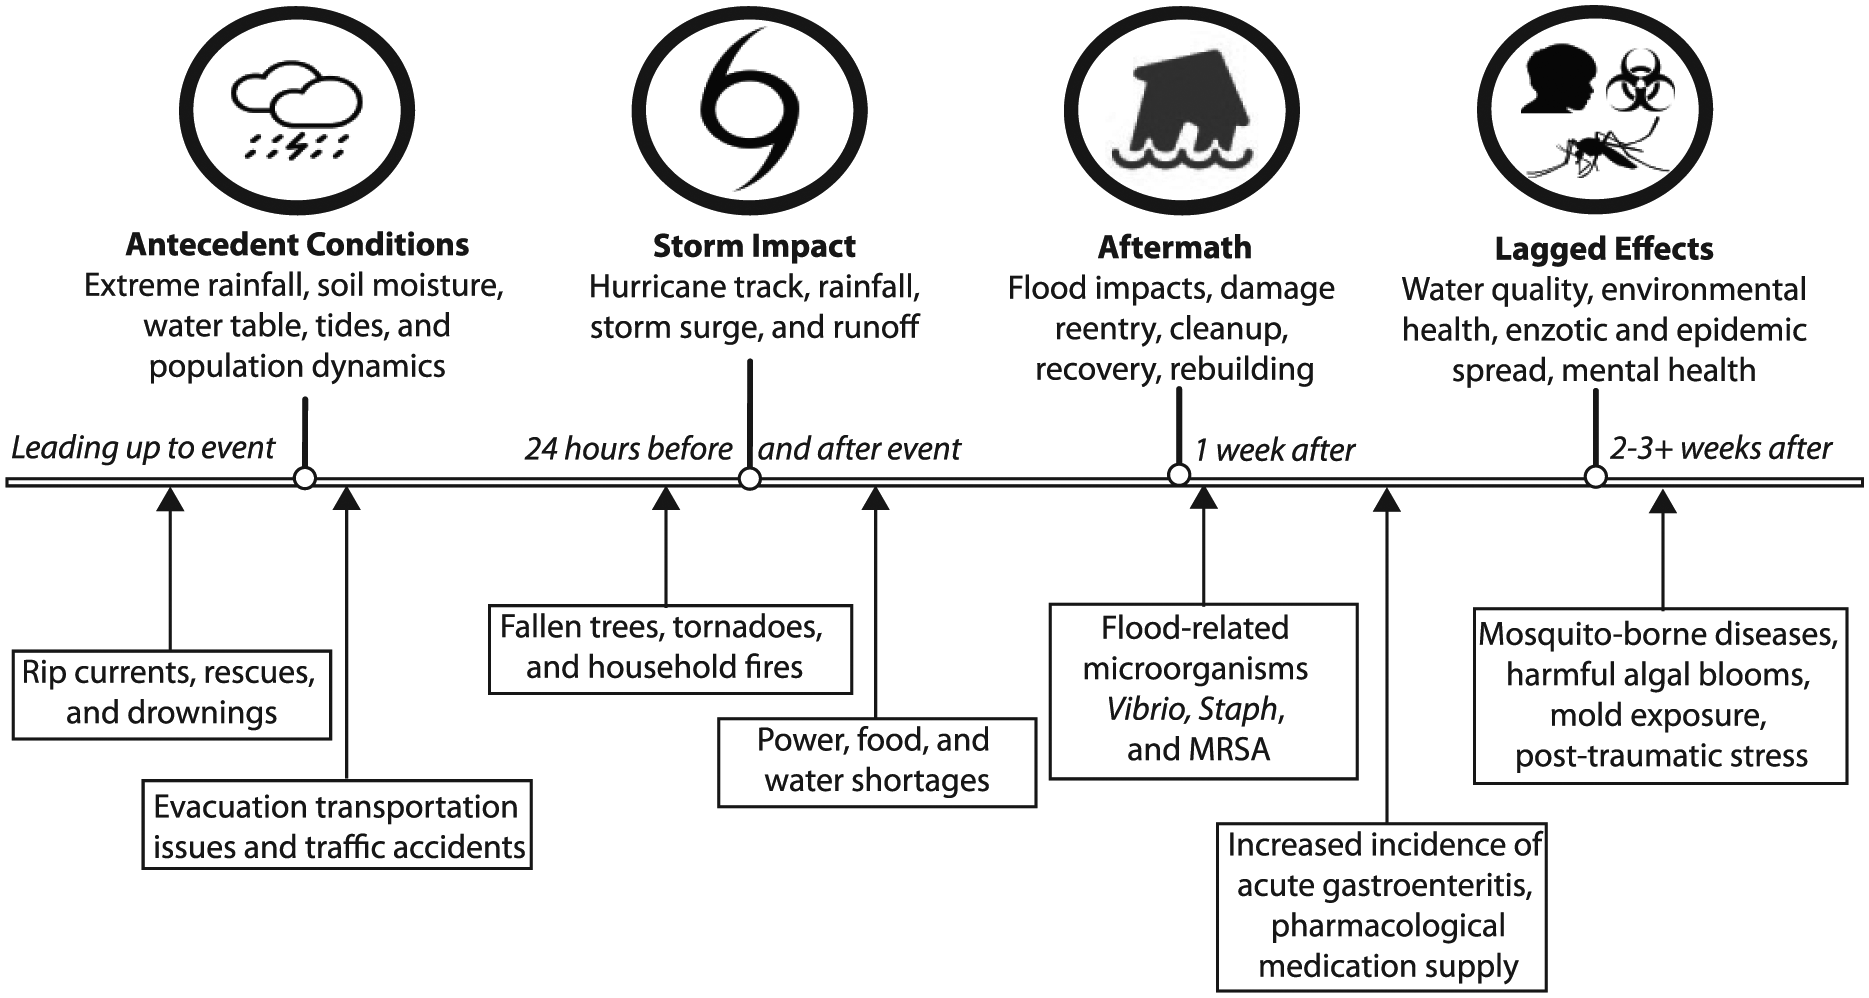
Temporal and spatial dimensions of flood impacts reflect antecedent conditions through disaster impact and aftermath recovery, including significant lagged effects that can propagate well after flooding to effect public health outcomes.
Such receptor systems play a large role in the impacts on infrastructure and realization of downstream public health outcomes. Given the plausibility of successive inland rainfall and coastal storms in a single season, precursor rainfall events (PREs) can exacerbate many aspects of community resilience. Extreme rainfall can affect evacuation clearance times, as well as windthrow and vehicular passability of evacuation routes, and furthermore can impede arrival of first responders and emergency management professionals. Recent coastal floods have also been associated with antecedent rainfall, such as Hurricanes Floyd (1999), Isabel (2003), Irene (2011), and Matthew (2016). Seasonal and antecedent rainfall can condition watersheds in the Southeastern United States to behave differently in hurricane flooding (Chen, Kumar, & McGlynn, 2015) For instance, all these storms followed antecedent high rainfall storms and elevated soil moisture. Hurricane Floyd (which followed Dennis just weeks earlier), despite making landfall as a downgraded Category 1 storm, had extreme rainfall and extensive riverine floods (500-year flood levels), as well as the fourth largest mass evacuation in U.S. history (National Weather Service [NWS], 2000). Hurricane Isabel struck the North Carolina and Virginia coasts as a weak Category 1 storm, but excessive summer rainfall and elevated water tables caused enormous windthrow and debris throughout eastern North Carolina, and Hampton Roads, Virginia. Hurricane Irene was accompanied by high prior rainfall and tides, particularly in the confined, funnel-shaped shallow estuary of the Pamlico Sound, North Carolina. Prior to Hurricane Matthew’s heavy rainfall flooding of the lower coastal plain in 2016, the Carolinas were affected by four prior tropical storms (Bonnie, Colin, Hermione, and Julia; Armstrong, 2017) Furthermore, hazards ahead of coastal storms may disrupt incident preparedness activities, but could serve to heighten awareness and vigilance among the population (e.g., rip currents, arrival of long period swells, and steadily elevating water levels from wave setup and onshore winds). Storm impacts are commonly understood to include storm surge as a primary threat by drowning and physical damage, yet flash flooding, downed trees, vehicle accidents, fires, and tornadoes are also considerable.
The recovery following a coastal disaster can range from several days, months, or even years after the incident. Effects during the aftermath might include, but are not limited to, prolonged or delayed flooding (in the case of a riverine watershed with an approaching crest temporally lagging the passage of a storm), accidents during clean-up, disruption of drinking water supply, and exposure to pathogens and toxins in flood waters (e.g., Vibrio, Staph, Methicillin-resistant Staphylococcus aureus [MRSA], and gastrointestinal illness; McMichael, 2015; Yee et al., 2007). The timeline in Figure 2 also emphasizes delayed or lagged effects on human health, including population life cycle of arbovirus vectors such as mosquitoes, enzootic diseases affecting pets and livestock near human settlements, exposure to toxic mold, exposure to harmful algal blooms (Lewitus & Holland, 2003), and mental health and psychological effects. Nearly half of low-income victims of Hurricane Katrina (2005) reported symptoms consistent with post-traumatic stress disorder (PTSD) 1 year after the storm (Fussell & Lowe, 2014; Harville, Giarratano, Savage, de Mendoza, & Zotkiewicz, 2015; Jonkman, Maaskant, Boyd, & Levitan, 2009; Waters, 2016; https://www.riskproject.org/).
Case Study Areas
Two coastal communities, Morehead City, North Carolina, and Charleston, South Carolina, (Figure 3), were selected for the purpose of comparison of differential flood threats, vulnerability, and susceptibility, as well as to inform the study methods and guidance products for potential transferability to other coastal communities. The Town of Morehead City, North Carolina (2010 population 9,400), exhibits moderate relative sea level rise with a range of micro-tidal estuaries and the deep water port of Morehead City. Numerous coastal lagoons, inlets, and low-lying coastal plains surround the area with a traditional economy of shipping, commercial and recreational, and fishing and tourism. Morehead City operates a centralized wastewater treatment system, with outlying areas of the city’s “extraterritorial jurisdiction” (ETJ) largely served by onsite wastewater systems or small package plants. Recent hurricane landfalls (e.g., Irene in 2011) and extreme rainfall events (e.g., Joaquin/Nor’easter event in 2015 and Hurricane Matthew in 2016) provide benchmarks that guided vulnerability assessment under the current sea level state. Morehead City hospital service is centralized in the community and provided by Carteret Health Care Medical Center. Water and sewer utility services are provided by the Morehead City Public Utilities Department. Much of Morehead City’s commercial, transportation, and government buildings are sited astride a moderate topographic high, with the surrounding low-lying areas primarily occupied by residential neighborhoods, marinas, and the Port of Morehead City.
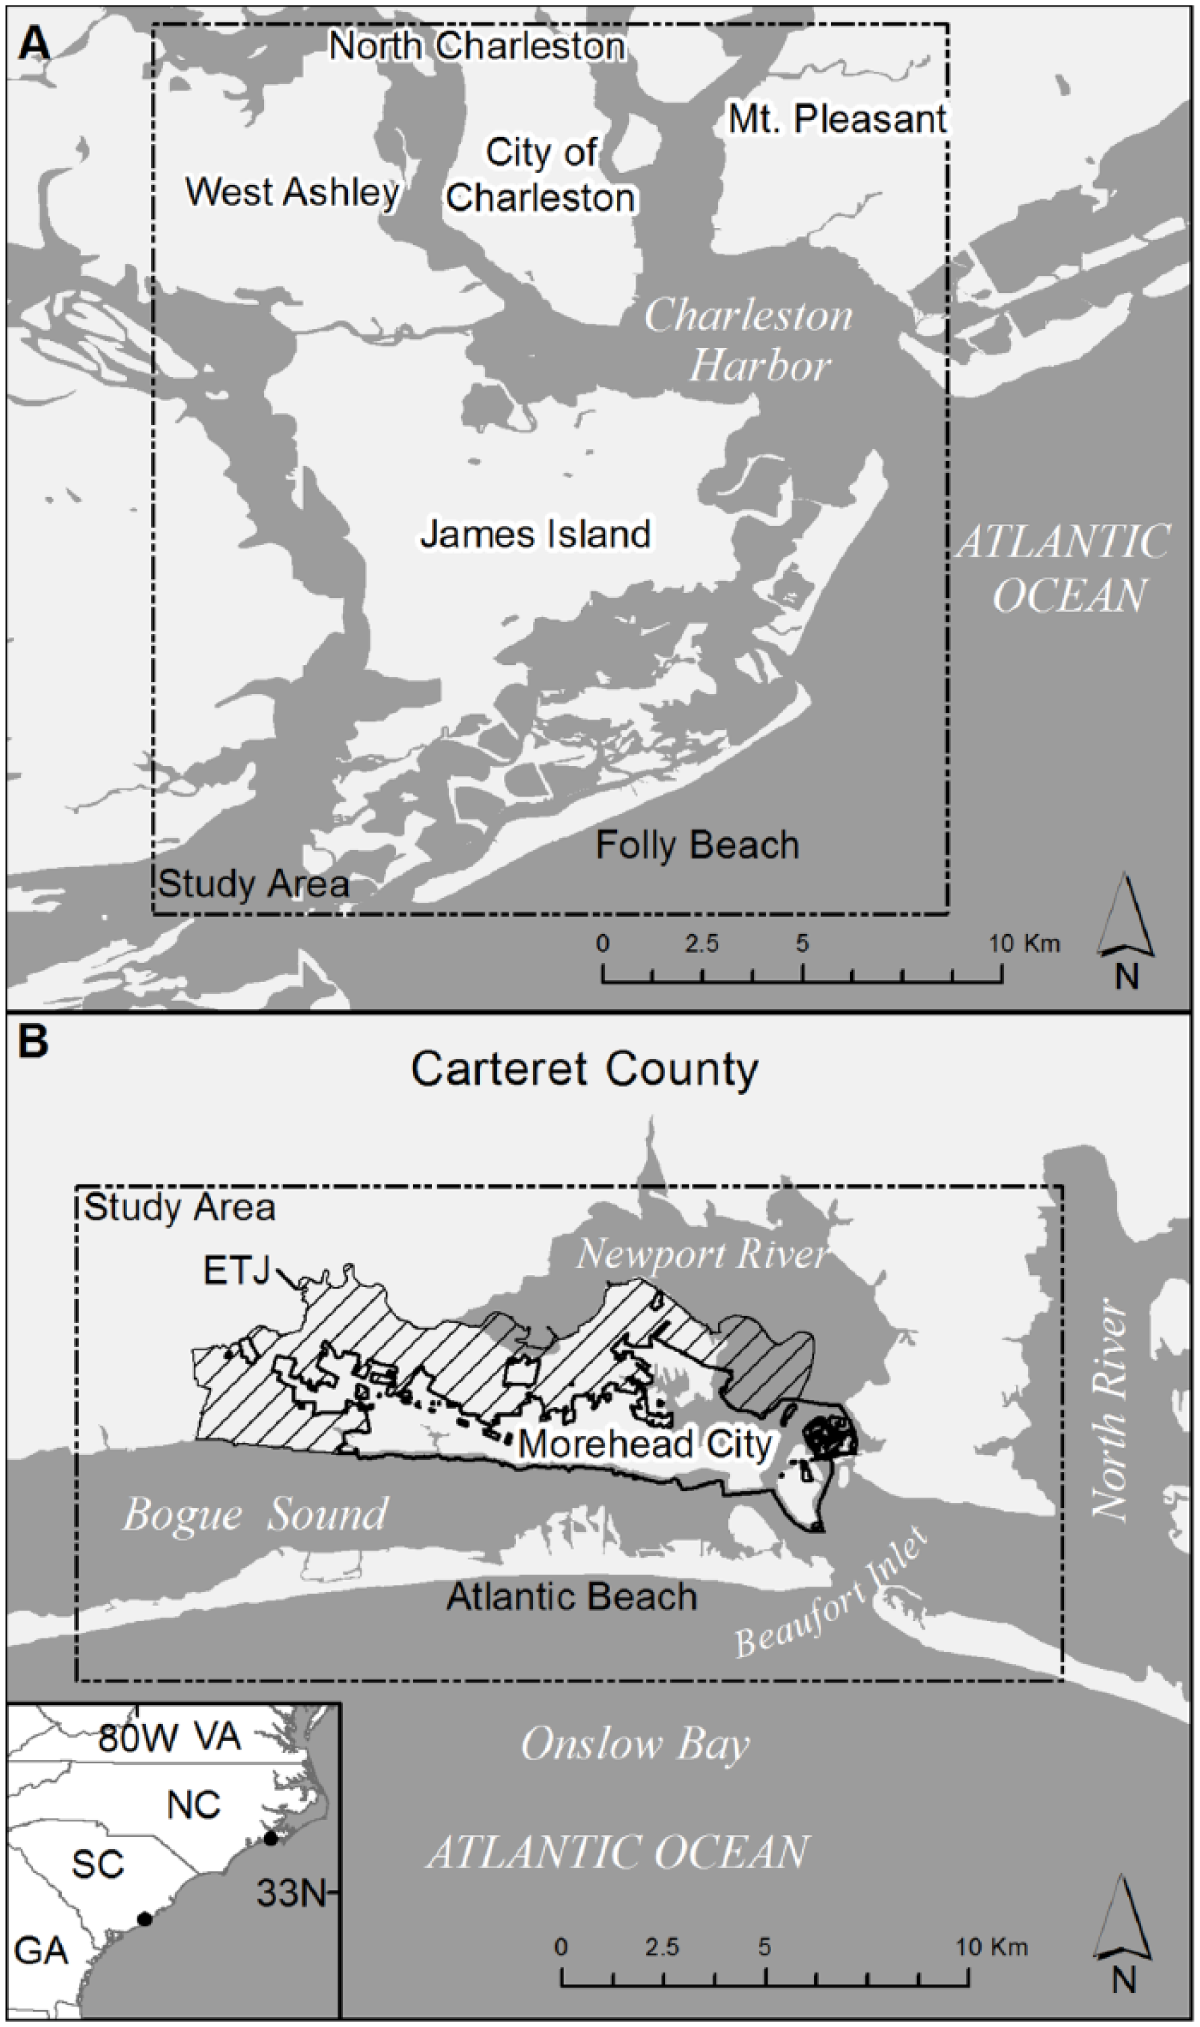
Study area locations in Morehead City, North Carolina, and Charleston, South Carolina. The Morehead City area includes a surrounding unincorporated Extraterritorial Jurisdiction (ETJ) portion of Carteret County.
Charleston, South Carolina (2016 population approximately 134,000), is a much larger city on a low-lying peninsula of the central South Carolina coast. The high density developed downtown and surrounding neighborhoods were constructed largely on filled-in marshland. Charleston’s low-lying topography induces significant flooding during heavy rain events, which interact with “King tides” several times per year. Since the last major direct landfalling hurricane (Hugo, 1989), Charleston has nonetheless experienced numerous coastal storms and extreme rainfall events and increased tidal flooding. The city’s main Plum Island wastewater treatment plant serves the densely populated downtown and the areas of West Ashley and James Island, thereby expanding the population served well beyond that of downtown Charleston. Charleston’s potable water supply is provided by the Charleston Water Authority. The city is served by several hospitals in a large medical district, including Roper Hospital and the Medical University of South Carolina Hospital, near downtown and Bon Secours St. Francis in West Ashley.
Morehead City and Charleston are both exposed to tidal flooding, with Charleston having a higher tidal amplitude and more routine tidal flooding events. The NWS operates Weather Forecast Offices (WFOs) in close proximity to each area, and the National Oceanographic and Atmospheric Administration (NOAA) National Hurricane Center (NHC) conducts operational modeling for tropical cyclone storm surges using numerical grid coverage for both areas with focus on Charleston Harbor and Wilmington and Pamlico Sound, North Carolina. Tide gauges are operated by NOAA for both areas including long-term water level observations for relative sea level rise and forecast tidal conditions at Duke Marine Lab, at Beaufort Inlet, North Carolina (station 8656483), and Charleston Harbor at the Cooper River entrance, South Carolina (station 8665530).
Risk Mapping
Our risk mapping approach applied geospatial analysis and models of coastal flood hazards, acquired digital geospatial data representing water infrastructure assets for community vulnerability assessment, and assimilated population and health care service providers for analysis of population susceptibility. Table 1 details the categories, data layers, and sources that were developed for both Morehead City and Charleston. A geodatabase was created for each city, combining the various sources into a standardized data structure and common earth coordinate system and vertical datum in the case of elevation, storm surge, and tidal flooding sources. To characterize current and future flooding exposure, the analysis focused on GIS data sets to capture potential flooding, including first-order estimates of the future flood extents with relative sea level rise. For hurricane and tropical storm surges, we obtained storm surge model output from the NOAA NHC’s Sea, Lake and Overland Surges from Hurricanes (SLOSH) (Jelesnianski, Chen, & Shaffer, 1992) operational model for both cities, selecting a suite of the SLOSH Maximum of Maximums (MOMs) for each Saffir-Simpson category level of storm at high tide time of landfall. MOM grids depict the worst-case scenario of a particular strength category hurricane based on wind field and angle of strike along a coast, derived from thousands of simulations (Glahn, Taylor, Kurkowski, & Shaffer, 2009). MOM flood simulations included maps of flood depth and extent of storm surge as would be available a few days ahead of potential landfall. In response to stakeholder feedback at two initial test workshops, we additionally derived a closer approximation of an actual hurricane strike using the deterministic storm surge layers from SLOSH Maximum Envelopes of Water (MEOWs). MEOW grid output maps the potential surge depth and extent from a particular scenario of hurricane intensity and track and can more closely approximate the impacts nearer to the time of landfall while also accounting for potential track error in the NHC forecast. Although requiring prudence and confidence on the storm track, MEOW surge predictions can reduce the overestimation of storm surge extent compared with MOMs. MEOW depth grids for a simulated year 2035 Hurricane Liz were used later in our tabletop exercise.
Categorical Geospatial Themes, Map Layers, and Sources of Spatial Data Used in Risk Mapping.
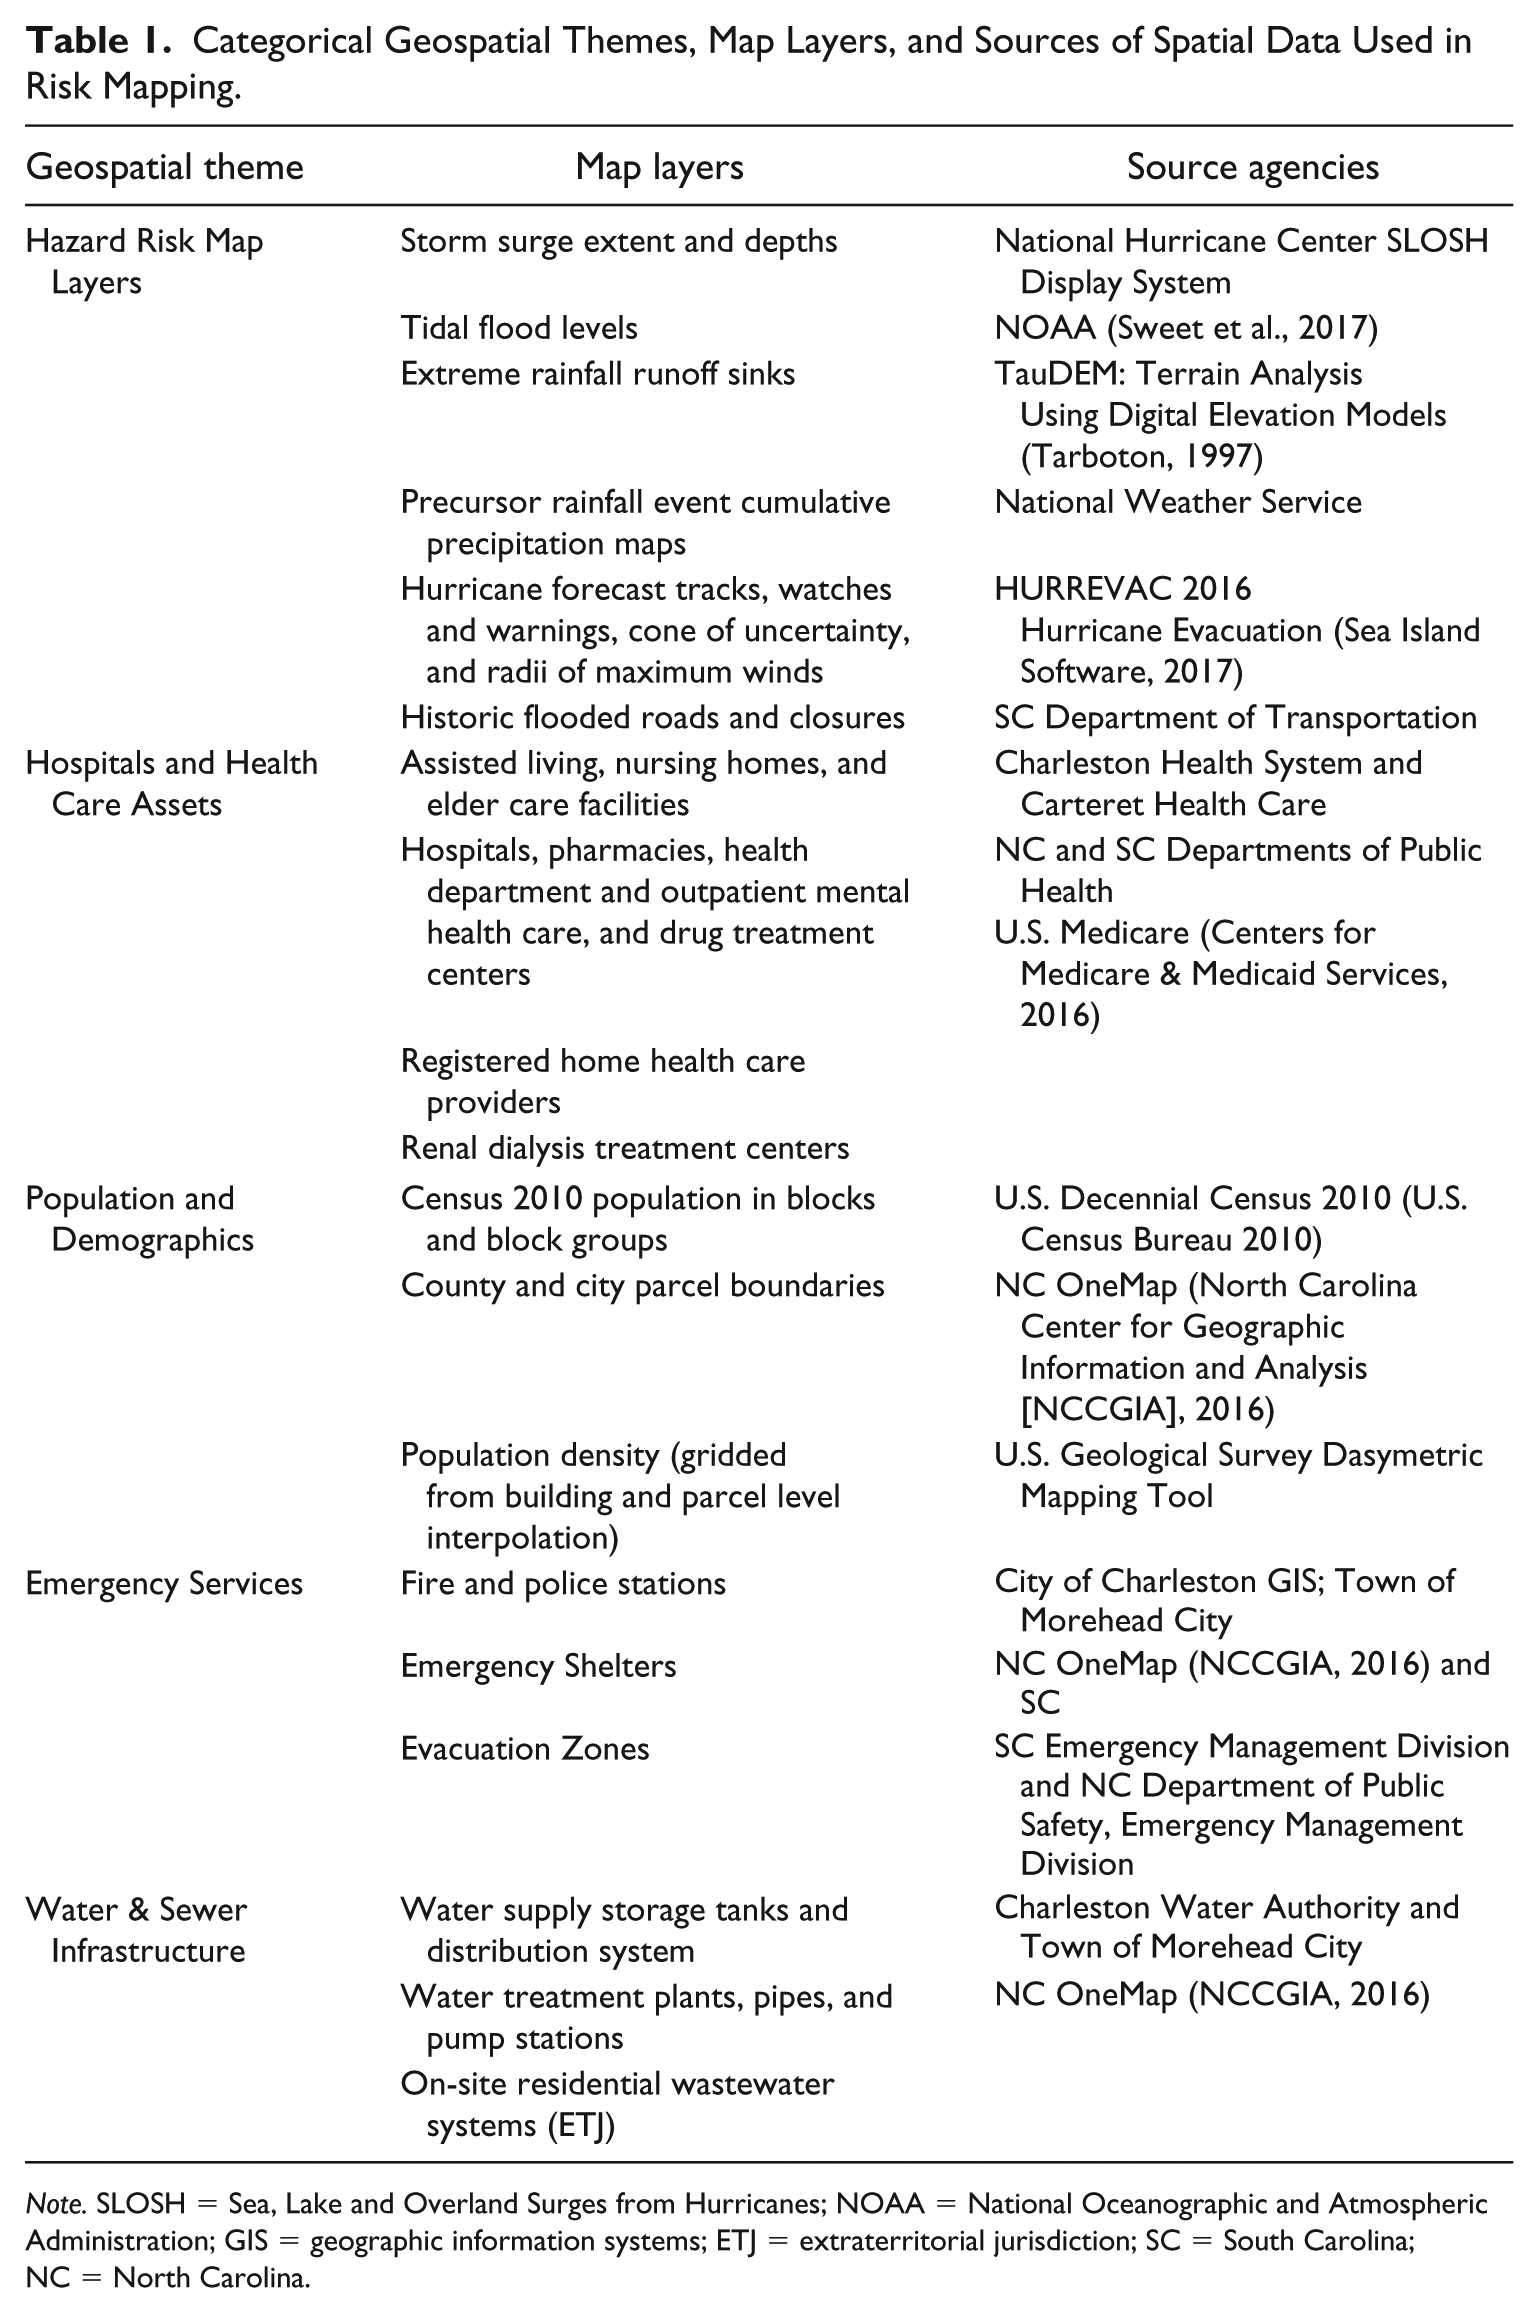
Note. SLOSH = Sea, Lake and Overland Surges from Hurricanes; NOAA = National Oceanographic and Atmospheric Administration; GIS = geographic information systems; ETJ = extraterritorial jurisdiction; SC = South Carolina; NC = North Carolina.
To assess potential surge, tidal, and rainfall runoff, flooding impacts required high-accuracy coastal elevation data. We acquired Light Detection and Ranging (LiDAR) digital elevation models (DEMs) from the NOAA Digital Coast (NOAA, 2015) for Charleston and from the NC Floodplain Mapping Program for Morehead City (North Carolina Floodplain Mapping Program, 2017). The Charleston DEM was additionally processed to improve hydrologic modeling by accounting for additional “hydro-correction” factors such as bridges, culverts, and ditches that were not represented in the DEMs. DEMs were processed to a 5-m resolution grid. DEM data quality, it was presumed, could play a significant role in the vulnerability assessment and adaptation guidance (Cooper, Fletcher, Chen, & Barbee, 2013). Storm surge simulations were imported from the SLOSH Display System to Esri ArcGIS (NOAA, NHC, 2015), where the raster grids were downscaled and co-registered to DEMs and converted to compatible earth coordinate system and local tidal vertical datum using tide gauge corrections and VDatum software (NOAA, 2013). Each category level of surge was converted to a raster grid to map the inundation and potential flood depth. Given SLOSH model limitations, additional wave action, runup, setup, and damage were not included. In addition, we did not alter the DEMs to reflect future geomorphic changes such as inlet opening or closing, channel dredging or shoreline alteration, or potential flood protection measures such as sea walls, tide gates, or similar engineering structures.
Future relative sea level rise combining eustatic regional rise and local subsidence was estimated using the U.S. Army Corps of Engineers’ Sea Level Rise Calculator (Huber & White, 2015; http://www.corpsclimate.us/ccaceslcurves.cfm) and adopting an NOAA intermediate-high scenario of eustatic rise (Sweet et al., 2017). To characterize future tidal flooding, we applied tidal amplitude changes using static landforms and development as proxy of future hydrodynamics, without altering landforms or future engineering structures, in a method following Sweet et al. (2018). This method yielded future tidal flooding map extents with incremental relative sea level rise. To represent potential stormwater runoff from extreme rainfall, we applied the TauDEM model and D-infinity method (Tarboton, 1997) and a method similar to “blue spot” mapping to identify low areas of topographic flow accumulation for each city (Balstrøm, 2015). These areas were validated by comparison to reported street flooding in prior events from the SC DOT and City of Charleston and a field campaign and crowdsourcing of street-level flooding within Morehead City following Tropical Storm Arthur of 2014.
For tidal flooding, we utilized an NOAA threshold value local to each area based upon the local elevation of moderate tidal flooding (Sweet et al., 2017), 0.62 m and 0.53 m above Mean Higher High Water for Morehead City and Charleston, respectively. Because the frequency of tidal flooding increases nonlinearly with sea level, today’s nuisance or “extreme” becomes tomorrow’s “mean” (Sweet & Park, 2014). The rate of occurrence of nuisance events is increasing along the East Coast, such that nuisance events are becoming chronic, and tipping points for impacts in areas such as Norfolk, where relative sea level rise rates (SLR) are themselves faster than other areas. The geospatial risk maps provided critical overlay flood and depth grids that could be used to spatially analyze, intersect, and evaluate vulnerability of water infrastructure and human health susceptibility in the event of multiple flood hazard events or permutations. Given the numerous possible interactions among storm surges, antecedent extreme rainfall, and tidal flooding, the project focused the integration of risk maps into a tabletop exercise event premised on a plausible future flood scenario.
Tabletop Exercise on Future Coastal Flooding
Aiming to assist stakeholders’ identification of gaps and potential disconnects between public health, water utility service and infrastructure managers, and emergency management, the project designed a tabletop exercise adapted from emergency management training methods (U.S. EPA, 2010; Williams, Nocera, & Casteel, 2008). The initial exercise was designed based on participant input and subject matter expertise on perceived susceptibilities in their jurisdiction. Thirteen interviews were conducted in Charleston and eight in Morehead City. Emergency management professionals frequently use synthetic exercises as a training program, oftentimes combining national, state, and local governmental practitioners. Scenarios may be selected for an exercise to practice, refine, or test weaknesses and challenge to the locality (e.g., stress-test communications plans). Communities must employ a mixed strategy of risk reduction and risk management that can be explored through scenario-based exercises (Susskind, 2010). One value of tabletop exercises is simply bringing individuals together from different levels of government and different departments to talk about flow of information and response across these divides, an idea critical to building capacity to cope with climate change impacts such as flooding and disease (Adger, Hughes, Folke, Carpenter, & Rockström, 2005). The initial tabletop exercise was tested during a 1-day workshop in each study area, during which participants learned about current and future sea level and coastal flooding and resilience practices and tested the initial tabletop exercise design. Participants represented local hospitals and health care providers, city and county planning and emergency management offices, local health departments, and local water authority and public works departments. In Morehead City, the local NWS forecast office reviewed the scenario and briefing content provided in the exercise. The tabletop exercise received significant revision based upon participant input, including the addition of the synthetic hurricane scenario, the simulated Hurricane Liz 2035, to improve the focus of group work during the exercise. The revised tabletop exercise was delivered again 9 to 10 months later, and this final format was broken into three phases: (a) educational briefing, scenario introduction, and instruction on the exercise webmap functionality; (b) resilience matrix assessment and synthesis; and (c) hands-on interactive GIS mapping of risks and susceptibility index to evaluate vulnerabilities by sector. The introductory briefing reviewed current knowledge of operational flood forecast threat products for the area, demonstrated how to use the webmap data and tools, and laid out details of the scenario to be analyzed by participants. We sought to visualize the potential flooding and impacts on human health by developing online web maps to enhance exposure and inferences for vulnerable infrastructure and susceptible population (Allen, Sanchagrin, & McLeod, 2013). Prior to the webmap analysis, participants gave general evaluations across four dimensions through an online susceptibility index spreadsheet which tabulated scores of group-assessed susceptibility based upon U.S. Army Corps of Engineers’ Resilience Matrix Framework (Linkov, Fox-Lent, & Bates, 2015). Following this general assessment, participants worked in groups with the customized participatory GIS web application to assess potential flood impacts on the various sectors (health, water infrastructure, and emergency services; Allen, 2018). Subsequent to each exercise phase, project team members facilitated summary discussions. A final wrap-up discussion moderated by our team synthesized results and documented insights for a guidebook for the participants and other communities.
Tabletop Scenario: A Precursor Rainfall Event and Hurricane in 2035
The exercise design for both cities included a scenario of a PRE followed by a landfalling hurricane, superimposed on future relative sea level rise and tidal amplitudes in the year 2035. The PRE mimicked recent coastal troughing and tropical precipitation plume rainfall similar to levels of the historic Fall 2015 South Carolina flood event (NWS, 2015). A simulated meteorological forecast briefing was constructed to explain this rainfall and attendant impacts as well as the oncoming potential hurricane. Hurricane “Liz” was designed along the track of actual Hurricane Kyle (2002) (Stewart, 2002) but with stronger intensity (Saffir-Simpson scale Category 3 and a storm tide including a slow-moving, near landfall swipe at high tide for Charleston and a direct hit landfall at Morehead City). In addition, future subsidence and sea level rise were incorporated by simple vertical elevation of the DEM as a proxy for increased flood extent. Furthermore, the timing of the storm in early October was chosen near perigean spring tides of 2030 to also underscore the salience of tidal flooding and sea level rise, such as was significant to Southeast flooding from Joaquin and tropical rainfall in 2015. The extreme PRE rainfall additionally stressed preparedness actions by external emergency responders prepositioning resources as well as affecting water infrastructure and evacuation. All scenario background, mock briefing materials, and risk map data and selected GIS layers were compiled and presented to participants prior to the event via online interactive web maps.
Resilience Matrix and Susceptibility Assessment
Complementing the online webmap application for spatial exposure and vulnerability, an online resilience matrix was created using a Google Docs spreadsheet. The U.S. Army Corps of Engineers’ Resilience Matrix Framework (Linkov et al., 2015) provided the basis for community resilience assessment and susceptibility of components within each sector. Participants completed this task by scoring sectoral susceptibility among four domains of impact (physical, information, cognitive, and social) and four factors of resilience (preparedness, absorb, recover, and adapt). Structured as a 4 × 4 column and row matrix (Figure 4), scores in each cell were scored 1 to 5 (from lowest capacity to highest). Cumulative scores are the basis for computing a composite ranking by sectors and components of the complex system. Sectors were broken down as hospital and health care system, water infrastructure and services utility, emergency response and municipal government service, and local population impacts. Participants worked in groups combining members from different sectors, and each group was tasked with completing a resilience matrix for at least two of the sectors. Concluding the susceptibility and resilience matrix scoring, groups reviewed and compared results in a facilitated discussion.
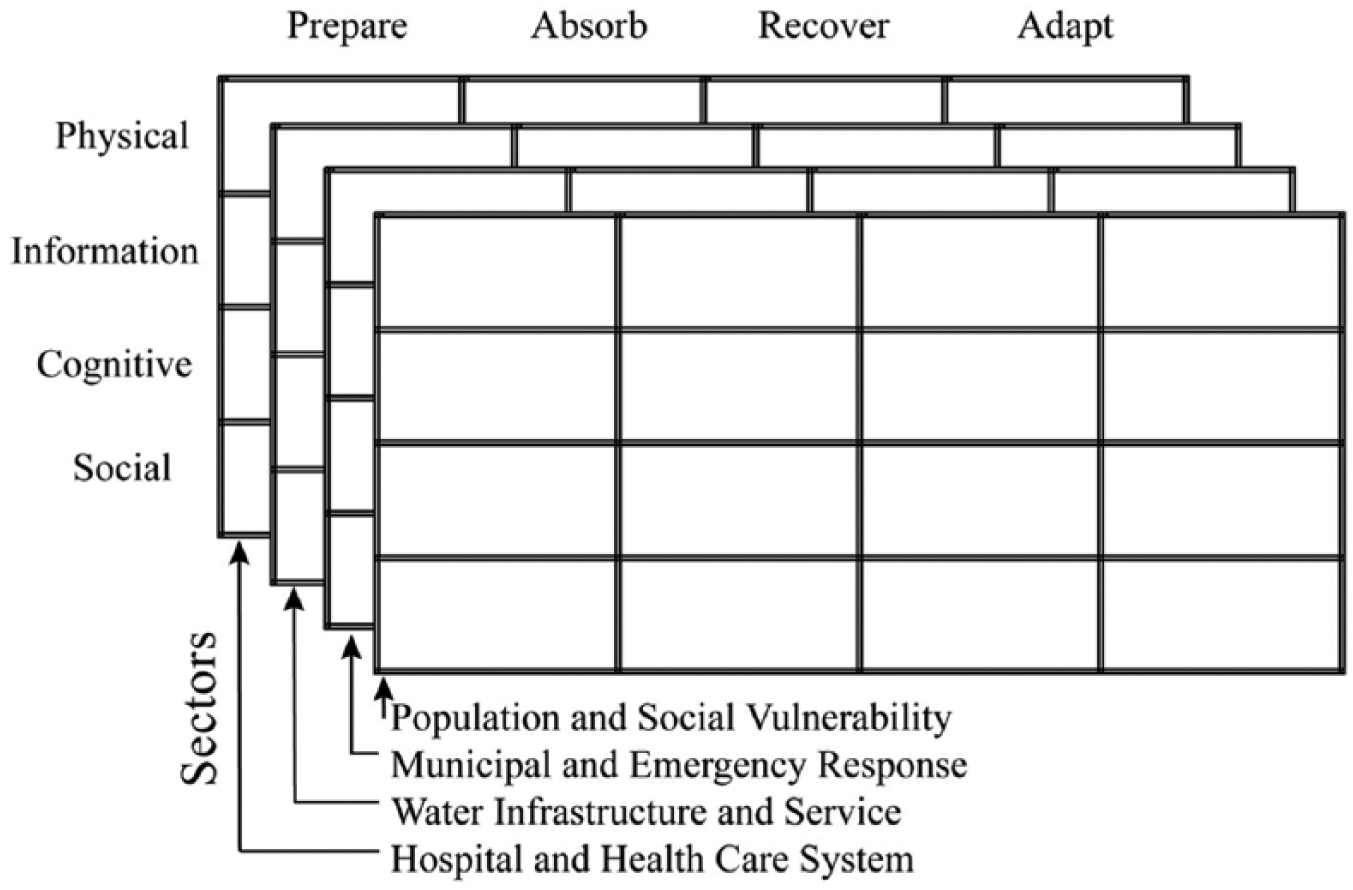
A resilience matrix adapted from Linkov et al. (2015) was used to assess multiple factors of susceptibility across sectors. Exercise participants rated indices and used the participatory GIS alongside discussions in prompted questions within each cell in the matrix. A cumulative resilience score for each sector and factor was then compiled for discussion by participants.
Participatory Web Mapping
Two interactive web mapping applications were developed for participants to explore, analyze, and assess community vulnerability and susceptibility of water infrastructure and public health in each city. The Esri “Story map” technology was used to implement these maps, which are available online for the Morehead City tabletop exercise (Allen, 2018). As water infrastructure includes sensitive information that localities protect for security purposes, the details of this infrastructure and geospatial and attribute data were only provided offline to participants during the exercise. A tabbed story map template was adapted for the webmap, shown schematically in Figure 5, with each tab containing a descriptive text pane describing layer contents, legends or scenario background, and a primary map window containing interactive functionality (zoom, pan, and inquire). Each map tab focused on sector-specific community vulnerabilities and overlay layers of potential storm surge, nuisance flooding, or extreme rainfall-prone street flooding. In addition, a webmap was constructed that contained all layers with toggle capability and hierarchical layering. This “All-layers-interactive” webmap allowed participants to choose their own combination of risk and vulnerability layers as they assessed potential impacts and susceptibility.
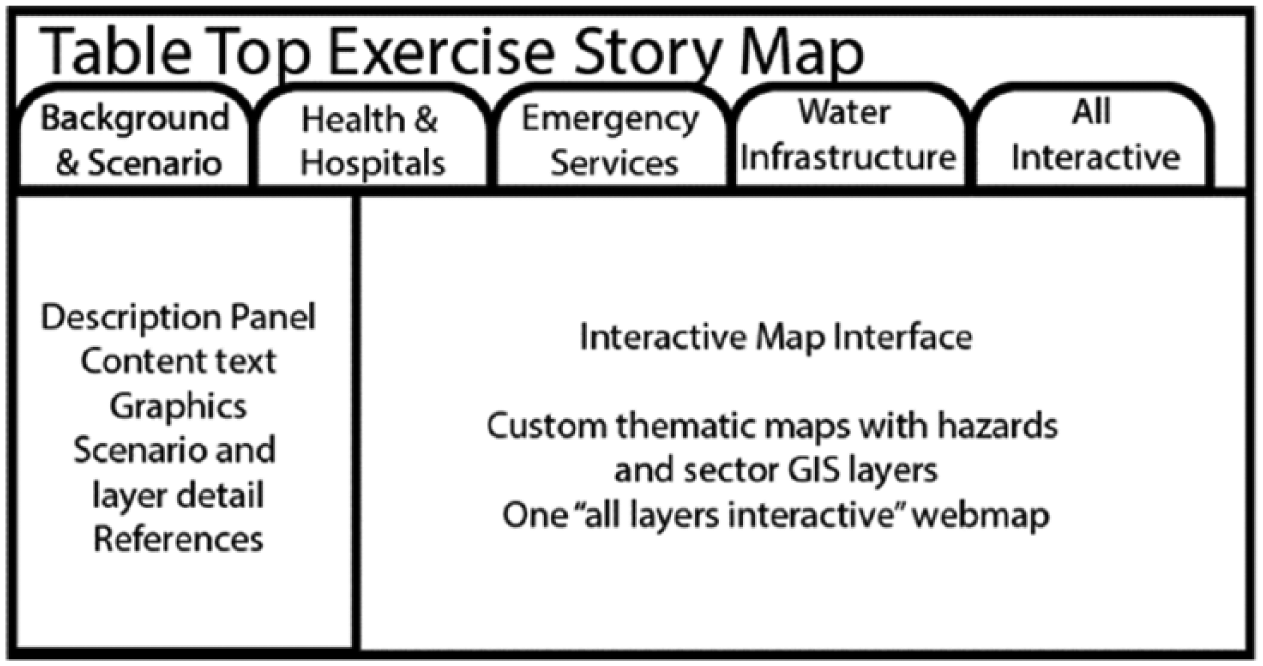
An online story map platform was developed for the tabletop scenario for each community. The storymap featured textual, graphical, and interactive maps. A leading theme introduced the scenario, meteorological and antecedent conditions. Each subsequent tab included interactive webmaps combining coastal flood depth, extent layers, community vulnerability and population susceptibility layers. An interactive custom webmap also provided all layers for participant exploration and analysis synced to sectors of the resilience matrix completed later in the exercise.
Results and Discussion
Risk Mapping
Increased tidal flooding frequency and king tide magnitudes may shift baselines such that today’s high tides become the average low tides in the future. The number of days of tidal flooding is to a great degree wired into the system and increasing. Similarly, marine inundation may intrude saline waters into pipes causing increased corrosion. Tailwater will increase into storm drains and reduce the capacity of drains to convey stormwater in high tides or elevated water levels. Even with just 20 cm of relative SLR, however, risk maps reveal that some low-lying areas of sewage service may experience salinization of soils, affecting pipes exposed to brackish groundwater and the ground level of two pump stations under at high tides in Morehead City.
The geospatial approach encountered accuracy limitations in the LiDAR DEM that required additional hydro-conditioning and corrections. Over 200 corrections were applied by manual and semiautomated GIS data editing, which improved the representation of ditches, culverts, swales, and microtopography in the flood conditions. Along with these corrections protocols and potential for improved LiDAR or Unmanned Aerial Vehicle (UAV) mapping of low-relief coastal topography (Allen & Howard, 2015), future adaptation measures may benefit from predictive mapping of problem spots (e.g., “Blue spot” mapping) or reducing the uncertainty of areas vulnerable to sea level rise (Titus & Cacela, 2008). Extreme rainfall modeled by TauDEM illustrated that there are many potential and increasing areas of street flooding possible to impact evacuation and reentry, delay recovery, and restoration of power and water supply. As sea level rises, the potential for the increasing street flooding is extensive, particularly for Charleston and the perimeter of downtown Morehead City.
Storm surges in the Hurricane Liz scenario were shown to produce locally devastating impacts on the hospital and health care system of Charleston. A mass evacuation in this scenario would be critical to reduce direct mortality from storm surges across James Island, tidal creeks of West Ashley, with all but the narrow, highest strip of the Charleston peninsula extensively flooded. Charleston’s hospital district would be heavily flooded without a wide-scale flood protection, elevation, or relocation effort. However, participants in the scenario also noted that extreme rainfall and street flooding would have critical requirements for the continuity of electricity and water, relocation of temporary generators, and early and rapid evacuation. Participants from the health sector in Charleston were particular about noting the critical need for continuity in water supply for heating, ventilation, and air conditioning (HVAC) systems and in operating rooms, with prolonged disruptions to this a critical factor in deciding if and when a hospital needs to be evacuated. A large number of other municipal and emergency services points were deemed to be affected by storm surges and were degraded or ineffectual for a prolonged period. The central wastewater treatment plant at Plum Island would be further isolated and overwhelmed, if berms are not also overtopped, and shut down. Further attention to the flood resistance of emergency generators and power supply at pump stations for water and wastewater conveyance was deemed to be prudent.
The impacts for Morehead City were less severe compared with Charleston overall, despite a direct landfall. Although downtown Morehead City would suffer greatly from storm surge and a large nursing home would need to be evacuated, impacts of the PRE rainfall and resilience of the pump station network and accidental sewage spills appear to play a greater role compared with Charleston. A few topographic low-lying areas have the potential to flood and cut off evacuation and reentry in Morehead City, particularly if the PRE event occurs during the evacuation clearance window ahead of a hurricane. While many of the sewage system lift stations could be taken out owing to low elevation and proximity to open fetches of the sound and tidal creeks, these systems could be brought back online in a timely fashion. However, much of the ETJ area surrounding Morehead City to the north and west use onsite wastewater treatment, and these suburban areas are likely to be extensively flooded and compromised. Coupling this overland inundation with high rainfall runoff, water quality problems, drinking boil water advisory, and potentially long-term creek and beach closures could result. Although the Carteret Health Care hospital is on relatively high ground and relatively less exposed to storm surges than surroundings, these peripheral populated areas may see significant increase in population exposure to contaminated water and disease transmission. With the extremely low relief and extensive swales that catch and hold rain and tidal water, late season mosquito blooms and possible vector-borne disease transmission are also an increasing concern in this future disaster scenario.
Tabletop Exercise Results
The tabletop exercises yielded new insights among decision makers with respect to their individual organization’s infrastructure and service functions as well as revealing connections and cascading effects between organizations and across sectors. In evaluation and discussion, several observations by participants keyed on the value of the geospatial visualization and interaction. Extending similar applications such as the fields of Planning Support Systems (PSS), Geodesign, and landscape architecture that emphasize the value of design (e.g., De Jonge, 2009), we have integrated this explicitly within the context of a tabletop exercise. The ability to visualize critical infrastructure across the water, wastewater, health, and emergency services was prized by multiple participants. Participants also noted that the story map interface, inclusive of scenario background, infrastructure, and population and emergency response resources, was easy to use and afforded quicker decision making and situational awareness. As a platform for communicating across sectors, evaluative remarks also stated that the group analysis allowed vulnerabilities to be revealed across sectors, linkages that might have been invisible within the silos of individual organizations and their traditional preparedness and response planning. Examples that Morehead City participants highlighted included special concern for non-flooded evacuation routes in the event of precursor rainfall and the future hardening, elevation, and water resistance of pump stations, and need to develop a program for the connection of ETJ onsite wastewater disposal to the centralized treatment plant in the city. In addition, the future scenario required some gross assumptions of stability of residential population, future tourism, and essentially a static level of residential population, tourists, and future health care facilities that would support them.
Similar issues were identified in Charleston, such as hospital site locations in a flood and wave-prone surge area, major highway corridor impassability on Hwy 17 in West Ashley, and concern for electricity and water supply over a prolonged recovery phase. Discussion of the tabletop exercise among Charleston participants elicited echoes of Hurricane Hugo (1989) among long-time personnel. Additional details of potential impacts, such as might be gleaned by a damage assessment, could be helpful. Water supply was felt by some to have received less attention than it may have merited, including dependence on electric power and pumps for pressure. Most participants agreed that there was good value in having completed the exercise among multiple sectors, whereas oftentimes such activities are limited to their own field or immediate agencies. Among the positive notes from participants, some noted the need for flexibility and integration beyond their sector of immediate responsibility. It was mentioned a few times that some threats are evident to be cumulating risk, and that agencies lack some clarity regarding the social and cultural effectiveness of their plans, or how these are apt to change with demographics as the character of the population also changes. Adaptive capacity depends on understanding across the planning and response system for integrative responses. Chu, Schenk, and Patterson (2018) identify key institutional, spatial, and equity aspects of dilemmas facing cities in responding to climate change impacts. Many of these became apparent in our study cities including procedural aspects comprising facilitator decentralization, decision-maker separation of duties, division of responsibilities across levels of government, and recognizing the needs and interests of most marginalized communities, and in a structural aspect, the siloed nature of urban planning and action.
Susceptibility and Resilience Matrix Assessment
After demonstration, participants were able to utilize the provided online susceptibility index and resilience matrix tools with ease. It proved valuable to station project team members with each group working on sectors to support their access and technical steps employing the web-based spreadsheets. In particular, participants noted the GIS maps enhanced their ability to fill out the susceptibility matrices. In addition, by using Google Forms format for matrix input, participants were able to more easily share information in real time across groups. However, participants in the first round of exercises did request more specific assistance with how to benchmark resilience judgments in the 4 × 4 matrix based on the literature to reduce subjectivity, and this component was added to the second round of tabletop exercise testing. One of the major benefits of the resilience matrix in our exercise was the tiered assessment by sectors, which retained detail and incremental variation. Decision makers were able to assess their organization infrastructure and function up or down the scale as needed. The process of evaluation for the tabletop included approximately 30 min of debriefing and discussion.
Participants in the Charleston tabletop exercise identified high-level actions for preparedness and granular details of response and recovery. Physical impact and preparedness concerns highlight the need for transportation and staff scheduling ahead of disaster and necessary additional consideration for personnel badges across agencies to be recognizable. Utilities’ concerns spanned requirements for generator support, fuel trucks to support generators, HVAC limitations, and ensuring that pumps and ventilation equipment are not located on ground level floors. Freezers, refrigerators, and kitchens may often be located on the first floor, which also raises concern for spoilage of food and delay of recovery. However, hospital participants in particular noted that water use is a limiting factor in keeping both HVAC systems and operating and surgical facilities in operation. Physical concerns highlight the need for staff to be fully aware of triage protocols and working knowledge on applying them. Access and availability of medications, whether with the patient or external pharmacy or care providers, is also a looming concern. Considering recovery, participants’ focus centered on the damage impact, protocols to handle flood water, and mold. Prolonged conservation of water, a wider network of mutual aid agreements (including out of state), and alternative adaptive measures such as well water, filtering, and more water-resistant vehicles (e.g., amphibious DUKW, or “duck tour,” vehicles) may be valuable.
Participants in Morehead City noted that they had not often discussed the connections between public health and sea level rise prior to the exercises. Given the relatively high elevation of the hospital, concern in Morehead City was focused on the vulnerabilities of additional health care facilities such as nursing homes, pharmacies, and doctors’ offices, which also occupy critical elements of routine care susceptible to disruption. After the first exercise, participants partnered with the team to attempt to gather additional data on the locations of these facilities. However, they noted that while all are required to have emergency plans, they are not reviewed for content, and so determining an effective method to reach out to risk managers for ancillary public health facilities to get them to participate in future planning exercises was noted. On the side of public works, after viewing the GIS layers groups had less concern about the elevation of pumps pending additional information about water depth under each scenario. Morehead City participants instead noted that the GIS analysis was not able to give specific information to quantify the impacts of potential inflow and infiltration to the system on water treatment capacity, which was instead viewed to be a limiting factor. Participants noted continuing to tie future long-term water and wastewater planning more explicitly tied to the short-term disaster preparation and response planning as in exercises like the one presented here will be an ongoing challenge.
One important aspect of the two-phase user testing of the tabletop exercise was the opportunity to tailor tools and products to ensure the tabletop exercise in its final format is maximized to support learning as well as decision relevance. Two important revisions were made between the two rounds of workshops in response to specific user input. First, the exercise was initially run without a focusing specific hurricane scenario. Instead, participants evaluated susceptibility for each sector for each individual hazard (sea level rise, tidal flooding, and several categories of hurricane storm surge based on generic MOMs). Participants found this to be too time-consuming and were challenged to make specific judgments on whether or not sectors were compromised under each scenario. Adding the Hurricane Liz scenario streamlined the process by providing the groups a better focus for discussion. Second, the participatory GIS matrices were presented as an exercise prior to the 4 × 4 resilience matrix exercise. At both sites, users felt strongly that the more generalized 4 × 4 matrix provided a better introduction and facilitated interaction quicker than the very specific judgments and consensus required to evaluate the GIS maps. Participants suggested that providing the general 4 × 4 resilience matrix first, then requiring specific analysis, would streamline their thinking and improve their ability to make quantitative judgments. These two revisions to the tabletop exercise format will ensure that any future transferability of tabletop exercise design to other areas—as well as more specific broad tests within the existing pilot study areas—maximizes utility for end users.
Conclusion
According to our modeling and scenarios, sea level rise presents increasing risk to water and critical health infrastructure that leads to significant impacts on public health. Spatial modeling of sea level rise coupled with increasing tidal amplitude, extreme rainfall, and storm surges exposes additional infrastructure to potential flooding as well as increased vulnerability of underground and on-site wastewater systems. Our results affirm observations by Hummel et al. (2017) that the impacts on infrastructure could extend well beyond the spatial footprint of flooding for a hurricane strike. Recent events with the fall 2015 South Carolina flooding and Hurricane Matthew of 2016 encourage increasing attention to interacting risks as tidal flooding and extreme rainfall affect hurricane evacuation and reentry and recovery. Low-lying coastal areas of suburbs or rural–urban fringe, where on-site septic systems are more prevalent, appear to be increasingly exposed to marine as well as overland inundation with sea level rise. Such exposure of on-site wastewater systems, hotter temperatures, and increasingly saline, elevated groundwater tables could compromise their function (Amador, Loomis, & Kalen, 2014) and have attracted recent attention for coastal barrier islands (Manda, Sisco, Mallinson, & Griffin, 2015). These areas might be prioritized for future sanitation by integration into centralized wastewater systems. Our GIS modeling for each area uncovered a need for rigorous analysis and localized hydro-correction of DEMs to adequately characterize rainfall runoff, tidal flooding, and storm surges. Risk assessments that seek to assess all three should carefully assess available LiDAR DEM data quality, at least to the QL 2 level as is available in North Carolina. Spatial modeling also highlighted specific areas of evacuation egress and first responder and emergency management ingress West Ashley, Charleston, and Morehead City. Similarly, most geospatial data exist in a prescribed horizontal earth coordinate system, yet to refine risk assessments and predict impacts from flooding, elevation data of actual infrastructure become essential. The availability of GIS assets with both horizontal and vertical (i.e., elevation values relative to mean sea level or other vertical datum) is highly variable. Based on our assessment, we recommend that modeling and risk assessments give special consideration to these processes and preparedness for street flooding as tidal flooding increases with sea level. GIS databases in low-lying, flood-prone areas should be refined to include vertical elevation of water, sewerage, electricity, and communication infrastructure as well as health services assets. Not only should individual infrastructure assets be protected against inundation, but also the accessibility to critical pumps and power utilities should be included in physical and hazard mitigation plans. As with the relative underinvestment of water infrastructure itself (including redundant alternatives), coastal geospatial data representing these systems would also yield returns in future resiliency.
Participants across the health, water utilities, emergency management, and planning communities revealed insights as well as value of interaction across sectors. While large infrastructure projects are underway to mitigate flood impacts in Charleston, a direct strike hurricane such as our scenario presented would challenge, if not devastate, the existing state of infrastructure. Charleston’s hospital district would be extensively flooded, and participants recognized new, interconnections between sanitation and treatment services and the requisite provision of vital electricity, water, and transportation. The tabletop exercise affirmed the value of geovisualization for risk assessment and as a platform for communicating across sectors. Our combined use of an interactive story map web application and susceptibility indices conducted in a collaborative exercise promoted detailed discussion and elicited insights likely only to have arisen by active exploration and discovery among participants. The tiered index of susceptibility provides for nuanced, gradational assessment and complemented the wider systemic scores of a resilience matrix. The linkage of risk maps that depict multihazard threats (extreme rainfall flooding, tidal flooding, and storm surges) also spatially grounded the evaluation, albeit within the confines of a simulated, future scenario.
The spatial analysis of risk drove home the need for high-level actions in preparedness as well as details for rapid response and recovery. Securing the locations for medicine, water and power, ventilation, and refrigeration and kitchens (often located on first floors) were among many noted issues at a tactical level within the health care sector. On the landscape scale, the tabletop and integrated risk assessment suggests that wider networks of interactions would be fruitful. Our exercise, for instance, did not include the regional power utility, and some questions arose in the exercise as to impacts and availability of power restoration that were hampered by this absence. For integrative risk assessments, we recommend that while GIS can facilitate the cross-sector insights via an exercise, it is best deployed in a serial fashion. We held a workshop and a subsequent exercise, and the series of these events promoted rapport and teamwork at the tabletop exercise. Although participating agency staff collaborate in person during emergency operations, they rarely have the opportunity to prepare and plan together in processes such as this project. The experience of coordinating the workshops and exercises also echoes challenges Turner, Alderman, Connell, and Tong (2013) note in the adoption of climate change in future health system planning. We concur with Petkova, Ebi, Culp, and Redlener (2015) who encourage regional public health action to address climate-sensitive hazards. Our results highlight such regional variations in climate change, and severe weather-related disasters will occur under unique conditions of population and community susceptibility.
Continued development of coastal resilience will require systemic, place-based solutions and myriad adaptations. Toward this, the health sector may fruitfully engage with emergency managers in long-range hazard mitigation planning as well as periodic training-oriented functional disaster exercises. In reflecting on the research constraints and revelations over the project, two risk mapping challenges were preeminent. First, during the project, two coastal flood disasters occurred in each of the study areas as a result of combined antecedent rainfall and plumes of tropical moisture that swamped localities, even while coastal storms tracked offshore and did not make landfall (Hurricanes Joaquin and Matthew, 2015 and 2016, respectively). The prevalence and vulnerability to extreme rainfall flooding necessitate additional research on rainfall climatology, susceptibility of infrastructure designed for historical climate conditions, and prediction of future rainfall magnitude-recurrence. Second, we discern that the literature on PSS can find fruitful linkages to emergency management decision-support systems and related systems of planning and preparedness. The tabletop exercise in this study, for instance, a tool long familiar to emergency managers, was novel and valuable to health system administrators who were primarily familiar with functional exercises. Although adopting alternative conceptual model to Uittenbroek et al. (2013), the study affirms the overall value of their approach to identifying sectoral barriers and opportunities. Results highlighted the utility of participatory risk mapping and tabletop exercises in both communities to reveal individualized, agency, and cross-sector knowledge gaps. Putting the onus on tabletop participants to cooperate in a future disaster scenario also provided them an opportunity to identify synergies and take into consideration future impacts (Uittenbroek et al., 2013). Similar to advances in PSS, the intensive use of GIS was placed into a scenario that sought to overcome algorithmic, instrumental, or overly technical interface that can distract from the planning process (Pelzer & Geertman, 2014). While this project is heavily embedded in the planning and emergency management practices in the United States and the municipalities of North and South Carolina, there are also international extensions. For instance, the acceleration of sea level rise and increased rainfall extremes being experienced in the Southeastern United States may find parallels in other subtropical temperate coastal cities. Charleston, South Carolina, for instance, has a sister city in Panama City, Panama, combining historic tourism, major port operations, and infrastructure and sea level rise challenges. Although the Town of Morehead City, North Carolina, does not have a sister city, the nearby City of Wilmington has similar flooding challenges as well as being a large coastal port and riverine deltaic floodplain, similar to its sister city Dandong, China.
The study provided the salience of community vulnerability with the realism of population and place-based susceptibility in a plausible future scenario. Since emergency management professionals routinely train, this sector might likewise engage more regularly with the health and water infrastructure utility managers. We suggest that health systems across the public and private sector seek greater engagement with emergency management and urban and regional planners, participate in exercises (e.g., U.S. EPA 2010), and keep up with changes in evolving flood mapping (Federal Emergency Management Agency, 2007). Strides at integrating climate-sensitive coastal hazards and emergency management into public health and water infrastructure would pay dividends in reduced community and infrastructure exposure and promoting recovery when disasters occur. The study augments and extends the insights of Pelzer and Geertman (2014) by demonstrating the integration of scenario-based, future hazard planning processes and developing reflective learning and multiple sector stakeholders in a process that also reveals mainstreaming climate adaptation barriers and opportunities (Uittenbroek et al., 2013).
Footnotes
Acknowledgements
Authors would like to thank the following agencies for active participation and sharing of information and data: Medical University of South Carolina Office of Emergency Management, City of Charleston Emergency Management, College of Charleston Emergency Management, Charleston County Emergency Management, Coastal Conservation League, City of Charleston council, City of Charleston GIS Office, City of Charleston Public Service, City of Charleston Planning, Charleston Water System board, Charleston Water System, Department of Health and Environmental Control: Public Health Preparedness and Water Divisions, City of Charleston, City of West Ashley, James Island Public Service District, Charleston County Zoning & Planning Department, Charleston Water Keeper, Hospital Association, Roper Hospital, South Carolina Department of Health and Environmental Controls: Oceans and Coastal Resource Management Division. In Morehead City, we greatly appreciate the support of Whitney Jenkins and the North Carolina National Estuarine Research Reserve, the Morehead City Town Manager, directors of planning and public works, Carteret County Department of Health, Dr. Chris Voss of the University of North Carolina, Institute of Marine Science, and Mr. Greg Rudolph, Carteret County Shore Protection Office.
Declaration of Conflicting Interests
The author(s) declared no potential conflicts of interest with respect to the research, authorship, and/or publication of this article.
Funding
The author(s) disclosed receipt of the following financial support for the research, authorship, and/or publication of this article: This research was supported by funding from the NOAA Climate Program Office, Coastal and Ocean Climate Applications (COCA) program, U.S. Department of Commerce. The statements, findings, conclusions, and recommendations are those of the authors and do not necessarily reflect the views of the universities, Sea Grant, or U.S. Department of Commerce.