






Abstract
Capturing complex spatio-temporal dependencies in energy data of connected infrastructures remains a significant challenge. Indeed, most of the proposed approaches focus on either spatial or temporal dependencies, without effectively modeling their joint influence. This paper presents a comprehensive spatio-temporal framework for energy forecasting in smart buildings, with structured representation of entities, events and relationships in the IoT ecosystem. For energy consumption prediction, we propose a hybrid CNN2D-LSTM model that combines convolutional layers to extract spatial features from multi-variable data with LSTM layers to capture temporal dependencies. The proposed model is instantiated on a smart hospital building which is characterized by continuous operation, high energy consumption and heterogeneous medical equipment. Under realistic constraints, a simulation-based dataset was generated and used for evaluation, reflecting dynamic behaviors in the event-driven system and realistic scenarios of energy consumption. The experimental evaluation demonstrates that the proposed model outperforms conventional approaches such as ANN, RNN, CNN, and LSTM and also hybrid models from the literature in terms of prediction accuracy. Comparisons were also conducted under different operating scenarios, including normal consumption, overconsumption, and under-consumption conditions, while maintaining a reasonable processing time. Beyond prediction, the proposed framework supports Green IoT principles by enabling energy management systems to monitor consumption, detect anomalies, and support proactive decision-making. It provides a scalable foundation for energy management in complex smart buildings.
Keywords
Introduction
The increasing integration of digital technologies into buildings has given rise to smart buildings, where IoT-based sensing, communication, and control are leveraged to optimize resource consumption and enhance user comfort. In this context, the Green Internet of Things (Green IoT) has emerged as a central paradigm, emphasizing energy-efficient data acquisition and intelligent resource management to minimize the environmental footprint of connected infrastructures. 1 Smart buildings represent an essential convergence between technological innovation and sustainable development, offering effective solutions for resource management in increasingly complex environments. 2
Energy management in smart buildings is a complex task influenced by technological, behavioral, and contextual factors. 3 One of the main difficulties lies in the high heterogeneity of energy sources and loads, as smart buildings often integrate grid electricity, solar panels, batteries or backup generators alongside diverse energy-consuming systems such as HVAC, lighting, elevators, and IoT devices. 4 Coordinating these heterogeneous components in real time to ensure both efficiency and reliability is a significant technical challenge. Additionally, the dynamic and unpredictable nature of energy demand, influenced by occupancy patterns, weather conditions, and operational schedules, can lead to sudden peaks that increase operational costs and affect system stability. 5 Another major issue concerns the management of critical and non-critical equipment, especially in environments where life-support systems or refrigeration units must remain operational at all times. Balancing energy allocation without compromising reliability is therefore crucial. Smart buildings must also contend with event-driven and contextual conditions such as heatwaves or equipment failures that can drastically alter energy consumption profiles, demanding adaptability and resilience from building systems. Finally, the integration of sustainable and green IoT objectives intensifies these challenges, as buildings are now expected to minimize waste, optimize energy use, and contribute to carbon neutrality goals, all while maintaining comfort, resilience, and operational performance. These challenges are even more pronounced in critical infrastructures such as hospitals, where ensuring uninterrupted operation of life-support systems and medical equipment is vital. Smart hospitals thus constitute an ideal case study to evaluate intelligent energy management strategies. Nevertheless, while the hospital scenario is particularly relevant, the proposed approach remains general and can be extended to any smart building context with strong spatial and temporal interdependencies.2,6
Predicting energy consumption is a crucial step towards proactive energy management. According to the IEA Tracking Report Buildings, the building sector accounted for approximately 30% of global final energy consumption and around 27% of total energy-related CO
To overcome these limitations, we propose a conceptual and spatio-temporal framework for energy consumption prediction in smart buildings. The conceptual framework provides a structured representation of entities, such as sensors, actuators, equipment, and events, and their relationships across the different layers of an IoT ecosystem. It bridges the gap between physical infrastructure and intelligent analytics, ensuring consistency between data collection, prediction, and control. The contributions of this work are as follows:
A conceptual framework that models interactions between IoT components, building entities, and energy management processes, ensuring consistency between data acquisition and predictive analysis. A hybrid CNN2D-LSTM model designed to jointly capture spatial correlations across building zones and temporal dependencies in energy consumption data. The use of a multi-variable, event-driven dataset reflecting realistic smart building conditions to evaluate the robustness of the proposed approach.
The novelty of this work lies in their integration within a structured smart building framework and their adaptation to multi-zone, event-driven environments, enabling more realistic and robust energy consumption modeling.
The rest of the paper is organized as follows: Section 2 introduces basic concepts related to smart buildings and energy management challenges. Section 3 reviews existing works in the domain and provides a comparison and a discussion about existing approaches, while clearly identifying the main gaps in the domain. Section 4 presents conceptual elements of the framework and implementation details, mainly the detailed architecture and functioning of the hybrid predictive model. Section 5 presents conceptual and technical elements of our case study relative to a smart hospital, and describes data generation rules and constraints, aiming to produce realistic datasets for training and evaluating the proposed prediction model. Section 6 focuses on the evaluation of our solution through experimental results. Finally, Section 7 concludes the paper and evokes future works.
In this section, we introduce some notions relative to smart buildings and energy consumption management.
Smart building
Smart buildings integrate advanced technologies such as the Internet of Things (IoT), smart sensors and automation systems to optimize resources management and improve the overall performance of the infrastructure.3,12 By connecting various devices and centralizing data collection, smart buildings enable optimal energy allocation and real-time response to variations in demand; this enhances energy efficiency and reduces the carbon footprint. Several categories of smart buildings can be found, among them:
Smart Public Infrastructure: includes government buildings, transportation hubs, libraries, and other public service facilities that integrate IoT-based energy management, security systems, and sustainability measures.
13
Smart Residential Buildings: refer to homes integrating smart equipment such as thermostats, energy-efficient appliances, automated lighting, and home security systems, in order to enhance comfort, security, and energy efficiency.
14
Smart Commercial Buildings: offices, shopping malls, and hotels employ smart energy management systems and predictive maintenance to optimize operational costs, enabling real-time monitoring and data-driven decision-making to enhance energy efficiency and sustainability.
15
Smart Industrial Buildings: factories leverage industrial IoT (IIoT) solutions for process automation, predictive maintenance, and intelligent resource allocation. Energy management in these buildings focuses on optimizing machinery operations and minimizing energy waste through real-time monitoring and smart grid interaction.
16
Smart Educational Buildings: schools, universities, and research institutions implement smart solutions for energy efficiency, environmental monitoring, and adaptive learning spaces. IoT-driven automation regulates lighting, ventilation, and classroom conditions based on environmental conditions.
17
Smart Hospitals: incorporate IoT-based monitoring and control systems to ensure the efficient operation of medical equipment, climate control, and emergency power supply. Due to their high and continuous energy demands, smart hospitals require advanced energy optimization strategies to maintain operational reliability, minimize costs, and enhance patient care.
10
Energy consumption challenges in smart buildings
Managing energy consumption in smart buildings presents several challenges due to the complexity and dynamic nature of these environments. The main challenges are summarized in the following points:
Smart buildings use a wide range of IoT devices (sensors, actuators, smart meters, …), which generate large volumes of heterogeneous data. Also, the coexistence of multiple energy sources (electricity, solar panels, batteries, etc.) complicates energy distribution and management. Energy demand varies based on occupancy, weather conditions, and operational requirements. Sudden consumption peaks, especially during extreme weather or high occupancy, require dynamic load balancing to avoid wasted energy and network overload. The coexistence of critical systems (life-support machines, emergency power supply) and non-critical loads (lighting, HVAC) requires uninterrupted energy supply to critical equipment while optimizing overall consumption. Adaptive energy management systems must continuously learn and adjust to user preferences, occupancy patterns, and external conditions to enhance comfort while minimizing waste.
Green IoT refers to the integration of energy-efficient principles and sustainability objectives into IoT systems, aiming to reduce the overall energy footprint of IoT devices, communication processes, and data management infrastructures, while maintaining high levels of connectivity, intelligence, and responsiveness. 18 In the context of smart buildings, Green IoT leverages real-time data collection and advanced analytics to optimize energy consumption, adapt operations to occupants’ needs, and support the integration of diverse energy sources. This synergy promotes efficient resource allocation, reduces operational costs and preserves the environment. 2
Smart hospitals are a specific type of smart buildings, where advanced IoT and automation technologies are mobilized to meet the demands of the healthcare sector. By integrating intelligent sensors and proactive energy management systems, hospitals optimize energy consumption to ensure the uninterrupted operation of medical equipment and guarantee patient comfort and safety.
Literature review on energy consumption forecasting in smart buildings
After exploration and analysis of the literature, we identified two main categories of approaches for energy management: mathematical approaches and artificial intelligence (AI)-based approaches.
Mathematical-based approaches
The main objective of mathematical-based approaches is to model energy consumption prediction and capture linear relationships in time series, using mathematical equations and statistical models (e.g., regressions, ARIMA, TBATS).
In Goudarzi et al., 19 the authors proposed an optimized hybrid model, named AIK-EWMA, combining ARIMA (Auto-Regressive Integrated Moving Average) and ICA (Imperialist Competitive Algorithm), to accurately predict energy consumption in smart buildings and identify potential failures. The authors also used the EWMA (Exponentially Weighted Moving Average) model to monitor and detect minor variations in the predictions. The work of Alduailij et al. 20 proposed a forecasting model based on different statistical and machine learning approaches (ARIMA, TBATS, ANN, and LSTM) to predict the short-term (24 h) electricity consumption of smart government buildings, such as libraries, schools, and halls, in order to reduce energy costs and carbon emissions. In Fumo and Biswas, 21 the authors explored simple, multiple and quadratic regression models, using meteorological data and energy consumption to predict energy consumption in residential buildings, specifically a research house (TxAIRE Research House). The authors of Korolija et al. 22 developed simplified regression models to predict the annual energy requirements (heating, cooling, and auxiliaries) of HVAC systems in office buildings.
Artificial Intelligence-based approaches
AI-based approaches rely on artificial intelligence techniques capable of automatically identifying complex patterns and correlations within energy consumption data; this category include machine learning (ML) methods and deep learning (DL) methods.
Machine-learning-based approaches
The primary goal of this category of approaches is to predict energy consumption patterns in smart building systems, using machine learning methods that seek to automatically learncomplex relationships from consumption data and explanatory variables (climate, occupancy, etc.), in order to improve the accuracy of prediction compared to purely mathematical models, while remaining relatively efficient.
A predictive energy consumption model for smart commercial buildings is proposed in Keytingan et al., 15 using machine learning algorithms. The authors evaluate three methodologies: k-Nearest Neighbor (k-NN), Support Vector Machine (SVM), and Artificial Neural Network (ANN). The SVM performed best for two of the buildings considered, while k-NN was superior in the other cases. The authors of Nie et al. 23 proposed an innovative model to predict the energy consumption of smart homes, with simulations based on common home appliances such as HVAC, water heaters, washing machines, etc., using gradient boosting regression trees (GBRT), and a hybrid ARIMA-GBRT version. The proposed models reduce the prediction error (RMSE) compared to existing models (SVM, ARIMA-RNN, etc.) and allow better estimation of electricity consumption. The authors of González-Vidal et al. 24 compared energy consumption prediction models in a smart university building, using two approaches: models based solely on data (black-box models) and hybrid models using both data and physical knowledge (grey-box models). Their objective is to evaluate the performance of these approaches to predict energy consumption. In Cao et al., 25 the authors compared and evaluated several machine learning models, simple (linear regression, SVR) and ensemble models (Random Forest, XGBoost), to predict electricity consumption in smart hospitals, more precisely in Shanghai Tenth People’s Hospital. They focus on the accuracy of predictions based on climate, occupancy and operation variables to improve energy management. In Guo et al., 26 the authors proposed an ANN prediction model that predicts the amount of energy needed to heat and cool a smart residential building, in order to enable early energy analysis, optimize building design and improve HVAC system performance.
Deep-learning-based approaches
This category includes works that use deep-learning methods leveraging advanced neural architectures (ANN, CNN, LSTM, hybrid) to simultaneously capture nonlinear, temporal and sometimes spatial dependencies in energy data. This is to offer superior predictive capacity, particularly for complex and high-dimensional series.
A deep-learning framework named kCNN-LSTM was proposed in Somu et al.
27
for energy consumption prediction of an academic building, including smart classrooms, offices, research labs, and servers. This model combines k-means clustering, convolutional neural networks (CNNs), and LSTM networks to analyze trends, identify energy-related features, and model temporal dependencies in energy consumption data. In Zini and Carcasci,
10
the authors presented an energy monitoring method for HVAC systems of a hospital using predictive models based on multilayer perceptron and artificial neural networks (ANNs), to monitor electricity consumption and detect anomalies in energy behaviors. The models achieve high performances, with an R
Table 1 provides a comparison of the different prediction approaches mentioned above, according to a set of criteria we defined: type of Building, IoT devices, category of approach, hybrid model, methods used, data source, performance metrics and results obtained.
Comparison of approaches - prediction for energy consumption.
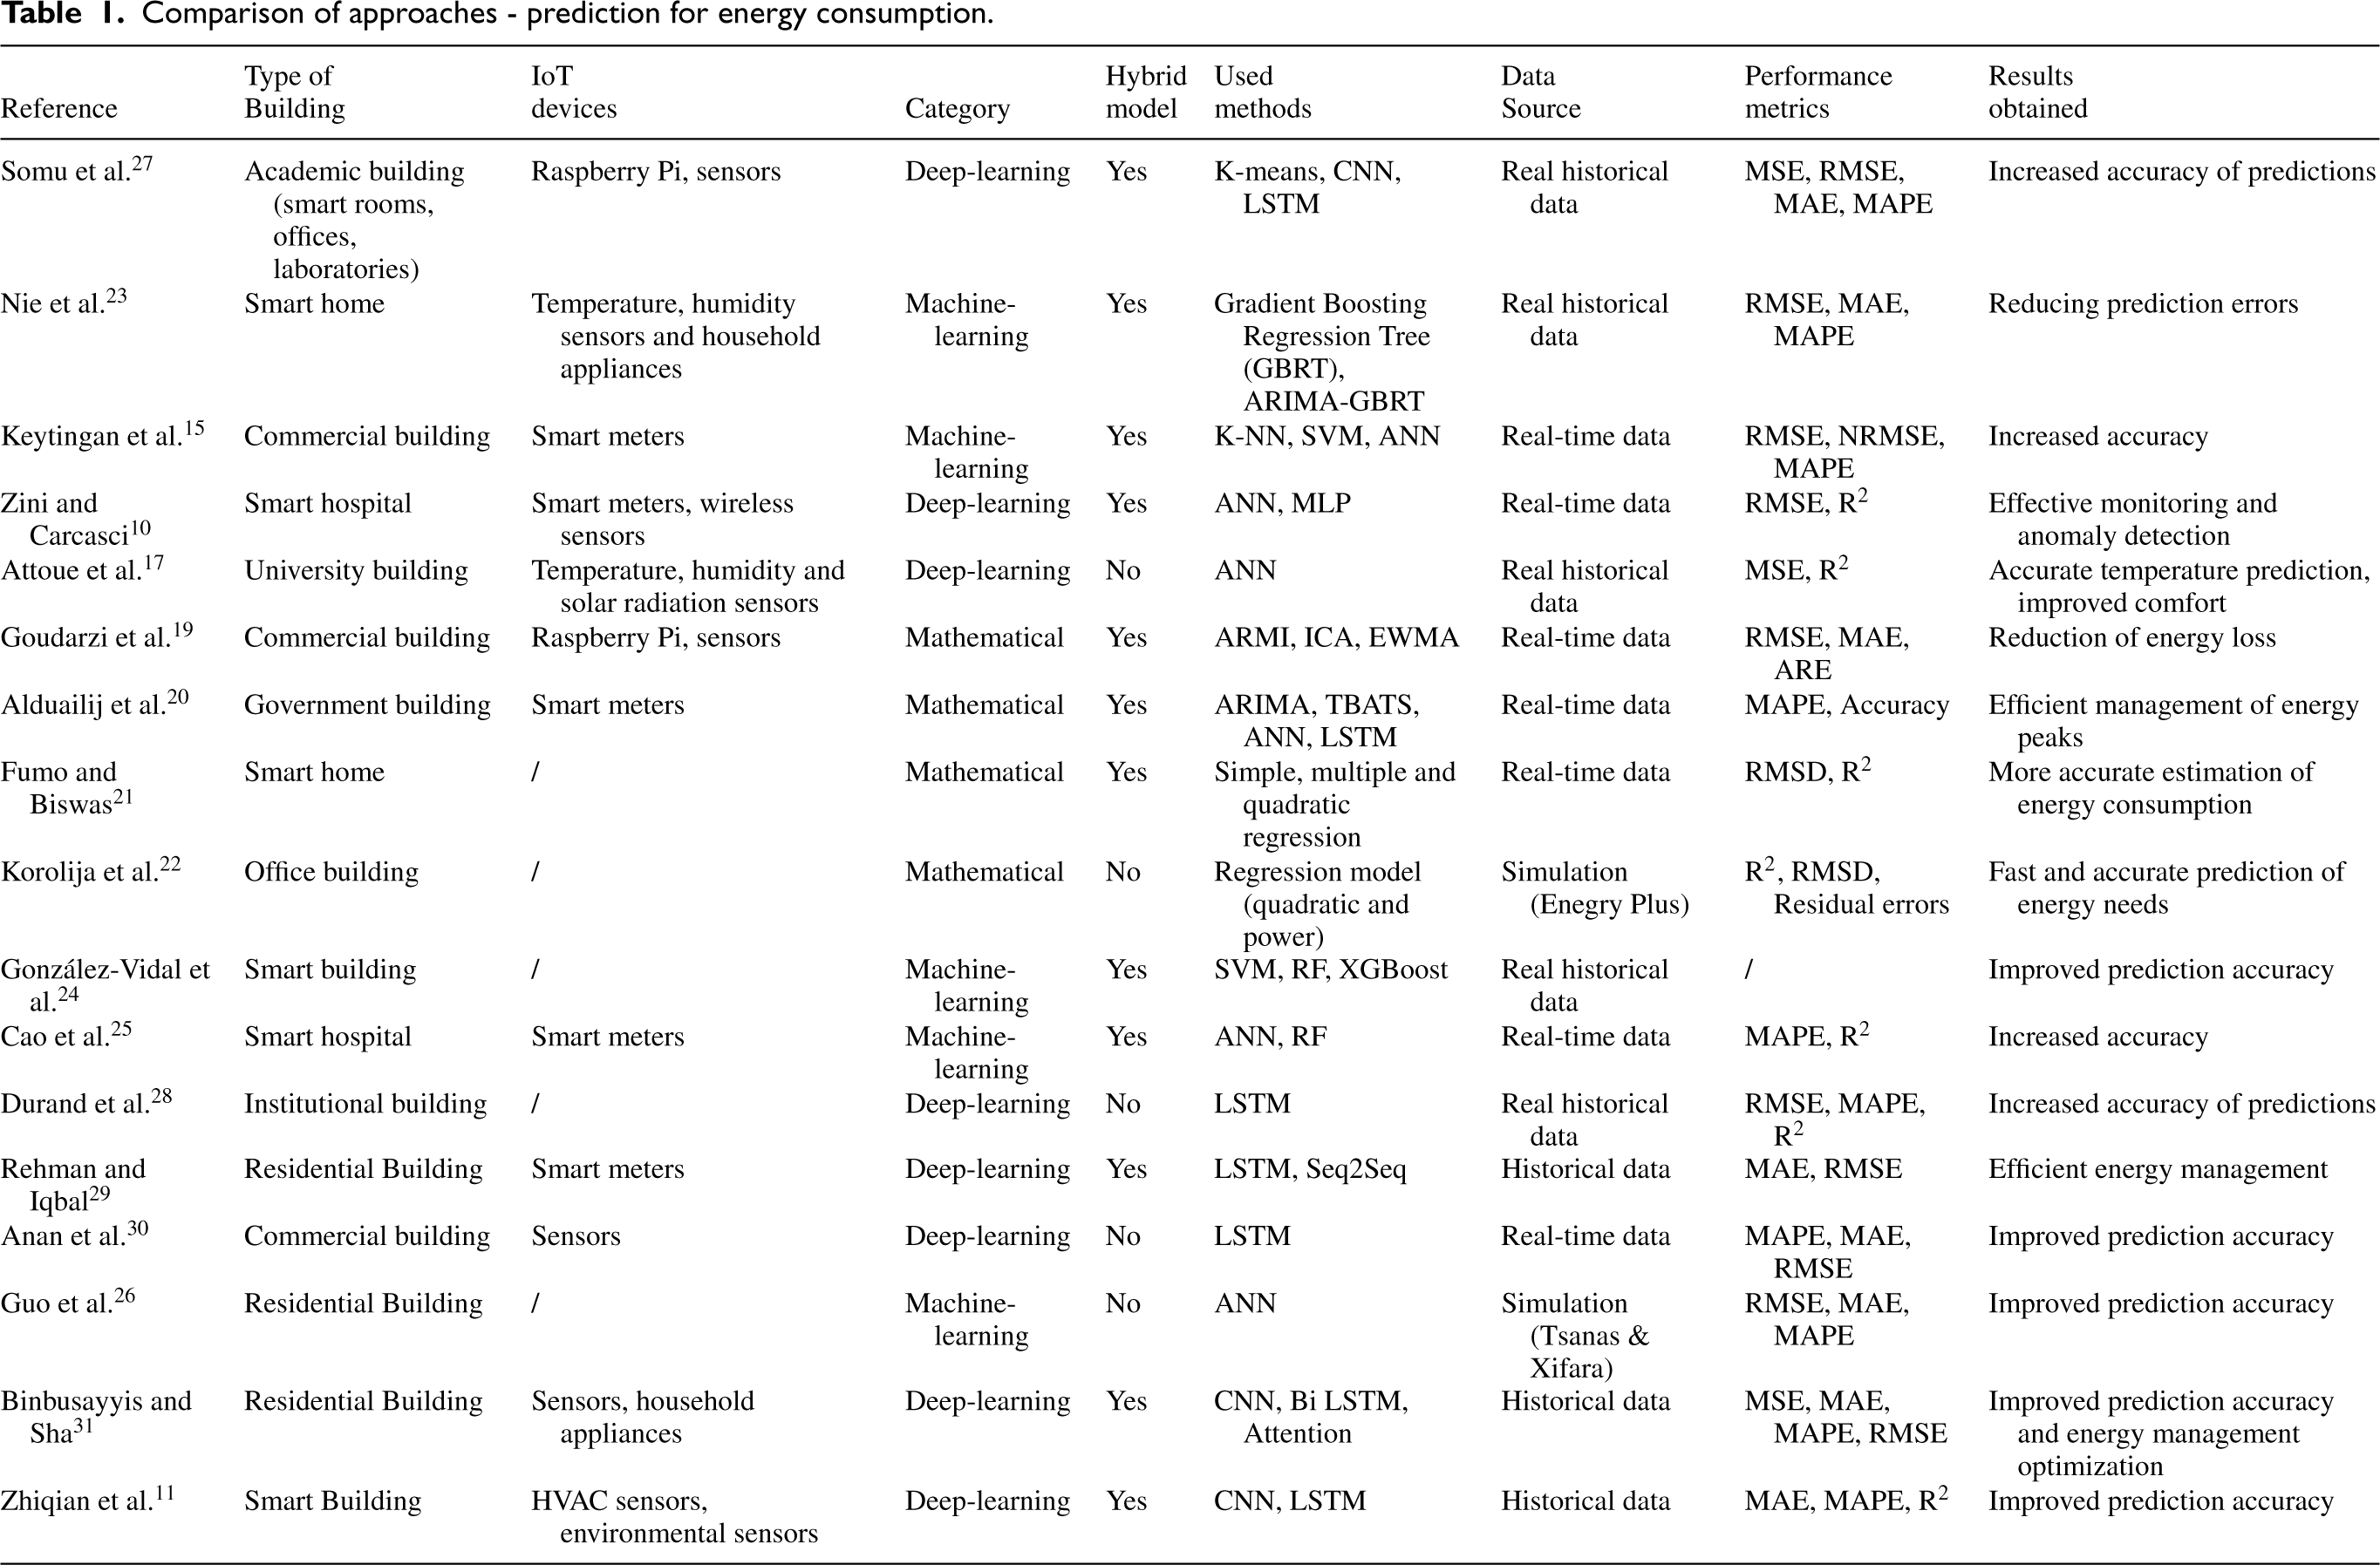
Comparison of approaches - prediction for energy consumption.
Analysis and discussion
Regarding the categories of approaches, we can say that mathematical and statistical models such as ARIMA, 23 TBATS 20 or regression 22 are suitable for capturing linear temporal dependencies, but they often fail to handle nonlinear and high-dimensional data typical of IoT environments; this limits their applicability in complex environments.
Machine learning methods like SVM, ensemble techniques (XGBoost, GBRT) or Random Forests (RF), improve predictive performance by learning from historical data. However, they remain sensitive to feature selection and do not exploit sequential dependencies, which are fundamental in energy consumption time series.
Deep learning approaches emerged as the most promising solutions due to their ability to model complex nonlinear and sequential patterns. Architectures such as CNN, ANN, and LSTM11,17,27,29 demonstrate improved performance compared to traditional methods. However, each architecture individually remains limited: CNNs efficiently extract spatial features but ignore temporal evolution, while LSTM capture long-term temporal dependencies but neglect spatial interactions among building zones. 30 This structural limitation prevents these models from fully capturing the spatio-temporal nature of energy consumption.
Moreover, a critical gap in the literature lies in the application context; most studies focus on residential or office buildings, where energy dynamics are relatively regular. In contrast, most studies rarely address event-driven and complex heterogeneous environments such as hospitals,10,25 where energy dynamics are influenced simultaneously by heterogeneous equipment (critical vs. non-critical), dynamic occupancy patterns, and event-driven conditions (e.g., heatwaves, pandemics, system failures), making prediction significantly more challenging.
Also, we noticed that few studies explore the use of critical equipment such as medical equipment. The management of critical equipment is often a priority because of its direct impact on the health, safety and comfort of the occupants.
From the table, we can see that most of the works use either real-time data10,15 or historical data,17,27 often complemented by simulations to validate the models. Moreover, to validate the effectiveness of the proposed approaches, the performance metrics like RMSE, MAE, and R
Another observation is that hybrid models found in the literature (e.g., ANN–LSTM 20 or ANN–RF 25 ) do not explicitly encode the spatial structure of the building, and thus cannot fully represent inter-room dependencies, which are essential for accurate forecasting in multi-room infrastructures. In addition, few works Durand et al. 28 are supported by a conceptual or system-level framework, meaning that prediction models remain disconnected from the system-level operation, data flow, and IoT integration. These findings clearly reveal that existing models are fragmented, addressing specific aspects of energy forecasting problem without providing an integrated framework capable of adapting to dynamic system conditions.
This observation motivates our work to design a spatio-temporal deep learning framework that integrates both conceptual modeling and hybrid model-based prediction, capable of handling spatial heterogeneity, temporal dependencies, and contextual variability within smart buildings. Our proposed CNN2D–LSTM model directly responds to the identified gaps by:
Jointly modeling spatial and temporal dependencies, leveraging 2D convolution for room-to-room interactions and LSTM layers for sequential temporal learning. Operating within a conceptual and system architecture, ensuring that predictions are consistent with the building’s IoT data flow and energy management processes. Adapting to dynamic conditions, including event-driven scenarios (e.g., heatwaves, pandemics, outages).
In this section, we present the conceptual and technical aspects of our framework. First, we describe a meta-model of concepts supporting a smart building EMS, and a software architecture of the system. Second, on the technical side, we propose a hybrid deep learning model (CNN2D+LSTM) for accurate energy consumption prediction aiming to support proactive energy management, improve operational efficiency, and ensure reliable energy supply for critical building functions.
Conceptual meta-model for smart building EMS
The meta-model described in Figure 1 captures both the spatial organization of the infrastructure and the temporal dynamics of its operation. On the spatial dimension, the smart building is represented as a hierarchical structure composed of ensemble of buildings, floors, and rooms. Each room is characterized by attributes such as orientation (North, South, East, West), geometric position (pos_x, pos_y), and area, which together define the spatial context influencing energy behavior, for example, solar exposure or proximity to HVAC zones. Regarding the temporal dimension, the model integrates the evolution of energy-related variables collected by IoT devices. Sensors continuously measure time-dependent data such as temperature, humidity, occupancy, and energy consumption, while actuators dynamically respond to these variations by adjusting lighting, HVAC, or other control systems. This interaction between spatial configuration and temporal variation allows the system to represent how energy consumption evolves over time and across physical zones of the building.
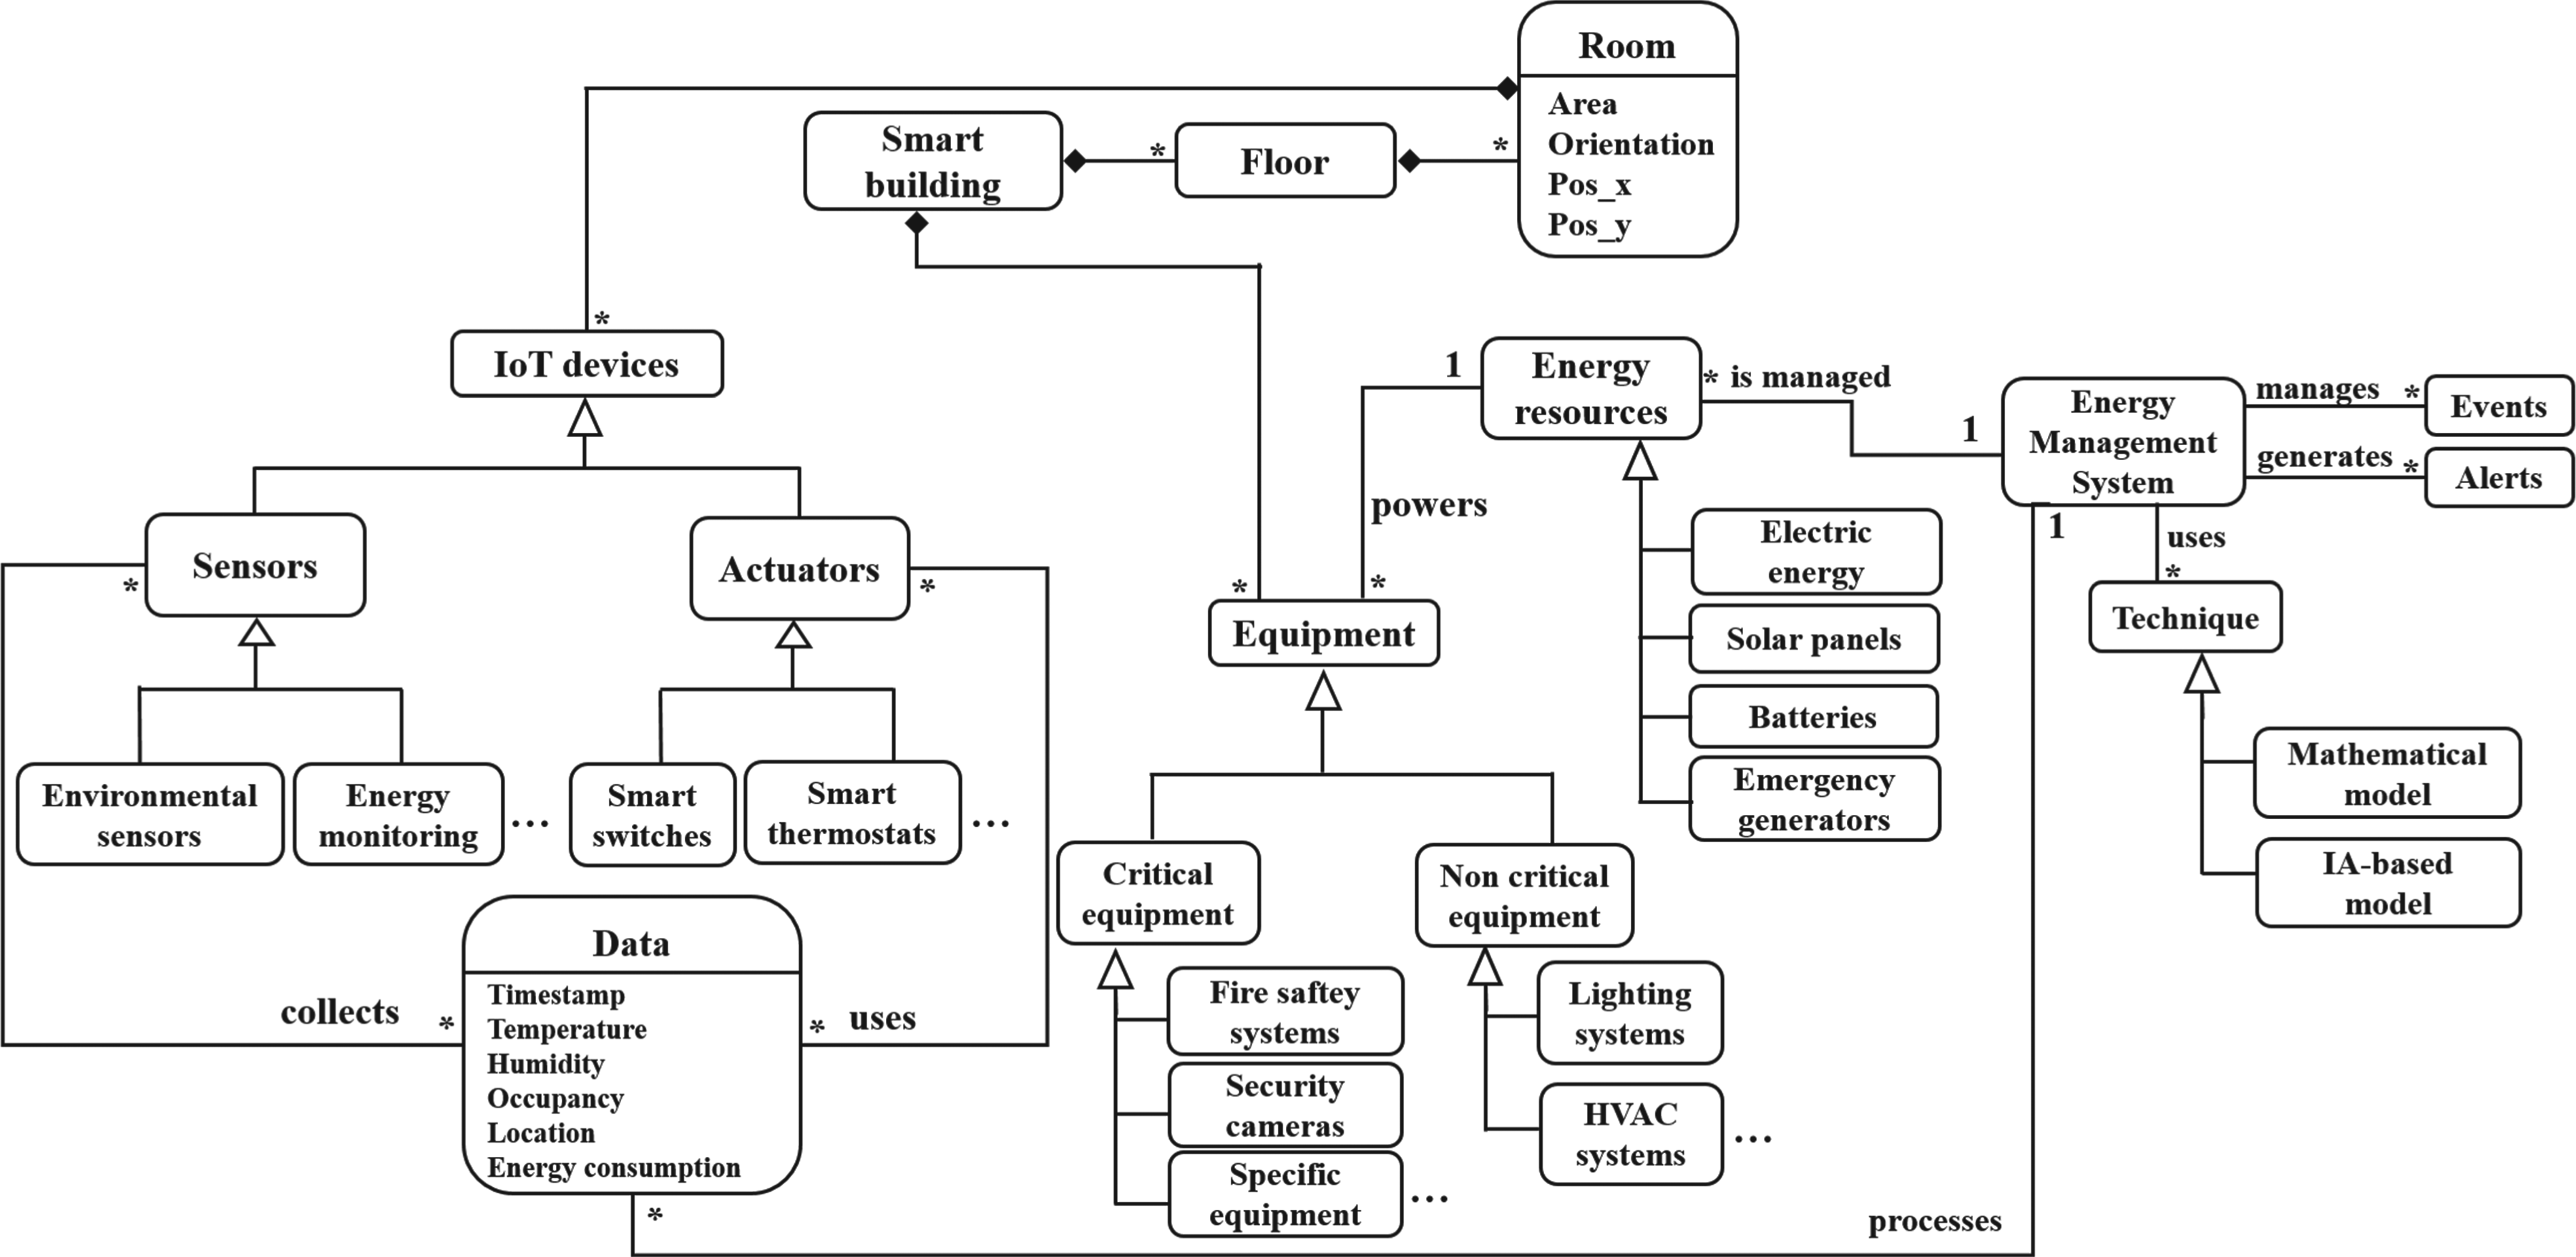
Metamodel of concepts - Smart building EMS.
A smart building uses a variety of IoT devices including environmental sensors and energy monitoring sensors, actuators like smart switches and smart thermostats, to operate effectively and optimize its overall performance. It also contains a set of equipment, which can be categorized into two types: critical equipment, such as fire safety systems and security cameras, and non-critical equipment, such as lighting systems and HVAC units. Energy sources such as electric energy, solar panels, batteries, or emergency generators, supply power to the building’s equipment. These are managed through an Energy Management System (EMS) that processes spatio-temporal data, detects events (e.g., demand peaks, outages), generates alerts and triggers adaptive control or prediction mechanisms.
The metamodel thus provides a unified representation linking the “where” (spatial structure) and the “when” (temporal dynamics) aspects of energy management within a smart building.
The proposed smart building EMS follows a four-layer architecture (see Figure 2) reflecting the fundamental components of an IoT environment and interactions between them. Each layer plays a distinct role, from data acquisition to intelligent decision-making and user interaction. The architecture includes a perception layer, a network layer, a data processing layer, and an application layer.
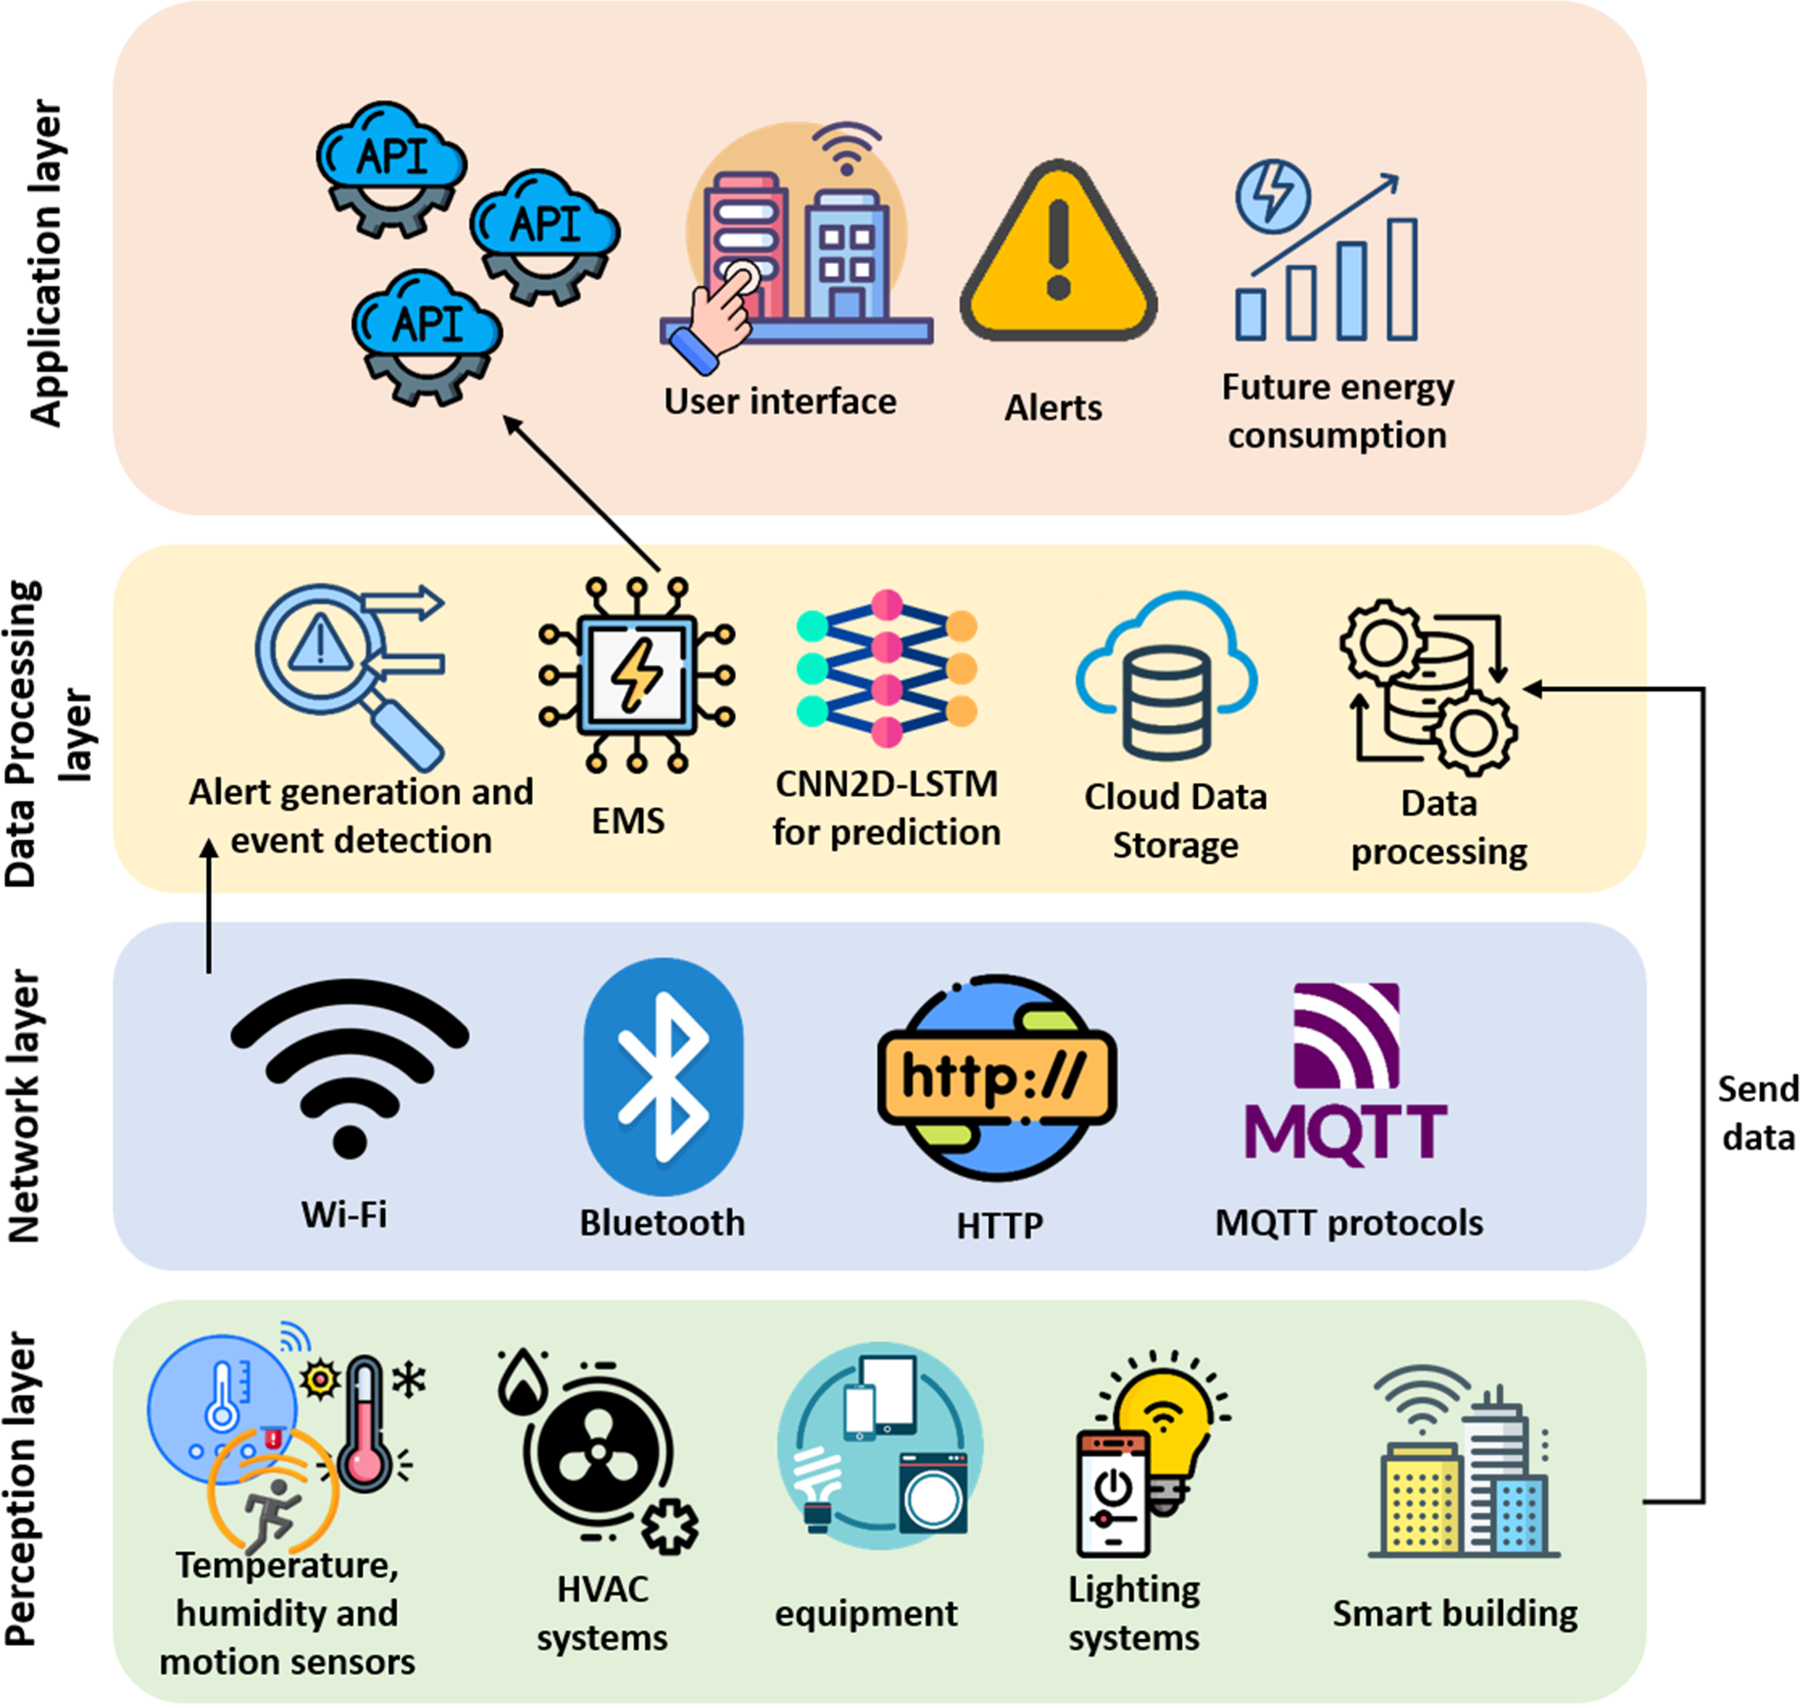
Multi-layer EMS architecture.
The perception layer (also called the physical layer) captures real-time data from the building environment. It includes environmental sensors (humidity, temperature, and motion), HVAC and lighting actuators, critical and non-critical equipment, and the structural layout of smart buildings. This layer monitors and transmits spatio-temporal data such as temperature, humidity, and energy usage consumption parameters, to higher layers.
The network layer supports wireless communication protocols such as Wi-Fi and Bluetooth, and leverages application communication protocol such as HTTP and MQTT, to ensure lightweight, secure, and efficient message exchange. It represents the communication relationship between the IoT devices, equipment and the EMS.
The data processing layer includes storage and intelligent components of the EMS. The cloud data storage component provides scalable and persistent storage of historical and real-time data. This layer applies prediction models like CNN2D-LSTM model to predict future energy consumption, and extract temporal and spatial patterns. In this layer, the spatio-temporal reasoning, event detection, and alert generation, are effectively implemented.
The application layer represents the interface between the EMS and the user. It visualizes real-time and forecasted energy consumption by room, floor, or building, displays detected events (e.g., heatwave, outage), and issues alerts to facility managers.
As already said, we adopt a hybrid deep learning model that combines Convolutional Neural Networks (CNN2D) and Long Short-Term Memory (LSTM) networks for energy consumption prediction. While LSTM models are known for their capacity to model temporal dependencies in sequential data, the addition of CNN layers allows the model to also capture spatial correlations between rooms and floors, which is particularly relevant in multi-room facilities. This model enables the network to jointly learn spatial features (such as room location and energy usage pattern distribution) and temporal dynamics (e.g., daily load profiles, occupancy evolution, HVAC cycles) of energy consumption, leading to more accurate and context-aware predictions.
Problem formulation
Energy consumption in smart buildings evolves over time and exhibits temporal dependencies influenced by seasonal patterns, occupancy behavior, equipment cycles, and contextual conditions.
Let:
Environmental features: indoor/outdoor temperature, humidity Operational features: occupancy, HVAC and lighting usage, medical equipment consumption (critical and non-critical equipment) Contextual features: hour of day, day of week, weekend, night, event indicators (e.g., heatwave, pandemic, breakdown) Temporal dependencies: lagged values of the global energy consumption
To capture both temporal and spatial dependencies, we define a sliding window of length
The proposed architecture consists of the following components:
Input layer: A spatio-temporal tensor of shape Spatial encoding (applied TimeDistributed across time steps): Two CNN2D blocks where each block consists of Conv2D with 16 filters: Applies 2D convolution to each spatial frame independently to extract spatial features, such as localized consumption patterns, or room location and orientation. BatchNormalization & MaxPooling2D: Used to stabilize training and reduce spatial dimensions. Conv2D with 24 filters BatchNormalization & MaxPooling2D GlobalAveragePooling2D: applied per time step. Temporal modeling: LSTM layer with 128 units, returning a sequence embedding. Dense Layers: Fully connected layers of sizes Output Layer: A single neuron predicting the next global energy consumption value at time t+1
A series of controlled experiments were conducted to systematically evaluate the impact of key hyper-parameters, including the number of convolutional filters, LSTM units, and dropout rate. Multiple configurations were tested, and their performance was assessed on a validation dataset. The final configuration was selected based on its ability to minimize prediction error while ensuring a good trade-off between model complexity and generalization.
Figure 3 illustrates the full architecture of the hybrid predictive model, showing the flow of information from the input spatial-temporal window to the prediction of the next building-wide energy value.
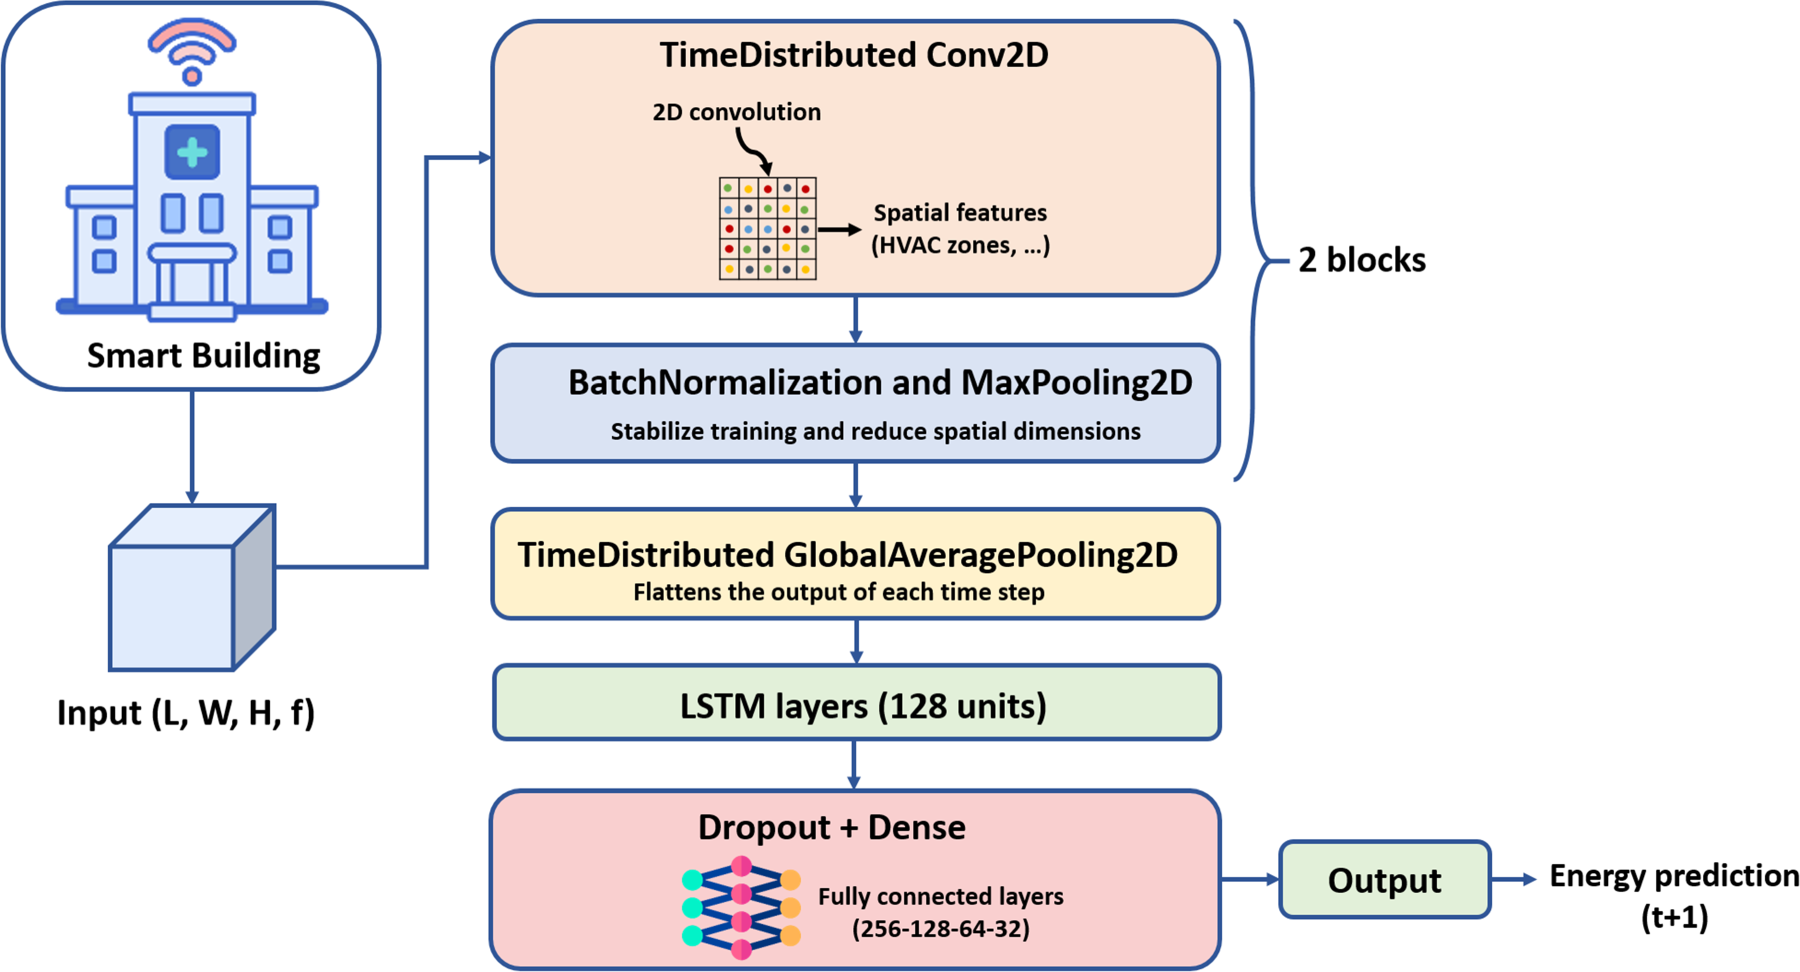
CNN2D
The spatial feature extraction process begins with the TimeDistributed Conv2D layer (top block in Figure 3), which applies 2D convolutions to each time step in order to capture spatial correlations between different zones of the building. The extracted features are then passed through a BatchNormalization and MaxPooling2D block, which stabilizes the training process and reduces spatial dimensions. Subsequently, a TimeDistributed GlobalAveragePooling2D layer is applied to flatten the spatial representations at each time step into compact feature vectors. These features are then fed into the LSTM layers (128 units), which model temporal dependencies across time. Finally, the learned temporal representations are processed through Dropout and fully connected Dense layers to produce the final energy consumption prediction.
Figure 4 illustrates the overall data processing and prediction pipeline of our framework. Room data, including spatial descriptors (location, orientation, area) and environmental variables (temperature, humidity, occupancy, energy use), are first preprocessed and mapped onto a 2D spatial grid. Sliding temporal windows are then constructed and passed through a CNN block to extract spatial correlations among neighboring rooms, followed by an LSTM block to capture temporal dependencies, to finally obtain the final prediction of energy consumption. These forecasts provide actionable inputs to the EMS, supporting proactive decision-making and operational efficiency in smart buildings.
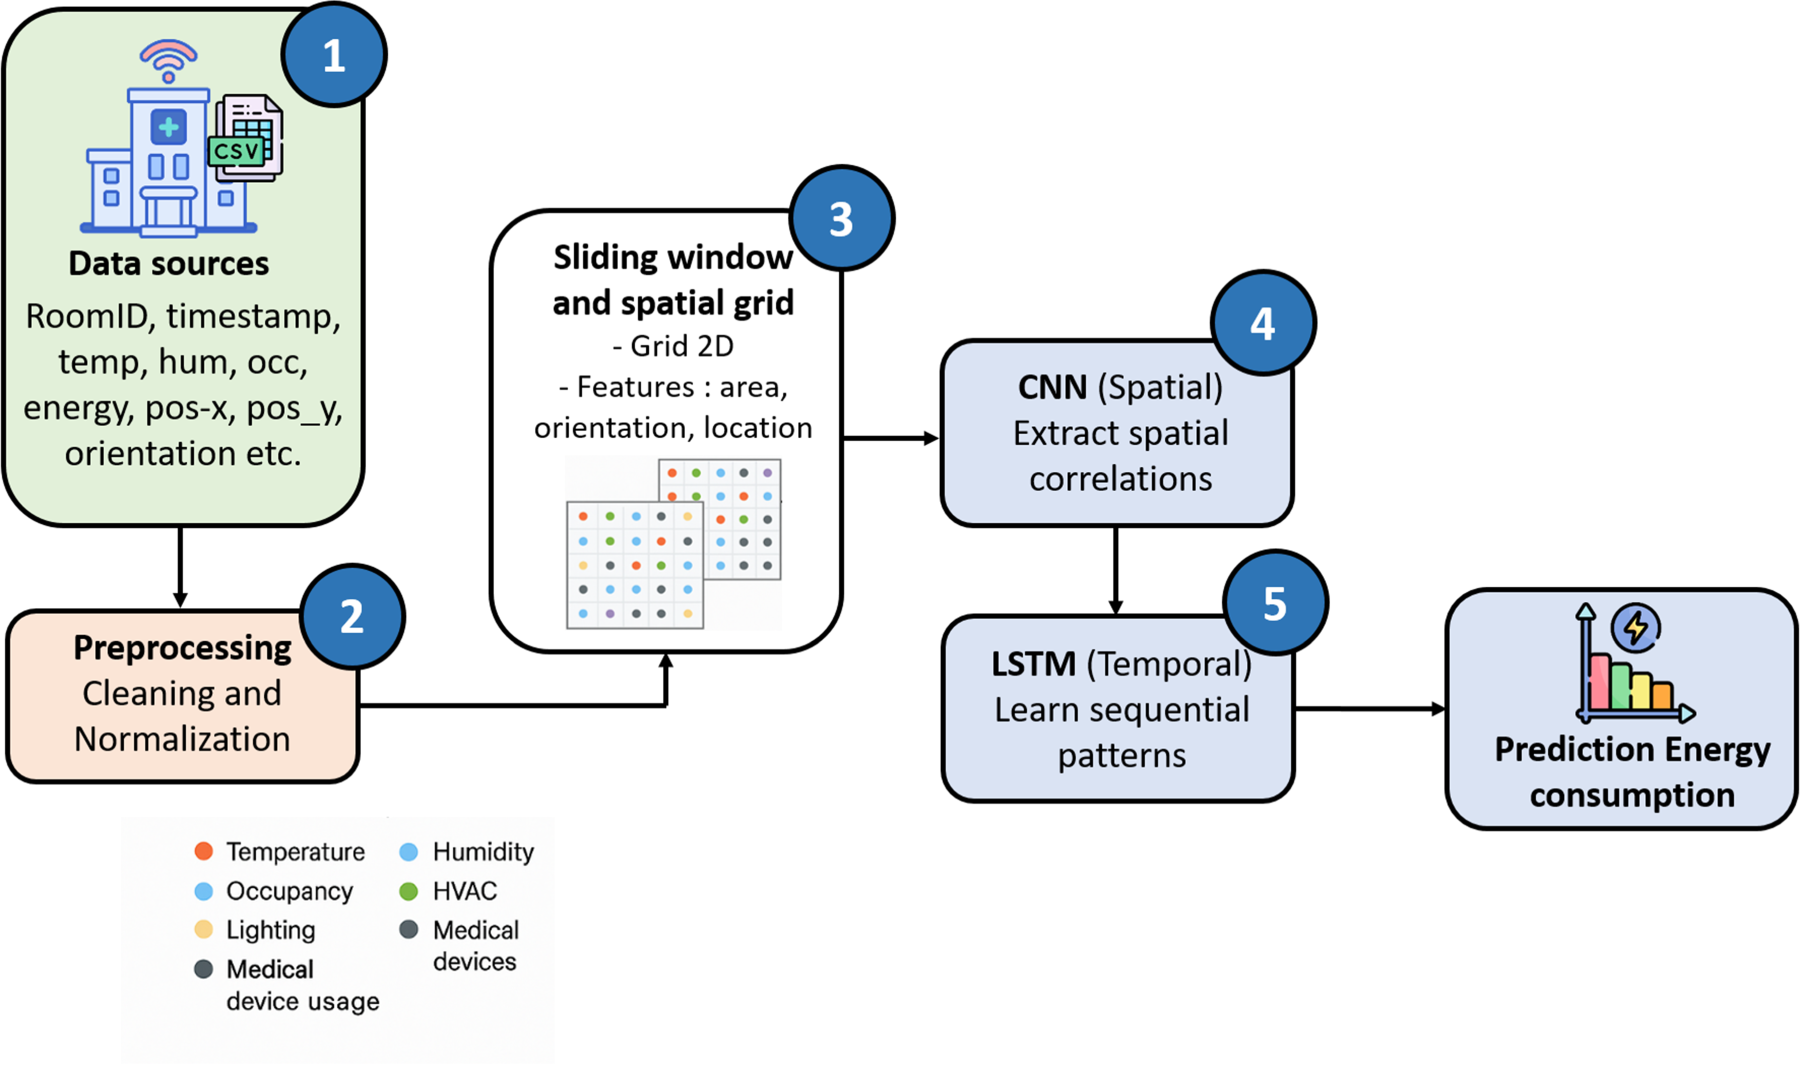
Functional schema of the prediction process.
Smart hospital represents one of the most complex and energy-intensive types of smart buildings. Studies reported that healthcare facilities consume on average 2.5 to 3 times more energy per square meter than office buildings. 32 Unlike residential or commercial facilities, hospitals operate continuously, host a wide variety of critical and non-critical medical equipment, and must maintain strict indoor environmental conditions for patient safety. This combination of heterogeneous energy loads, continuous operation, and event-driven variability like emergencies, pandemics and equipment failures, makes energy management particularly challenging. 33 Thus, modeling and forecasting the energy consumption of smart hospitals is essential not only to reduce operational costs, but also to maintain a high quality of service and promote environmental sustainability in a field where reliability is essential.
Specialization of concepts to a smart-hospital
Based on the metamodel described in Section 4 (Figure 1), a smart hospital building preserves the same overall structure composed of ensemble of buildings, floors, rooms, equipment, and IoT devices, but specializes certain entities and relationships to reflect the specificities of the healthcare context, Table 2 summarizes these specifics.
Specialization of the metamodel to a smart-hospital.
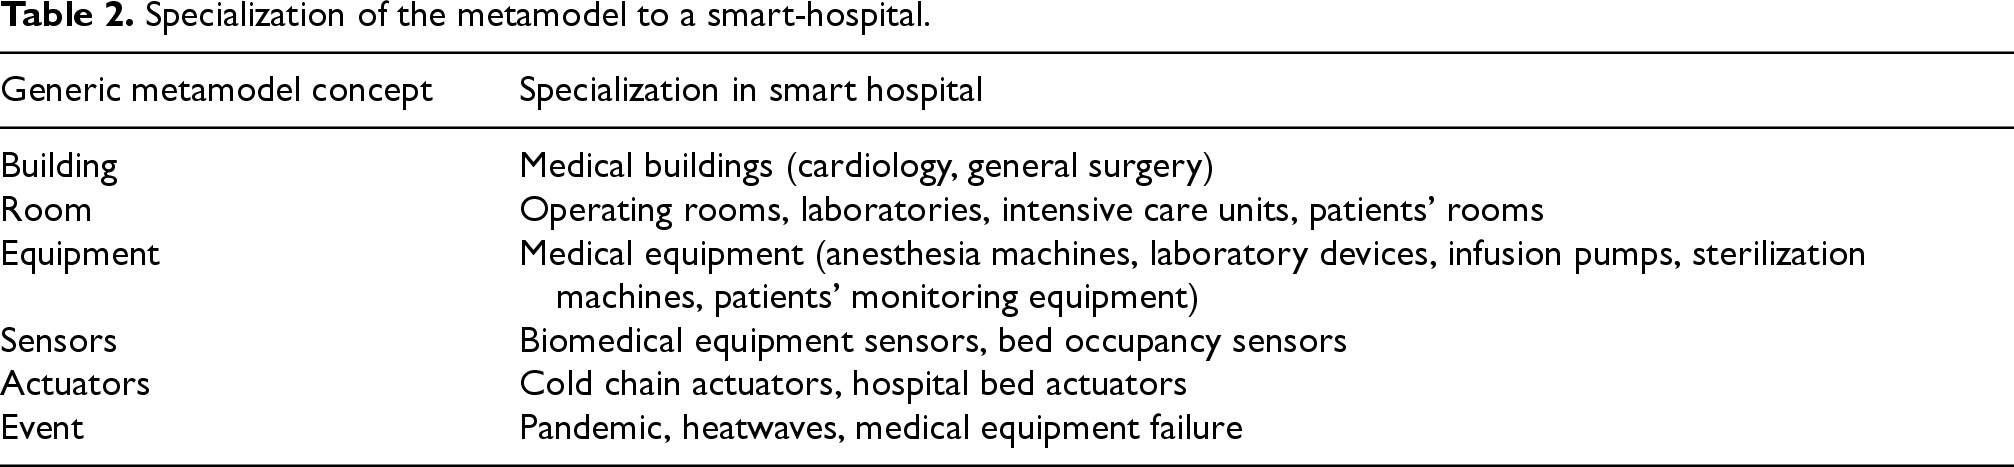
Specialization of the metamodel to a smart-hospital.
To evaluate the proposed model, we generated a dataset using a custom-built simulation model designed to replicate the energy consumption behavior of a smart hospital composed of five interconnected buildings: Cardiology, Periodontology, Pediatrics, General Surgery, and Dermatology. These buildings exhibit structural and functional diversity, with varying numbers of floors, rooms, and medical equipment. Table 3 presents the smart hospital infrastructure data, we considered.
Smart hospital infrastructure data.

Smart hospital infrastructure data.
Each building is equipped with a variety of critical and non-critical medical devices, lighting systems, HVAC units, elevators, and ambient sensors. The simulation spans a period of 60 days, with data collected at 6-hour intervals, resulting in detailed temporal granularity. Table 4 presents the dataset features.
Dataset features.
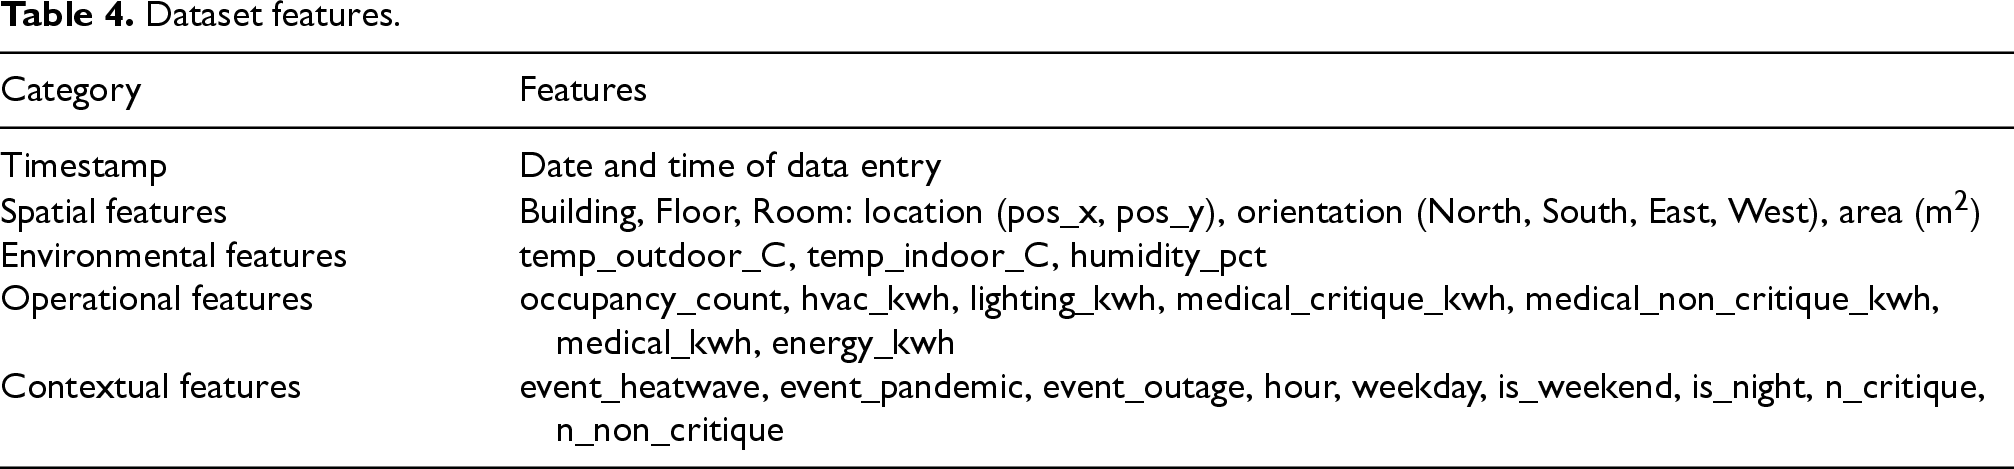
Note that medical_kwh is defined as the sum of critical and non-critical medical equipment energy consumption. And energy_kwh
Due to the limited availability of publicly accessible smart hospital datasets, a simulation-based approach was adopted. The simulation parameters were defined according to energy consumption patterns reported in previous studies on smart buildings and healthcare facilities. The generated ranges and operational scenarios were selected to approximate realistic hospital energy profiles described in the literature. To ensure realism, the dataset was generated under a set of physical, behavioral, and operational constraints described below:
Temporal Variations Rules
From 08:00 to 17:00, occupancy levels tend to be higher, resulting in lower lighting consumption due to daylight availability. During nighttime (e.g., 00:00 to 06:00), occupancy decreases and lighting consumption drops overall, except in critical zones like emergency rooms that remain illuminated for continuous operation. Room-Type Specific Energy Profiles Each room type in the hospital follows a distinct energy consumption profile reflecting its function and operational pattern. Patient rooms show stable consumption with occasional increases due to medical activity. Laboratories and surgical operation rooms exhibit high daytime peaks due to intensive medical activities and HVAC usage for sterilization. Waiting areas have high variability with strong dependence on daytime occupancy. Rest areas have minimal energy usage except for lighting during off-hours. Radiology rooms maintain a high and constant baseline consumption because of imaging equipment that must remain operational or in standby mode. Cross-feature Correlations: Increases in hvac_kwh are correlated with higher energy_kwh. Heatwave events (event_canicule) result in elevated indoor temperatures and consequently increased HVAC usage, which can also affect lighting and occupancy behavior due to discomfort. Environmental Value Ranges: temp_outdoor_C: 20–34 temp_indoor_C: 20–28 humidity_pct: 40%–60% in all cases. Operational Value Ranges: occupancy_count: 0–20 depending on room type, capped at 3 in consultation or resting rooms, up to 20 in waiting areas. hvac_kwh: 1.5–2.5 kWh in normal conditions, 2.5–4.0 kWh during heatwaves. lighting_kwh: 0–3.0 kWh depending on time and occupancy. medical_kwh: 1–20 kWh depending on equipment type and usage. energy_kwh: Computed as hvac_kwh + lighting_kwh + medical_kwh). Temporal and Event-driven Patterns: Realistic simulation of critical events such as heatwaves, pandemics, and power outages, which were introduced following pre-defined frequency patterns to simulate operational stress conditions. During weekends, increased public and patient activity leads to higher energy consumption, particularly in outpatient and emergency services.
The simulated dataset was designed to reproduce realistic energy consumption behaviors commonly observed in smart hospitals. The generated data integrates variations related to occupancy levels, temperature conditions, lighting systems, HVAC operation, and the use of medical equipment. In addition, the simulation reproduces daily fluctuations in energy demand, including daytime peaks caused by intensive equipment usage and reduced nighttime consumption. Critical hospital devices were also considered as continuously operating loads to better reflect real hospital environments. This synthetic dataset reflects the spatio-temporal, behavioral, and contextual dynamics observed in smart hospitals, providing a robust basis for evaluating energy prediction algorithms under diverse operational scenarios.
By integrating advanced machine learning algorithms into an intuitive platform, the system enables hospital managers, energy engineers, and facility operators to monitor and forecast energy consumption in real time. For framework development, we used Python to implement our predictive model, Firebase for data storage, and HTML, JavaScript, CSS3, and Express.js for the web application including the following key features: Interactive dashboards to visualize energy consumption by room, floor, or building over time (see Figure 5). Real-time alerts for unusual consumption, peak risks, or equipment anomalies. Scenario simulation tools to test and compare different energy management strategies (e.g., crisis mode vs. normal operation). Configuration interface to customize parameters such as thresholds of temperature, humidity, occupancy levels, etc.
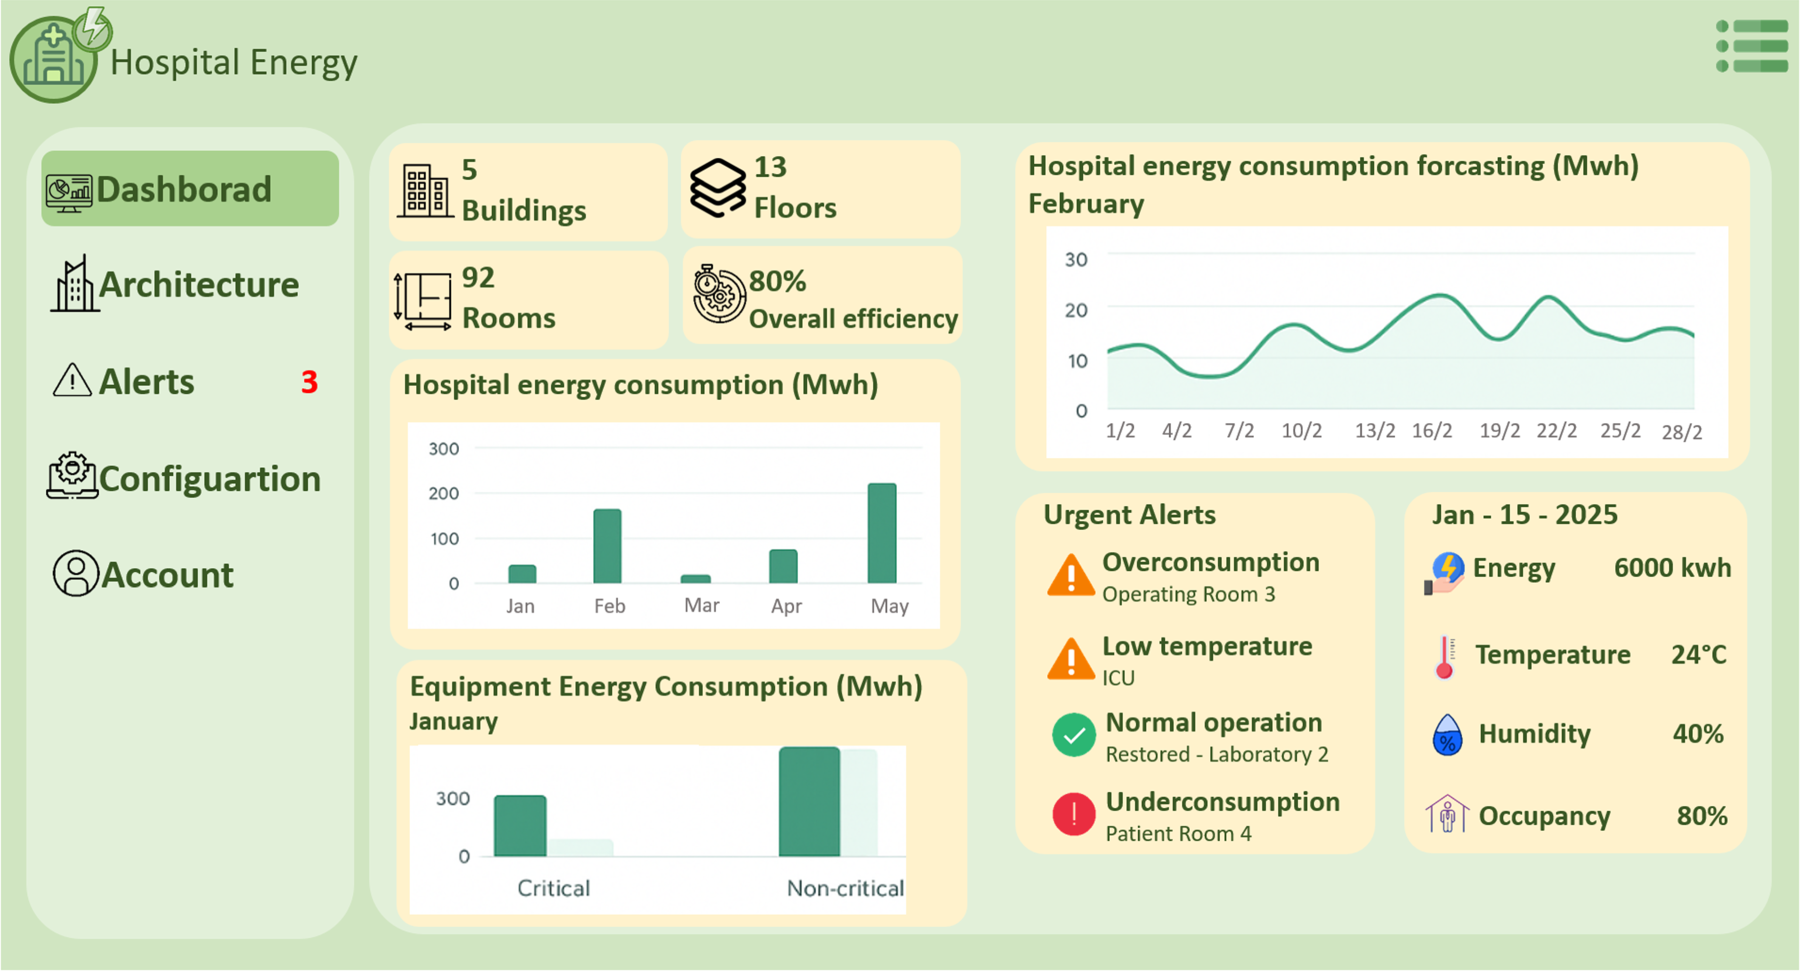
Energy consumption dashboard.
The application helps ensure the continuity of essential healthcare services by minimizing energy-related risks and inefficiencies for both critical and non-critical equipment. It also supports Green IoT principles by promoting sustainable energy management within the smart hospital, reducing unnecessary energy usage and preventing waste.
To evaluate the effectiveness of the proposed CNN2D–LSTM model, we defined several test scenarios based on the smart hospital dataset to capture different operational and environmental conditions. The experiments aim to assess four main aspects:
Baseline energy prediction accuracy: comparing the CNN2D–LSTM model with conventional approaches (LSTM, CNN, etc.), and against a reference model from the literature Somu et al.
27
and Zhiqian et al.
11
Normal Scenario: representing standard hospital operation during regular weekdays, with typical occupancy, temperature, and energy demand patterns. Under-Consumption Scenario: corresponding to periods of reduced activity, such as nighttime and weekends, where occupancy and energy usage significantly decrease. Heatwave Scenario: simulating a rise in outdoor temperature leading to increased cooling demand and HVAC system activity.
These scenarios collectively demonstrate how the CNN2D–LSTM framework captures both spatial and temporal dependencies, ensuring reliable energy prediction across varying hospital contexts.
The dataset was chronologically split into 70% training, 15% validation, and 15% test sets. Input features were normalized using Min-Max scaling fitted on the training set. Our model was trained with the following settings:
Optimizer: AdamW (fallback Adam), chosen for fast convergence and better regularization, reducing overfitting on time-dependent data. Loss function: Huber loss, to improve robustness against outliers and sudden consumption peaks. Batch size: 16, as a compromise between computational efficiency and model stability. Maximum epochs: 240, with early stopping (patience Evaluation metrics: RMSE, MAE, MAPE, and R
To evaluate the accuracy and robustness of our proposed model, we rely on four widely used regression metrics: Root Mean Squared Error (RMSE), Mean Absolute Error (MAE), Mean Absolute Percentage Error (MAPE), and R-squared (R
Prediction performance metrics.
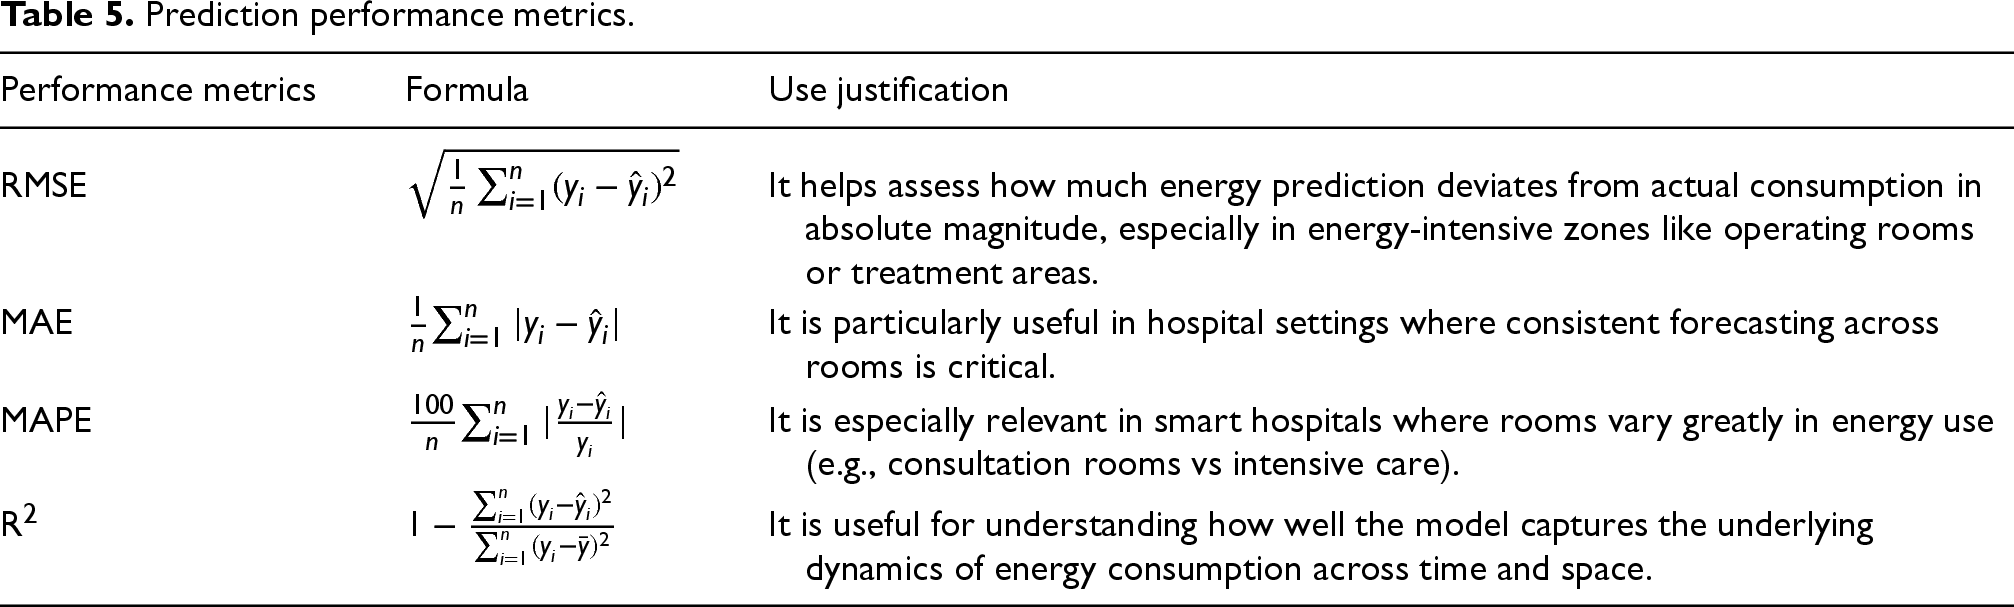
Prediction performance metrics.
Where
As already said, we compared the proposed CNN2D–LSTM model against six baseline prediction models widely used in energy forecasting and two works from literature using hybrid models Somu et al.
27
and Zhiqian et al.,
11
the models are: Artificial neural Network (ANN): a fully connected architecture used as a baseline without explicit spatial or temporal modeling. Recurrent Neural Network (RNN): designed to capture short-term temporal dependencies in sequential data. Convolutional Neural Network (CNN): implemented as a 1D temporal convolutional model to extract local temporal patterns. Long Short-Term Memory (LSTM): designed to model long-term temporal dependenciesin time-series data. Hybrid ANN–LSTM and RNN–LSTM: combining dense or recurrent feature extraction with temporal memory modeling. K-means, CNN, LSTM
27
: a hybrid clustering-based approach that combines data partitioning with deep learning models. CNN, LSTM
11
: a hybrid architecture combining convolutional layers for feature extraction and LSTM layers for temporal dependency modeling.
To ensure a fair comparison, all models were trained using the same simulated smart hospital dataset, identical preprocessing steps, and the same experimental conditions. Specifically, the same input features, data preprocessing steps, and training–testing splits were used across all methods. In addition, the number of training epochs and batch size were kept identical for all models. Hyper-parameters for each model were selected using a similar empirical tuning strategy to ensure a balanced and unbiased evaluation.
The comparative evaluation can also be interpreted as an ablation study, where the contribution of each component is progressively analyzed. The CNN model includes only convolutional layers applied to the input data to capture local patterns, without temporal modeling. The LSTM model processes the same input features as sequential data to capture temporal dependencies without spatial encoding. The proposed CNN2D–LSTM model combines both components by applying spatial feature extraction at each time step followed by temporal modeling, ensuring that performance differences are solely due to architectural variations rather than data discrepancies.
Several observations can be drawn from these results reported on Table 6: ANN achieves limited accuracy, as it ignores temporal dependencies inherent to energy consumption time series. CNN performs poorly (negative LSTM improves over ANN and CNN by modeling sequential dynamics, but its performance remains moderate ( RNN attains slightly explanatory power ( Hybrid models (ANN-LSTM, RNN-LSTM) yield inconsistent results; although they integrate memory, they lack explicit spatial encoding, resulting in only marginal improvements. The accuracy of Somu et al.
27
is lower than our CNN2D–LSTM accuracy, indicating that while clustering helps to reduce data variability, it does not fully address the intrinsic spatio-temporal complexity of hospital energy dynamics. The CNN–LSTM model
11
shows moderate performance ( Our proposed model CNN2D-LSTM clearly outperforms all baselines, with the lowest RMSE (1.61) and MAE (1.12), a competitive MAPE (9.31%), and the highest R
Performance of prediction models.
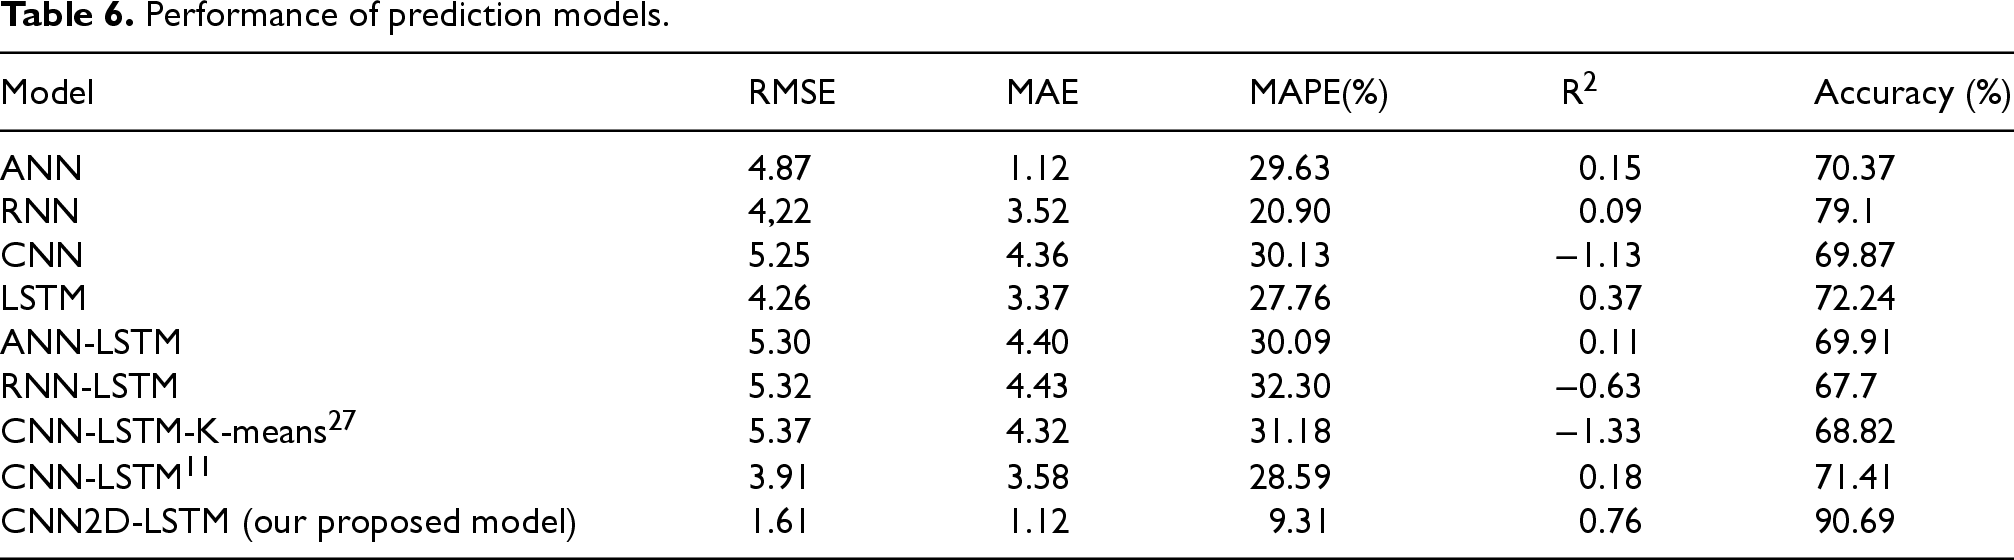
The results show that combining CNN2D and LSTM is particularly effective for hospital energy prediction; CNN layers extract localized spatial patterns, such as correlated HVAC zones or clusters of high-energy medical equipment, and LSTM layers capture long-term dependencies across time, including daily/weekly cycles and event-driven variations. So, their integration enables the model to generalize across heterogeneous rooms and equipment while preserving temporal coherence.
The objective of this comparison is to demonstrate the effectiveness of the proposed CNN2D–LSTM model in accurately predicting energy consumption, and highlight the ability of the proposed approach to better capture complex spatial–temporal dependencies, giving more realistic results then the two hybrid models used in Somu et al. 27 and Zhiqian et al. 11
Figure 6 presents a comparison between the real and predicted energy consumption values obtained using the proposed CNN2D + LSTM architecture. The x-axis represents the test samples over time, while the y-axis indicates energy consumption in kilowatt-hours (kWh). The blue curve corresponds to the real values, whereas the orange curve shows the model’s predictions.
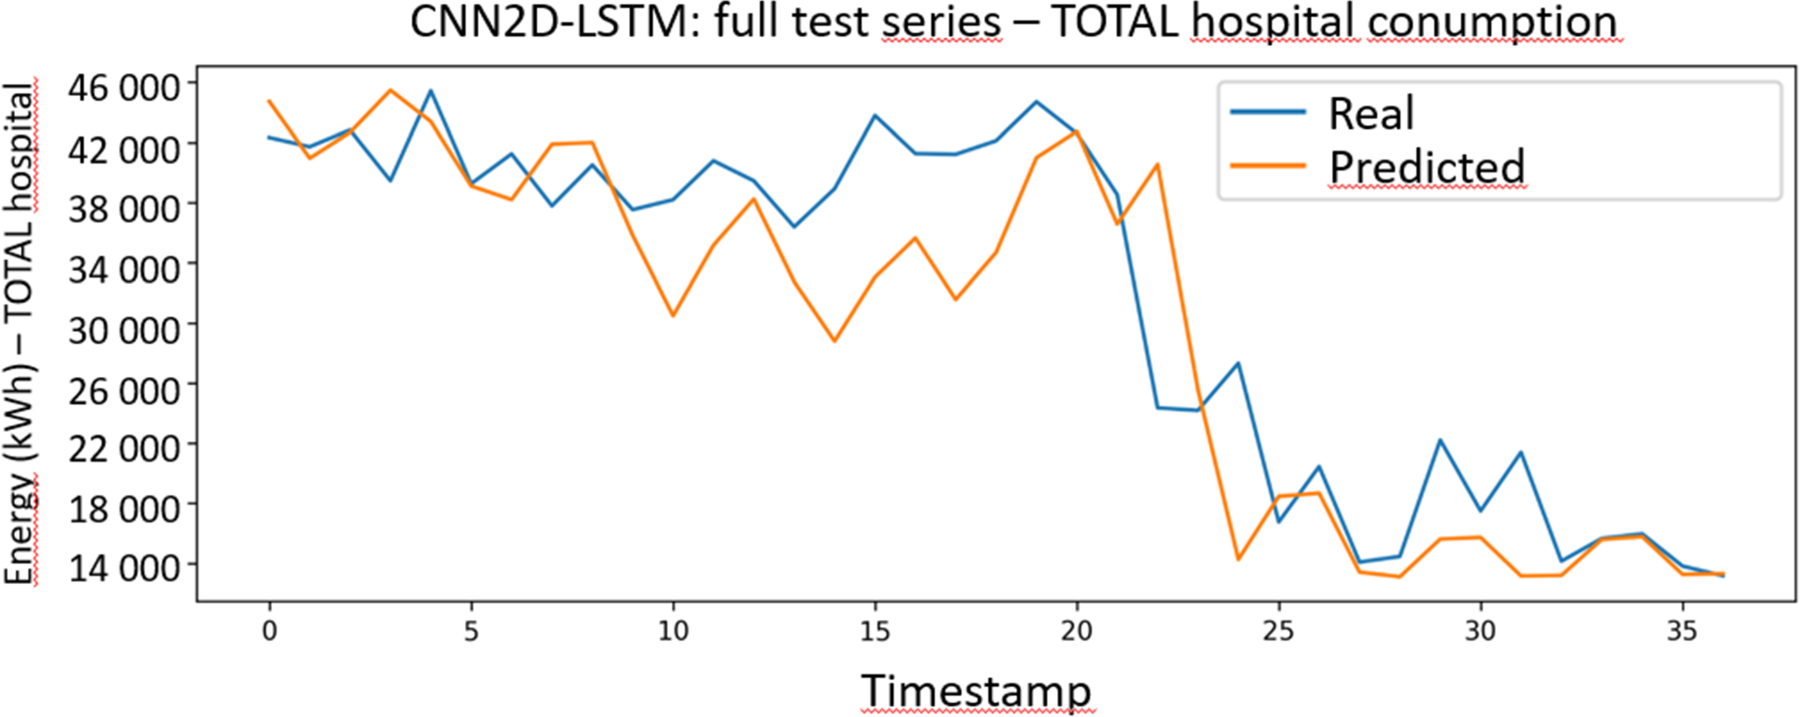
Real vs Predicted energy consumption using CNN2D
We can observe that the two curves lie in the same range and display peaks and troughs at the same periods, indicating good tracking of the cycles. Minor discrepancies are observed, particularly in peak and drop regions, where the model tends to slightly overestimate or underestimate consumption due to its smoothing effect. Nevertheless, the close proximity of the two curves confirms the model’s ability to jointly capture spatial and temporal dependencies in hospital energy dynamics. This demonstrates that the CNN2D–LSTM provides reliable forecasts of total energy demand, which is crucial for proactive energy management in smart hospitals. Figure 7 compares the real hospital energy consumption with the predictions obtained from our proposed CNN2D–LSTM model and from the model proposed in Somu et al. 27
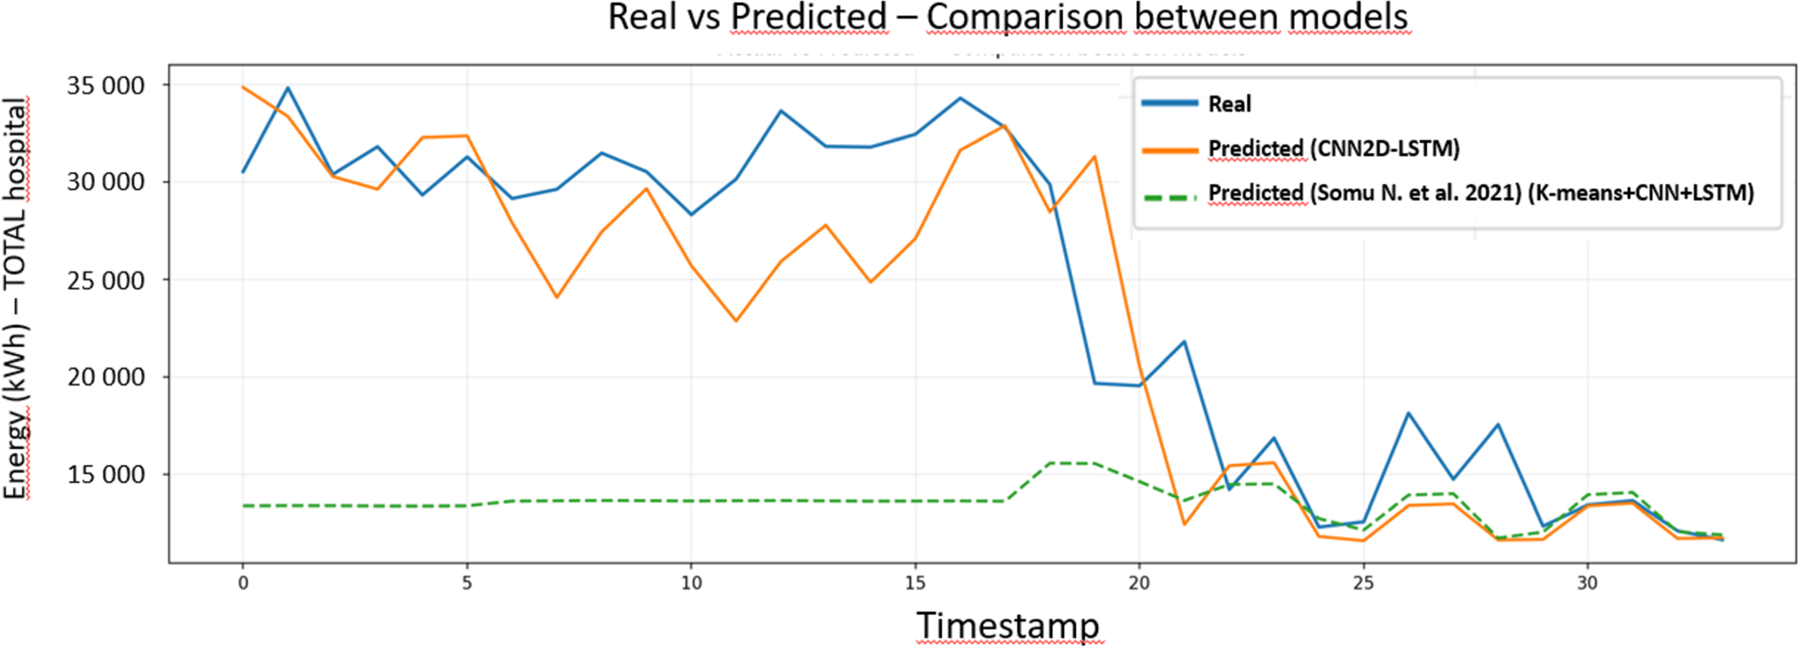
Real vs Predicted energy consumption - Comparison between CNN2D + LSTM and Somu et al. 27 work.
We observe that the predictions of Somu et al. 27 (green dotted curve) remain consistently below the real consumption, indicating a systematic underestimation of energy demand. In contrast, our model (orange curve) captures the overall dynamics more effectively, staying closer to the real curve throughout the test horizon and showing improved alignment in the final intervals. This demonstrates that while both models can follow the general trend, the spatial-temporal integration of our CNN2D-LSTM provides a more realistic approximation of hospital energy patterns. The gap between the curves highlights the limitations of clustering-based baselines when applied to complex environments with strong spatial heterogeneity, such as smart hospitals.
Toward the end of the observation period, the three curves (real, CNN2D–LSTM, and Somu et al. 27 ) appear almost superimposed. This convergence, however, mainly results from the higher predictive stability of our model, which consistently aligns with the real consumption values as the system reaches a steady state. In contrast, the model of Somu et al. 27 only approaches the real curve at this stage after having systematically underestimated energy demand throughout most of the horizon. This behavior confirms that our spatio-temporal modeling ensures both faster convergence and higher long-term accuracy, particularly when the energy dynamics stabilize.
In contrast, the method proposed by Somu et al. 27 tends to perform poorly during periods of high energy consumption, particularly in peak demand intervals. This behavior can be explained by its reliance on clustering-based preprocessing combined with deep learning models, which may smooth out extreme values and reduce sensitivity to sudden variations. As a result, the model struggles to accurately capture sharp increases in energy demand that are typically driven by complex and nonlinear interactions between occupancy, equipment usage, and environmental conditions. In high-consumption scenarios, such as heatwaves or intensive medical activity, energy patterns exhibit strong variability and nonlinearity. Models that do not explicitly integrate both spatial heterogeneity and temporal dependencies may fail to adapt to these rapid fluctuations. In contrast, the proposed CNN2D–LSTM model effectively captures these dynamics by combining spatial feature extraction with temporal sequence modeling, enabling more accurate prediction of peak consumption periods. Figure 8 compares the real hospital energy consumption with the predictions obtained from our proposed CNN2D-LSTM model and from the CNN–LSTM model inspired by Zhiqian et al. 11
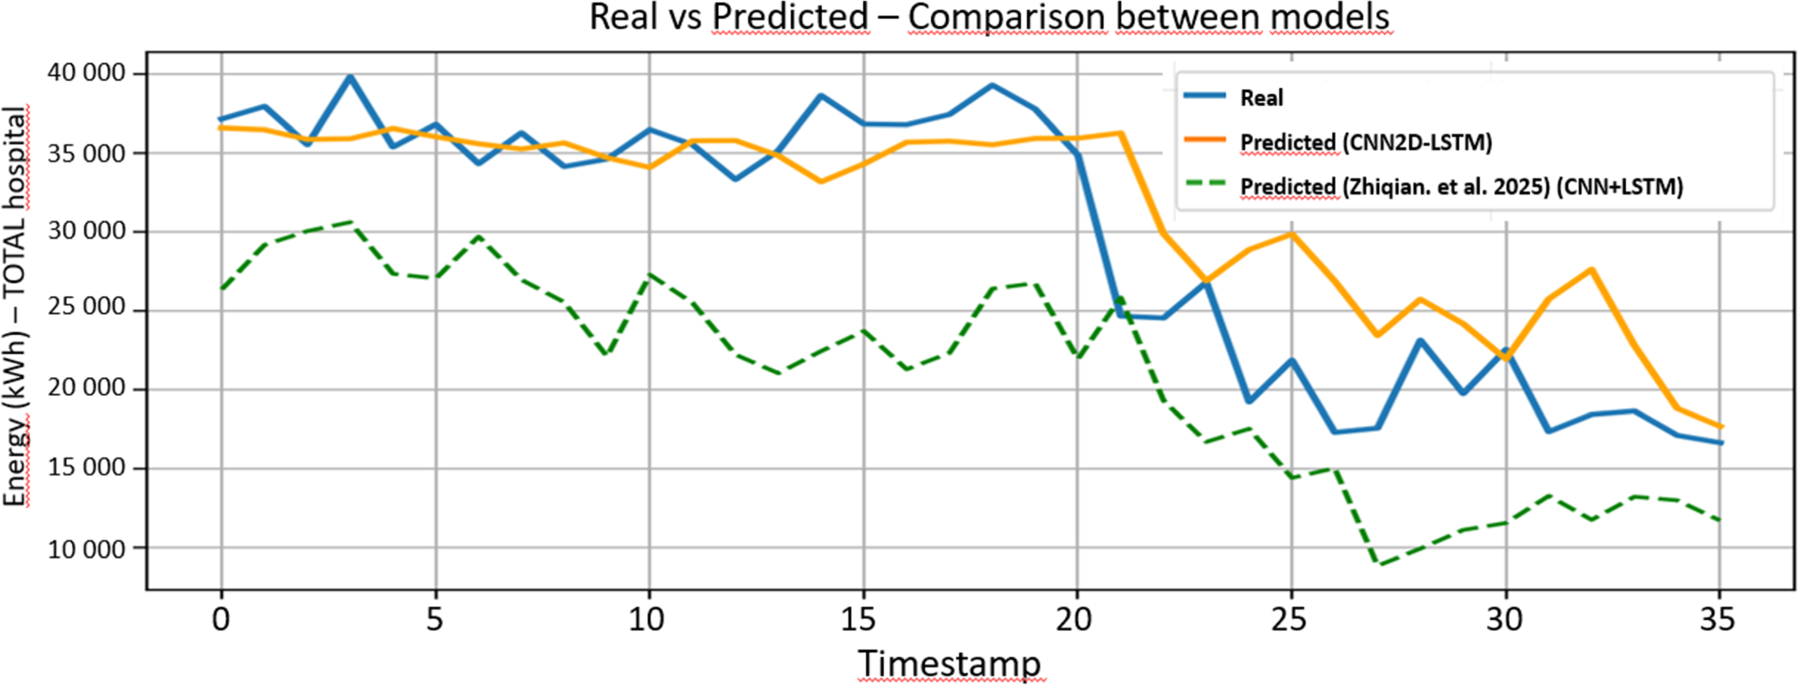
Real vs Predicted energy consumption - Comparison between CNN2D
We observe that the predictions of the CNN–LSTM model (green dashed curve) remain consistently below the real consumption values, indicating a systematic underestimation of energy demand throughout the test period. In contrast, our CNN2D–LSTM model (orange curve) more accurately follows the real consumption (blue curve), capturing both the overall trend and the temporal variations with higher fidelity. This demonstrates that while both models are able to learn temporal patterns, the integration of spatial information in the CNN2D–LSTM significantly improves prediction accuracy in complex environments such as smart hospitals.
The gap between the CNN–LSTM predictions and the real curve is particularly noticeable during periods of moderate to high energy consumption, where the model fails to capture the amplitude of variations. This limitation can be attributed to the use of 1D convolution, which processes features sequentially without preserving the spatial relationships between rooms and equipment. As a result, the model is unable to fully represent the heterogeneous distribution of energy consumption across different hospital zones.
Toward the end of the observation period, although the CNN–LSTM curve shows slight alignment with the decreasing trend, it still underestimates the actual consumption levels. In contrast, the CNN2D–LSTM model maintains closer proximity to the real values, reflecting better generalization and stability. This behavior confirms that incorporating spatial–temporal dependencies enables the model to better adapt to both gradual and abrupt changes in energy demand.
Furthermore, during periods of significant variation, the CNN–LSTM model exhibits reduced sensitivity to fluctuations, leading to smoother but less accurate predictions. This smoothing effect limits its ability to capture sudden changes driven by contextual events or operational dynamics. In contrast, the proposed CNN2D–LSTM model effectively captures these variations by combining spatial feature extraction with temporal modeling, resulting in more reliable predictions across different operating conditions.
We also compared the model performance across three operational scenarios: heat wave, under-consumption (night/weekend) and normal daily activity. Figure 9 present the comparison between real energy consumption and the predictions obtained from our model, in the three scenarios.
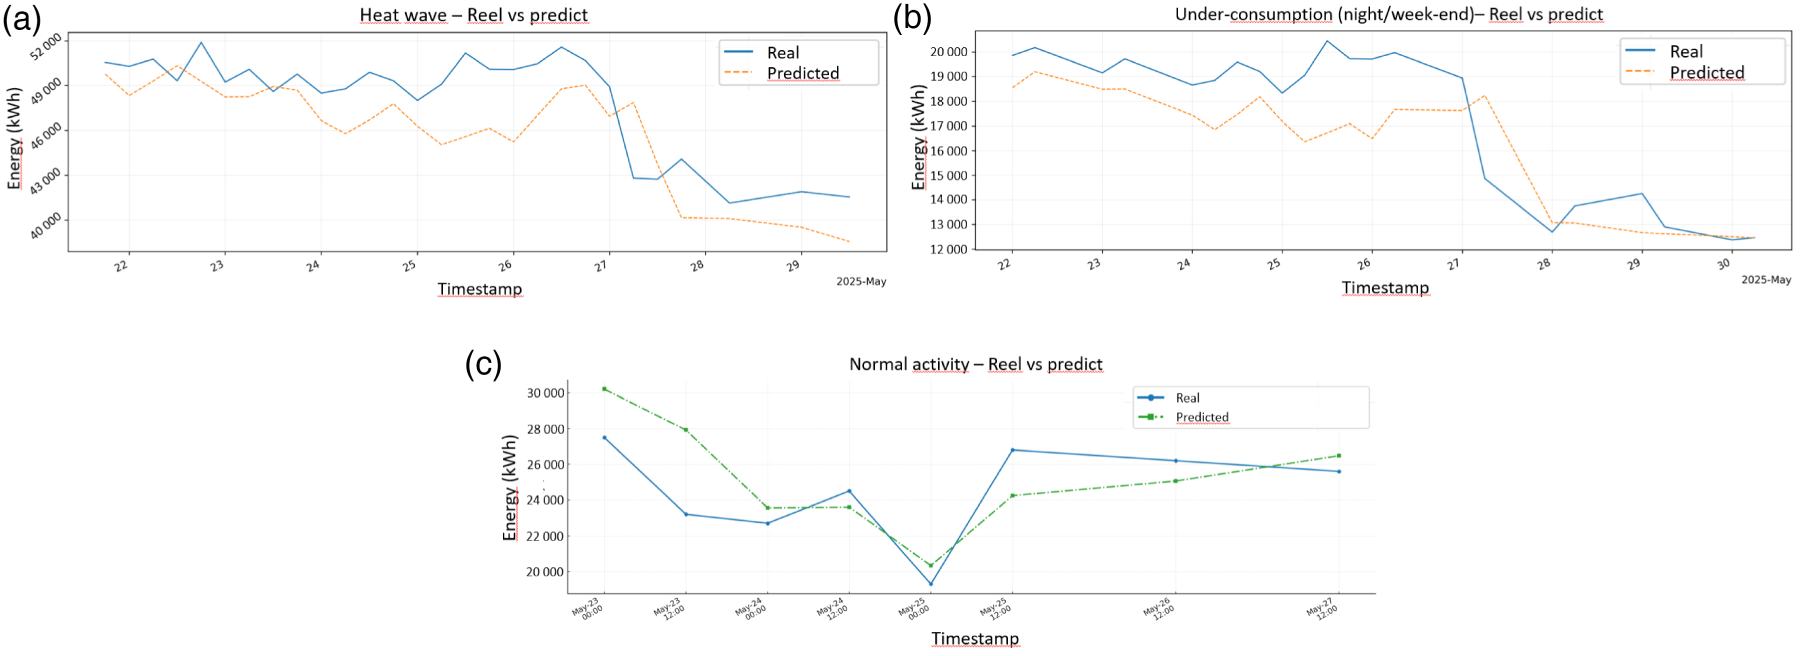
Real vs Predicted energy consumption - different scenarios. (a) Heat wave scenario, (b) under-consumption scenario, and (c) normal activity scenario.
Figure 9(a) shows the real vs. predicted time series during heat waves, we can see that the prediction clearly follows the general trend and consumption peaks, confirming that the model accurately captures the increase in demand during extreme conditions. Figure 9(b) shows under-consumption (night/weekend), we can see that the model maintains good stability at low activity levels, and the predicted values remain more or less close to the real values. Figure 9(c) presents the normal activity case (business day), it shows a good overall correspondence: the shape of the daily variations and the average levels are well reproduced, indicating that the model provides reliable predictions for daily operations.
Computational complexity. The proposed CNN2D–LSTM model introduces higher computational complexity compared to standalone models due to the integration of convolutional and recurrent layers. The training process was performed offline and required approximately 10–15 min on a standard machine (e.g., Intel i7 CPU with 8 GB RAM). However, once trained, the model achieves fast inference, with an average prediction time of approximately 10–20 ms per sample, making it suitable for real-time or near real-time deployment within an EMS. These results demonstrate that the proposed model remains computationally feasible and can be deployed in large-scale IoT-based smart building environments. For instance, the training time of Somu et al. 27 is approximately 21 min with a prediction time of 43 ms per sample. While Zhiqian et al. 11 achieved a much shorter training time of 32 s with a prediction time of 38 ms per sample, highlighting that the computational cost of deep learning models varies significantly depending on the architecture and implementation choices.
The work presented in this paper deals with forecasting energy consumption in smart buildings, by addressing a key gap in the literature related to the modeling of spatio-temporal dependencies in complex IoT-enabled environments, particularly in large-scale and heterogeneous smart buildings. Indeed, existing approaches often fail to jointly capture spatial interactions between zones and temporal evolution of energy consumption. Consequently, we proposed a spatio-temporal deep learning framework for predicting energy consumption in IoT-based enabled smart buildings. The framework integrates a conceptual support capturing the spatial hierarchy (building–floor–room–equipment) and temporal dynamics of IoT entities, a multi-layer system architecture linking perception, network, data processing, and application layers through an Energy Management System (EMS) capable of alert generation, thresholds configuration, and visualization, and a hybrid CNN2D–LSTM prediction model, that learns spatial correlations between zones and temporal dependencies in energy use, enabling accurate and adaptive forecasting.
Although the framework is generic and applicable to any building type, it was instantiated and validated through a smart hospital case study, chosen for its energy-intensive and operationally critical nature. Hospitals represent one of the most demanding building typologies, where continuous operation, medical equipment heterogeneity, and strict comfort constraints make energy management a particularly challenging task. Using realistic simulated datasets covering five blocks of hospital building, during a period of 60-days, we demonstrated that our approach consistently outperforms conventional models such as ANN, CNN, RNN, LSTM, etc., as well as recent hybrid models from the literature; CNN-LSTM-K-means
27
and CNN-LSTM.
11
The CNN2D–LSTM achieved high predictive accuracy (
Beyond quantitative performance, this work contributes to the realization of Green IoT principles by supporting sustainable and adaptive energy management. The conceptual EMS integrates alert mechanisms, dynamic thresholds, and dashboard functionalities that help managers reduce unnecessary consumption, detect anomalies early, and maintain comfort while minimizing environmental impact. The predictive capabilities of the CNN2D-LSTM framework thus enable proactive control of energy, fostering both operational efficiency and sustainability within healthcare infrastructures. Despite the promising results obtained by the proposed CNN2D-LSTM model, this study presents certain limitations. The dataset used in this work was generated through simulation and may not fully represent the complexity and variability of real smart hospital environments. Factors such as unexpected equipment failures, emergency situations, human behavioral variability, and real-time operational constraints remain difficult to reproduce accurately in simulated scenarios.
For future work, several research directions are envisaged:
Test the CNN2D–LSTM framework on real hospital datasets, including long-term monitoring data, to validate scalability and generalization, under real operational conditions. Extend the prediction framework to also incorporate other operational dimensions such as indoor air quality, comfort levels, and equipment reliability. Extend the framework towards real-time optimization and control of energy flows using bio-inspired algorithms such as the Slime Mould Algorithm to dynamically adjust system parameters based on predictive insights. Couple prediction with models of solar energy generation and battery storage to enable cleaner and more resilient energy ecosystems in hospitals. Model the behavior of energy resources in smart building systems, because it allows to simulate scenarios involving system failures or high demand, and thus to design robust strategies. By taking a systemic approach to energy resource behavior, we can reduce both costs and the carbon footprint, thus contributing to sustainability, with is part of Green IoT.
Overall, this study provides a robust, interpretable, and sustainable foundation for intelligent energy prediction and management in IoT-enabled buildings. By demonstrating the practical implementation of a Green IoT approach through the smart hospital case, it bridges the gap between conceptual modeling, deep learning prediction, and environmentally conscious energy optimization, paving the way for the modern self-adaptive and sustainable smart infrastructures.
Footnotes
Ethical approval
Not applicable.
Consent to participate
Not applicable.
Funding
The authors received no financial support for the research, authorship, and/or publication of this article.
Declaration of conflicting interests
The authors declared no potential conflicts of interest with respect to the research, authorship, and/or publication of this article.
