
Abstract
Keywords
Key Points
The relative stretching intensity was higher in the non-dancers, although absolute stretching intensity was comparable between ballet dancers and non-dancers.
Stretching-induced changes in passive flexibility properties were comparable between ballet dancers and non-dancers.
Stretching-induced changes in muscle strength were comparable between ballet dancers and non-dancers.
Introduction
Joint mobility is an important element in physical fitness for ballet dancers. 1 Ballet dancers conduct high-intensity stretching over extended periods to improve their joint range of motion (ROM). 2 Ballet dancers who have trained for more than 3 years have higher hip, knee, and ankle joint ROM than amateur ballet dancers who have trained for less than 1 year or non-dancers. 3 In addition, ballet dancers have different mechanical and neural factors related to flexibility, such as passive torque (PT), joint stiffness, and stretch tolerance, compared with non-dancers. 2
Previous studies have reported an increase in joint ROM following static stretching (SS).4 -11 The mechanism has been explained by changes in mechanical factors, such as decreased PT of submaximal angle and decreased stiffness, and neurological factors, such as increased stretch tolerance.7,12 However, ballet dancers have lower submaximal PT 2 and stiffness 2 and higher stretch tolerance than non-dancers 13 as a result of their adaptation to ballet training. Thus, in order for ballet dancers to increase their ROM, they must further decrease their initially low values of submaximal PT and stiffness and further increase their initially high values of stretch tolerance, compared to non-dancers. For instance, Moltubakk et al 2 showed that the passive torque at 0° of the ankle joint for ballet dancers was 12 ± 3 Nm, compared to 17 ± 3 Nm for non-dancers. On the other hand, 5 minutes of SS increased maximal dorsiflexion angle 5.1° ± 3° and decreased passive torque at 0° of ankle joint 0.7 Nm (change rate was 10%) in non-dancers. 14 To increase the maximal dorsiflexion angle, if the same amount (or percentage) of passive torque was to be reduced in both groups, a 5.8% (or 1.2 Nm) reduction in passive torque would be required in the ballet dancers and 4.1% (or 1.7 Nm) in the non-dancers. However, in practical terms, it would be difficult for a ballet dancer with a low initial value to make a larger percentage change than a non-dancer with a high initial value, or an absolute change of approximately the same magnitude. Instead, assuming that PT of submaximal angle, stiffness, and stretch tolerance have a maximum or minimum convergence point for physiological, mechanical, and morphological reasons, it is not easy to change the indicators of ballet dancers closer to the convergence point, and different amounts of change to stretching would be expected. Therefore, ballet dancers are less likely to experience a decrease in PT and stiffness and an increase in stretch tolerance, which could result in a smaller increase in joint ROM.
Differences in the effects of SS on individuals with varying flexibility levels are unclear. Pessali-Marques et al 13 reported that the increase in maximal knee extension angle was greater in ballet dancers than non-dancers after six 30-second SS on hamstrings. Another previous study reported that the rate of increase in maximal hip flexion angle was greater in team sports athletes than rhythmic gymnasts after six 30-second SS on hip extensors. 15 Thus, previous studies have shown inconsistent results regarding the differences in the effects of SS on individuals with different flexibility levels,13,15 making it unclear which group, the more flexible (such as ballet dancers and rhythmic gymnasts) or less flexible (such as non-dancers and team sports athletes), would show a greater change. Moreover, previous studies have primarily focused on measuring joint ROM and have not adequately examined the effects of mechanical factors or neurological factors.13,15,16
It is possible that the effect of SS on maximal muscle strength may also differ between ballet dancers and non-dancers. Muscular strength is one of the important components of physical fitness for ballet dancers. 1 However, immediately after SS, a decrease in maximal muscle strength17 -20 and the rate of force development 10 (RFD) has been reported. This reduction has been explained by decreased stiffness and reduced motor neuron excitability.10,17,18,21 -24 It has been reported that the stiffness of ballet dancers at common joint angle is less than half that of non-dancers. 2 Therefore, considering the trainability of stiffness to SS, one would expect that the decrease in stiffness to the same SS would be smaller for ballet dancers. Consequently, ballet dancers may experience a different effect of SS on maximal muscle strength reduction than non-dancers.
Therefore, this study aimed to determine the differences in the effects of SS on joint ROM, PT, stretch tolerance, stiffness, and muscle strength between the ballet dancer and control groups. We hypothesized that the effects of SS on these measures would differ between the ballet dancer and control groups, with the ballet dancer group showing fewer changes than the control group.
Methods
Participants
The number of participants required was calculated using the following parameters (power = 0.80, alpha = 0.05, and effect size = 0.46 [Calculated using data from ROM, which is one of the indicators for which we specifically want to compare group differences in this study and whose data are presented in a previous study by Donti et al 15 with an experimental design similar to that of this study]), and the results indicated that a minimum of 10 participants were required in each group (G*Power 3.1). The participants included 13 female ballet dancers and 13 female control participants (sedentary college students). Descriptive data are shown in Table 1. The participants were not undergoing treatment for cardiovascular, respiratory, or orthopedic diseases at the time of the experiment. In the control group, verbal confirmation that the participant was not exercising regularly. The participants were fully informed of the content of the study, and they provided written consent to participate. This study was conducted in accordance with the principles of the Declaration of Helsinki and was approved by the local ethics committee (Approval No. 21-06).
Physical description, morphometry, passive torque, and stretching intensity.
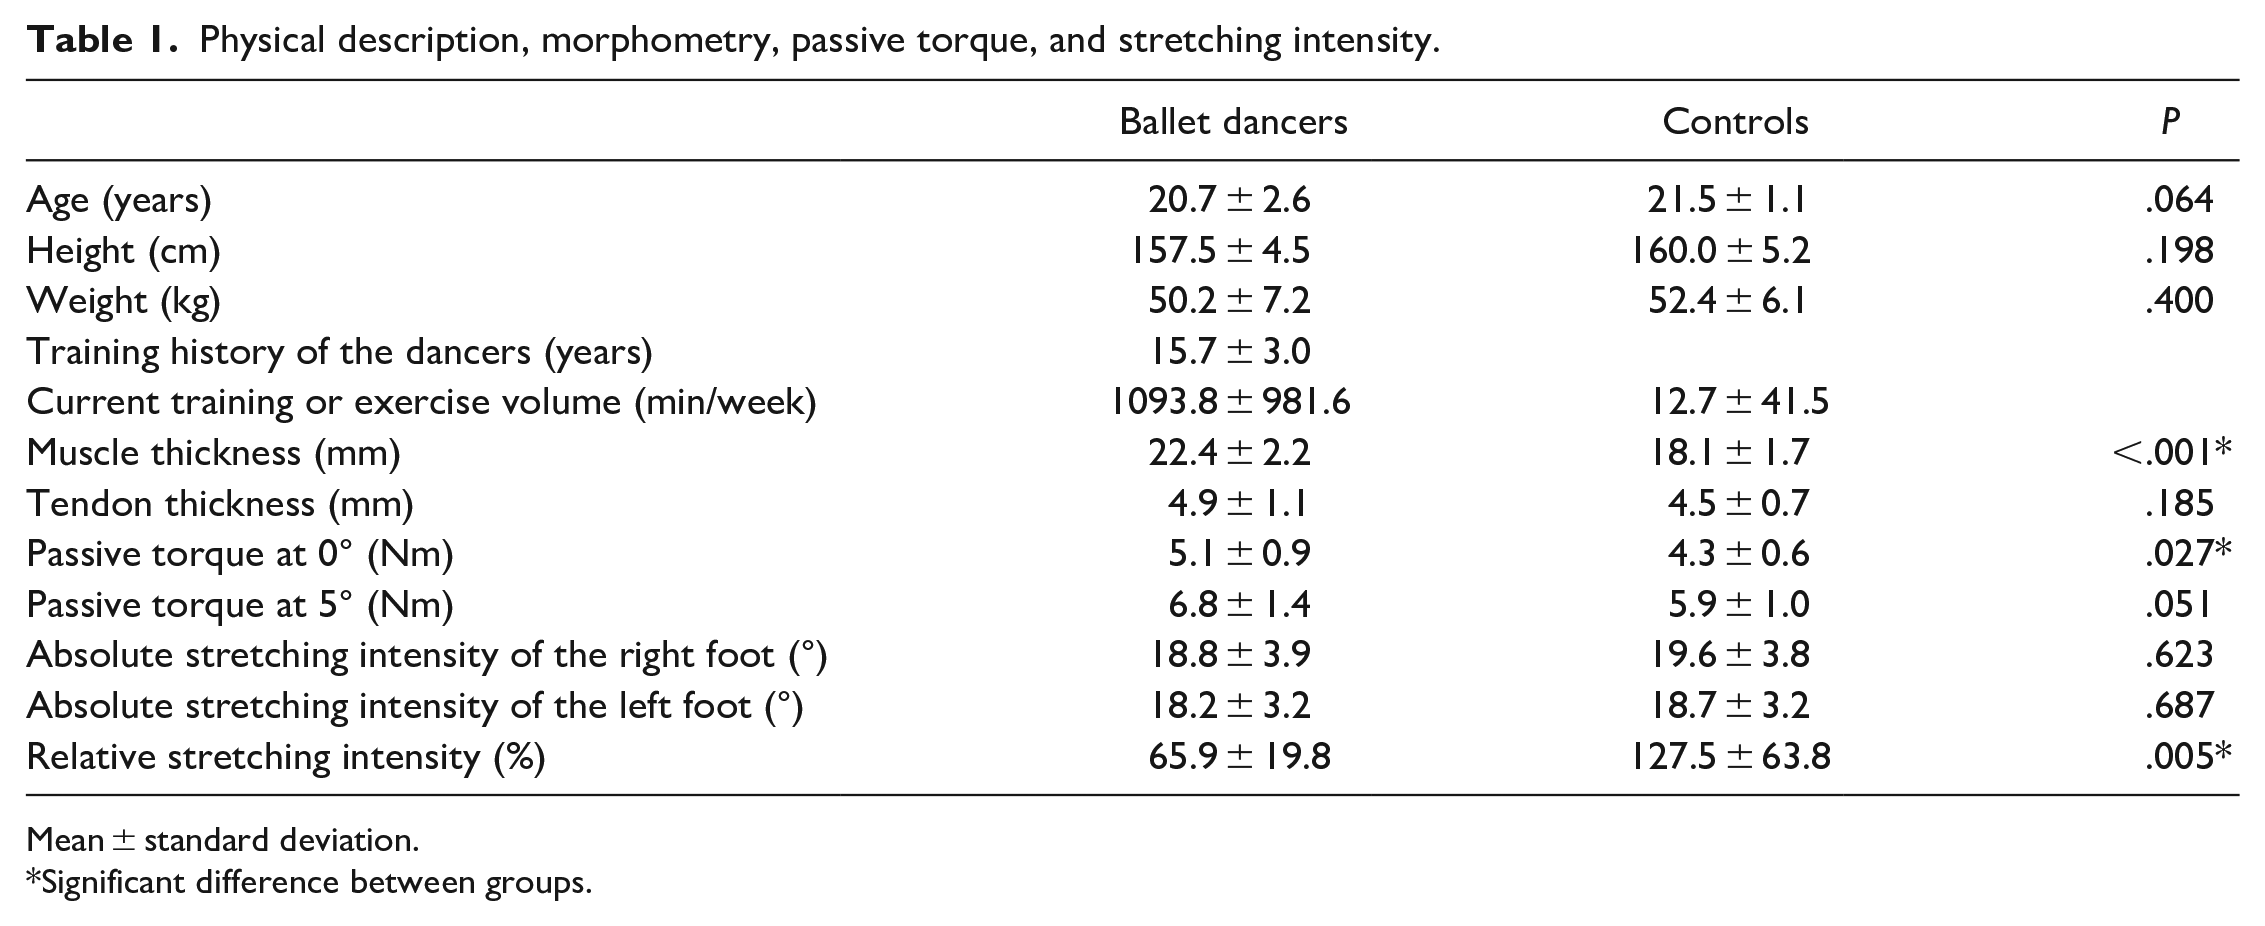
Mean ± standard deviation.
Significant difference between groups.
Study Design
Figure 1 shows the experimental flow. The measurement familiarization included practice with passive dorsiflexion flexibility and plantar flexion muscle strength measurements, and determination of stretch intensity in SS. Subsequently, the participants performed bicycle pedaling (50 W) for 5 minutes as a warm-up, and the morphology of the right lower limb was measured. Passive dorsiflexion flexibility measurements were obtained before and after 5 minutes of SS of the right lower leg. After a 15-minute rest period, ankle plantar flexion muscle strength was measured before and after 5 minutes of SS of the left lower leg.

Schematic representation of the study protocol.
Procedures
Morphometry
Muscle thickness of the medial gastrocnemius muscle (MG) and tendon thickness of the Achilles tendon were measured using an ultrasound imaging device (LOGIQ 5; GE Healthcare, CT, USA). MG thickness was measured by acquiring a long-axis image at the proximal 30% of the length of the lower leg (distance from the popliteal fossa to the lateral malleolus of the fibula). Achilles tendon thickness was measured by acquiring a short-axis image at the height of the lateral malleolus of the fibula. The muscle and tendon thicknesses were analyzed using the open-license software Kinovea (version 0.8.27).
Passive dorsiflexion flexibility measurement
The ankle joint angle, PT, and displacement of the muscle-tendon junction were measured during passive dorsiflexion of the right ankle joint using an isokinetic machine (S-15177, Takei Scientific Instruments, Niigata, Japan). The participants were instructed to relax during the measurements. Measurements were obtained with the knee joint in full extension and the right foot12,14 fixed to the footplate. The ankle joint was set at 0° when the footplate was vertical to the floor, and the rotation angle of the footplate was used as the ankle joint angle. In addition, the dorsiflexion angle was considered positive. The ankle joints of the participants were passively dorsiflexed by rotating the footplate at an angular velocity of 1° per second from 30° of plantar flexion. When the participants first experienced the onset of pain in the lower leg, they were instructed to press a button to stop the footplate rotation. The angle of the footplate at that time was used as the maximal dorsiflexion angle. 14 Passive dorsiflexion flexibility measurements were performed twice in pre- and post-stretching exercises. The measurement with the highest value of the maximal dorsiflexion angle was analyzed for the other measures described below and used in subsequent analyses.
PT during passive dorsiflexion was measured using an isokinetic machine (S-15177, Takei Scientific Instruments, Niigata, Japan) at 0° and 5° pre-stretching and submaximal and maximal dorsiflexion positions, pre-and post-stretching. PT in the submaximal dorsiflexion position was evaluated every 4° during the final 13° (that is, at final 1°, 5°, 9°, and 13°) in pre-and post-stretching for each participant. A second-order regression curve was plotted using the values of the ankle dorsiflexion angle and PT at the 4 points during the final 13°. The slope of the tangent line at the final 1°, 5°, 9°, and 13° was determined as the stiffness. PT at the maximal dorsiflexion position was evaluated as stretch tolerance.
In addition, muscle-tendon junction displacement of the MG was measured using an ultrasound imaging device (LOGIQ5; GE Healthcare) during passive dorsiflexion flexibility measurement. The relative displacement between the reflective marker affixed to the skin and the muscle-tendon junction was measured, and the amount of change was calculated as the muscle displacement. Muscle displacement was measured as the amount of displacement from the final 1° to the final 5°, 9°, and 13° and at the maximal dorsiflexion position.
Electromyography (EMG)
Muscle activation during passive dorsiflexion in passive dorsiflexion flexibility measurement was measured using an EMG machine (DL-140; S&ME, Tokyo, Japan) to confirm that the subject was not contracting muscles during passive dorsiflexion. Disposable surface electrodes (F-150s; Nihon Kohden, Tokyo, Japan) were affixed to the MG and tibialis anterior muscle at 20 mm. The electrode location was the most prominent bulge of the MG and one-third of the distance from the tip of the fibula to the medial malleolus. 25 The EMG signals were transmitted to a digital data recorder at a sampling rate of 1.0 kHz and recorded at a 5 to 500 Hz bandwidth. The root mean square was calculated for the first 10° interval (Initial 10°) from the dorsiflexion starting position (−30°) in the passive dorsiflexion flexibility measurement and the last 5° interval (Last 5°) from an angle of 5° less than the maximal dorsiflexion position to the maximal dorsiflexion position. 14
Plantar flexion muscle strength measurement
The maximal isometric voluntary contraction strength was measured with the knee joint in full extension and the left foot fixed to the footplate (S-17199, Takei Scientific Instruments, Niigata, Japan). The participants were instructed to exert maximal plantar flexion force as quickly as possible using the left foot. The measurements were obtained twice, and the result with the highest maximal torque value was used in the subsequent analysis. The slope of the time-torque curve from the start of muscle exertion to each elapsed time (0-30 ms, 0-50 ms, 0-100 ms, and 0-200 ms) was calculated as the RFD. 26 The point at which the exerted muscle strength exceeded 2 SD at rest was used as the force onset point.
SS
Stretching was performed using a stretching board (ASAHI Corp., Gifu, Japan), using one lower leg for 1 minute per set, for 5 sets with a 30-second rest between sets. The duration of SS and number of sets were determined based on the methods of previous studies12,14 that reported increased ROM and decreased stiffness after SS for the plantar flexors. Rest periods were provided to allow time to adjust the stretching angles for each set. The stretching intensity was set at the angle at which the participant felt maximal stretch sensation in the lower leg without pain. The stretching intensity was checked with the participant between each rest period, and the angle of the stretching board was adjusted accordingly. The average angle of the 5 sets of stretching boards was used for subsequent analysis and defined as the absolute stretching intensity. In addition, the relative stretching intensity was defined as the absolute stretching intensity divided by the maximal dorsiflexion angle before the stretch. 27 The participants were instructed to maintain a straight body posture without bending their knees or hips during stretching. The examiner confirmed that there was no collapse of this posture during stretching.
Data reliability
Test-retest reliability was calculated using data from 2 measurements each for passive dorsiflexion flexibility measurement and plantar flexion muscle strength measurement. The intraclass correlation coefficient values for ankle ROM, passive torque at maximal dorsiflexion angle, and maximal plantar flexion torque were .987, .975, and .973, respectively. In addition, there were no significant differences between data from 2 measurements each for ankle ROM, passive torque at maximal dorsiflexion angle, and maximal plantar flexion torque.
Data analyses
The Shapiro–Wilk test was used to assess normal distribution. Age was analyzed using the Mann–Whitney U test. Height, weight, MG thickness, Achilles tendon thickness, absolute stretching intensity of the right and left feet, relative stretching intensity of the right foot, and PT at 0° and 5° of pre-stretching were analyzed using an unpaired t-test. The maximal dorsiflexion angle and maximal plantar flexion torque were analyzed using a 2-way analysis of variance (ANOVA) (group [ballet dancers vs controls] × time [pre- vs post-stretching]). Muscle displacement and PT during the final 13° and at the maximal dorsiflexed positions were analyzed using a 3-way ANOVA (group [ballet dancers vs controls] × time [pre- vs post-stretching] × angle [final 1° vs final 5° vs final 9° vs final 13° vs maximal dorsiflexed position]). Stiffness was analyzed using a 3-way ANOVA (group [ballet dancers vs controls] × time [pre- vs post-stretching] × angle [final 1° vs final 5° vs final 9° vs final 13°]. RFD was analyzed using a 3-way ANOVA (group [ballet dancers vs controls] × time [pre- vs post-stretching] × interval [0-30 ms vs 0-50 ms vs 0-100 ms vs 0-150 ms vs 0-200 ms]). The EMG of the MG and tibialis anterior muscles were analyzed using a 3-way ANOVA (group [ballet dancers vs. controls] × time [pre- vs post-stretching] × portion [Initial 10° vs Last 5°]). Follow-up analyses were performed using lower-order ANOVA and t-tests with Bonferroni correction. Statistical significance was set at P ≤ .05. All data are reported as means ± standard deviations. SPSS (version 22.0; SPSS, Inc., Chicago, IL, USA) was used to conduct statistical analyses.
Results
Physical Description
No significant differences were observed between the 2 groups in age (P = .064), height (P = .198), or weight (P = .400) (Table 1).
Morphometry
The muscle thickness of the MG was greater in the ballet dancers than in the controls (P < .001). However, no significant difference was observed in Achilles tendon thickness between the 2 groups (P = .185) (Table 1).
Absolute and Relative Stretching Intensity
No significant differences were observed between the absolute stretching intensities of the right (P = .623) and left (P = .687) feet for both groups. However, the controls had significantly greater relative stretching intensity than the ballet dancers (P = .005) (Table 1).
Maximal Dorsiflexion Angle
No significant 2-way interaction was observed (F (1, 24) = 1.342, P = .258); however, significant main effects for time (F (1, 24) = 20.849, P < .001) and group (F (1, 24) = 12.568, P = .002) were observed. Post-hoc testing revealed that the ballet dancers had a greater maximal dorsiflexion angle than the controls. Additionally, the maximal dorsiflexion angle increased after SS (Figure 2).
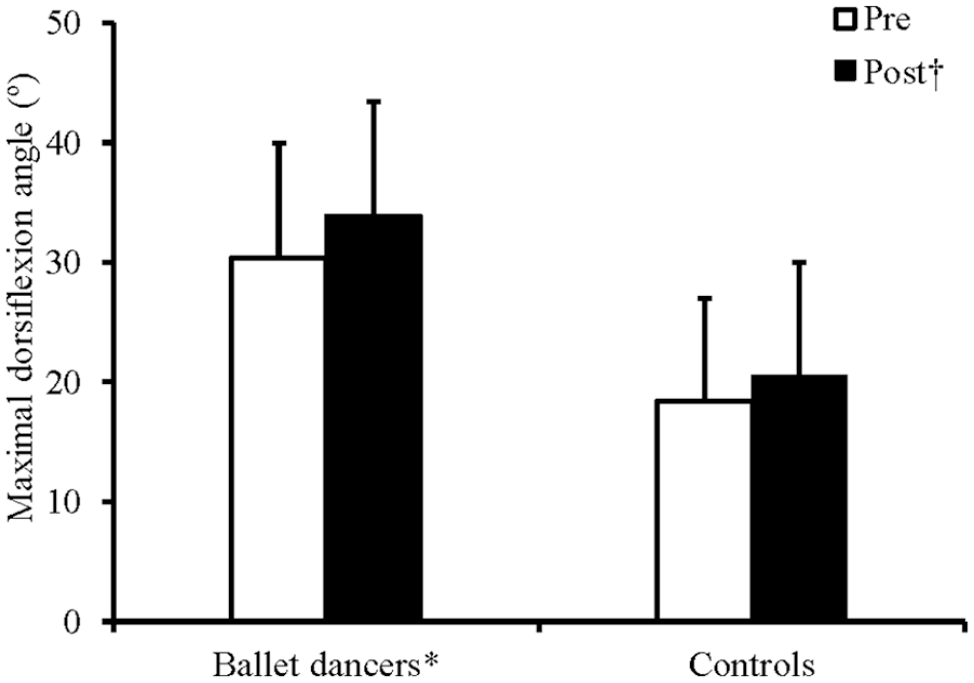
Changes in maximal dorsiflexion angle before and after static stretching in the ballet dancers and controls.
PT
Regarding PT at 0° and 5° during pre-stretch, ballet dancers had greater PT at 0° than the controls (P = .027). However, no significant difference was observed in PT at 5° (P = .051) (Table 1).
Regarding PT during the final 13° and maximal dorsiflexed positions, no significant 3-way interaction was observed (F (1.065, 25.565) = 2.262, P = .144), and no significant 2-way interaction was observed between time and group (F (1, 24) = 0.006, P = .941). However, significant 2-way interactions were observed between the angle and group (F (1.180, 28.321) = 12.295, P = .001) and time and angle (F (1.065, 25.565) = 10.737, P = .003). Post-hoc testing revealed that the ballet dancers had greater PT than the controls during the final 13° and at the maximal dorsiflexed position (final 1°: P = .005; final5°: P = .004; final9°: P = .002; final 13°: P = .002; maximal dorsiflexed position: P = .002). Additionally, the PT during the final 13° decreased (all P < .001), whereas the PT at the maximal dorsiflexed position increased after stretching (P = .044). PT increased with an increasing joint angle in both groups (all P < .05), except between the final 13° and maximal dorsiflexed position of the controls. Similarly, the PT increased with an increased joint angle before and after stretching (all P < .05), except between the final 13° and the maximal dorsiflexed position before stretching (Table 2).
Changes in passive torque (Nm) after static stretching in ballet dancers and controls.
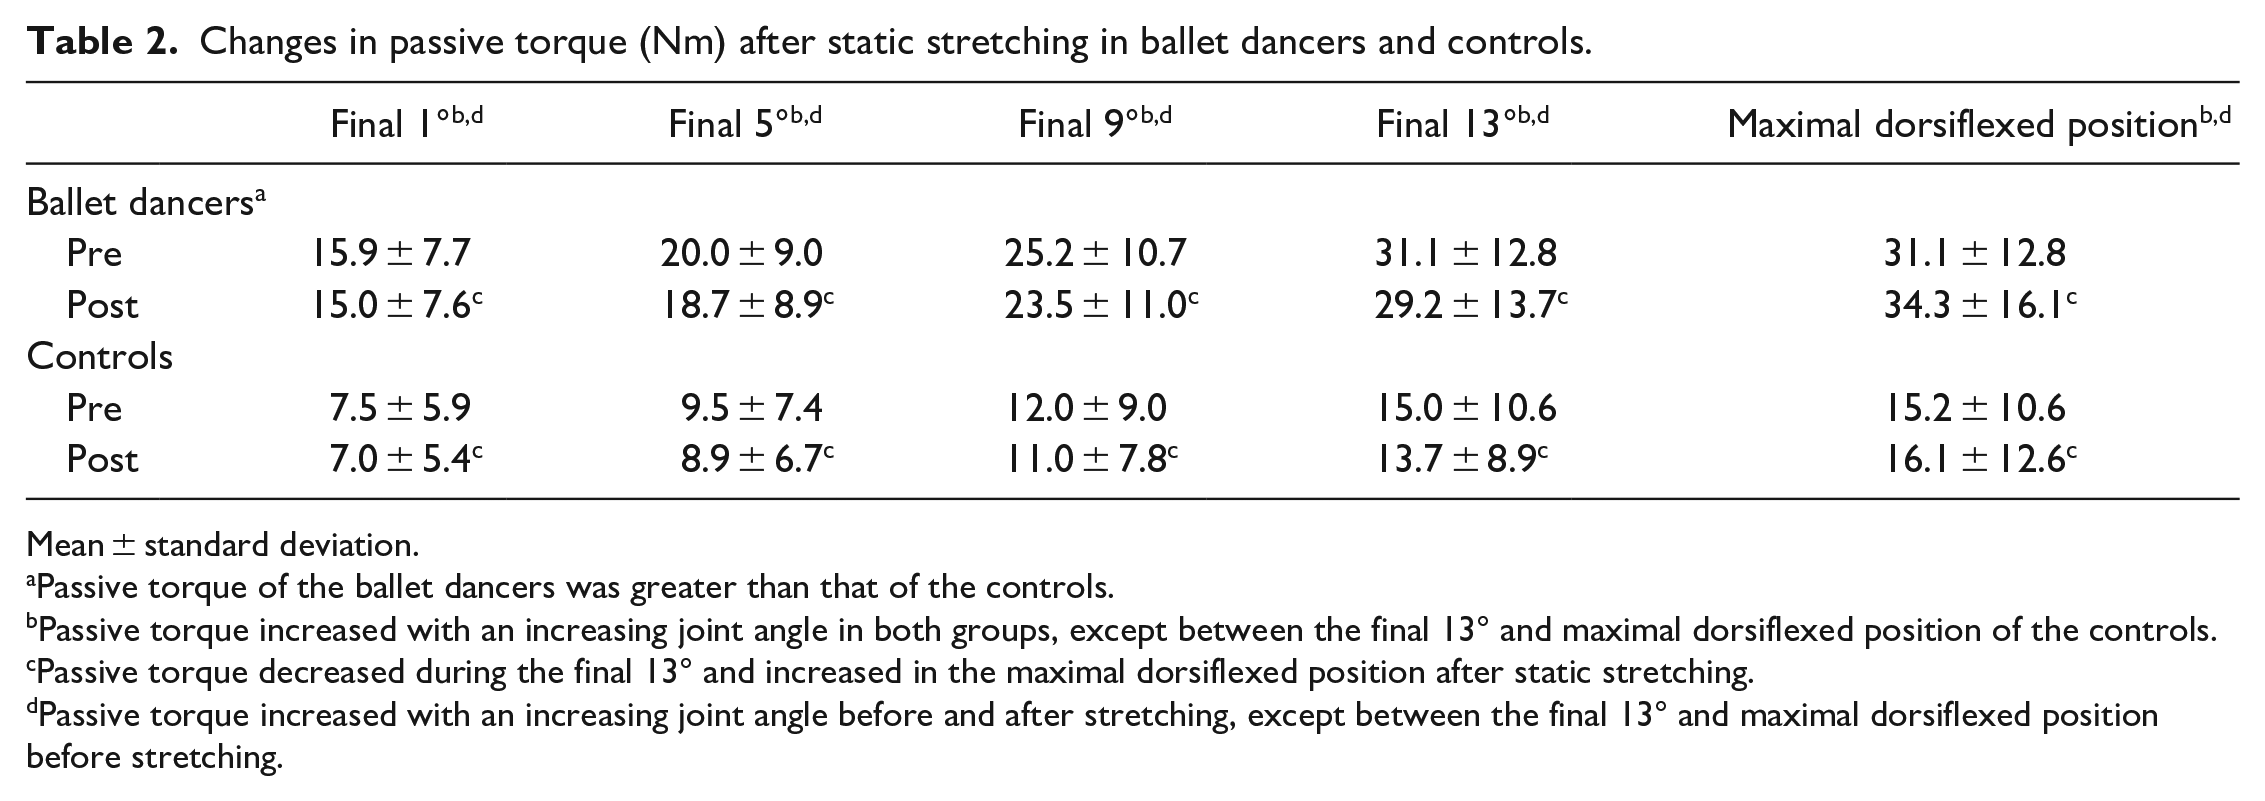
Mean ± standard deviation.
Passive torque of the ballet dancers was greater than that of the controls.
Passive torque increased with an increasing joint angle in both groups, except between the final 13° and maximal dorsiflexed position of the controls.
Passive torque decreased during the final 13° and increased in the maximal dorsiflexed position after static stretching.
Passive torque increased with an increasing joint angle before and after stretching, except between the final 13° and maximal dorsiflexed position before stretching.
Stiffness
No significant 3-way (F (1, 24) = 2.789, P = .108) and 2-way interactions were observed between time and group (F (1, 24) < 0.001, P = 1.000) and time and angle (F (1, 24) = 0.093, P = .763). However, a significant 2-way interaction was observed between the angles and groups (F (1, 24) = 14.662, P = .001). Post-hoc testing revealed that the ballet dancers experienced greater stiffness than the controls at all angles during the final 13° (final 1°: P = .004; final5°: P = .001; final9°: P = .001; final 13°: P < .001). In addition, stiffness increased with an increasing joint angle in both groups (all P < .05) (Table 3).
Changes in stiffness (Nm/°) after static stretching in ballet dancers and controls.
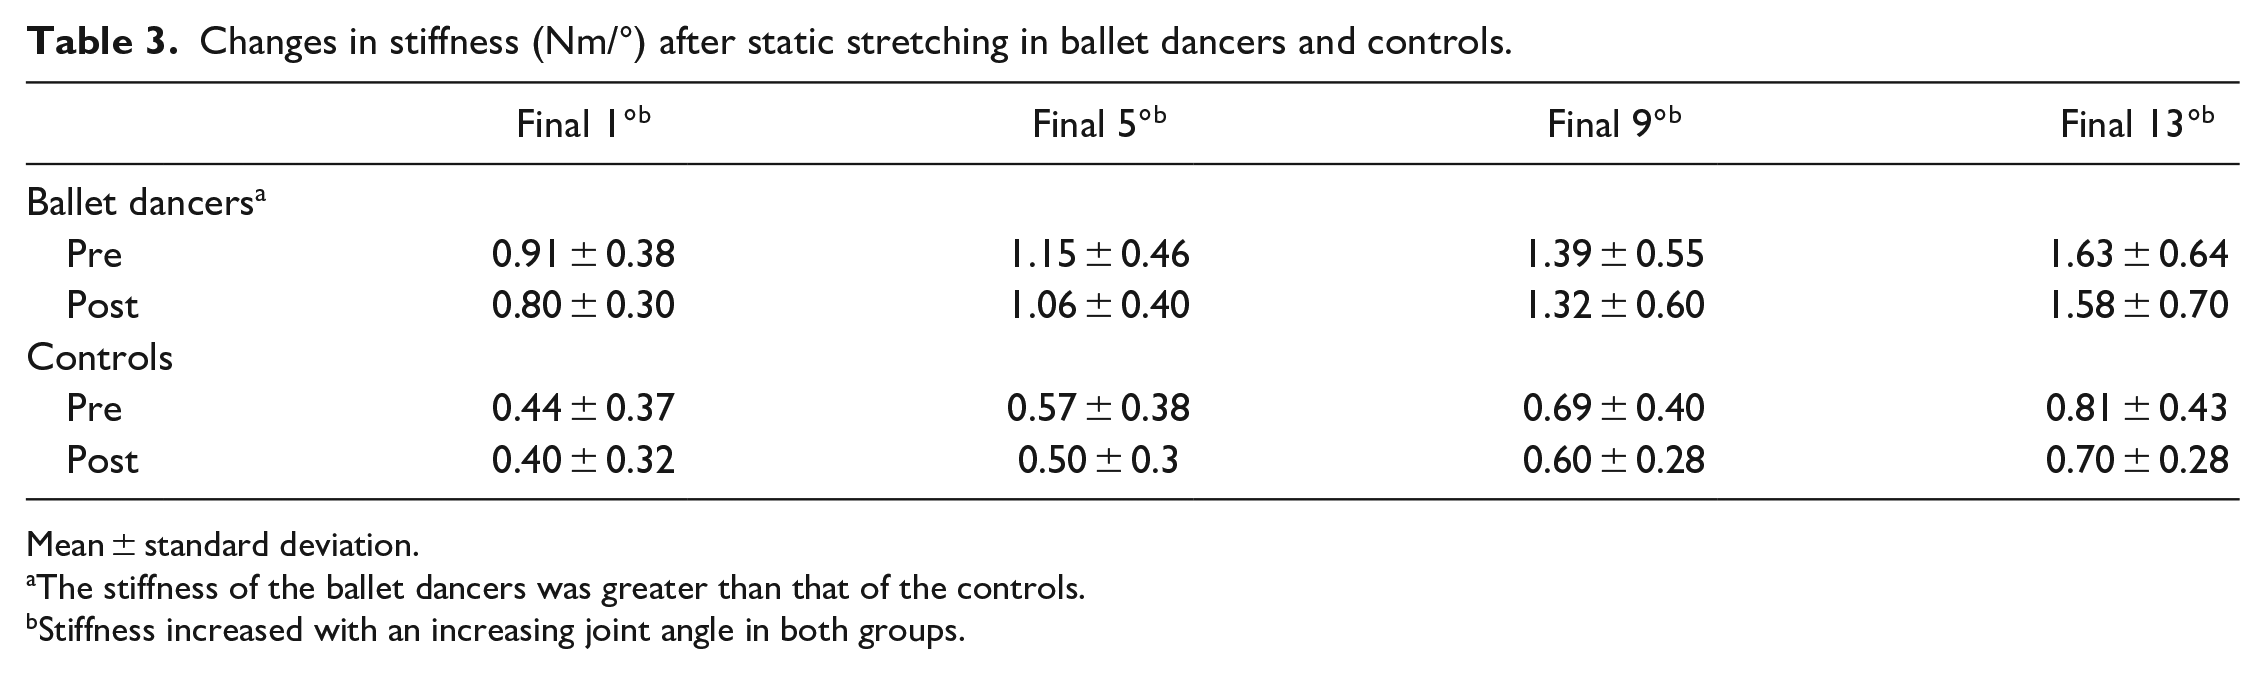
Mean ± standard deviation.
The stiffness of the ballet dancers was greater than that of the controls.
Stiffness increased with an increasing joint angle in both groups.
Muscle Displacement
No significant 3-way (F (2.557, 61.363) = 2.643, P = .066) and 2-way interactions were observed between time and group (F (1, 24) = 1.216, P = .281) and angle and group (F (1.570, 37.673) = 0.494, P = .569. However, a significant 2-way interaction was observed between time and angle (F (2.557, 61.363) = 10.635, P < .001)). Post-hoc testing revealed that muscle displacement increased after stretching in the maximal dorsiflexed position (P < .001). In addition, muscle displacement increased with increasing joint angle before and after stretching (all P < .001), except between the final 13° and the maximal dorsiflexed position before stretching (P = .931) (Table 4).
Changes in muscle displacement (mm) after static stretching in ballet dancers and controls.
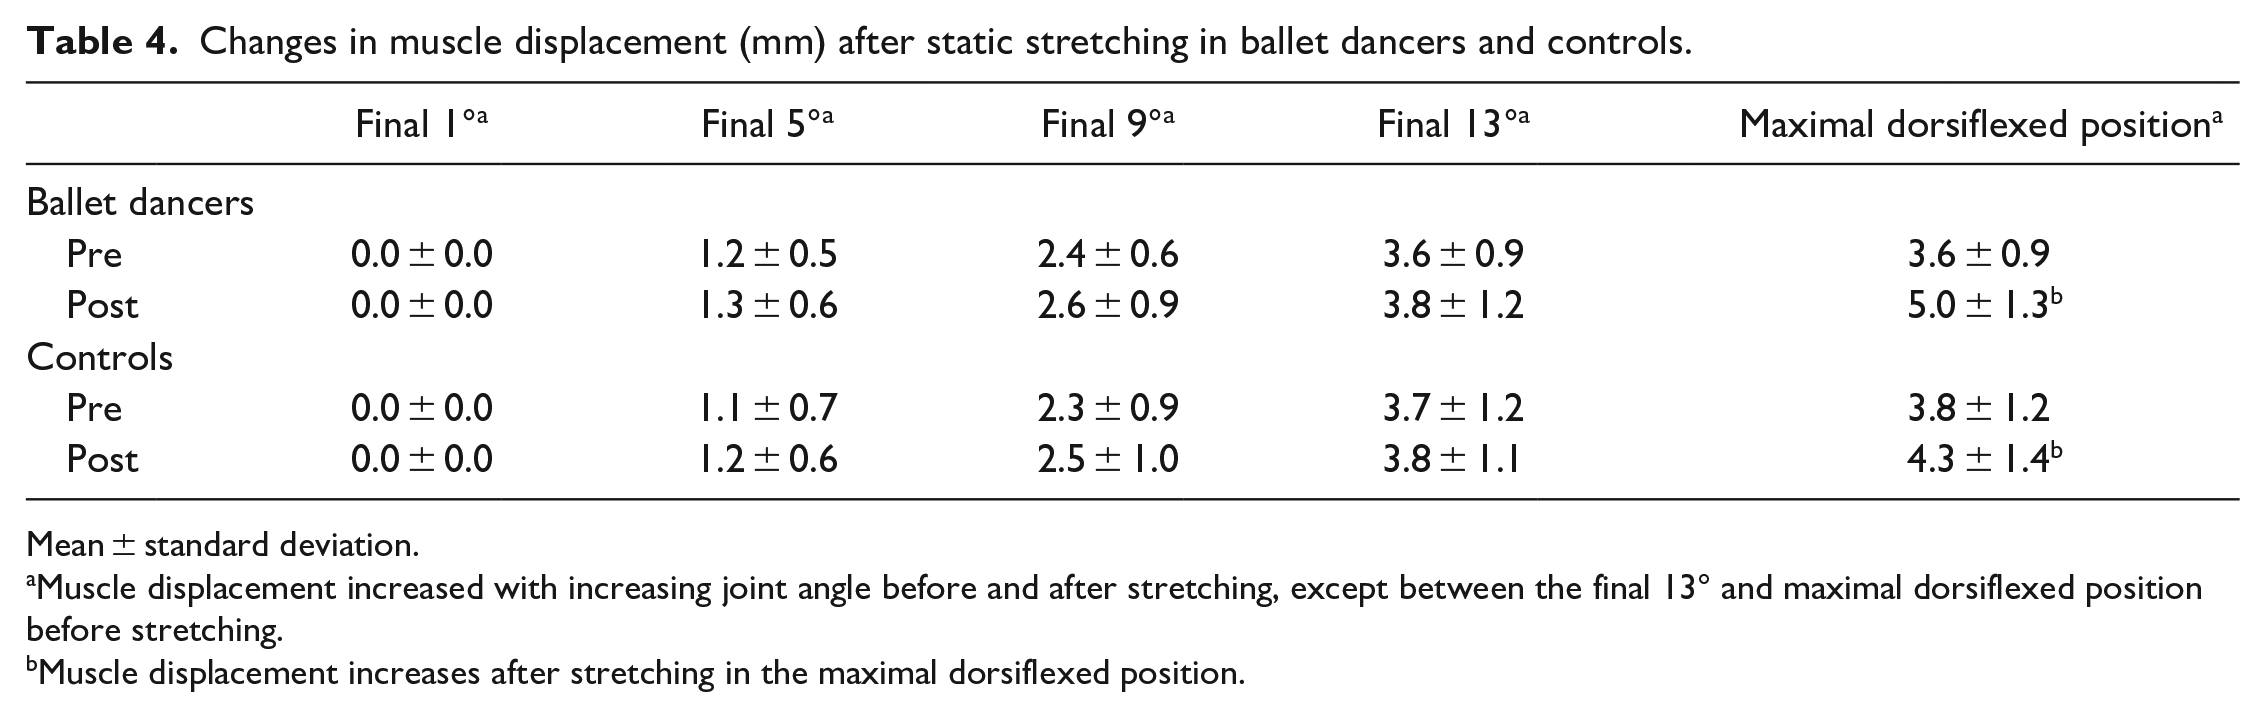
Mean ± standard deviation.
Muscle displacement increased with increasing joint angle before and after stretching, except between the final 13° and maximal dorsiflexed position before stretching.
Muscle displacement increases after stretching in the maximal dorsiflexed position.
Maximal Plantar Flexion Torque
No significant 2-way interaction (F (1, 24) = 0.035, P = .853) and main effects of the group (F (1, 24) = 2.323, P = .141) were observed; however, a significant main effect of time was observed (F (1, 24) = 13.985, P = .001). Post-hoc testing revealed that the maximal plantar flexion torque decreased after stretching (Figure 3).
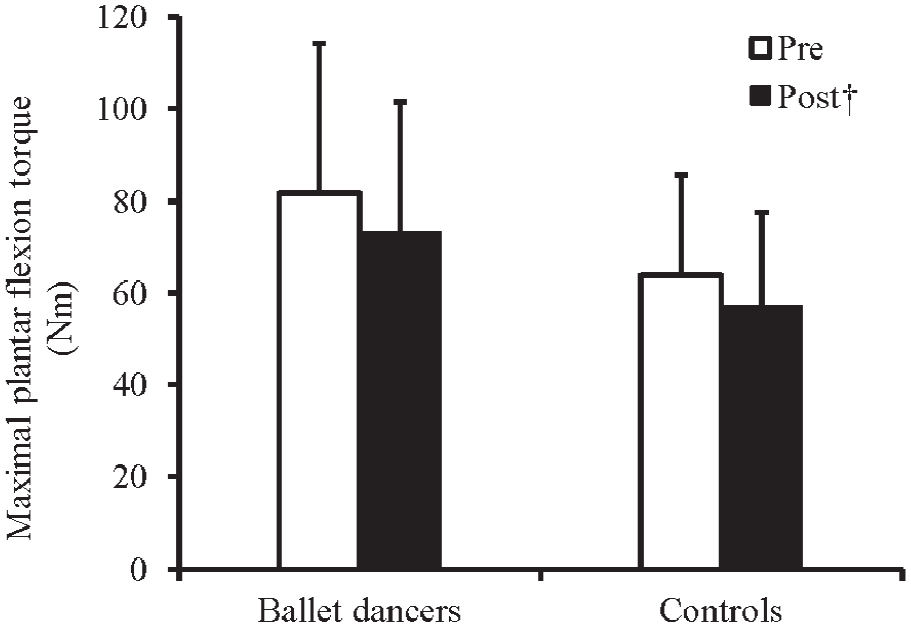
Changes in maximal plantar flexion torque before and after static stretching in the ballet dancers and controls.
RFD
No significant 3-way (F (1.288, 30.906) = 0.239, P = .689) and 2-way interactions (time and period: F (1.288, 30.906) = 1.409, P = .252; period and group: F (1.342, 32.219) = 1.018, P = .344; time and group: F (1, 24) = 2.612, P = .119) were observed. In addition, no significant main effect of time was observed (F (1, 24) = 0.134, P = .717); however, significant main effects of the period (F (1.342, 32.219) = 43.829, P < .001) and group (F (1, 24) = 5.539, P = .027) were observed. Post-hoc testing revealed that ballet dancers had greater RFD than the controls. In addition, the RFD increased with increasing periods (all P < .005), except between 0-150 ms and 0-200 ms.
EMG
Regarding the EMG of the MG, a significant 3-way interaction was observed (F (1, 24) = 5.781, P = .024). Post-hoc testing revealed that the ballet dancers had less EMG during the initial 10° pre-stretch than the controls (P = .038). The EMG of the ballet dancers in the pre-stretch increased from the initial 10° to the final 5° (P = .004), whereas the EMG of controls in the post-stretch increased from the initial 10° to the final 5° (P = .013) (Table 5).
Changes in electromyography (mV) after static stretching in ballet dancers and controls.
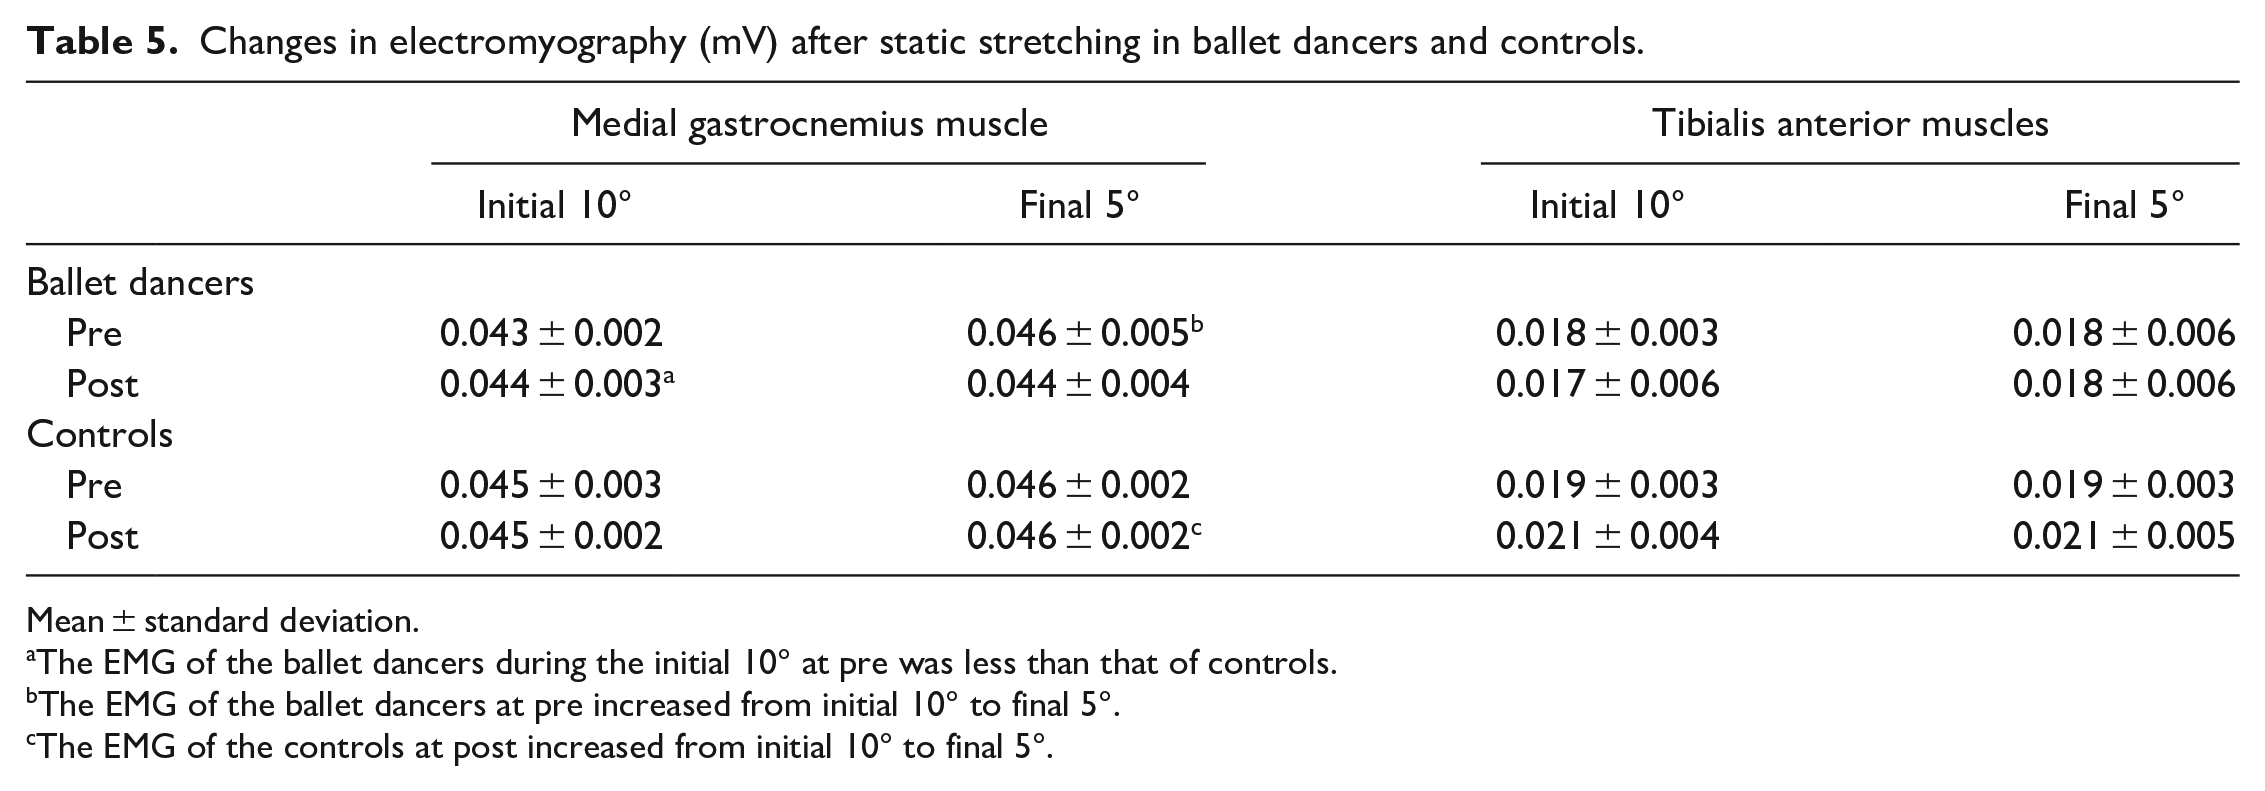
Mean ± standard deviation.
The EMG of the ballet dancers during the initial 10° at pre was less than that of controls.
The EMG of the ballet dancers at pre increased from initial 10° to final 5°.
The EMG of the controls at post increased from initial 10° to final 5°.
Regarding the EMG of the tibialis anterior muscle, no significant 3-way (F (1, 24) = 0.027, P = .870) and 2-way interactions (time and portion: F (1, 24) = 0.873, P = .359; portion and group: F (1, 24) = 0.508, P = .483; time and group: F (1, 24) = 2.698, P = .114) and main effects (time: F (1, 24) = 1.271, P = .271; portion: F (1, 24) = 0.508, P = .483; group: F (1, 24) = 1.834, P = .188) were observed (Table 5).
Discussion
This study aimed to determine the differences in the effects of SS on joint ROM, PT, stretch tolerance, stiffness, and muscle strength between the ballet dancer and control groups. The main findings of this study were that maximal dorsiflexion angle, PT, muscle displacement, and maximal plantar flexion torque changed in both groups after SS; however, no differences were observed between the groups.
No difference was observed in the change in the maximal dorsiflexion angle after SS between the ballet dancers and controls. Previous studies have reported that the increase in joint ROM after SS in ballet dancers and rhythmic gymnasts, who have a larger joint ROM, differed from that in the controls.13,15 In contrast, no difference was observed in the increase in the maximal dorsiflexion angle between the ballet dancers and controls in this study. One reason for the different results between previous studies and this study may be the difference in the stretching intensity. Although one previous study does not clearly state whether the angle or torque was maintained during stretching, 15 but the other study states that the PT was maintained during stretching (ie, constant torque stretching). 13 Constant torque stretching requires increasing the joint angle to maintain constant torque during the stretching.28,29 Stretching angles have been used as a parameter of stretching intensity, 30 and it has been reported that greater stretching angles are associated with greater increases in ROM. 31 Therefore, constant torque stretching provides a greater increase in ROM than constant angle stretching. 32 On the other hand, constant angle stretching was performed in this study. In constant angle stretching, passive torque during stretching is reduced due to stress-relaxation. 31 Therefore, the stretching load 33 calculated by the passive torque during stretching and stretching time is smaller in constant angle stretching than that in constant torque stretching, so the relative increase in ROM would be also smaller. Thus, it is possible that the lower stretching intensity in this study compared to the previous study 13 did not elicit the maximal increase in ROM. This effect may have been particularly large in the ballet dancers, who usually stretch and have a large joint range of motion. We speculate that this may be the reason why there was no difference in ROM increase between the groups, but further research is needed to clarify the truth of this speculation.
Other possible reason would include characteristics of the participants. Since previous study 2 had shown that submaximal passive torque was lower in ballet dancers than in controls, we hypothesized that it would be more difficult to further reduce the originally low passive torque of ballet dancers with SS than the originally high passive torque of controls with. However, in this study, ballet dancers had higher passive torque than the control group at 0°, and there was no significant difference at 5°. Therefore, these characteristics of the ballet dancers in this study, which were different from those of the ballet dancers in the previous study, 2 may have contributed to the fact that no difference in stretching effect was observed. A possible reason for the discrepancy in results between this study and previous studies could be differences in ballet dance history. The average training history of dancers was 24 years in the previous study and 15.7 years in this study. Thus, differences in years of adaptation to dance training may have influenced differences in passive torque across studies.
The group differences in relative stretching intensity may be attributed to differences in the methods of maximal dorsiflexion angle between stretching and passive dorsiflexion flexibility measurement. It has been reported that the maximal dorsiflexion angle of the ankle joint measured in the non-weight-bearing position correlates with ankle stiffness, as in the passive dorsiflexion flexibility measurement in the present study, but the maximum dorsiflexion angle of the ankle joint measured in the weight-bearing position, as in the SS in the present study, does not correlate with ankle stiffness. 34 This suggests that factors related to the maximal dorsiflexion angle differ depending on whether it was measured in the non-weight-bearing or weight-bearing position. Stiffness at the same angle was lower in ballet dancers than in controls. 2 Therefore, it is possible that the dancers showed a higher maximal dorsiflexion angle in the non-weight-bearing position, where stiffness and maximal dorsiflexion angle were negatively correlated, but no difference between groups was observed in the weight-bearing position, where stiffness and maximum dorsiflexion angle were not correlated. 34 It is possible that there are other factors besides stiffness that may or may not be related to the maximal dorsiflexion angle as a result of differences in measurement posture. Such factors may contribute to the low relative stretching intensity in ballet dancers.
A decrease was observed in the maximal plantar flexion torque in both groups after SS; however, no difference was observed between the groups. Previous studies have reported a muscle force deficit immediately after SS17,20,21,35 caused by the nocebo effect, decreased muscle stiffness, and decreased signaling ability in motoneuron dendrites.17,18 Recently, central neurological factors, such as decreased information transmission in motoneuron dendrites, have been considered the main cause of muscle weakness after SS.18,23,36 However, in this study, no differences were observed in the decrease in maximal plantar flexion torque between the groups, suggesting no differences in the effects of central neurological factors between the ballet dancer and control groups for the stretching method used in this study.
This study has some limitation. It included only young women as the ballet dancers and controls. Previous studies have reported sex- and age-related differences in flexibility, with women having greater joint ROM and muscle displacement than men and younger participants having greater joint ROM and stretch tolerance than older participants.37,38 Therefore, future experiments that include men and middle-aged to older adults or developing ballet dancers may yield different results. Second, the intensity of the stretching was insufficient and may not have elicited adequate changes due to SS. Therefore, a comparison of the effects of constant torque stretching is needed. Third, this study focused on the ankle joint; effects at other sites, such as the hip joint, are unknown. Fourth, although the control group in this study was sedentary college students, comparisons with active controls and athletes from other sports disciplines will further clarify whether there are ballet dancer-specific effects on SS. Finally, SS was implemented in this study, but the use of dynamic stretching is recommended, 39 especially in the warm-up. Therefore, future studies should examine whether there is a ballet dancer-specific influence on the effectiveness of dynamic stretching.
Practical and Clinical Applications and Implications
In the case of the stretching method used in this study, there was no difference in the effects of static stretching on flexibility and muscle strength between ballet dancers and the general population. In general, people with greater flexibility tend to be asked to perform SS with greater intensity and for longer periods of time than those who are not as flexible. Ballerinas and their instructors should understand that a 5-minute constant angle stretch in the weight-bearing position for the ankle joint can be as effective as the general population (which is less flexible than the ballet dancers) without longer or more intense stretching (ie, a less flexible group than the ballet dancers). However, it should be noted that different stretching target areas and different stretching methods (eg, intensity, duration, position, etc.) may produce different results from those in this study.
Conclusion
SS increased the maximal dorsiflexion angle, PT at the maximal dorsiflexed position, muscle displacement at the maximal dorsiflexed position, and decreased PT during the final 13° and maximal plantar flexion torque. However, no group differences were observed in the changes in these measures. Thus, SS with constant angle produce similar change regardless of the individual’s flexibility.
Footnotes
Declaration of Conflicting Interests
The author(s) declared no potential conflicts of interest with respect to the research, authorship, and/or publication of this article.
Funding
The author(s) disclosed receipt of the following financial support for the research, authorship, and/or publication of this article: This work was supported by the JSPS KAKENHI Grant-in-Aid for Scientific Research (C) [Grant Number 22K11525].