
Abstract
The objective of this secondary analysis was to evaluate the utility of several participant adherence indicators for predicting changes in clinical, anthropometric, dietary, fitness, and physical activity (PA) outcomes in a lifestyle intervention, HUB City Steps, conducted in a southern, African American cohort in 2010. HUB City Steps was a 6-month, community-engaged, multicomponent, noncontrolled intervention targeting hypertension risk factors. Descriptive indicators were constructed using two participant adherence measures, education session attendance (ESA) and weekly steps/day pedometer diary submission (PDS), separately and in combination. Analyses, based on data from 269 primarily African American adult participants, included bivariate tests of association and multivariable linear regression to determine significant relationships between seven adherence indicators and health outcome changes, including clinical, anthropometric, dietary, fitness, and PA measures. ESA indicators were significantly correlated with four health outcomes: body mass index (BMI), fat mass, low-density lipoprotein (LDL), and PA (–.29 ≤ r ≤ .23, p < .05). PDS indicators were significantly correlated with PA (r = .27, p < .001). Combination ESA/PDS indicators were significantly correlated with five health outcomes: BMI, percentage body fat (%BF), fat mass, LDL, and PA (r = −.26 to .29, p < .05). Results from the multivariate models indicated that the combination ESA/PDS indicators were the most significant predictors of changes for five outcomes—%BF, fat mass, LDL diastolic blood pressure (DBP), and PA—while ESA performed best for BMI only. For DBP, a one-unit increase in the continuous-categorical ESA/PDS indicator resulted in 0.3 mm Hg decrease. Implications for assessing participant adherence in community-based, multicomponent lifestyle intervention research are discussed.
Keywords
Lack of participant adherence to behavioral program components targeting diet and physical activity is a recurrent challenge in intervention research and a major threat to intervention effectiveness (Blue & Black, 2005). Adherence determines the extent an intervention has been received by participants (dose) and can aid in understanding relationships between program elements and participant outcomes (response) (Saunders, Evans, & Joshi, 2005). Higher levels of intervention implementation, including adherence, fidelity, and reach, have been associated with more positive health outcomes, such as improved mental and physical health (Durlak & DuPre, 2008). Thus, implementation data are essential for determining why programs succeed or fail, and participant adherence measures can aid in identifying intervention components that appear to have achieved the largest impact on health outcomes. Data of this nature are especially relevant for health interventions grounded in several theoretical concepts (e.g., transtheoretical model of change and self-determination theory) that include multiple components (e.g., social support and nutrition education), or that are designed to effect change in multiple behaviors (e.g., diet and physical activity).
In a descriptive literature review examining conceptual and methodological issues of diet and physical activity interventions, 8 of 17 identified studies reported participant adherence indicators (Blue & Black, 2005). Frequency of class attendance was the most common measure reported (6 of 8 studies), with self-report measures of participant adherence presented in 2 studies. In a worksite physical activity program, employee participation was assessed by number of goal sheets submitted (Wilson et al., 2010), while in a worksite nutrition intervention, contest participation and education event attendance were separately assessed (Patterson et al., 1997).
Although the effects of single adherence measures on health outcomes have been reported, little has been reported concerning multiple measures. The relationship between a multidimensional adherence measure and physical activity participation was reported for Project PRIME, a two-arm lifestyle physical activity intervention (Heesch, Masse, Dunn, Frankowski, & Mullen, 2003). Similarly, multidimensional adherence measures were reported for POUNDS LOST, a trial designed to test the efficacy of four dietary macronutrient compositions for promoting weight loss (Williamson et al., 2010). However, the adherence measures were not subsequently linked to the amount of weight lost or other health outcomes.
The primary analysis of HUB City Steps, a lifestyle intervention conducted in a southern, primarily African American cohort, examined the intervention’s effectiveness in achieving improvements in blood pressure (BP), anthropometric measures, biological measures, and diet. Results of this analysis have been reported elsewhere (Zoellner et al., 2014). Because exploratory analysis of the study data revealed differences in outcome changes based on participant adherence to intervention components, and given the limitations of the literature, the objective of this secondary analysis was to evaluate the utility of several participant adherence indicators, based on educational session attendance (ESA) and pedometer diary submission (PDS), for predicting changes in clinical, anthropometric, dietary, fitness, and physical activity outcomes in HUB City Steps.
Method
Design
Procedures followed in HUB City Steps were in accordance with ethical standards for human subjects research, and approval was obtained from the University of Southern Mississippi’s Institutional Review Board. Study participants provided informed written consent. HUB City Steps was a 6-month, community-based, multicomponent educational program designed to improve hypertension and its risk factors in a primarily African American adult cohort. Although the study was designed in two phases, an initial 6 months of intervention followed by 12 months of maintenance, only the noncontrolled intervention phase is relevant to these analyses. Baseline data were collected from January to February 2010, and 6-month data were collected from July to August 2010.
Recruitment of study participants involved various methods, including flyers, word of mouth, and community events. Recruitment efforts were primarily directed toward African American residents; however, race/ethnicity was not an exclusion criterion. Eligibility criteria included age (18 years or older), English speaker, non-institutionalized, and resident of the Hattiesburg, Mississippi, area. For safety reasons, individuals with BP ≥ 180/110 were disqualified from participation and directed to seek immediate medical attention. All other individuals were eligible for participation regardless of BP status and medication regimen.
Intervention
HUB City Steps integrated components from several theoretical concepts and frameworks, including social support, self-determination theory, and the transtheoretical model of change (Zoellner et al., 2011). The lifestyle intervention consisted of four primary components. The first component included three sessions of one-on-one motivational enhancement, an adaptation of motivational interviewing that uses a feedback approach (Madson, Landry, Molaison, Schumacher, & Yadrick, in press; Miller, Zweben, DiClemente, & Rychtarik, 1992). Trained intervention staff provided these 20-minute sessions at baseline, 3-month, and 6-month health assessments. Each participant received an individualized “Know Your Numbers” (e.g., BP, body mass index [BMI], cholesterol, glucose) card that served as a central point of the discussion, aimed at developing an individualized health behavior change plan. The second component consisted of social support provided by walking group leaders who were indigenous community members. These volunteers served as liaisons between participants and research staff and were trained to encourage walking, goal setting, and submission of pedometer diaries. The third component consisted of pedometer diary self-monitoring (described in the Measures section). The fourth component consisted of five 90-minute monthly education sessions that included key principles of the Dietary Approaches to Stop Hypertension (DASH) diet (Sacks et al., 2001), group physical activity, and sharing of successes and challenges. The session topics included negative side effects of high BP and benefits of exercise for controlling BP, DASH diet and community options available for exercise and healthy eating, problem-solving techniques related to cooking and role of sodium in controlling BP, empowerment to implement healthy lifestyle changes, and healthy choices when eating out and identification of triggers that influence unhealthy menu choices. Six local community health professionals, including four health educators and/or registered dietitians and two fitness instructors, were trained to lead the education sessions. Participants received monetary compensation for their time involved in data assessments. Further details regarding study methodology are published elsewhere (Zoellner et al., 2011).
Measures
Questionnaire data included demographics, medical history, medication use, and fasting and smoking status. The National Cancer Institute’s 18-item Five-Factor Screener was used to assess dietary intake (Thompson et al., 2004). An OMRON HEM-907XL automatic inflation sphygmomanometer, portable stadiometer, Tanita body fat analyzer (Model TBF-310T), and Cholestech LDX lipid analyzer were used to measure BP, height, weight and body composition, and nonfasting cholesterol and glucose, respectively. As a fitness measure, the 6-minute walk test was assessed (American Thoracic Society: Committee on Proficiency Standards for Clinical Pulmonary Function Laboratories, 2002). Pedometers (Model SW-701, Yamax Corporation, Tokyo, Japan) were used to record steps per day, a physical activity measure. Participants were instructed to wear the provided pedometer on the waist during waking hours and to self-monitor their steps per day using weekly PDS via mailed postcards or logging into the intervention’s website. To track ESA, we had participants sign in upon arrival at these sessions.
Two participant adherence measures, ESA and PDS, and several methodological approaches to computing descriptive indicators were explored and included continuous and categorical as well as singular (ESA or PDS alone) and combination (ESA/PDS) variables. Seven adherence indicators were analyzed: continuous ESA (range = 0-5 sessions), continuous PDS (range = 0-27 weeks), categorical ESA (low = 0-2 sessions vs. high = 3-5 sessions; based on median split), categorical PDS (low = 0-13 weeks vs. high = 14-27 weeks; based on median split), continuous ESA/PDS ([6 * ESA] + PDS), categorical ESA/PDS (ESA [low/high] * PDS [low/high] = four categories), and continuous-categorical ESA/PDS (ESA quartiles * PDS quartiles, range = 1-16). Median and quartile splits were used because of their intuitive interpretation and for consistency with adherence reports in other behavioral studies (Bergh et al., 2012; Tussing-Humphreys, Thomson, Mayo, & Edmond, 2013; Zoellner et al., 2013). For the continuous ESA/PDS indicator, ESA was multiplied by 6 to approximate the range (weighting) of PDS. For the continuous-categorical ESA/PDS indicator, ESA and PDS were first separately split into quartiles, and these quartiles were subsequently multiplied together to obtain an ordinal variable that was treated in a continuous manner (similar to the continuous ESA indicator). Although motivational enhancement session participation could be considered a measure of program adherence, the sessions occurred at each assessment point immediately following data collection. Hence, it was not possible to use motivational enhancement session participation as a measure of program adherence due to confounding with time.
Statistical Analyses
Statistical analyses were performed using SAS software, Version 9.3 (SAS Institute, Cary, North Carolina). Bivariate tests (Pearson correlation coefficients, t tests, and ANOVA) were used to determine significant associations between participant adherence indicators and health outcome changes (baseline to 6 months follow-up), including anthropometric (waist circumference, BMI, percentage body fat [%BF], fat mass, and lean body mass), clinical (systolic BP [SBP], diastolic BP [DBP], total cholesterol, high-density lipoprotein, low-density lipoprotein [LDL], triglycerides, and glucose), fitness (6-minute walk test), and dietary intake (calcium, dairy, fiber, fruit and vegetables, and sugar) measures. While we used change in pedometer-determined mean steps per day as the physical activity outcome, change was not from baseline to 6 months follow-up because no baseline steps-per-day data were collected. Hence, change was calculated as the difference between steps per day reported during the first 2 weeks of the intervention and the remaining weeks (3 to 27). Positive changes represent an increase in steps per day between the initial and remaining weeks of the intervention period. Thus change in intervention steps per day represents persistence in or maintenance of step-defined physical activity rather than true change from preintervention baseline. Further details regarding the rationale, methodology, and utility of this steps-per-day indicator may be found elsewhere (Thomson et al., 2012). Multiple group comparisons for the categorical indicators were based on least squares means using Tukey-Kramer adjusted p values. Multivariable linear regression was used to determine the predictive ability of the adherence indicators for health outcome changes in the presence of covariates. Baseline covariates included age, gender, marital status, education level, income level, smoking status, BMI, and outcome value of interest (e.g., baseline SBP). Steps per day reported during the first 2 weeks of the intervention was used as the steps-per-day baseline value. For modeling purposes, marital status was dichotomized to married and not married (including widowed, divorced, separated, and never married), while education level was collapsed to high school graduate or less (including GED) and at least some college (including trade or vocational school, some college, college degree, some graduate/professional school, and graduate/professional degree). Further, income level was modeled as a continuous variable due to its relatively large number of categories (n = 12). A significance level of .05 was used, though we built multivariate models for both significant and trending (.05 < p ≤ .10) associations between participant adherence indicators and health outcome changes.
Results
Baseline demographic, anthropometric, clinical, fitness, step-defined physical activity, and dietary characteristics are presented in Table 1. Most participants were African American (94%), female (85%), and overweight or obese (91%), with a mean age of 44 (SD = 12.2) years. The majority (80%) of participants had at least some college education, and 27% reported household incomes greater than $50,000 per year. Diagnosed high BP was self-reported by 42% of participants; 65% of participants were classified as low ESA and 40% as low PDS. The retention rate was 71% (190/269) at 6 months. Significant decreases of approximately 6 and 4 mm Hg in SBP and DBP, respectively, were apparent at 6 months, as was an approximate three-teaspoons decrease in sugar intake (Zoellner et al., 2014). Significant improvements were not found in any other health outcomes.
Baseline Demographic, Anthropometric, Clinical, Fitness, and Dietary Characteristics: HUB City Steps (N = 269).
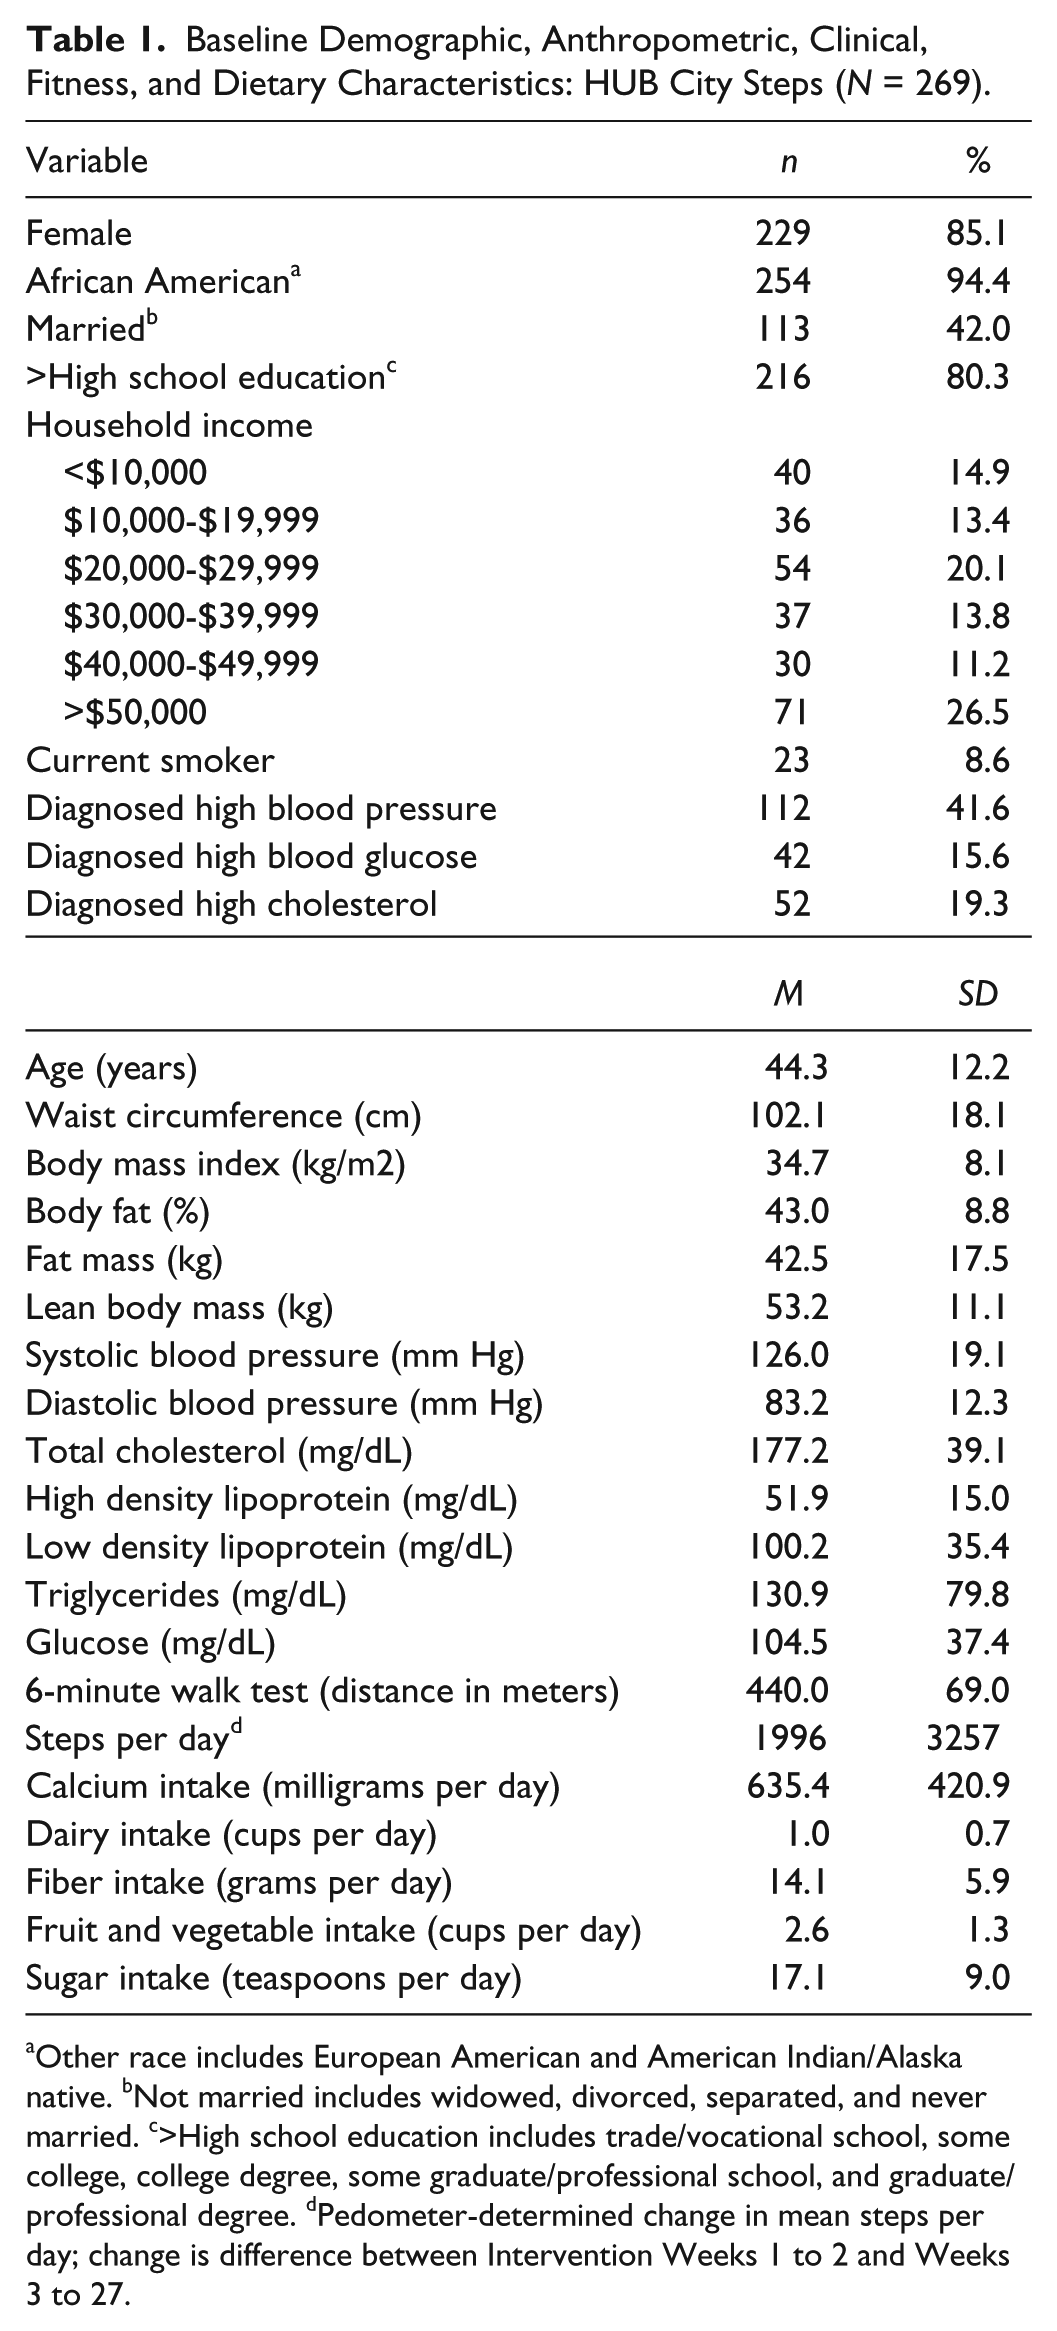
Other race includes European American and American Indian/Alaska native. bNot married includes widowed, divorced, separated, and never married. c>High school education includes trade/vocational school, some college, college degree, some graduate/professional school, and graduate/professional degree. dPedometer-determined change in mean steps per day; change is difference between Intervention Weeks 1 to 2 and Weeks 3 to 27.
Bivariate relationships among participant adherence indicators and health outcome changes are presented in Table 2. Because results for continuous and categorical indicators were similar (i.e., significant or nonsignificant for both) except for one dietary measure, only the continuous indicator results are presented in the table. Significant associations were observed between the continuous and categorical ESA indicators and BMI, fat mass, LDL, and change in mean steps per day (–.29 ≤ r ≤ .23). Only change in mean steps per day was significantly associated with the continuous (r = .27) and categorical PDS indicators. For the three ESA/PDS indicators, significant associations were observed for BMI, %BF, fat mass, LDL, and change in mean steps per day (–.26 ≤ r ≤ .29). Significant correlations were not apparent between the continuous adherence indicators and the dietary measures. However, a significant association was observed between the categorical ESA/PDS indicator and fruit and vegetable intake, with the largest increase observed in the high/low ESA/PDS group, similar increases between the low/low ESA/PDS and low/high ESA/PDS groups, and a decrease in the high/high ESA/PDS group (data not shown).
Correlations Between Continuous Participant Adherence Indicators and Outcome Changes at 6 Months: HUB City Steps.
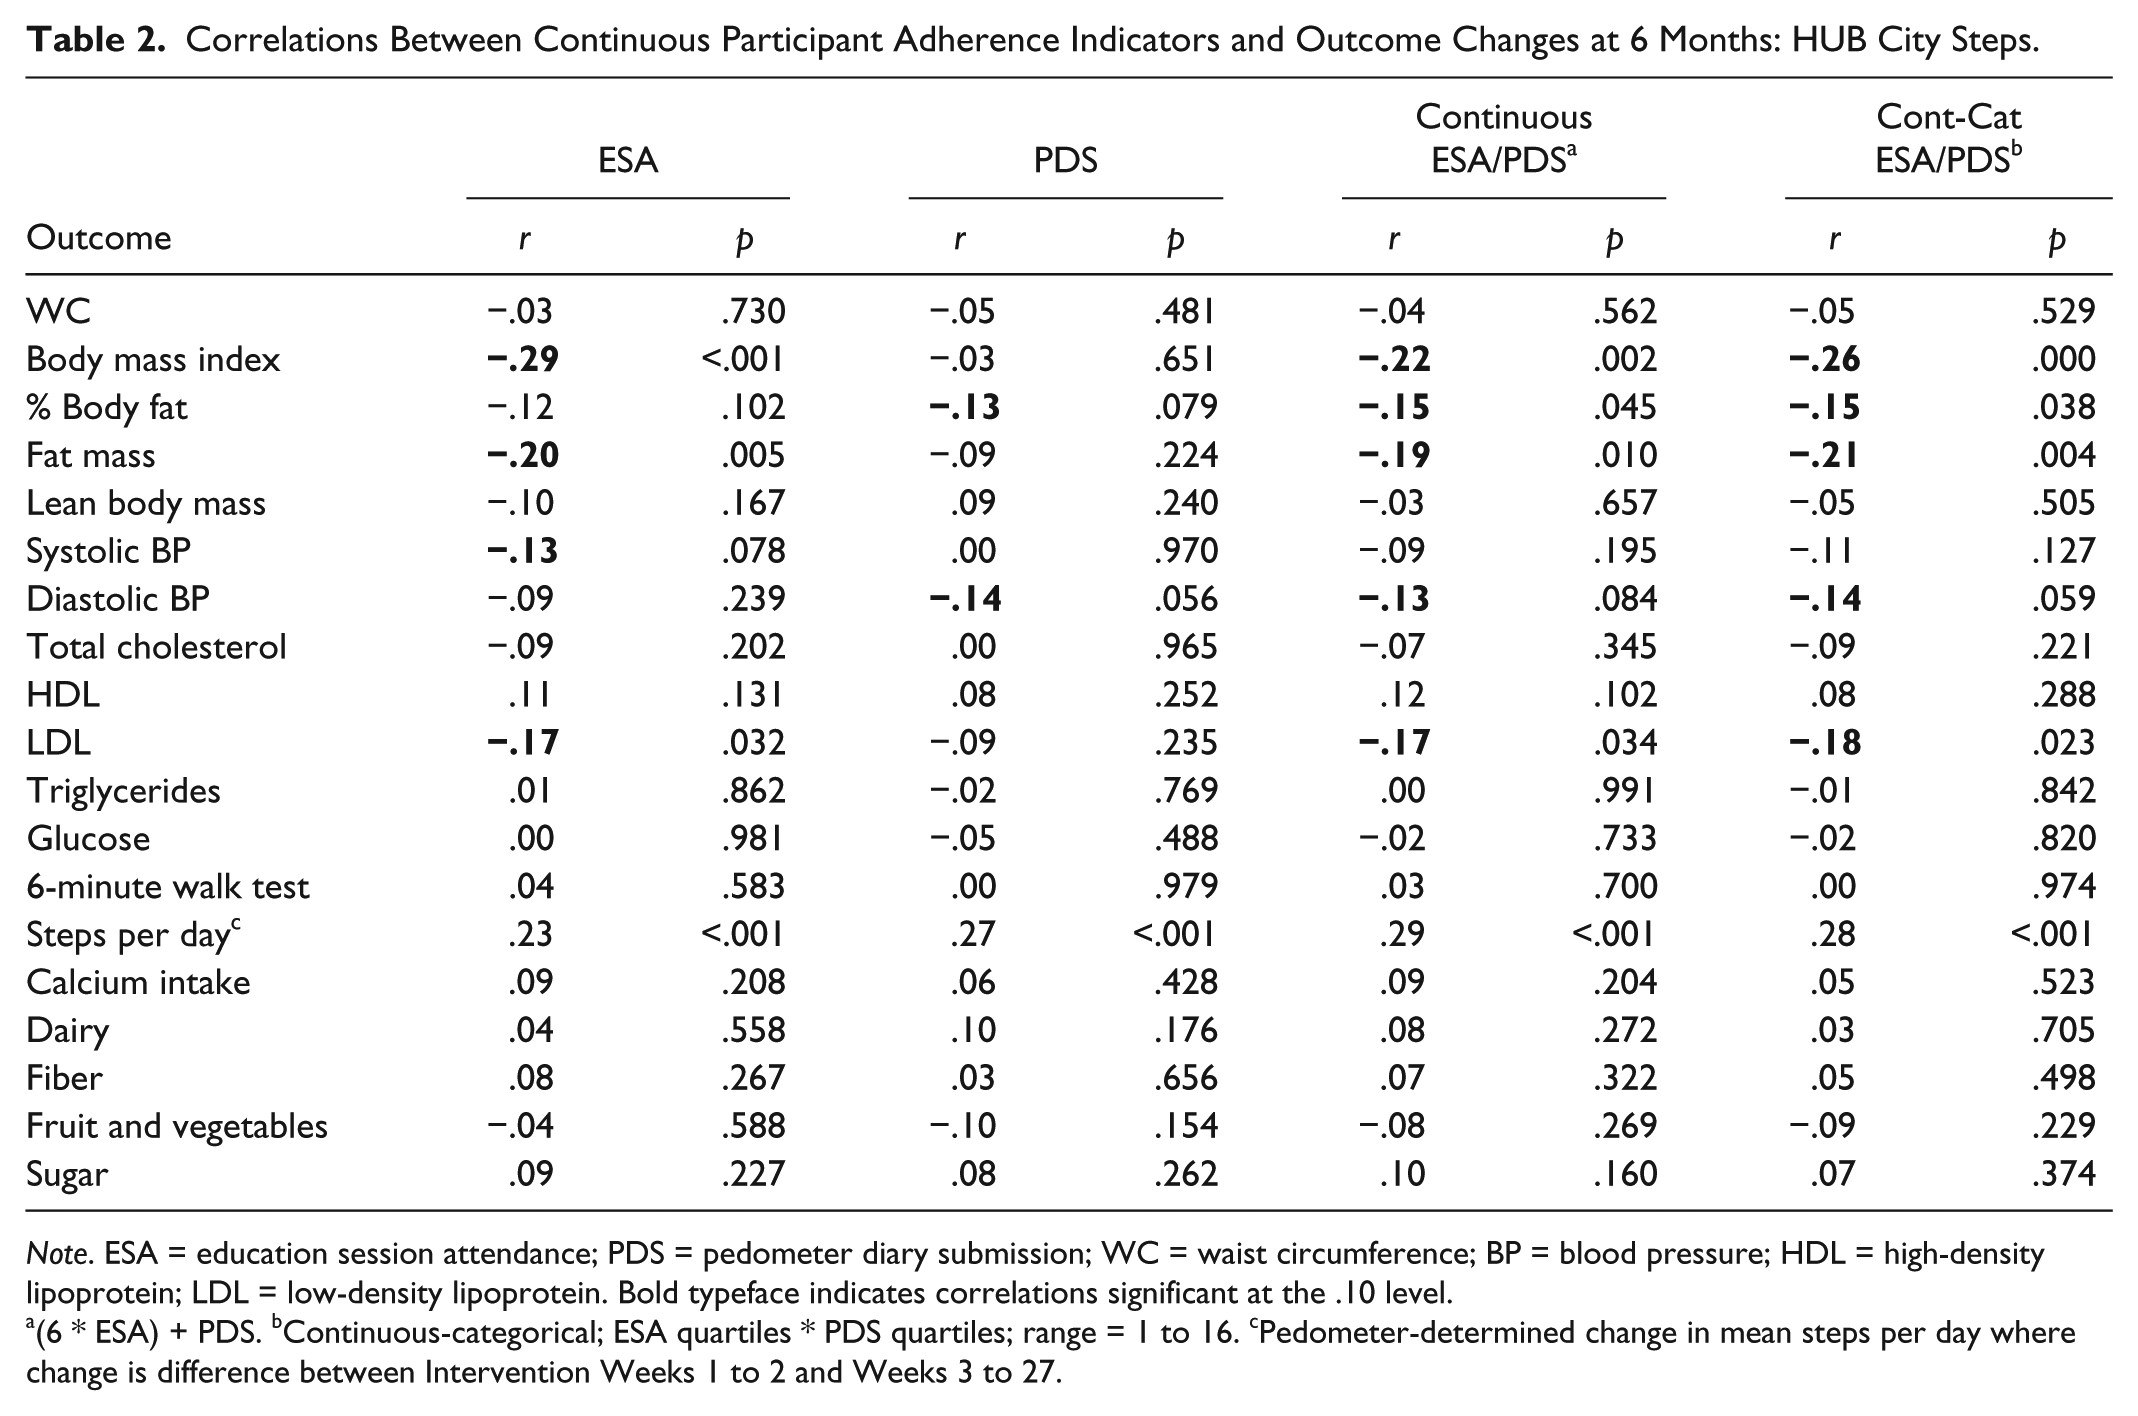
Note. ESA = education session attendance; PDS = pedometer diary submission; WC = waist circumference; BP = blood pressure; HDL = high-density lipoprotein; LDL = low-density lipoprotein. Bold typeface indicates correlations significant at the .10 level.
(6 * ESA) + PDS. bContinuous-categorical; ESA quartiles * PDS quartiles; range = 1 to 16. cPedometer-determined change in mean steps per day where change is difference between Intervention Weeks 1 to 2 and Weeks 3 to 27.
Multivariable regression model results are presented in Table 3. To simplify the table, only those health outcome models for which an adherence indicator remained significant in the presence of covariates were included. Additionally, only the “best predictive” (lowest p value and largest coefficient of determination [R2]) adherence indicators are presented. For BMI, a one-unit increase (additional class attendance) in continuous ESA resulted in 0.2 kg/m2 decrease. For %BF and fat mass, the high/high ESA/PDS categorical group’s decrease was significantly greater than the low/low group’s change. Similarly, for change in mean steps per day, the high/high ESA/PDS categorical group’s increase was significantly greater than the low/low and high/low groups’ changes. Further, a six-units increase (additional class attendance or approximately five additional diaries submitted) in the continuous ESA/PDS indicator resulted in 0.2% decrease in %BF and 58 steps per day increase in step-defined physical activity. For fat mass, LDL, and DBP, a four-units (quartile) increase in the continuous-categorical ESA/PDS indicator resulted in 0.5 kg, 2.3 mg/dL, and 1.2 mm Hg decreases, respectively.
Multivariable Regression Model Results for Outcome Changes at 6 Months Predicted by Participant Adherence Indicators: HUB City Steps.
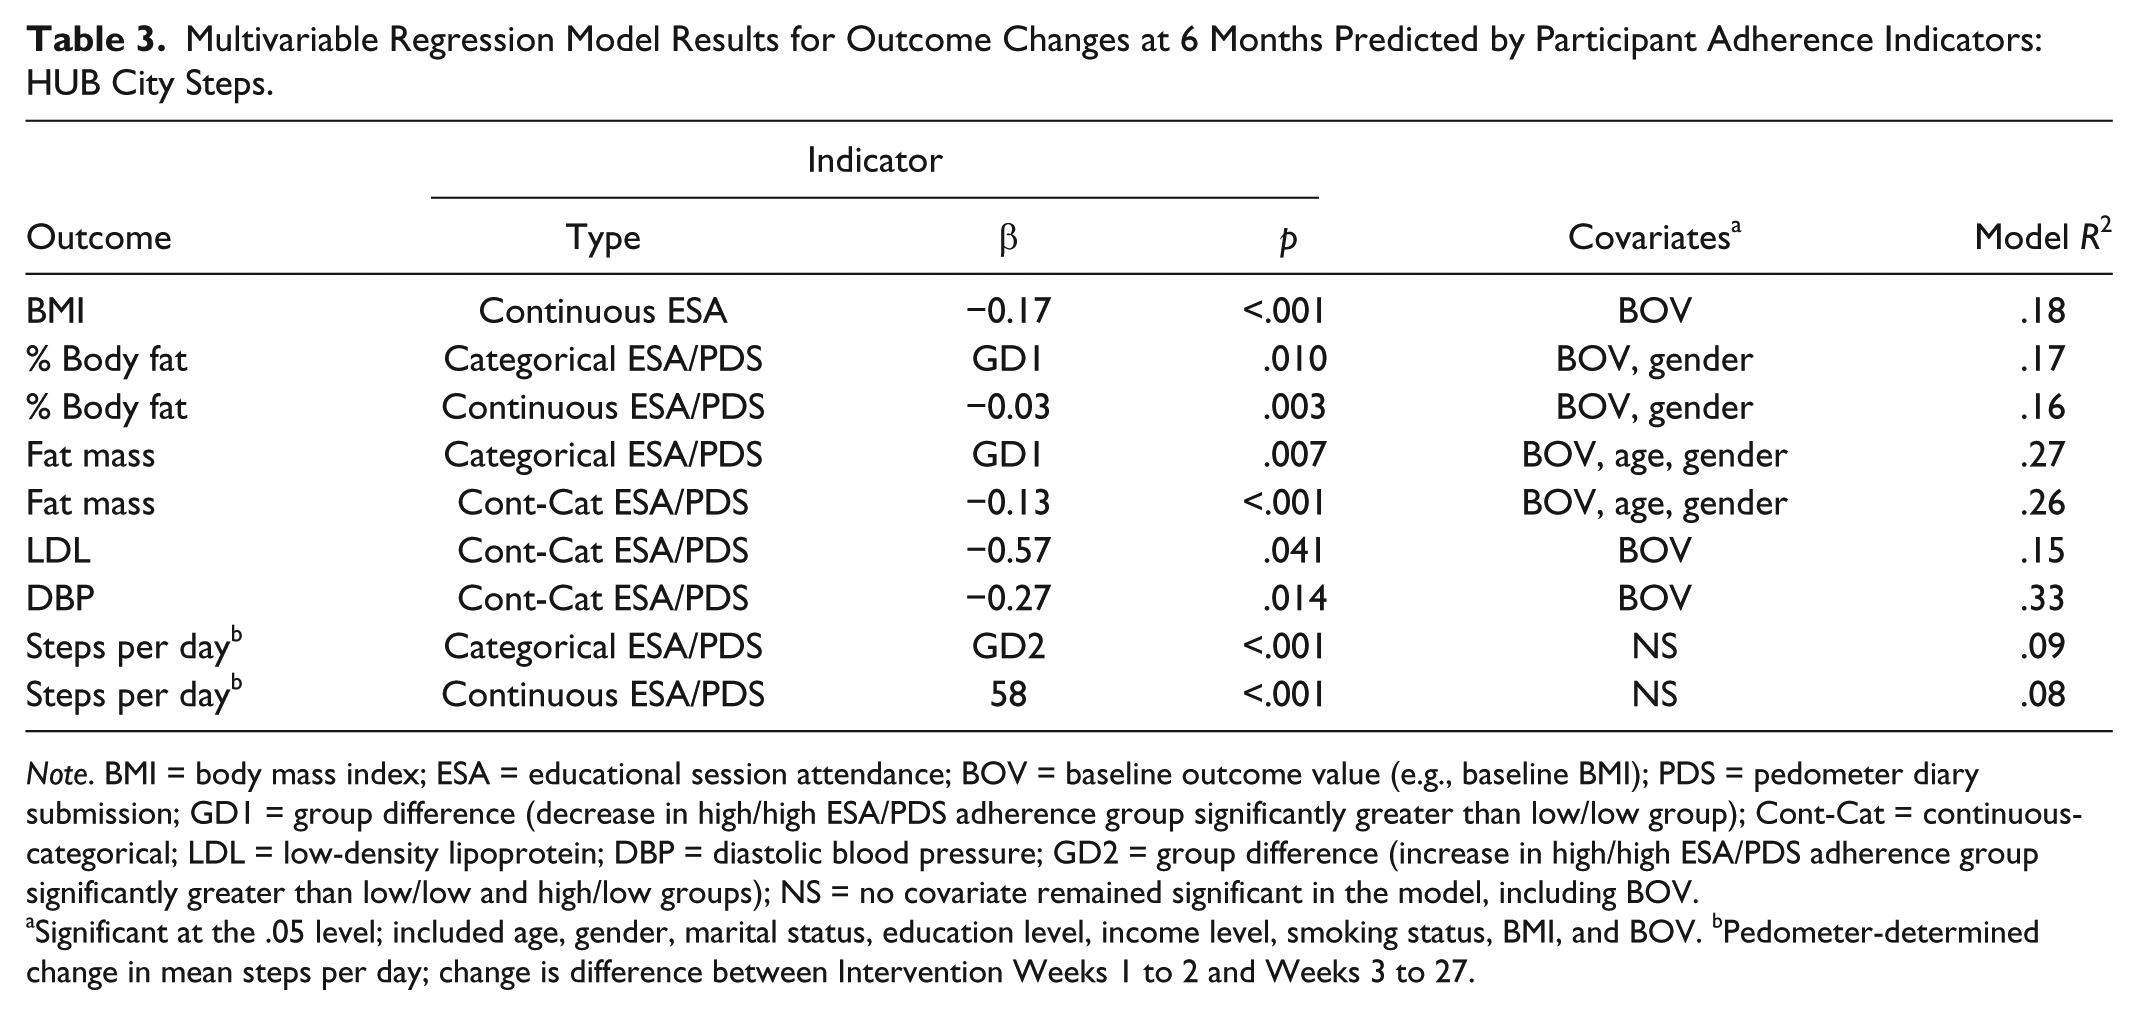
Note. BMI = body mass index; ESA = educational session attendance; BOV = baseline outcome value (e.g., baseline BMI); PDS = pedometer diary submission; GD1 = group difference (decrease in high/high ESA/PDS adherence group significantly greater than low/low group); Cont-Cat = continuous-categorical; LDL = low-density lipoprotein; DBP = diastolic blood pressure; GD2 = group difference (increase in high/high ESA/PDS adherence group significantly greater than low/low and high/low groups); NS = no covariate remained significant in the model, including BOV.
Significant at the .05 level; included age, gender, marital status, education level, income level, smoking status, BMI, and BOV. bPedometer-determined change in mean steps per day; change is difference between Intervention Weeks 1 to 2 and Weeks 3 to 27.
Discussion
This is one of the few studies to examine relationships between multiple participant adherence measures and post-intervention changes in health outcomes and possibly the only study to evaluate several adherence indicators, created using two measures, separately and in combination, for predicting health outcome changes. Using both an observational (ESA) and a self-reported (PDS) adherence measure, we found four significant (BMI, fat mass, LDL, change in mean steps per day) and two trending (%BF and SBP) associations with ESA. Only one significant (change in mean steps per day) and three trending associations (%BF, DBP, and LDL) were apparent with PDS, suggesting the observational ESA was the stronger predictive indicator. However, in the multivariable models, the combined (ESA/PDS) adherence indicators performed better (i.e., retained prediction significance) as compared to the single (ESA or PDS) indicators, with the exception of ESA for predicting changes in BMI. This is likely explained by the multicomponent design of HUB City Steps.
Similar to our ESA findings, a significant positive association between participant attendance during the first 6 months of intervention and weight loss was reported for Trials of Hypertension Prevention II (Stevens et al., 2001). In contrast to our nonsignificant results, others have reported positive associations between participant adherence indicators and dietary measures. Call completion of telephone counseling sessions for adult patients with type 2 diabetes or hypertension was significantly associated with improvements in self-reported measures of diet (fat, saturated fat, and fiber intake) and physical activity (minutes of moderate-to-vigorous activity) (Goode et al., 2011). The Working Well Trial, a randomized controlled trial of worksite-based nutrition promotion, reported significant positive relationships for dietary intake with direct education (fruit and vegetable) and with contest participation (fruit and vegetable, and fiber) (Patterson et al., 1997). In contrast to our significant PDS results, employee participation, as measured by submission of biweekly goal sheets, had no effect on change in physical activity in Move to Improve, a worksite physical activity intervention (Wilson et al., 2010). It should be noted that participation was dichotomized as full (returned all six goal sheets) or partial. It is not clear why we found significant predictability for our adherence indicators with more “downstream” outcomes, such as BMI and DBP, versus more direct outcomes, such as dietary and fitness measures (with the exception of step-defined physical activity). It is possible that our measures of diet and fitness were not sufficiently sensitive to detect changes that may have occurred during the intervention. More research is needed in this area to determine why some studies find associations between participant adherence indicators and health outcomes while others do not.
Of the two studies that reported results for multidimensional participant adherence indicators, only one linked the indicator to a study outcome. In Project PRIME, multidimensional adherence indicators were created for both arms of this 2-year physical activity intervention (Heesch et al., 2003). The two indicators were based upon three markers of adherence: completion of homework, self-monitoring physical activity, and either class attendance (G arm) or completion of scheduled telephone calls (C arm). Both adherence indicators were found to predict participation in 150 minutes or more of moderate-to-vigorous physical activity per week at 6 months follow-up (Heesch et al., 2003). Likewise, we also found our adherence indicators significantly predicted step-defined physical activity as well as anthropometric, BP, and lipid changes. Similar to Project PRIME, two multidimensional adherence indicators were created in the POUNDS LOST trial, which tested the efficacy of four dietary macronutrient compositions for promoting weight loss (Williamson et al., 2010). The first indicator, dietary adherence, was based upon adherence to total caloric goal and three macronutrient goals (protein, fat, and carbohydrate). The second indicator, behavioral adherence, was based upon attendance at individual and group sessions, number of daily food intake entries, and number of daily physical activity entries. These indicators were not linked to study outcomes (i.e., weight loss), as the purpose of the ancillary study was to determine if adherence was a uni- or multidimensional construct (Williamson et al., 2010). However, these findings do support our study’s use of multicomponent adherence indicators that combine both dietary and physical activity measures.
This study’s strengths included the use and comparison of two measures to create adherence indicators and the variety of indicators created and compared. While we used an observational (ESA) and a self-reported (PDS) adherence measure, some researchers suggest that observational data are more likely to be linked to outcomes than are self-report data (Lillehoj, Griffin, & Spoth, 2004). Few studies have compared these two strategies, and unfortunately, we also are not able to directly compare the collection modes of our two adherence measures since they represent different intervention components. Indeed, the self-report nature of PDS may have weakened associations with outcome changes. Additionally, we used common quantiles (i.e., median and quartile) for our categorical splits, which may allow for comparisons to other studies. However, designations of “low” and “high” adherence are study specific and thus may not be directly comparable to another study’s indicator, a potential limitation of our study (Durlak & DuPre, 2008). Because our participants were primarily African American residents of a southern community, study results may not be generalizable to other populations.
No adherence indicator emerged as the “best” overall predictor of clinical and anthropometric outcome changes in this cohort of southern, primarily African American adults. However, since the multicomponent indicators were predictive of several health outcomes, we advocate the use of a multifactorial adherence indicator for predicting health outcome changes in multicomponent lifestyle interventions. It may be that an overall measure of adherence has the most power to predict changes in multiple health outcomes. Additionally, similar to others (Durlak & DuPre, 2008; Mowbray, Holter, Teague, & Bybee, 2003), we advocate using individual adherence indicators for measuring each component of lifestyle interventions. A single composite adherence score may obscure implementation differences that are important on an individual component level (e.g., participants attending nutrition education classes have the largest changes in diet but not increased physical activity). Clearly, more research is necessary to determine whether adherence should be considered singularly or in combination when predicting health outcome changes. Further, while our results indirectly suggest that observational adherence measures may prove to be the most useful in terms of significant relationships with outcome changes, the question concerning use of observational versus self-report measures largely remains unanswered.
Achieving high participant adherence may lead to larger health improvements for participants and statistically significant intervention effects on targeted health outcomes. Therefore, practitioners and researchers should carefully consider the choice of adherence measures as well as methodological and statistical approaches for analyzing different participant adherence measures in behavioral lifestyle interventions. These findings support the importance of practitioners’ advocating high adherence when communicating program benefits to participants or patients. This study highlights options for creating and interpreting several participant adherence indicators for predicting changes in study outcomes.
Footnotes
Acknowledgements
We are grateful for contributions from the HUB City Steps Community Advisory Board members and the HUB City Steps participants. We acknowledge the support provided by Karen Zynda, Dr. Diana Cuy Castellanos, Dr. Melissa Bonnell, Dr. Sarah McMurty, Jeremy Noble, Dr. Charkarra Anderson-Lewis, Mary Beard, Latessa Minor, Martha Resavy, Dr. Ann Beardshall, Elmer Beardshell, and Dr. Wendy Stinson.
Declaration of Conflicting Interests
The authors declared no potential conflicts of interests with respect to the research, authorship, and/or publication of this article.
Funding
The authors disclosed receipt of the following financial support for the research, authorship, and/or publication of this article: The project described was supported by Award No. R24MD002787 from the National Institute on Minority Health and Health Disparities. Authors Landry, Connell, Madson, Molaison, and Yadrick received a portion of their salary support through this award. Zoellner received compensation as a consultant. The content is solely the responsibility of the authors and does not necessarily represent the official views or policies of the National Institute on Minority Health and Health Disparities, the National Institutes of Health, or the U.S. Department of Agriculture; nor does mention of trade names, commercial products, or organizations imply endorsement by the U.S. government.