
Abstract
A large literature examines the interaction of private and public funding of charities, much of it testing if public funding crowds out private funding. In this article, the author looks for two alternative phenomena using a large panel data set gathered from nonprofit organizations’ tax returns. First, the author looks for crowding out in the opposite direction: increased private funding may cause reduced public funding. Second, the author tests whether one type of funding acts as a signal of charity quality and thus crowds in other funding. The author finds evidence that government grants crowd in private donations. Crowding in is larger for younger charities. This is consistent with signaling, if donors know less about younger charities and the signal value is stronger. The author finds no evidence of an effect of private donations on government grants.
Public goods are often provided by both governments and individuals. The interaction of these two sources may affect the overall level of funding. In response to an increase in government spending on a public good or charity, individuals may reduce their contributions. The same effect can occur in the opposite direction. If a government sees that private donations to a charity have risen, then it may reduce its support of that charity. Additionally, some funding may crowd in other funding if it signals charity quality.
The literature on crowding out extends back to Warr (1982) and Roberts (1984), who show theoretically that an exogenous increase in government funding to charities decreases private donations dollar for dollar. Some empirical studies, including Kingma (1989), find support for such crowding out, but typically at a rate less than one for one. 1 Some studies find crowding in; Khanna and Sandler (2000) find this for charities in the United Kingdom, and Payne (2001) finds this for academic research institutions. Crowding in may occur if grants provide a positive signal of charity quality. 2 A signaling model of contributions to charities is presented in Payne (2001), Vesterlund (2003), and Andreoni (2006), where “seed money” from large donors or announcements of previous donations increase others’ donations by acting as a signal of the charity’s quality. Evidence of this effect is found in a field experiment in List and Lucking-Reiley (2002). 3
That literature focuses solely on how government spending affects individual giving. 4 This article also examines the opposite direction of causality: do private contributions to charities affect public contributions? I look for evidence of either crowding out or crowding in in both directions using panel data from almost 30,000 charities over six years. Though numerous papers test whether government grants crowd out private donations to charities, none can be found that test for crowding out in the opposite direction using micro-level data. 5 I also examine whether crowding in is consistent with quality signaling.
I find that government grants crowd in private donations, with a dollar increase in government grants leading to an increase in private donations between 10 and 30 cents. I find this result in various specifications of the data sample, although the statistical significance of the coefficient is generally just below the 10 percent level. It is statistically significant at the 5 percent level in regressions using a subset of charities as the sample. I also find that this crowding in is consistent with signaling, since the rate of crowding in is larger for younger charities. These are charities about which less information is likely to be known by donors, and thus the signal value of a grant ought to be larger. For the oldest charities, the crowding-in effect disappears. Estimates of the effect of private donations on government grants are not significant.
The presence of crowding in of contributions to charities is of concern to both governments and individuals who make these contributions. A government might choose an optimal level of provision of a charity or public good and adjust its funding to reach that level. Without accounting for the crowding in response by private donors, funding may exceed the optimal level. Likewise, if the level of private donations affects government support, then an individual’s optimal level of giving ought to account for the reaction of government grants. Many worry that large increases in private funding for global public health initiatives, including large grants from the Gates Foundation, are causing local governments to reduce health spending, evidence of crowding out of government grants. 6 For a small individual donor, the magnitude of crowd out is negligible, but for a donor or foundation making a large gift, this consideration may be important.
A theoretical model is not presented here but is available in an earlier working paper version of this article (Heutel 2009) or supplemental appendix. Here I summarize the main intuitive findings of the model that guide the empirical work. The one-for-one crowding out result from Warr (1982) and Roberts (1984) assumes that government grants are set exogenously and private donors respond to them. An alternative assumption is that private donations are exogenous, and the government chooses a level of contributions to maximize social welfare in response. Under this assumption, a symmetric result is found: private donations crowd out government grants at a one for one rate. The model can be extended a number of ways, by including a warm glow effect, modeling governments as nonbenevolent, including charity response, or considering various equilibria in which both private donors and governments move endogenously. The warm glow effect in particular changes the magnitude of crowding out; it will be at a rate less than one for one. But the main finding is sustained: government grants can respond to private donors in the same way that private donors can respond to government grants. The first empirical question is the following: do private donations crowd out government grants?
The second empirical question is generated by extending the model to allow for information asymmetry. If the government observes a charity’s quality while private donors do not, the government can use its funding to signal quality. If the government signals higher quality with higher funding, then a crowding-in effect will emerge: higher government grants will cause higher private donations. Symmetrically, if private donors have the better information about charity quality, their donations can act as signals to the government and crowd in grants. The magnitude of this crowding in depends on how individuals’ beliefs about charity quality are influenced by government grants, that is, the strength of the signal. The crowding-in effect exists alongside the crowding-out effect; it is not clear which effect dominates. The second empirical question is thus the following: is there any evidence of crowding in, either of private donations by government grants or in the opposite direction?
The finding of crowding in is not definitive evidence of signaling, since crowding in could materialize for other reasons. So, where I do find crowding in, I also investigate if the crowding in is consistent with signaling. The crowding-in effect occurs only when there is imperfect information about charity quality. It is likely that information about charity quality varies by charity. Older charities are more likely to have well-established reputations; younger charities are more likely to be unknown by donors. I therefore expect that the crowding-in effect from signaling will be larger for younger charities than for older charities. Another empirical question is the following: where there is crowding in, does its magnitude vary by charity age?
Charities typically advertise the grants they receive from both governments and private grant makers on their websites, in newsletters, and in press releases. If government grants crowded out private giving, it is unlikely that charities would make public the receipt of such grants. On the other hand, grants signaling quality and crowding in donations are more consistent with this observed behavior.
Data
The data on nonprofit organizations come from Internal Revenue Service (IRS) tax returns filed by eligible organizations. These data are collected and distributed by the National Center for Charitable Statistics (NCCS) at the Urban Institute. 7 They are based on the Forms 990 or 990EZ that must be filed by all 501(c)(3) nonprofit organizations except for religious organizations and any organization with less than $25,000 in gross receipts. 8 These data from 1998 to 2003 are contained in the Guidestar-NCCS National Nonprofit Research Database, which contains 1,388,480 observations from all public charities that filed within those fiscal years. The data set does not include 501(c)(3) private foundations, which receive most of their money from investments and endowments and use it primarily to make grants to organizations rather than directly for charitable services; private foundations file IRS Form 990-PF.
Organizations are classified according to the National Taxonomy of Exempt Entities (NTEE), a system developed by the NCCS. The NTEE divides charities into 645 centile level codes, collapsible into 26 major groups and 10 major categories. In order to make my results more comparable with prior research, I limit my scope to a particular set of charities. Most research in crowding out or crowding in of charitable donations has examined social service charities, and so I select organizations from the following NTEE categories: crime, employment, food and nutrition, housing, human services, and community improvement. 9
The large data set, containing entries from all 501(c)(3) nonprofit charities that filed with the IRS between 1998 and 2003, is useful for analysis but also presents problems with messy data. Still, I undertake measures to clean the data. The data set contains 339,716 observations on 76,725 charities. I drop observations for which there is clear evidence of reporting error. Some charities report revenues by category (e.g., private donations, government grants) that do not add up to the reported level of total revenues. Likewise, for some charities, the expenditures do not add up correctly. I purge all of these observations from the data set, leaving 321,094 observations (95 percent) and 75,226 charities (98 percent). Though the data are a panel, it is a very unbalanced one. To compensate, I include in the base case regressions only those charities that appear for all six years, leaving 175,242 observations (55 percent of the previous total) and 29,207 charities (39 percent). In the following, I consider how limiting the data set to a balanced panel affects both the summary statistics and the regression results. Finally, I eliminate charities that ever report a negative value for private donations, government grants, or program service revenue, eliminating an additional sixty-nine charities (only 0.2 percent). Regressions are performed on this cleaned data sample as well as on a number of subsamples that eliminate certain types of charities or observations, as described in the following. In general, the results that I obtain in the base case are comparable across these different sample specifications. This is especially important to note for this application, since previous authors have found that when working with data from Form 990s, the choice of sample matters greatly for the results.
Previous authors have found discrepancies or errors in similar data sets, especially in the identifier variables for the charity’s type (NTEE code) and state. Among the charities in the balanced panel, none change their NTEE code over the six-year period. Some charities (1,206 or 4.1 percent) do change states. This could be due to data error, which is problematic since many of my control variables and instruments are at the state-year level. Or, it could result in the charity actually relocating, in which case I want to take advantage of that variation. I identify the charities that are erroneously coded as changing states in the following way. Of the charities that are reported to change states, 830 of them (68.8 percent) have the same state listed for five of the six years, and the year in which the state is listed differently is not the first or last year of the sample. As it is unlikely that a charity would relocate one year and then relocate back the following year, I interpret these observations as errors and replace the state variable with the state from the charity’s other five observations. The remaining 376 charities either moved in the first or last years of the sample period or had more than one year in a different location, and I do not change the state variables for them. An inspection of the scans of the original 990 forms for several of these charities supports this distinction between those that actually moved and those that were inaccurately reported. 10
Table 1 presents revenues aggregated into four main categories and compares summary statistics from the full, uncleaned data set to those from the smaller sample used in the analysis. Private donations include direct and indirect public support. 11 Government grants and program service revenue have their own categories, 12 and the remaining revenues are classified as “other.” I also present statistics on charities’ reported fund-raising expenditures. Table 1 shows that the mean values are all much higher than the median values, and even the 75th percentile values, suggesting a data set that is skewed toward high-revenue organizations. The differences between corresponding statistics in the full data set and the cleaned sample are small; the mean values of all variables are smaller and the median and 75th percentiles are larger in the limited data compared to the full set. The limited data are slightly less skewed than the full data, and hence, performing econometric analyses on this limited sample may overemphasize the effect from larger charities.
Summary Statistics—Charity Revenues and Fund-raising.
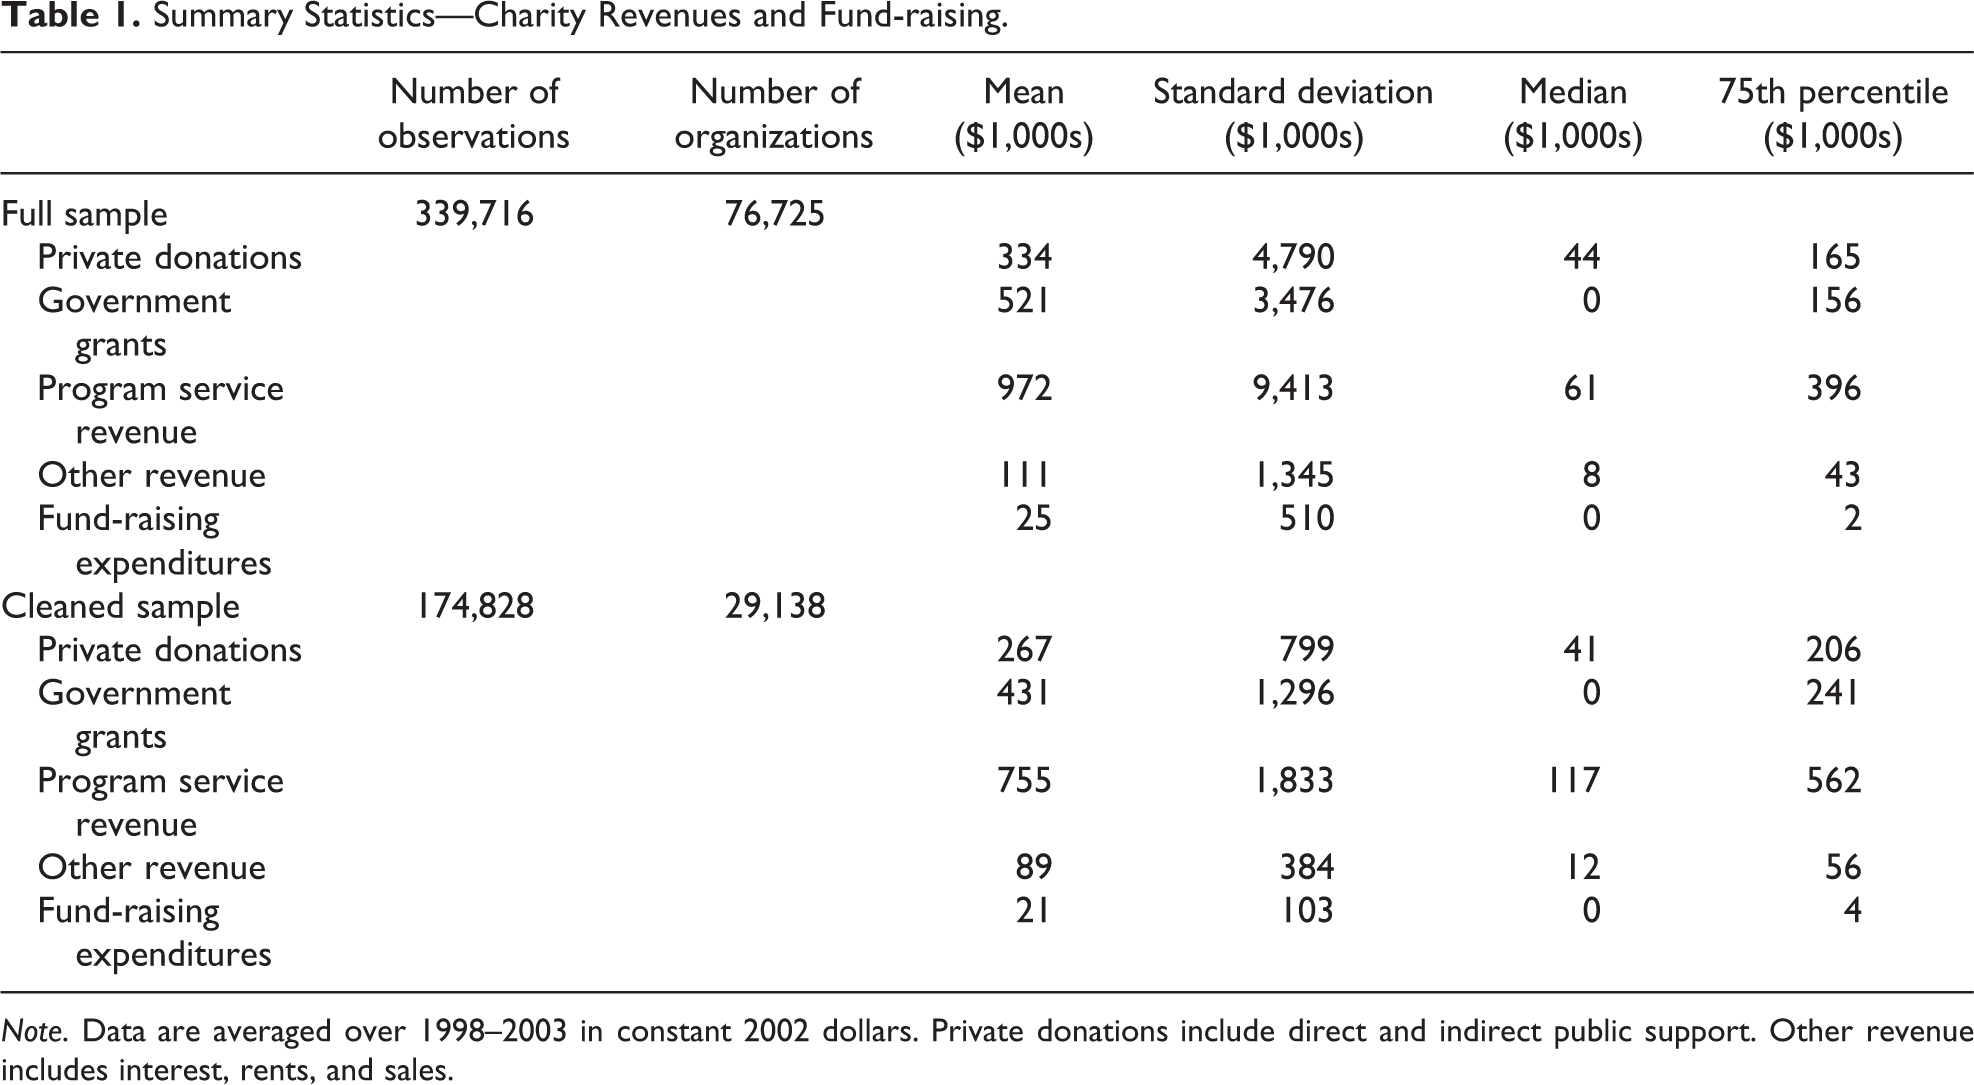
Note. Data are averaged over 1998–2003 in constant 2002 dollars. Private donations include direct and indirect public support. Other revenue includes interest, rents, and sales.
Econometric Strategy
Fundamentally, two different empirical questions are investigated. First, do government grants affect private donations to charities? Second, do private donations affect government grants? While numerous papers have tested for causality in the first direction, no paper has examined causality in the opposite direction using panel data on a large number of charities. Because of these two questions, I run two separate regressions, one in which the level of private donations to a charity is the dependent variable and the level of government grants is an independent variable, and one with those two variables reversed. Initially I merely identify whether crowding out or crowding in occurs in either direction, and I do not attempt to account for its source. Following these initial regressions, I will test whether any crowding in that I find is explained by signaling. I show that crowding in is stronger among those charities for which less information is known by donors, that is, younger charities.
The estimating equations take the following form:
The estimate of β will clearly be biased since both private donations and government grants are determined endogenously. A common shock, for instance an increase in demand for a charity’s services, may affect both donations and grants simultaneously in the same direction, biasing the β upward. Alternatively, endogeneity could bias the estimate downward. A restructuring of the charity could cause it to reallocate its funding between donations and grants, which would create a negative correlation between these two values not due to crowding out. To overcome this bias and identify β, I utilize instrumental variables. (Regressions in both directions without using instrumental variables are presented in the online appendix.)
Two separate sets of instrumental variables are required: one for each direction of causality. First, in the regression where private donations are the dependent variable and government grants are the endogenous regressor, appropriate instruments must be relevant (affecting the level of government grants) and excludable (not directly affecting the level of private donations). Furthermore, because I am effectively estimating simultaneous equations, the instrument for government grants should also not belong as an instrument in the first stage of the private donations equation. For this set of instruments, I use state-year-level measures of government transfers to individuals from Supplemental Security Income (SSI) programs.
14
This represents the overall level of transfers and government giving in a state in a particular year. Some states may be more “generous” in their giving, and these instruments ought to proxy that.
15
The generosity of government is determined in a political process, and thus, it may be directly correlated with private donations and fail the exogeneity requirement: more generous donors elect more generous governments. This is controlled for by the inclusion in the set of controls
Second, instrumental variables for private donations ought to affect private donations but not government grants directly. I use one instrument for private donations, available at the charity-year level: membership dues. Funding from individuals can come from two sources, listed separately on the Form 990: direct public support (donations) and dues. Though it may appear that membership dues are just an alternative way to classify private contributions, there are well-defined differences between the two funding sources, as delineated in the Form 990 instructions. Charities are instructed to report as dues only those payments that “compare reasonably” with available membership benefits. Examples of benefits listed in the instructions include subscriptions to publications or newsletters and reduced-rate admissions to events. If membership dues exceed the value of such benefits, then charities are instructed to report the difference in value as donations, not dues. 16 Dues are thus what members pay for the private goods consisting of membership benefits, not the public good that is the charity’s primary purpose. The amount of dues that a charity receives is likely to be correlated with the amount of private donations received, since charities with higher membership bases may get more of both types of revenues. However, given that charities provide public goods only using monies from their contributions and not using monies from dues, the level of government grants ought not to respond to the level of dues. 17
There are several caveats to this instrument choice. First, there may be reporting errors. Though charities are clearly instructed to delineate appropriately between dues and contributions, they may neglect to do so. Second, the instrument may be irrelevant; dues may not correlate with donations. Third, the exogeneity assumption may fail, if governments do in fact respond to the level of dues, treating them as contributions to a public good.
Though the exogeneity assumption cannot directly be tested, the regression results can shed some light on the validity of the identification strategy. On the whole, identification of the effect of government grants on private donations is more successful than identification of the effect in the other direction. First-stage results from both regressions are available in the online appendix. The F-statistics for the significance of the instruments in the first stage are all greater than 10 for the regressions where government grants are the endogenous regressors and SSI transfer payments are the instruments, but the F-statistics are less than 10 for most of the first-stage regressions where private donations are the endogenous regressors and dues are the instrument. This suggests that dues may be a weak instrument for private donations and that those regression results ought to be interpreted with caution. In fact, in the second-stage regression estimating the effect of private donations on government grants, the coefficient is not consistently found to be significantly different from zero.
An additional consideration involves the response of the charity itself to grants and donations. In particular, a growing literature examines how a charity’s fund-raising expenditures change in response to government grants (Andreoni and Payne 2003, 2011). Fund-raising is therefore included in both sets of regressions. Furthermore, since fund-raising expenditures are endogenously determined by the charity, I add instrumental variables for fund-raising. I use two different variables at the charity-level as instruments for fund-raising expenditures. First, I use the amount of administrative expenditures reported by a charity on the Form 990. 18 Since the same personnel can be employed to do both administrative and fund-raising tasks, the two types of expenditures may be correlated. In years when an organization has a higher level of management expenses, it is likely to be able to spend more effort and money on fund-raising; the first-stage regression results support this claim. Furthermore, the level of private donations that a charity receives in a given year ought not to be directly affected by management expenses, since management expenses are reported separately from fund-raising expenses. 19 The administrative expenditures instrument may also correct for measurement error, if misclassification of fund-raising as administrative expenses is organization specific. Second, I use the total liabilities of the charity reported in the current year. This instrument measures the financial security of the organization, which will help determine its fund-raising strategy independent of private or public funding. A charity facing a less secure financial status (as measured by higher total liabilities) may seek to increase its fund-raising expenditures to compensate; this claim is verified in first stage regression results. A charity’s financial security could directly affect its level of private donations if donors respond to this level of financial security (e.g., a donor does not want to give money to a charity that is on the verge of collapse). However, it is unlikely that donors have information on the contemporaneous financial conditions of a charity, at least not to the extent that a charity has. Donors may perceive an overall level of a charity’s well-being, but this is controlled for with a charity-fixed effect. 20 Fund-raising is treated as an endogenous regressor in all regressions where private donations are the left-hand-side variable; results are comparable when fund-raising is instead treated as exogenous. In the regressions where government grants are the left-hand side variable, fund-raising is initially treated as exogenous but treated as endogenous in later robustness checks. In those regressions, the choice of whether to treat fund-raising as exogenous or endogenous does substantively affect the results. A final concern is the potential for measurement error, especially in how nonprofits report their fund-raising versus management expenses on their Form 990s. Thornton and Belski (2010) cite concerns with the 990 data and show that donors are influenced by proxies for financial reporting quality.
Finally, control variables
Results
The results for these instrumental variables, fixed effects regressions are presented in tables 2 and 3. Table 2 presents the results from regressions where private donations are the dependent variable and government grants are the endogenous regressor; table 3 presents the results from regressions where these are reversed. In column 1 are the base case results, using the full sample of cleaned data. The tables report the F-statistic for the significance of the instruments in the first stage of the regression, the Hansen overidentification test J-statistic, and the Cragg-Donald F-statistic for weak instruments. The reported standard errors allow for heteroscedasticity and autocorrelation using a Newey-West kernel–based estimator of the variance matrix.
The Determinants of Private Donations.a
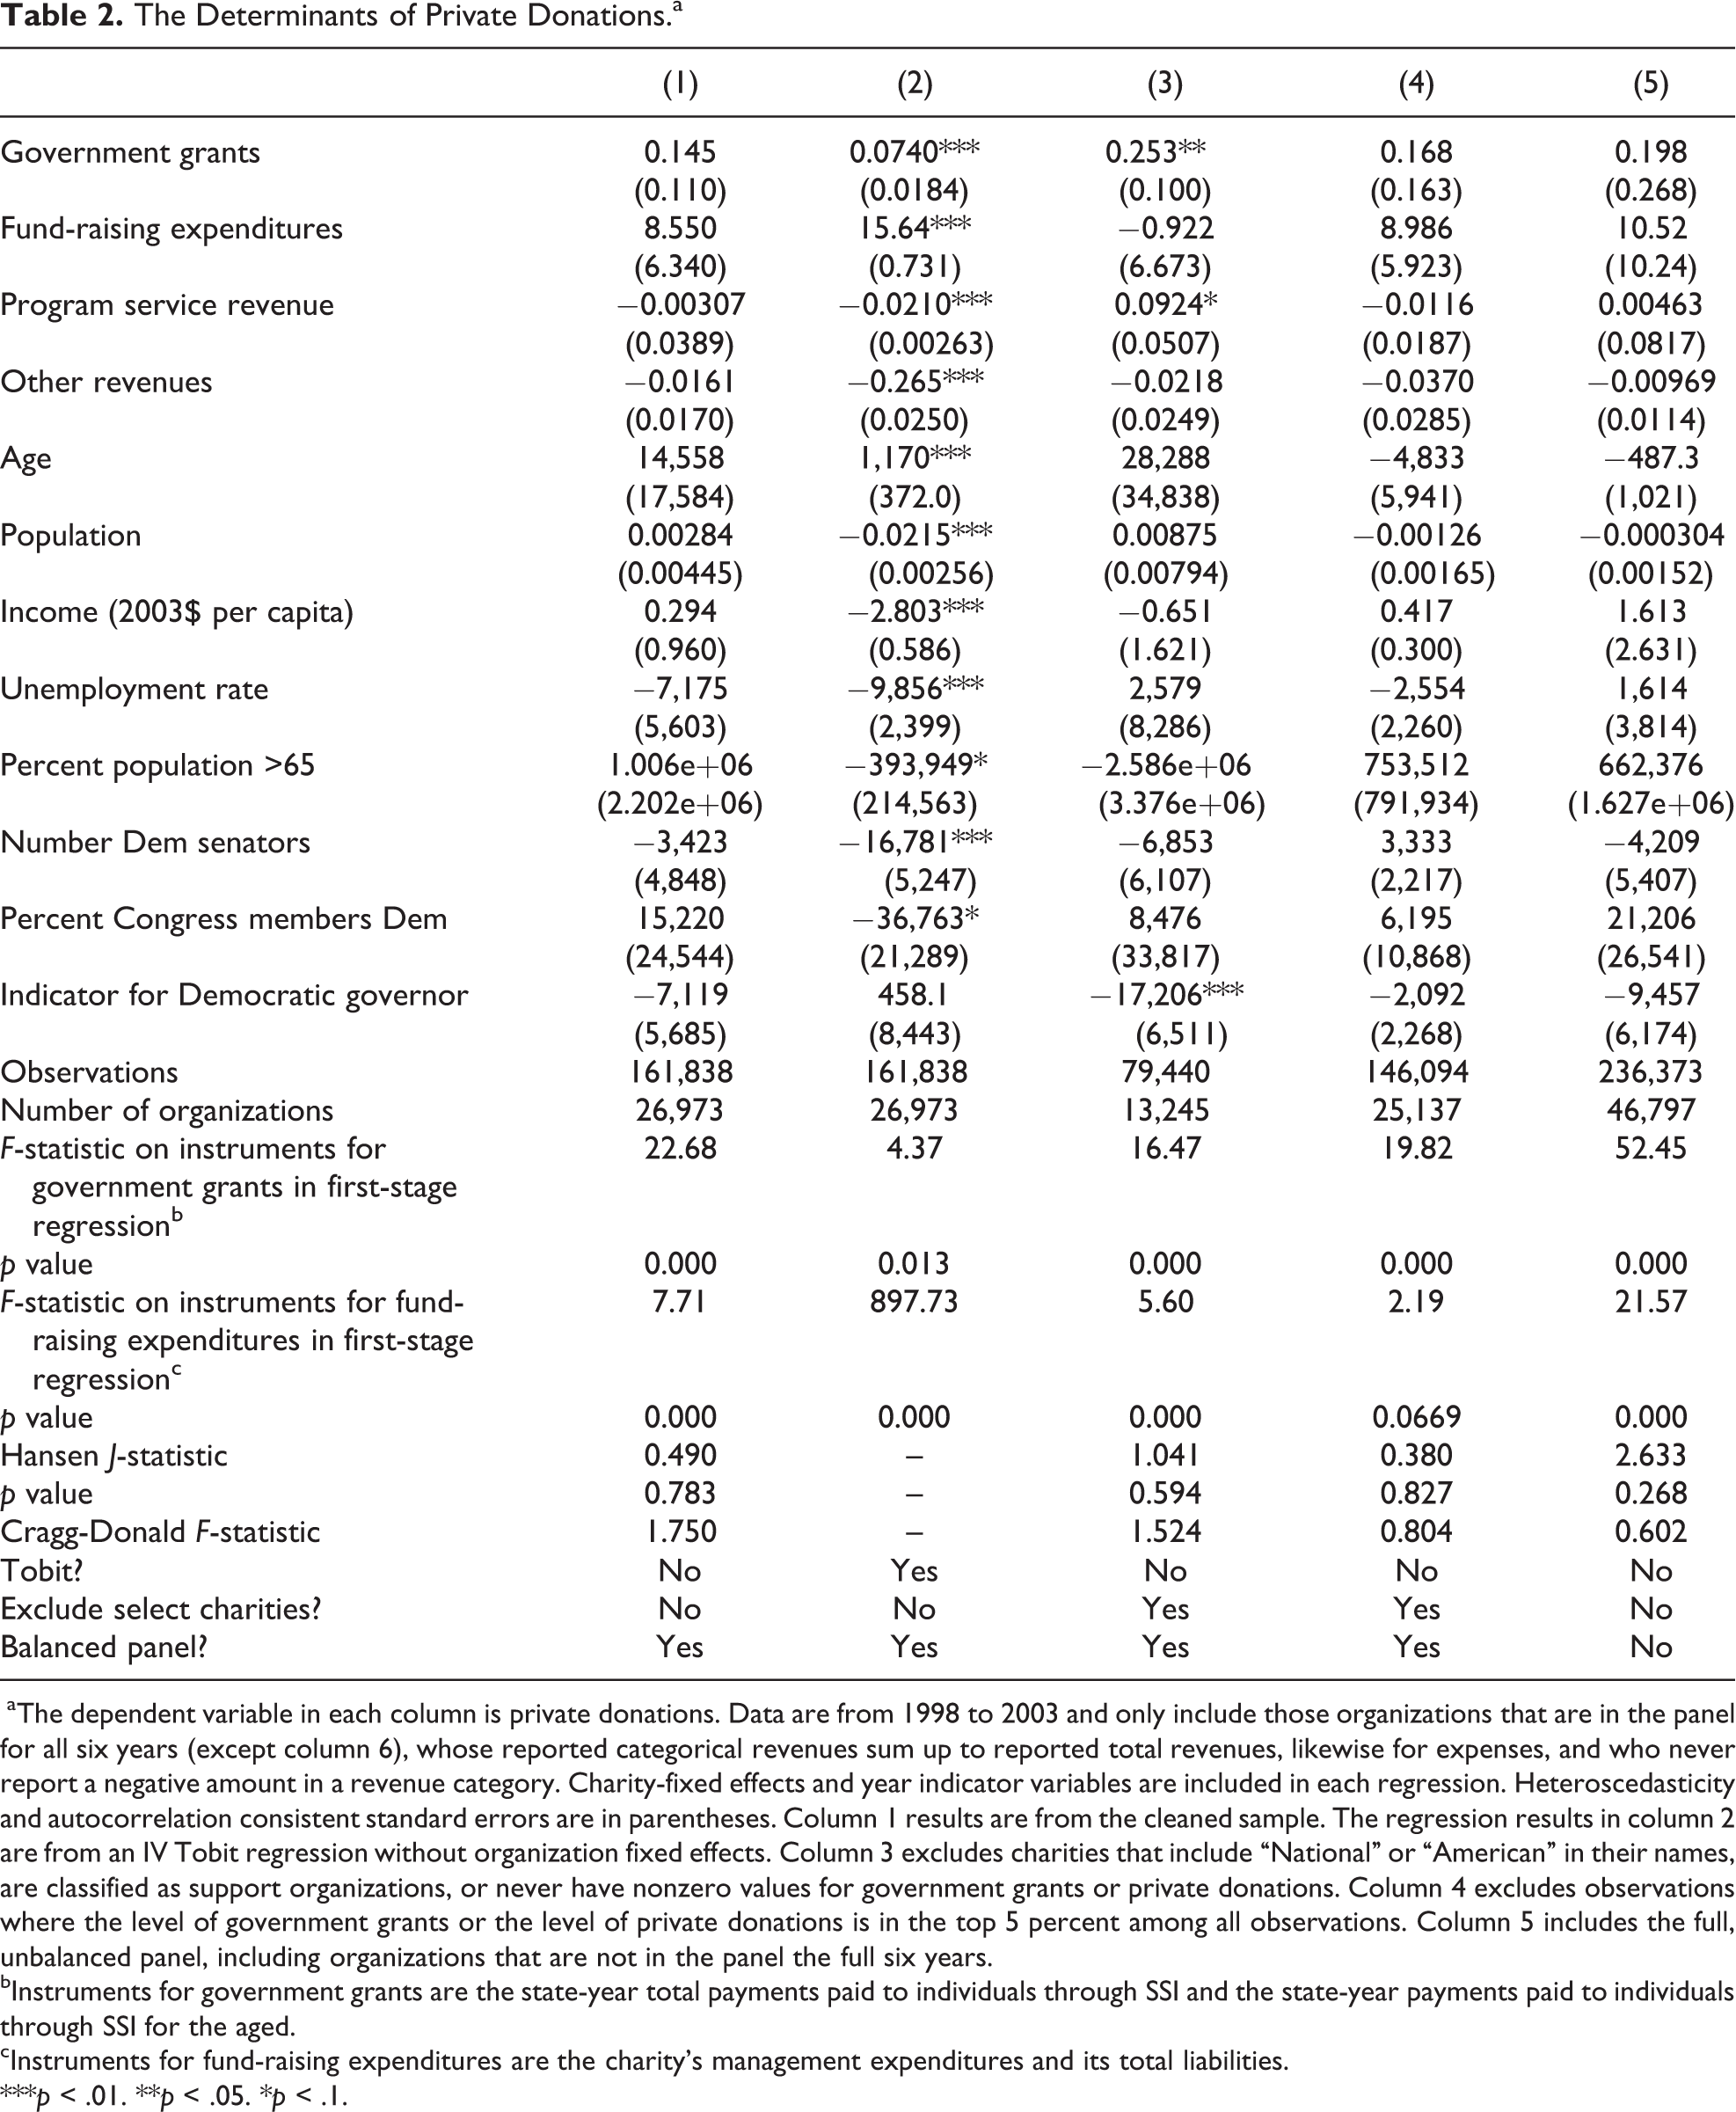
aThe dependent variable in each column is private donations. Data are from 1998 to 2003 and only include those organizations that are in the panel for all six years (except column 6), whose reported categorical revenues sum up to reported total revenues, likewise for expenses, and who never report a negative amount in a revenue category. Charity-fixed effects and year indicator variables are included in each regression. Heteroscedasticity and autocorrelation consistent standard errors are in parentheses. Column 1 results are from the cleaned sample. The regression results in column 2 are from an IV Tobit regression without organization fixed effects. Column 3 excludes charities that include “National” or “American” in their names, are classified as support organizations, or never have nonzero values for government grants or private donations. Column 4 excludes observations where the level of government grants or the level of private donations is in the top 5 percent among all observations. Column 5 includes the full, unbalanced panel, including organizations that are not in the panel the full six years. bInstruments for government grants are the state-year total payments paid to individuals through SSI and the state-year payments paid to individuals through SSI for the aged. cInstruments for fund-raising expenditures are the charity’s management expenditures and its total liabilities.
***p < .01. **p < .05. *p < .1.
The Determinants of Government Grants.a
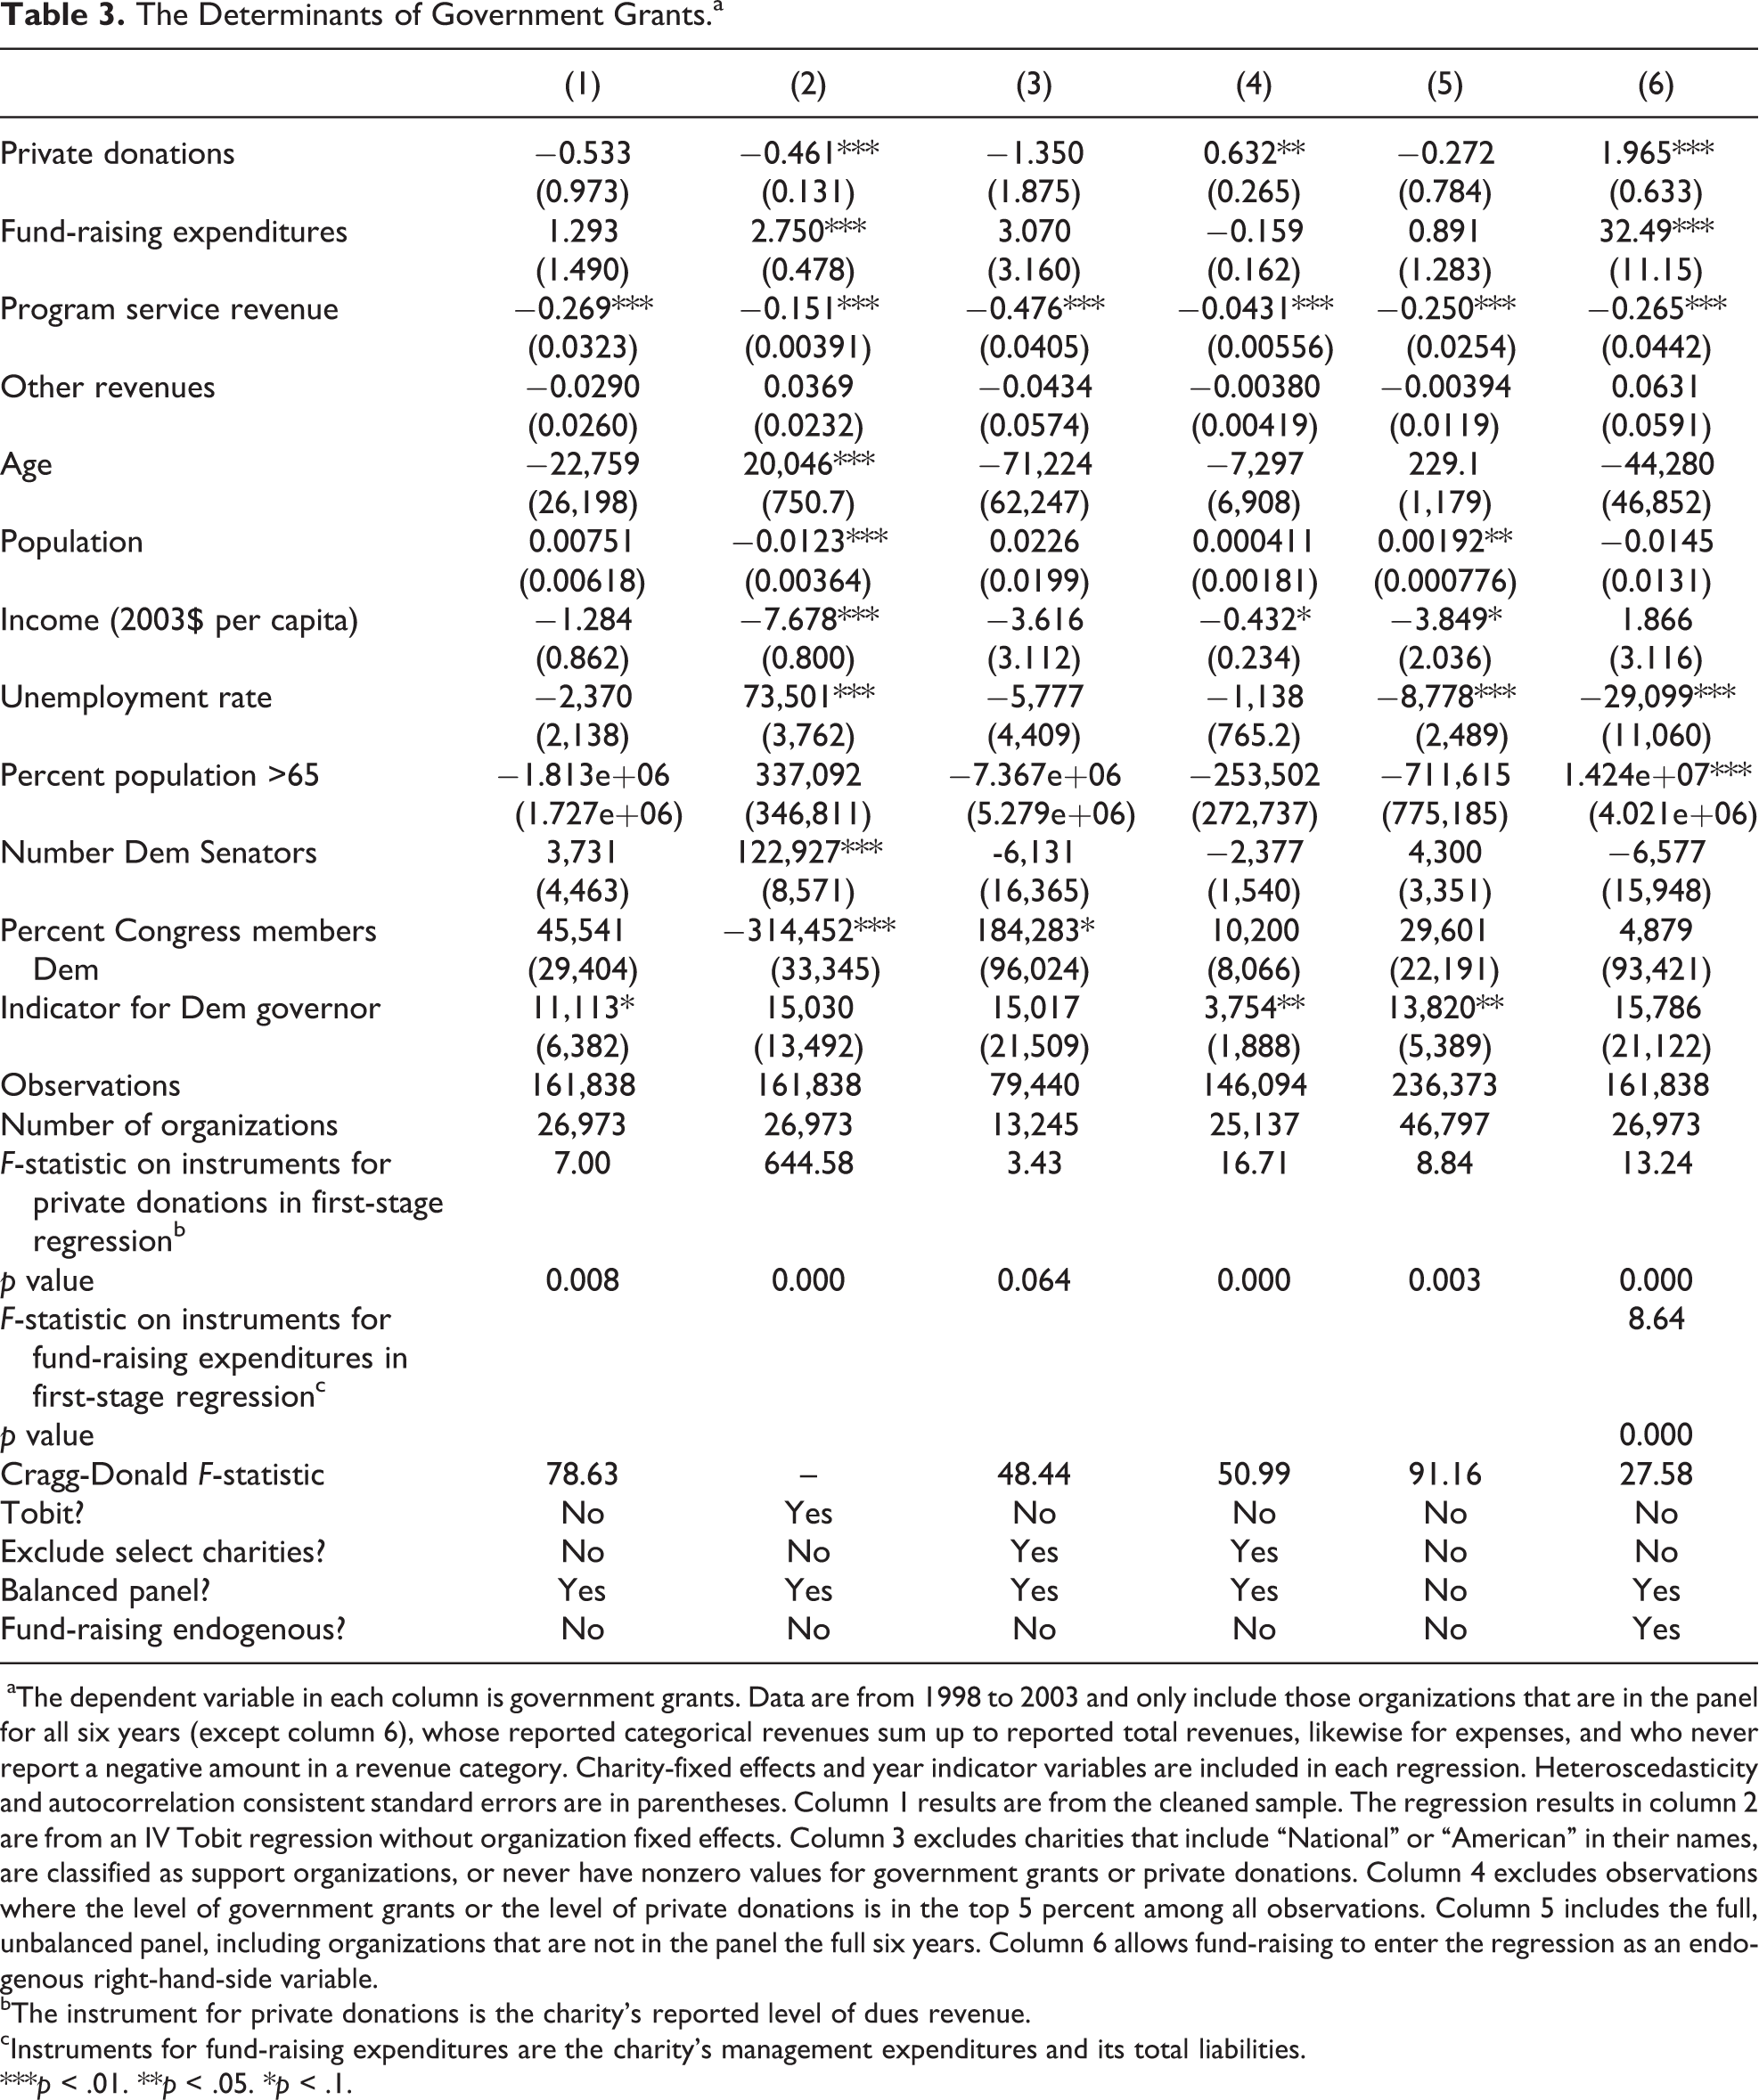
aThe dependent variable in each column is government grants. Data are from 1998 to 2003 and only include those organizations that are in the panel for all six years (except column 6), whose reported categorical revenues sum up to reported total revenues, likewise for expenses, and who never report a negative amount in a revenue category. Charity-fixed effects and year indicator variables are included in each regression. Heteroscedasticity and autocorrelation consistent standard errors are in parentheses. Column 1 results are from the cleaned sample. The regression results in column 2 are from an IV Tobit regression without organization fixed effects. Column 3 excludes charities that include “National” or “American” in their names, are classified as support organizations, or never have nonzero values for government grants or private donations. Column 4 excludes observations where the level of government grants or the level of private donations is in the top 5 percent among all observations. Column 5 includes the full, unbalanced panel, including organizations that are not in the panel the full six years. Column 6 allows fund-raising to enter the regression as an endogenous right-hand-side variable. bThe instrument for private donations is the charity’s reported level of dues revenue. cInstruments for fund-raising expenditures are the charity’s management expenditures and its total liabilities.
***p < .01. **p < .05. *p < .1.
The coefficient of interest in the regressions in table 2 is that of government grants. The expected sign of this coefficient is ambiguous. Absent government signaling of charity quality, it should be negative, indicating crowding out. Signaling can cause crowding in, making the coefficient positive. In the first column, the coefficient is positive though not quite statistically significant (the p value is .190). This is evidence for crowding in rather than crowding out, consistent with results found by Khanna and Sandler (2000) and Payne (2001). Neither program service revenue nor other revenues are significantly correlated with donations. Fund-raising expenditures increase private donations. The coefficients on the state- and county-year level controls are generally insignificant.
Columns 2 through 6 present robustness checks using different specifications or by contracting or expanding the data sample. Column 2 reports results using a Tobit specification to account for the left-censoring at zero of the dependent variable. This Tobit specification, however, does not include an organization fixed effect. The point estimate of the coefficient on government grants is about halved compared to the regression in column 1, but it is significant since its standard error is much smaller. 21
Columns 3 through 5 explore the robustness of these results to contracting or expanding the data set. It is possible that crowding out or crowding in is only applicable to a subset of the charities, for two reasons. First, while some of the controls and instruments are at the state-year level, not all of the charities operate only in the state where they are registered. Many are national organizations that accept donations and possibly government grants from other states. For these charities, these instruments and controls are unlikely to be good predictors. Though I cannot know for certain which organizations are national and which are local, column 3 excludes those whose names begin with “National,” “American,” or “North American.” Column 3 also excludes organizations classified as support organizations under the NTEE taxonomy. 22 These organizations do not directly provide services but support organizations or individuals who do provide services through management and technical assistance, fund-raising, and public policy analysis. Second, many of the charities receive no government grants throughout the entire six-year sample period, and many receive no private donations throughout the period. Such charities are likely to receive no funding at all from one of these two sources, even in response to a change in the other funding source, and thus, I also exclude them from the regressions in column 3. Limiting the sample in this way increases the magnitude of the coefficient, and it becomes significant at the 5 percent level.
Column 4 presents regression results when the data set is limited using a different criterion. Outliers are always problematic, and perhaps they are especially problematic for these data. I have already eliminated charities and observations for which there is clear evidence of accounting or reporting error, for example, those whose summed categorical revenues do not add up to the reported total revenues. Even absent these obvious irregularities, though, one may worry about charities reporting unusually high levels of donations or grants. In column 4, I eliminate the influence of the largest charities by dropping from the sample those observations whose private donations are in the top 5 percent of the total distribution and those observations whose government grants are in the top 5 percent. This refinement does not substantially change the regression results compared to column 1. Finally, under data cleaning, a large fraction of organizations was removed for not being in the panel for all six years. Column 5 thus replicates the regression results without removing charities based on the number of years in which they appear in the data set. The coefficient of interest, on government grants, is somewhat larger than in column 1 but is not significant, since the standard error is larger (despite the larger sample size).
Overall, table 2 suggests that a dollar increase in government grants to a charity increases the charity’s private donations by about 10 to 30 cents. 23 Though generally not quite significant at the 10 percent level, the results are comparable across different specifications of the data sample. I do not claim that one specification is preferred over any other, but rather I want to investigate whether crowding in varies for different specifications of the sample. Prior studies of crowding out or crowding in typically present results for only a small subset of the raw data available. For instance, in Andreoni and Payne (2003), of the original sample of social service charities, fully 92 percent are dropped from the analysis for one reason or another. In my results, the most significant coefficients arise from the regressions where the sample is limited (columns 3 and 4), suggesting that the sample selection employed by Andreoni and Payne (2003) and other papers may be affecting the significance of their results, if not the magnitudes.
Table 2 presents the F-statistic for the joint significance of the instruments in the first-stage regression; they are strongly significant in all columns except the second. Table 2 also presents the Hansen J test statistic from a test of overidentifying restrictions, possible because the number of instruments exceeds the number of endogenous regressors. The null hypothesis of this test is that the instruments are valid, so a rejection calls into question the validity of the instruments. The null hypothesis cannot be rejected in any columns. Finally, table 2 presents the value of the Cragg-Donald F-statistic from Stock and Yogo (2005), a test for weak instruments. It should be noted that, though the F-statistics on the instruments from the first-stage regression are high, the Cragg-Donald F-statistics are quite low compared to their critical values.
Table 3 presents the regressions in the opposite direction, where the level of government grants is the dependent variable and the level of private donations is the endogenous regressor. Columns 1 through 5 mimic the respective columns in table 2. Column 1 is the base case, column 2 uses IV Tobit, columns 3 and 4 limit the sample as described earlier, and column 5 includes the unbalanced panel. In addition, table 3 includes a sixth column, in which fund-raising expenditures are treated as endogenous and instrumented for with the same measures used in table 2. The coefficient of interest is on private donations and is negative in four of the six columns, but only significantly so in one column. The magnitudes of the point estimates are large, suggesting that private donations crowd out government grants by 30 percent to 170 percent. But this evidence is weak, because of both the lack of a significant coefficient and the weak instrument issues described earlier. Furthermore, the regression results from column 4, which eliminate the top 5 percent of charities measured by government grants or private donations, give a positive coefficient that is significant at the 5 percent level. The coefficient in column 6, in which fund-raising is treated as endogenous, is significantly positive and large. The results in this direction are thus both mixed and weak. Other regressors are more significant. Program service revenue is negatively correlated with government grants, as is the county unemployment rate. The large Cragg-Donald statistics indicate that, though the instruments are somewhat weak, the 2SLS results are not misleading. 24
In addition to being comparable across these alternative sample specifications, the results for the regressions where private donations are the dependent variable are comparable when estimated by limited information maximum likelihood (LIML) rather than 2SLS, though these regression results are not reported. These results are also unaffected by estimating the equations simultaneously using 3SLS. 25
Crowding in by Charity Age
The analysis finds evidence that government grants crowd in private donations for these charities. But is this due to signaling? The signaling explanation depends upon uncertainty among donors as to the charity quality. Thus a measure of uncertainty about charity quality will be beneficial in testing the signaling theory: charities about which individuals know less should experience larger crowding in effects than charities that are well known. How can the uncertainty about a charity be measured?
I use the age of the charity. Older charities are likely to be better known by donors. If so, the signaling effect for older charities should be smaller than for younger charities. By interacting a charity’s age with the value of government grants, I can determine if the crowding in from government grants depends on age. 26 The results for this exercise are presented in table 4, which reports results from regressions where private donations are the dependent variable, government grants and fund-raising expenditures are endogenous regressors, and the same instruments and controls are used as in table 2 (though not reported). Column 1 includes the cleaned data sample used in column 1 of table 2, and it also includes an interaction term between age and grants. Column 2 presents IV Tobit regression results with the age-grant interaction, and column 3 limits the sample in the same way as does column 3 in tables 2 and 3. 27 Columns 4 through 6 consider different specifications of the age-grant interaction. Column 4 includes a quadratic term in age, column 5 includes indicators for the four quartiles of the age distribution and their interactions with grants (the first quartile is the omitted dummy), and column 6 includes the natural log of age and its interaction rather than the level.
The Effect of Age on Crowding In.a
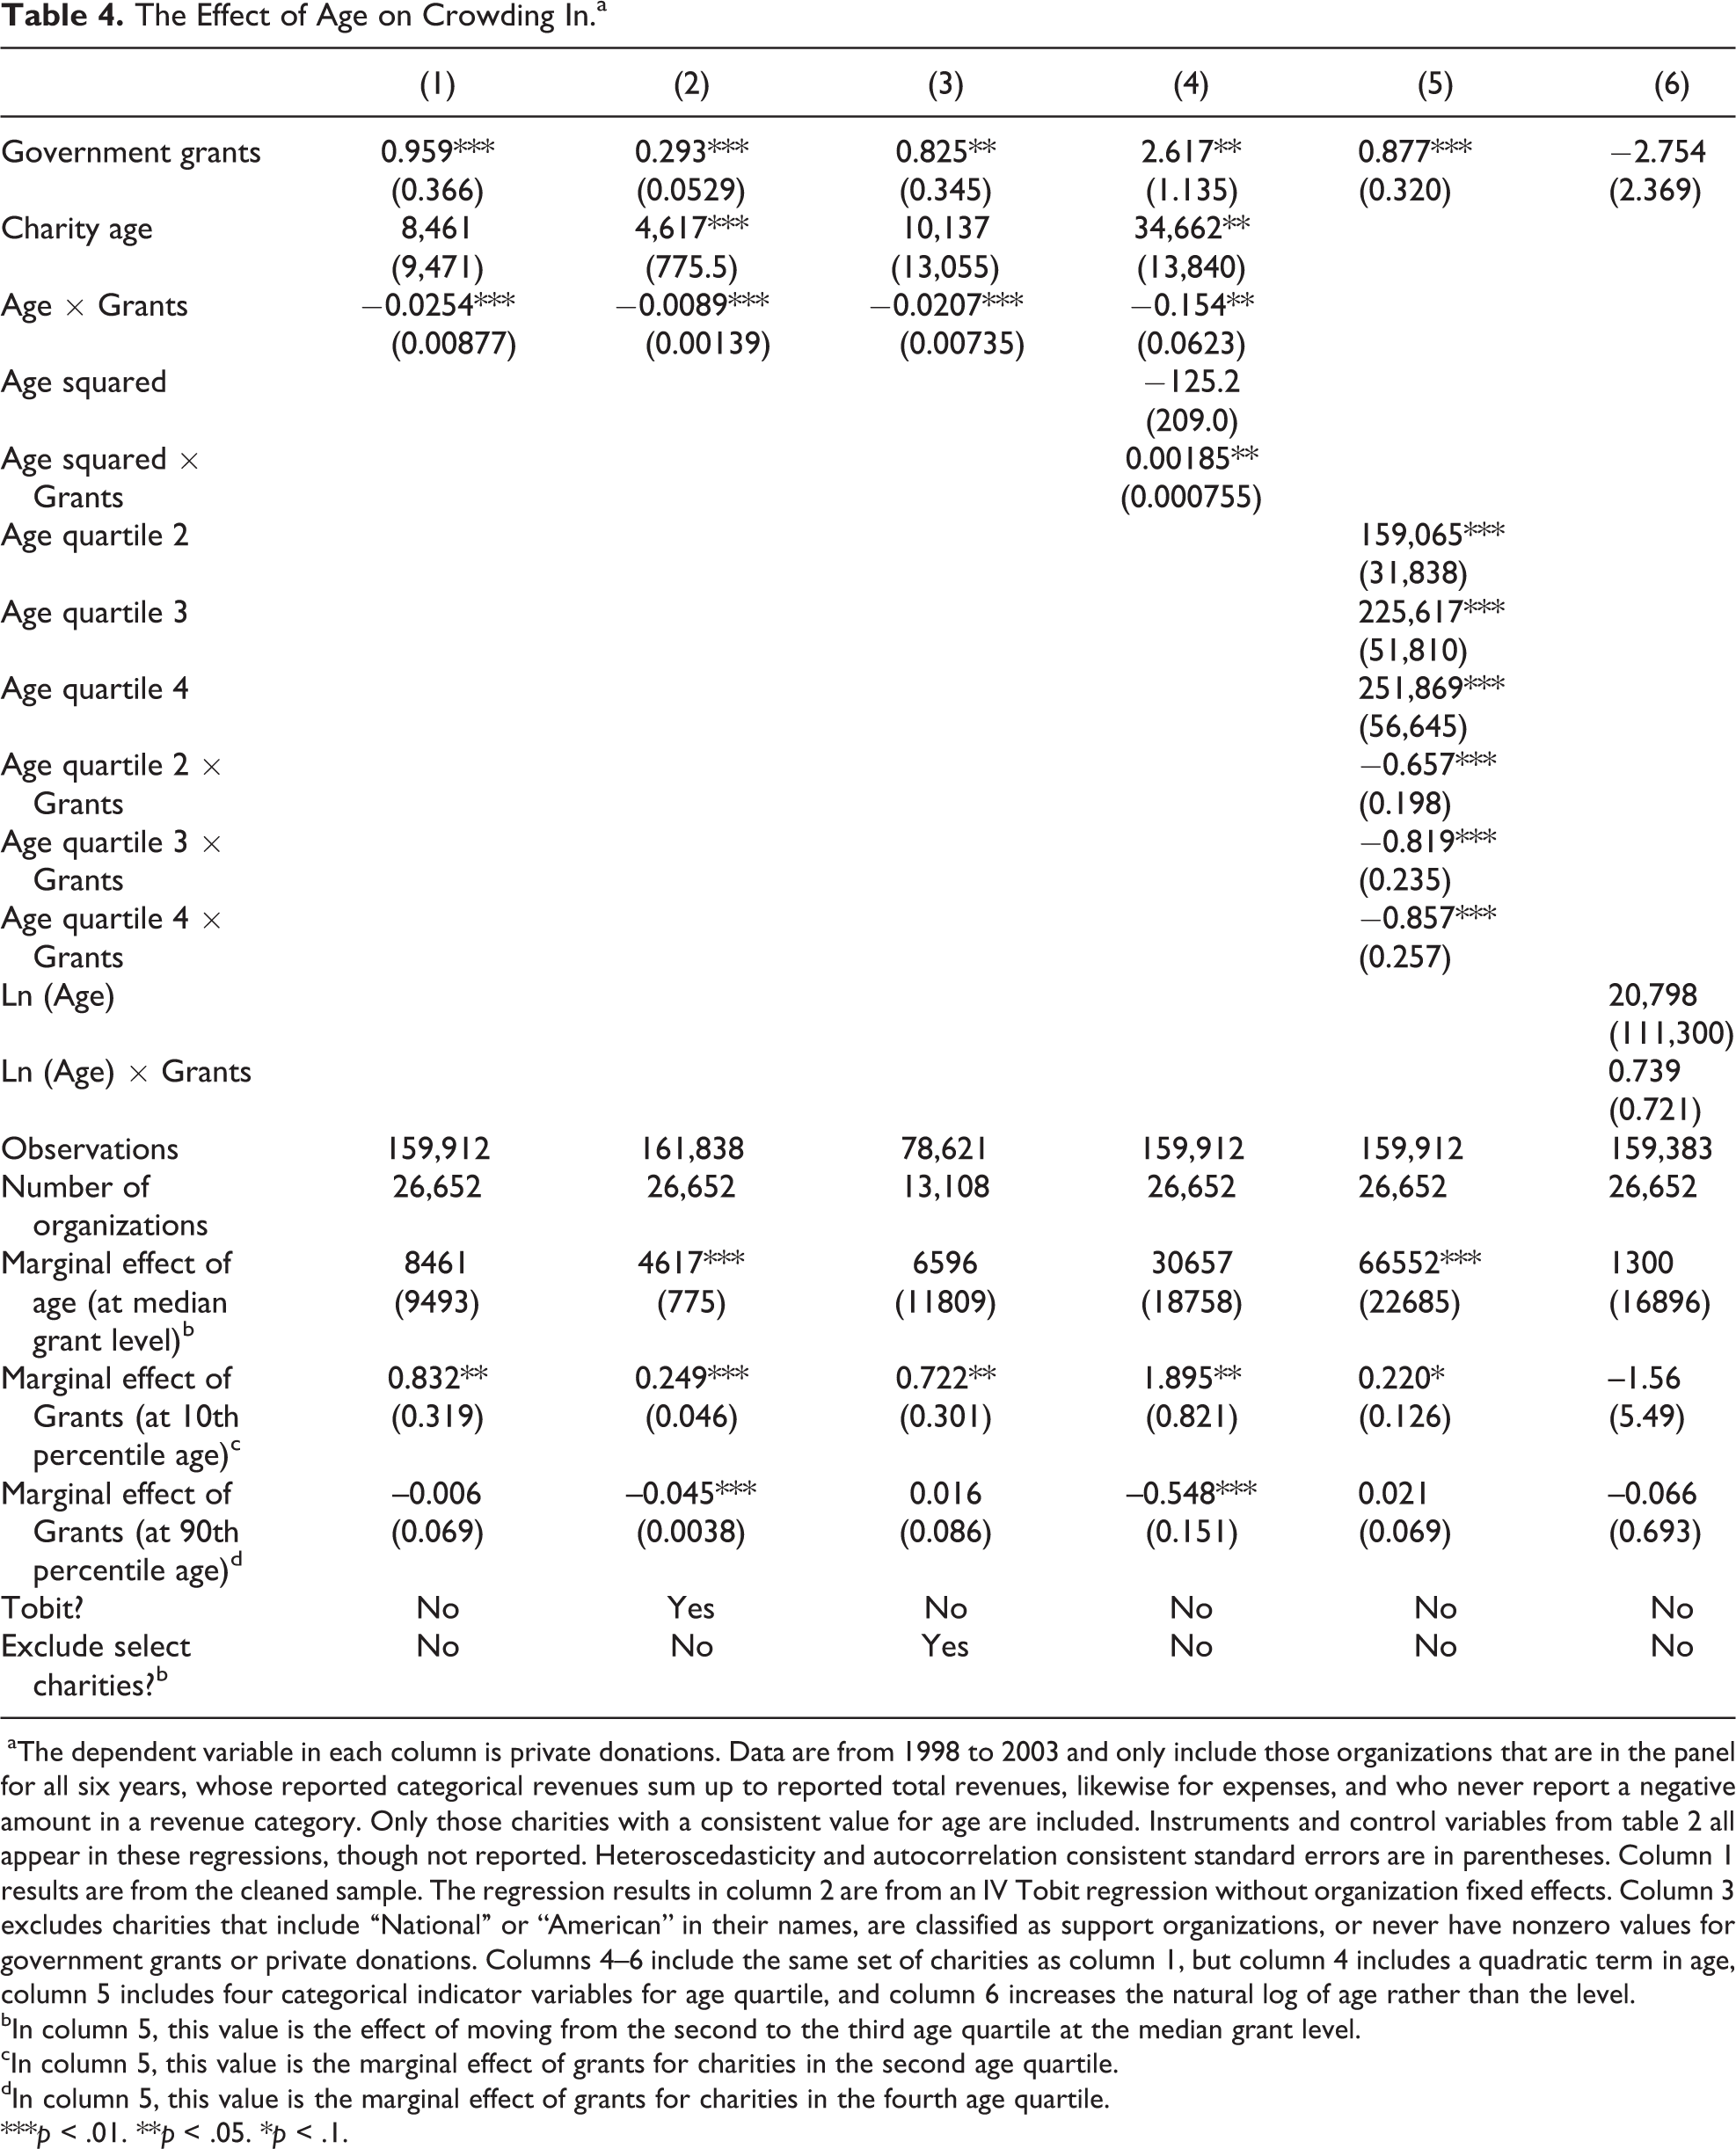
aThe dependent variable in each column is private donations. Data are from 1998 to 2003 and only include those organizations that are in the panel for all six years, whose reported categorical revenues sum up to reported total revenues, likewise for expenses, and who never report a negative amount in a revenue category. Only those charities with a consistent value for age are included. Instruments and control variables from table 2 all appear in these regressions, though not reported. Heteroscedasticity and autocorrelation consistent standard errors are in parentheses. Column 1 results are from the cleaned sample. The regression results in column 2 are from an IV Tobit regression without organization fixed effects. Column 3 excludes charities that include “National” or “American” in their names, are classified as support organizations, or never have nonzero values for government grants or private donations. Columns 4–6 include the same set of charities as column 1, but column 4 includes a quadratic term in age, column 5 includes four categorical indicator variables for age quartile, and column 6 increases the natural log of age rather than the level. bIn column 5, this value is the effect of moving from the second to the third age quartile at the median grant level. cIn column 5, this value is the marginal effect of grants for charities in the second age quartile. dIn column 5, this value is the marginal effect of grants for charities in the fourth age quartile.
***p < .01. **p < .05. *p < .1.
In all columns of table 4 save the last, the coefficient on grants is significantly positive and the coefficient on the interaction term or terms is significantly negative. The coefficient on government grants does not represent the marginal effect of grants since it does not include the interaction. At the bottom of table 4, I report the marginal effect of grants evaluated at the median charity age as well as the marginal effect of age evaluated both at the 10th percentile and 90th percentile of grants. For the Tobit specification, these are the marginal effects of the unobserved, censored variable. The marginal effect of age is positive but not significant in most columns. It is significant in column 4, which includes the quadratic in age. This suggests diminishing marginal returns to age. The marginal effect of grants at the 10th percentile of age is significantly positive in all columns but the last, and it varies between about 0.22 to 1.90, higher than the marginal effects in table 2 when the interaction term is not included. At the 90th percentile of age, the marginal effect of grants is either negative or indistinguishable from zero. The negative coefficient on the interaction term indicates that the crowding in effect decreases by about 1 to 2 cents on the dollar per year the charity has been around. In the first three columns, the ratio of the coefficient on government grants and the coefficient on the interaction term indicates that grants crowd in private donations for charities younger than forty years old and crowd out donations for charities older than forty. In column 4, which includes the quadratic, the year at which grants start crowding out is about twenty-five years. Column 5 shows that, relative to the youngest age quartile (up to age nine years), the crowding in from grants is lower in all other quartiles. The marginal effect of grants on donations is not significantly different from zero for age quartiles 3 and 4 and is only significantly positive at the 10 percent level for age quartile 2. These results support the theory that older charities receive less of a signal from receipt of grants, and so the value of crowding in is less. 28 The exception is column 6, where age enters in a log form. Here, no significant effects from age or grants arise. 29
Lagged Grants
The econometrics are static. Since charities exist for many years, the effects from crowding out or from signaling are likely to last for more than just a single year. It thus seems appropriate to consider dynamic extensions of the empirical results. One would expect that the signaling effect is likely to be cumulative over time: a grant signaling high quality in period t will positively influence donations not just in period t but also in periods t + 1, t + 2, and so on. This is because the quality of a public good is persistent over time. Likewise the stock of grants received up to a point of time is a measure of the degree of quality certification. A grant in a particular year is a noisy signal, but the cumulative sum of grants has less noise and indicates sustained quality of an organization. Consider instead not the signaling effect but the classic crowding-out effect. Whether or not this effect is cumulative or merely contemporaneous depends upon whether the public good is durable or transient in impact. If transient, then the crowding out from government grants in period t will negatively affect private donations only in period t. If the public good is durable, then the government grants in period t will crowd out donations in future periods as well. In addition, without intertemporal separability of utility, there are potentially more dynamic effects. Thus, the effects of government grants on private donations may be long-lasting.
This is tested empirically in table 5 by regressing private donations (in year t) on either current government grants (from year t), lagged grants, or cumulative government grants (the sum of grants to a charity in all years up to t – 1). Each regression in table 5 includes all of the same controls and instruments as in table 2, though they are not reported. Column 1 reports results from a regression that includes the one-year lag of government grants as the endogenous regressor (where the instruments are also lagged by one year); the coefficient is not significant. In column 2, both current and one-year lagged grants are included. The current level of grants has a positive coefficient, and the one-year lag has a negative coefficient. This may represent a mean reversion among charities’ timing in responses to grants. Another complication is that grants may be multi year but reported entirely in the year that the grant was approved. Column 3 includes a one- and two-year lag of grants. Both are negative and insignificant, and the coefficient on current grants is positive and only significant at the 13 percent level. Finally, column 4 includes current and cumulative government grants. The coefficient on current grants is positive and significant, while the coefficient on cumulative grants is negative with a very small magnitude and low level of significance. On the whole, these results suggest that the crowding in effect is largely contemporaneous, with the possible exception of a one-year lag effect.
Lagged Grants.a
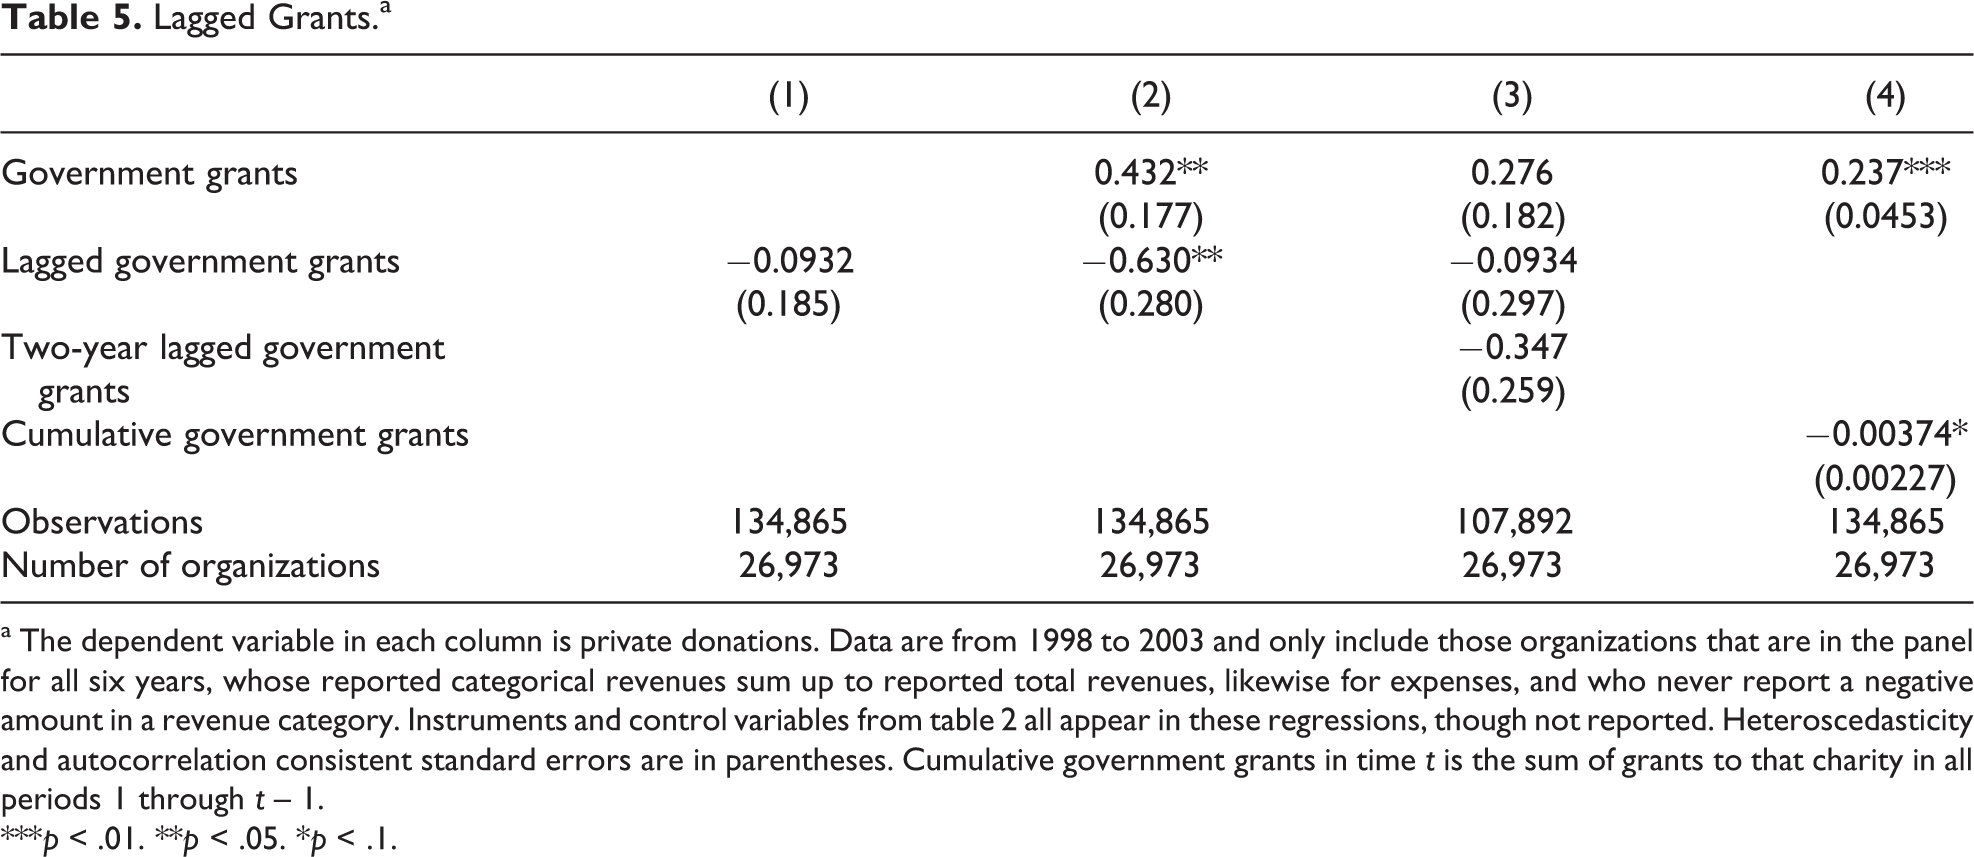
a The dependent variable in each column is private donations. Data are from 1998 to 2003 and only include those organizations that are in the panel for all six years, whose reported categorical revenues sum up to reported total revenues, likewise for expenses, and who never report a negative amount in a revenue category. Instruments and control variables from table 2 all appear in these regressions, though not reported. Heteroscedasticity and autocorrelation consistent standard errors are in parentheses. Cumulative government grants in time t is the sum of grants to that charity in all periods 1 through t – 1.
***p < .01. **p < .05. *p < .1.
An alternative way to look dynamically at the data, to see if current values of donations, say, are affected by lagged values of government grants, is through a vector autoregression (VAR). However, testing for Granger causality in either direction using panel data VAR methods developed in Holtz-Eakin , Newey, and Rosen (1988) fails to find causality from lagged values of government grants or private donations. 30 The data used are annual, limiting how much the effect of timing can be observed. If a grant early in one year affects donations later in the same fiscal year, then that dynamic response cannot be measured with annual data.
Conclusion
The prediction of crowding out of private donations by government grants, proposed in Warr (1982) and Roberts (1984), has had numerous empirical investigations. Many studies, including Kingma (1989) and Payne (1998), find evidence of partial crowding out. Other papers, including Khanna and Sandler (2000) and Payne (2001), find evidence of crowding in. Though their results differ, most of these papers have in common that they use a relatively small sample of charities, and they test for crowding out or crowding in only in one direction.
Here I extend that literature by looking at a large data set of social service charities that file Form 990 with the IRS, which includes nonreligious charities with at least $25,000 in gross receipts. The first main contribution is the empirical examination of crowding out in the opposite direction: private donations crowding out government grants. The second main contribution is to test if contributions can act as signals for charity quality, leading to crowding in. I find evidence that government grants crowd in private donations, and this crowding in appears to be due to signaling, since crowding in is larger for younger charities about which donors know less. The evidence for crowding in or crowding out in the opposite direction is weak.
One empirical extension to this article is to test for signaling from private donations by taking advantage of a distinction between two types of private donations: those from individuals and those from private foundations. Foundations (or trusts, corporations, or estates) are likely to devote resources to researching charities and thus may have more information about charity quality. Their grants may thus act as a quality signal. In fact, charities typically advertise receipt of grants from both governments and private organizations, indicating that they expect these announcements to crowd in donations. Unfortunately, the data from the IRS Form 990s do not allow this level of disaggregating. Contributions from individuals, as well as trusts, corporations, estates, and foundations, are all listed under the same category of “direct public support.” If another data source disaggregated private donations into contributions from individuals and contributions from private foundations, then this extension may give empirical support to private donations acting as signals.
The signaling explanation assumes that governments have better information about charity quality than private donors have. It is unfortunately difficult if not impossible to directly assess this claim. One piece of evidence is the average size of gifts; larger donors are likely to spend more effort gathering information on charity quality than are small individual donors. Data on average gift size are unavailable, but of private donations, 73 percent are from individuals, while only 14 percent are from foundations. 31 Individuals are likely to be less informed than are foundations or governments. Applications for government grants to nonprofits are lengthy, just like government research grant applications. 32 The information that grant-making agencies receive in these applications likely makes them more informed about a charity’s quality than the average individual donor. It is possible that for political reasons government spending on a charity may be unrelated to its quality. For the signaling explanation to be valid, it is not strictly necessary that governments have private information on quality; all that is needed is for private donors to believe that governments do and to change their voluntary level of giving in response.
What are the policy implications of these findings? Governments fund public goods, including but not limited to those provided by charities, and hopefully governments would do so to increase social welfare by overcoming the free rider problem inherent in public goods. The large prior literature on crowding out suggests that governments ought to acknowledge the effect that their giving has on private giving and set their level of grants appropriately. The signaling model and empirical results presented here buttress that suggestion and add that the government’s grants can influence individuals’ donations not only through their effect on the level of the public good provision but also through their effect on individuals’ information about the quality of the public good. Governments should “worry” about the negative effect that their grants can have due to crowding out; they should also “worry” about how the signal value of their grants can have positive effects on giving. The results of this article are also relevant to private donors, especially large donors like foundations that may influence government grants or other private donations through the crowding in or crowding out effects of their contributions.
A number of additional questions clarifying these effects and the appropriate policy responses for governments and private donors may be answered in further research. I have identified that government grants crowd in private donations for the charities in this data set, and I have supplied some evidence that this crowding in arises from the signaling value of the government grants. Further research could verify that signaling is the true cause of crowding in or examine other potential reasons for crowding in, for example, economies of scale in a charity’s provision of public goods. This may be answered using similar data on actual contributions or in a controlled laboratory setting. Further research could also address the question of the disparity in results between the many papers that find crowding out of private donations and the many, including this one, that find crowding in. An extension using data from other charities besides social service charities would be useful. Finally, development of a thorough theoretical model to capture the many effects that could cause crowding in or crowding out in either direction, that may include charity fund-raising, multiple public goods or charities, 33 and dynamics, would be a helpful addition to the literature.
Footnotes
Acknowledgments
The author would like to thank the National Science Foundation Graduate Research Fellowship program for financial assistance, the National Center on Charitable Statistics for data, and Dean Corbae, Jason DeBacker, Don Fullerton, Shama Gamkhar, Dan Hamermesh, Matt Kotchen, Andreas Lange, John List, Rob Williams, Richard Zeckhauser, and seminar participants at the University of Texas, the NBER 2007 Summer Institute, the University of Colorado Environmental and Resource Economics Workshop, and Stanford University for helpful comments.
Declaration of Conflicting Interests
The author(s) declared no potential conflicts of interest with respect to the research, authorship, and/or publication of this article.
Funding
The author(s) received no financial support for the research, authorship, and/or publication of this article.