
Abstract
A comprehensive tax and benefit incidence analysis is presented covering the redistributive fiscal instruments implemented in Mexico in 2008 and 2010, representative of the urban and rural sectors, as well as nationally. The expansion of basic social programs and effectively targeted direct monetary transfers have increased the progressivity of Mexico’s fiscal system in recent years. However, the overall redistributive impact of this system is limited by a comparatively unproductive tax system, a comparatively small share of resources allocated to direct transfers, and a significant share of spending tied to instruments with low redistributive effectiveness (subsidies to contributory social security systems, generalized consumer subsidies, and tertiary public education). The transition to a more effective and equitable fiscal system will require a comprehensive tax–benefits reform designed to improve tax productivity and benefit equity, combining a broad tax base with universally accessible public services and social protection.
The article presents the results of a comprehensive tax and benefit incidence analysis covering the principal redistributive instruments implemented in Mexico in 2008 and 2010, with results representative of the urban and rural sectors, as well as nationally. The analysis covers the principal cash and in-kind social transfers, representing 91.7 percent and 87.4 percent (in 2008 and 2010, respectively) of social spending in Mexico (using the official federal budgetary classification, plus state spending on health and education, minus contributory pensions). Together with the consumer subsidies analyzed, the total resources whose incidence is analyzed represent, respectively, 51 percent and 42.6 percent of primary public spending in 2008 and 2010.
The principal contributions of this analysis are several. First, there is a common methodology. The use of a common methodology shared by the other studies in this volume allows a consistent comparative analysis covering a significant and growing number of countries (Lustig, Pessino, and Scott 2014). Second, there is an urban–rural analysis. A disaggregated incidence analysis of urban and rural populations (2,500 inhabitants or less) is of particular interest in the case of Mexico, as it reveals large gaps in living standards between urban and rural populations and wide differences in the coverage of the tax–benefit system between the two populations. These gaps are closely interrelated. The rural sector accounts for 23 percent of the national population, dispersed in more than 188,000 localities but includes 46 percent (national income poverty lines) to 66 percent (US$2.50 poverty line) of the extreme poor. Finally, the article considers recent changes in the tax–benefit system. The coverage of the tax–benefit system in 2008 and 2010 is of interest because it captures the response of Mexico’s fiscal system to the recent food/energy prices and financial crisis, which involved the expansion of generalized consumption subsidies and targeted transfers, as well as an increase in the value-added tax (VAT) rate from 15 to 16 percent.
The study is structured as follows. The second section reviews the principal elements of Mexico’s tax and benefit system and its evolution in recent years. The third section presents the data sources and specific assumptions used in the analysis. The fourth section presents the principal results. The fifth section presents a general interpretation of the status quo and the required policy reforms.
Social Spending and Taxes: Overview
For the purposes of this study, social transfers are defined to include public spending on education, health, direct cash transfers, and smaller in-kind transfers (food programs and day-care centers). These programs represented 8.7 percent of gross domestic product (GDP) in 2010. Mexico’s official functional classification of social spending includes, in addition to the preceding, spending on contributory pensions, housing, and water and sewage. The latter two are not analyzed here for lack of the required information. The distribution of subsidies to the contributory pension systems is analyzed, but not included as a social transfer in the benchmark analysis. A sensitivity analysis is included treating total pension income as a cash transfer. Consumer (energy) subsidies are also analyzed and included in the estimation of post-fiscal spending.
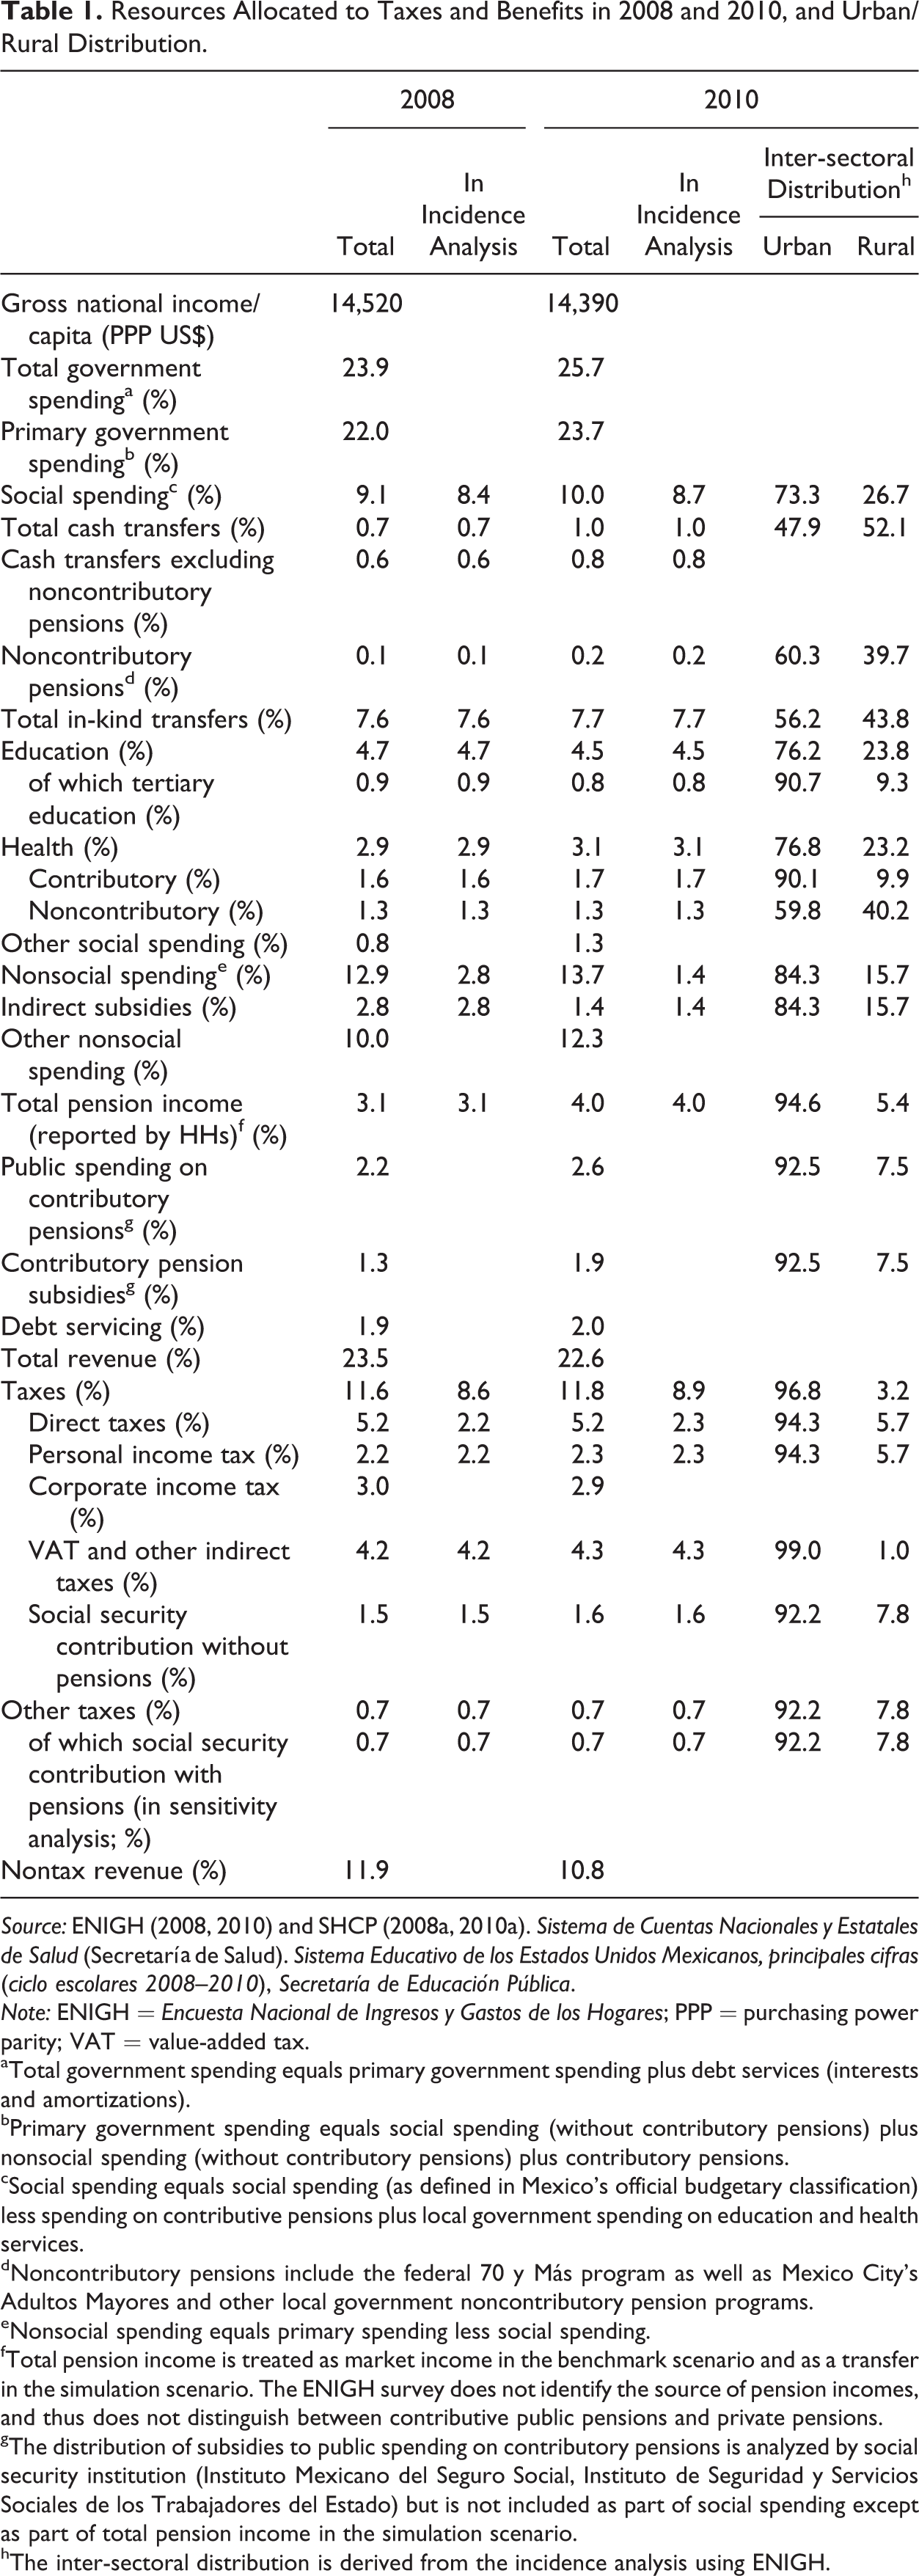
The benefits and taxes analyzed are summarized in table 1 for 2008 and 2010, which also shows the distribution of these benefits and burdens between the urban and rural populations, estimated from the incidence analysis.
Resources Allocated to Taxes and Benefits in 2008 and 2010, and Urban/Rural Distribution.
Source: ENIGH (2008, 2010) and SHCP (2008a, 2010a). Sistema de Cuentas Nacionales y Estatales de Salud (Secretaría de Salud). Sistema Educativo de los Estados Unidos Mexicanos, principales cifras (ciclo escolares 2008–2010), Secretaría de Educación Pública.
Note: ENIGH = Encuesta Nacional de Ingresos y Gastos de los Hogares; PPP = purchasing power parity; VAT = value-added tax.
aTotal government spending equals primary government spending plus debt services (interests and amortizations).
bPrimary government spending equals social spending (without contributory pensions) plus nonsocial spending (without contributory pensions) plus contributory pensions.
cSocial spending equals social spending (as defined in Mexico’s official budgetary classification) less spending on contributive pensions plus local government spending on education and health services.
dNoncontributory pensions include the federal 70 y Más program as well as Mexico City’s Adultos Mayores and other local government noncontributory pension programs.
eNonsocial spending equals primary spending less social spending.
fTotal pension income is treated as market income in the benchmark scenario and as a transfer in the simulation scenario. The ENIGH survey does not identify the source of pension incomes, and thus does not distinguish between contributive public pensions and private pensions.
gThe distribution of subsidies to public spending on contributory pensions is analyzed by social security institution (Instituto Mexicano del Seguro Social, Instituto de Seguridad y Servicios Sociales de los Trabajadores del Estado) but is not included as part of social spending except as part of total pension income in the simulation scenario.
hThe inter-sectoral distribution is derived from the incidence analysis using ENIGH.
In-kind transfers account for the bulk of social transfers. Public education absorbs 4.5 percent of GDP in 2010, with most of this going to basic (primary and lower secondary) education (3 percent). Public health spending represents 3.1 percent of GDP, divided between health services provided by the contributory social security institutions (1.7 percent) and health services for the uninsured (1.3 percent). Direct cash transfers represent only 0.96 percent of GDP in 2010 and 0.7 percent in 2008. 1 Public spending on contributory public pension systems serving private (Instituto Mexicano del Seguro Social [IMSS]) and public sector workers (Instituto de Seguridad y Servicios Sociales de los Trabajadores del Estado [ISSSTE]; Petróleos Mexicanos [PEMEX]) absorbed 2.6 percent of GDP in 2010, of which 1.9 percent of GDP represent public subsidies. 2 Generalized consumer subsidies (domestic electricity, petrol and diesel, and liquefied petroleum [LP] gas) have varied sharply in recent years as a function of international oil prices: they reached a historical maximum of 2.8 percent of GDP in 2008 when domestic gasoline prices were frozen in the context of rising international gasoline prices and fell by a half in 2010 but climbed back to an estimated 2.7 percent of GDP in 2012 (Scott 2014).
Overall, social transfers are pro-rural, allocating 26.7 percent of spending to the rural population (representing 23.2 percent of the total population) in 2010. Direct transfers (with the exception of non-Oportunidades scholarships), basic health services for the uninsured, and in-kind food programs are highly pro-rural. This has not always been the case, but is the achievement of a series of spending reforms implemented in the 1990s that had the effect of reversing a strong urban bias in the allocation of public services and food subsidies. These include an expansion in the rural coverage of basic health and education services and the introduction of innovative and effectively targeted programs benefiting the rural poor, most notably Oportunidades, originally as the Programa de Educación, Salud y Alimentación (PROGRESA) introduced in 1997. More recently, the Seguro Popular program, created in 2004, has extended noncontributory health insurance to most of the noninsured.
In contrast to the latter benefits reforms, recurring tax reform initiatives over the last three decades have failed to increase Mexico’s fiscal capacity: nonoil tax revenues have remained stagnant at close to 10 percent of GDP over the last thirty-five years. By comparison, tax revenues in the Latin American and Caribbean region increased on average from 13 to 19 percent of GDP over the last decade (Comisión Económica para América Latina y el Caribe [CEPAL] 2010). A large fraction of public spending is thus financed through oil revenues obtained from the state-owned oil company PEMEX. The present analysis considers the effect of taxes representing approximately 80 percent of nonoil tax revenues, but only one-third of total public revenues. 3 The historic limitation of tax revenues does not arise from exceptionally low tax rates, but from low levels of tax productivity, in turn explained by multiple exemptions and ineffective tax administration. Some exemptions are designed to benefit specific groups (e.g., income tax exemptions on all agricultural producers), but the principal ones were introduced to make the tax system more progressive. This includes VAT exemptions on food and medicines and a negative petrol tax. These tax expenditures and subsidies make the tax system more progressive not only at the cost of lower tax productivity, but also, paradoxically, of lower redistributive impact of the tax–benefit system as a whole. The redistributive gains obtained from the tax system through these generalized fiscal expenditures pale in comparison to the redistributive opportunity costs on the benefits side (see not only, the fourth section “Redistributive Impact and Efficiency of Mexico’s Fiscal System: Main Results”). These include the static cost associated with the shift of resources from efficient to inefficient instruments, but also the dynamic costs associated with a fiscal system trapped in a low-revenue–low-benefits equilibrium.
Data and Assumptions
The general methodology used in this study is described broadly in Lustig, Pessino, and Scott (2013) and in detail in Lustig and Higgins (2013). The principal data source used to estimate the distribution and incidence of taxes and benefits at the household level is the Encuesta Nacional de Ingresos y Gastos de los Hogares (ENIGH, National Survey of Household Income and Spending) for 2008 and 2010, the most detailed and complete survey available in Mexico for distributive analysis of household income (including direct transfers), expenditures, and in-kind transfers. 4 The ENIGH reports incomes and expenditures after taxes and does not report direct or indirect taxes directly. Hence, in this exercise taxes and social security contributions are imputed at the household level as a function of the household’s characteristics, using estimates published by Mexico’s Finance Ministry (Secretaría de Hacienda y Crédito Público de México [SHCP] 2010b, 2012). 5
The ENIGH reports the principal direct cash transfers implemented by the federal government: Oportunidades, Programa de Apoyos Directos al Campo (PROCAMPO), noncontributory pensions, non-Oportunidades scholarships, the Programa Alimentario (PAL), the Programa de Empleo Temporal, and “other social programs” as a general category. The distribution of smaller in-kind targeted social programs is obtained from a special Module of Social Programs commissioned by the Social Development Ministry as part of the ENIGH for selected years, including 2010. 6 The monetary value of in-kind transfers is assumed to be equal to the cost of provision as reported in the public accounts of the federal government for the relevant years. For health services, I also use the National and State Health Accounts published by the Health Ministry, which includes spending by state governments. In the case of education, federal spending per student is obtained from the Education Ministry, and spending by the states is estimated from federal per student spending rates and the coverage of state financed schools reported by the Education Ministry (Secretaría de Educación Pública [SEP] 2011). 7 The total value of energy subsidies is obtained from official estimates. 8
As with most household income surveys, the ENIGH underreports total household income by a significant factor with respect to the nearest equivalent concept in Mexico's National Accounts (NA) (household accounts) (household accounts). The NA/ENIGH factor is 2.09 and 2.23 in 2008 and 2010, respectively. To avoid overestimating the size of public transfers (as reported in the public accounts) in relation to household’s market income (as reported in the survey), and therefore the redistributive impact of these transfers, it is necessary to apply this factor to all market incomes from the ENIGH. In the case of direct cash transfers reported in the ENIGH, spending reported in the public accounts is used to adjust the transfers reported in the survey. 9 In the case of “other scholarships,” “other social programs,” and noncontributory state pensions, where this information is not available, the common NA adjustment factor is used. The imputation methods applied for in-kind transfers, consumption subsidies, and pension subsidies at the household level using the ENIGH survey are described in note 10. 10
Changes in poverty are presented using the US$2.50 (purchasing power parity [PPP]) international poverty line as well as a national poverty line, which is the income component in Mexico’s official multidimensional poverty measure. This is called the Línea de Bienestar Mínimo (LBM), and for 2010 it has values of US$3.60 and US$2.50 (PPP) in urban and rural areas, respectively.
Main Results
Effects on Inequality and Poverty: 2008 and 2010
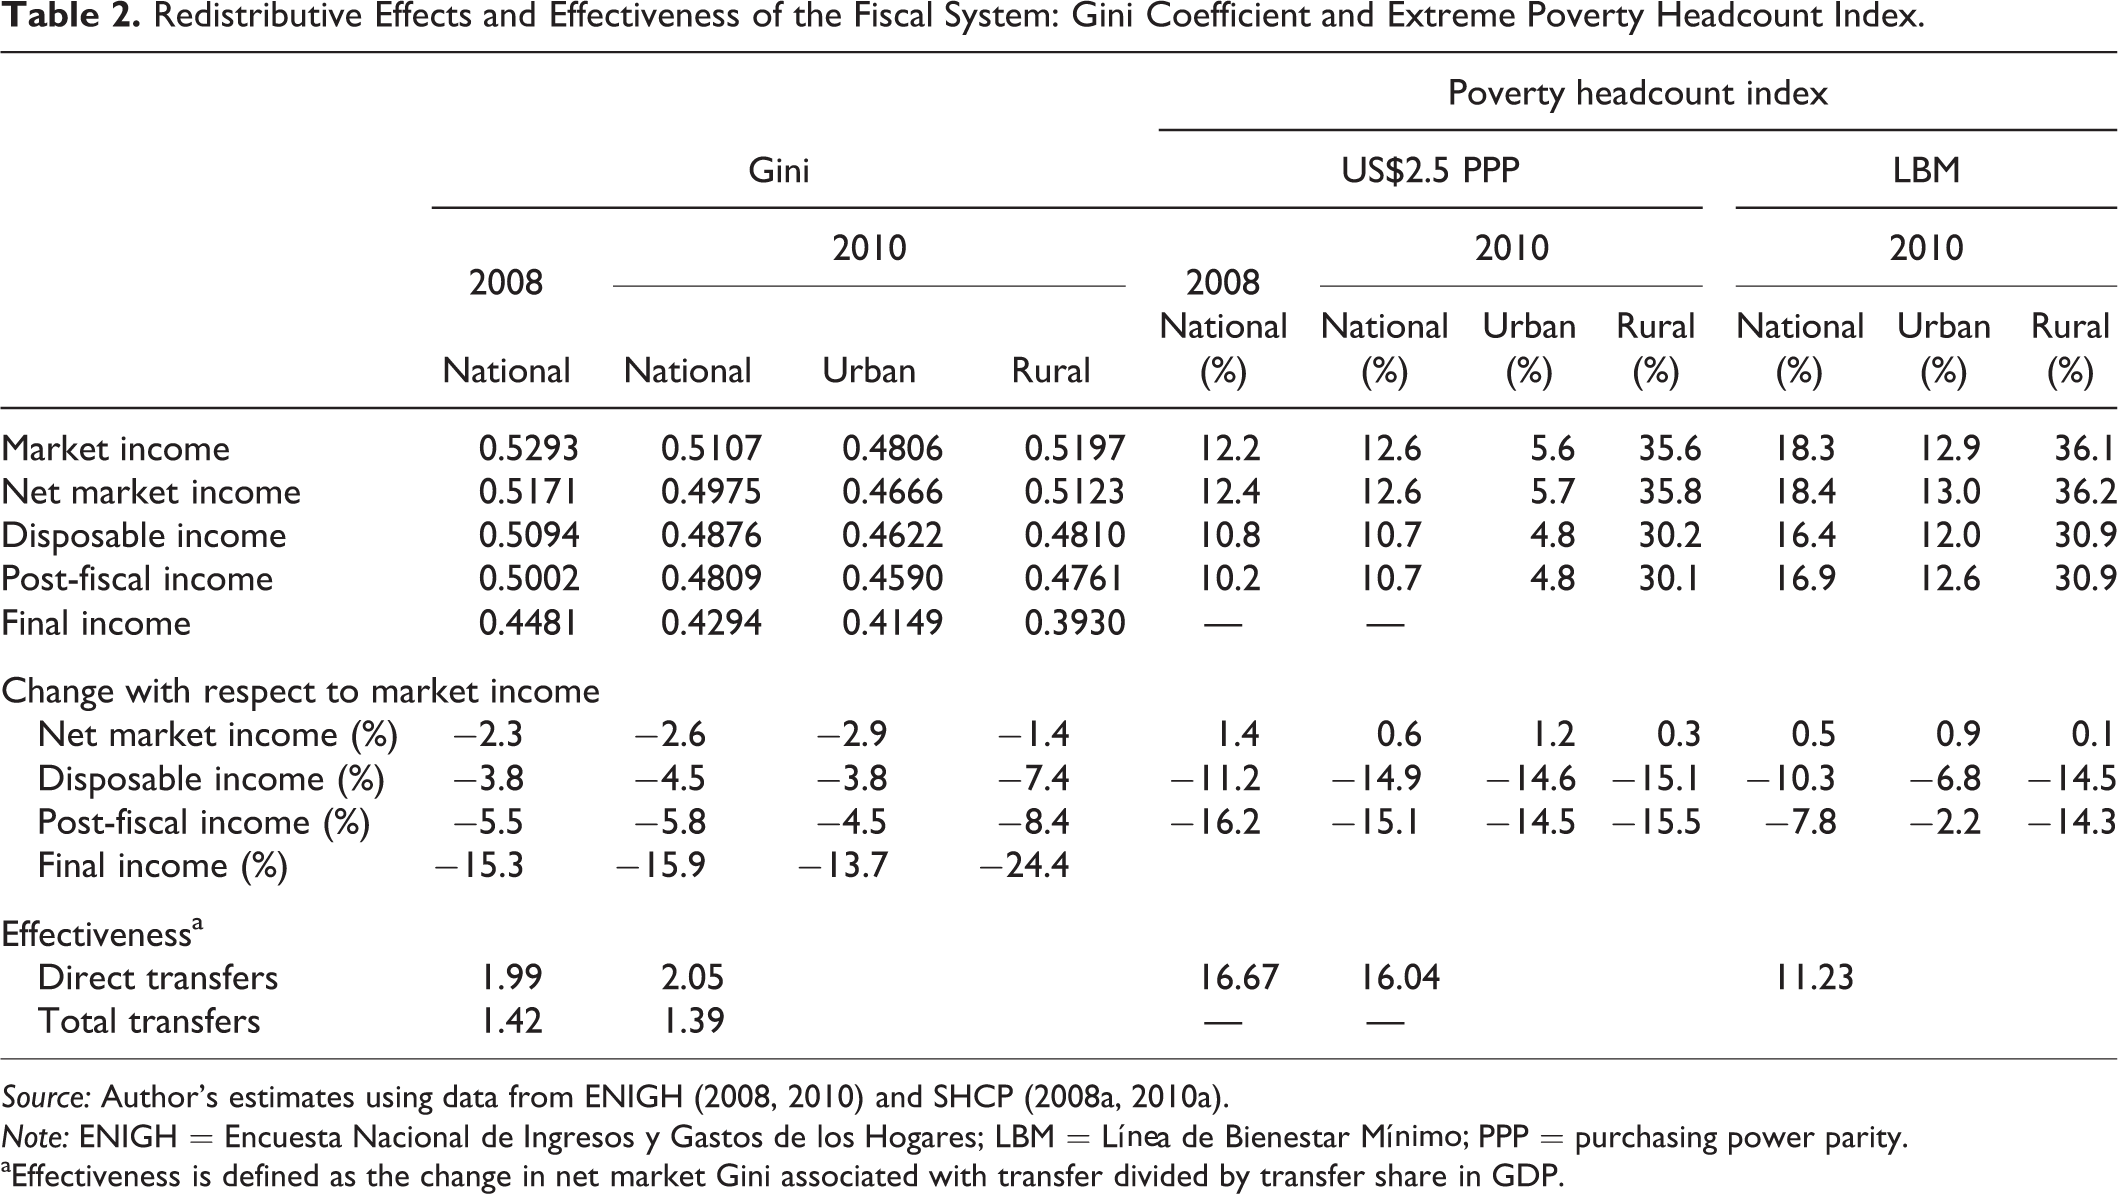
Table 2 presents the estimated changes in income inequality and poverty generated by the taxes, transfers, and subsidies analyzed, with respect to market income inequality. The combined effect on inequality is a decline in the final income Gini of 15.3 percent in 2008 and 15.9 percent in 2010. In-kind transfers in education and health account for the largest part of this effect. Direct taxes and direct transfers reduce inequality by a relatively modest 3.8 and 4.5 percent in 2008 and 2010, respectively. Adding the effect of indirect taxes and subsidies, the decline equals 5.5 and 5.8 percent in 2008 and 2010, respectively.
Redistributive Effects and Effectiveness of the Fiscal System: Gini Coefficient and Extreme Poverty Headcount Index.
Source: Author’s estimates using data from ENIGH (2008, 2010) and SHCP (2008a, 2010a).
Note: ENIGH = Encuesta Nacional de Ingresos y Gastos de los Hogares; LBM = Línea de Bienestar Mínimo; PPP = purchasing power parity.
aEffectiveness is defined as the change in net market Gini associated with transfer divided by transfer share in GDP.
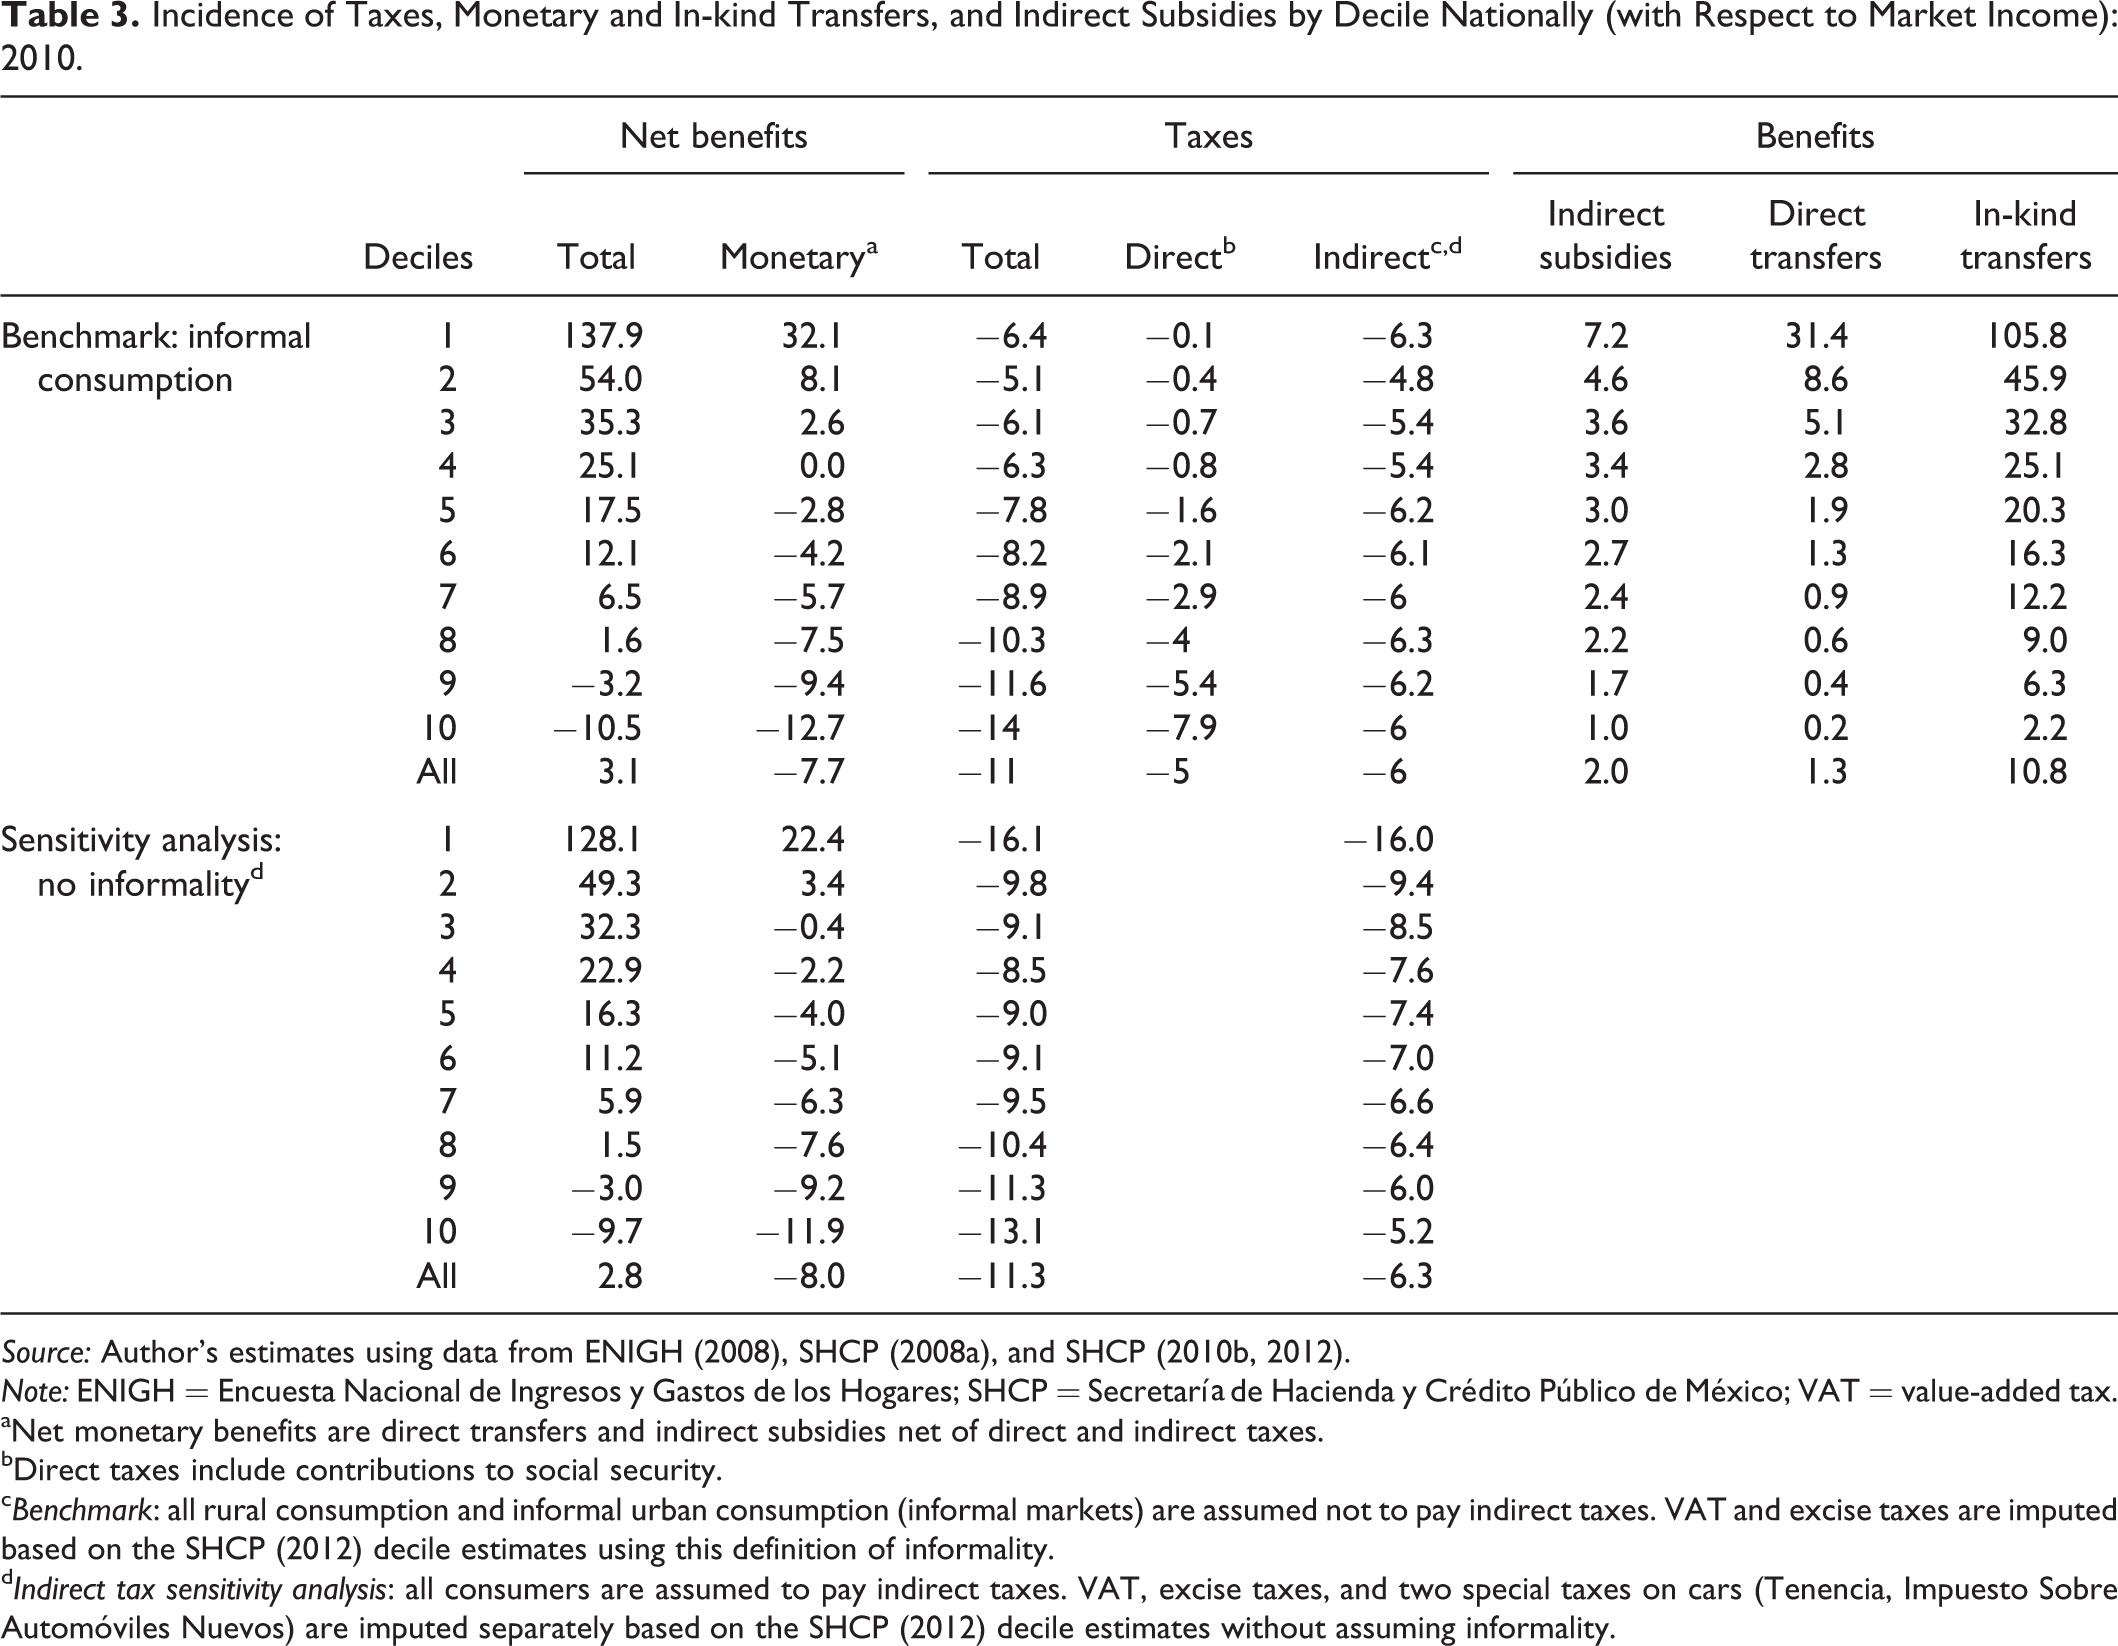
Direct taxes and social security contributions imply only a marginal increase in extreme poverty. This effect is due to contributions to social security exclusively, as the direct personal income tax is not only zero for poor workers but also includes a negative tax component for low-income workers. Adding direct transfers, the net effect on disposable income is to reduce the poverty headcount by 11.2 percent and 15 percent in 2008 and 2010, respectively (using the US$2.50 poverty line). Adding indirect taxes and subsidies reduces poverty by a further 5 percentage points in 2008, but the effect becomes marginal in 2010 with the same poverty line, and poverty actually increases by 2.5 percentage points using the LBM poverty line (as it does with the US$4 poverty line). This reflects the fact that in 2010 indirect subsidies net of indirect taxes become negative after the first decile (table 3).
Incidence of Taxes, Monetary and In-kind Transfers, and Indirect Subsidies by Decile Nationally (with Respect to Market Income): 2010.
Source: Author’s estimates using data from ENIGH (2008), SHCP (2008a), and SHCP (2010b, 2012).
Note: ENIGH = Encuesta Nacional de Ingresos y Gastos de los Hogares; SHCP = Secretaría de Hacienda y Crédito Público de México; VAT = value-added tax.
aNet monetary benefits are direct transfers and indirect subsidies net of direct and indirect taxes.
bDirect taxes include contributions to social security.
c Benchmark: all rural consumption and informal urban consumption (informal markets) are assumed not to pay indirect taxes. VAT and excise taxes are imputed based on the SHCP (2012) decile estimates using this definition of informality.
d Indirect tax sensitivity analysis: all consumers are assumed to pay indirect taxes. VAT, excise taxes, and two special taxes on cars (Tenencia, Impuesto Sobre Automóviles Nuevos) are imputed separately based on the SHCP (2012) decile estimates without assuming informality.
Direct transfers and transfers in-kind have a much larger effect within the rural sector than in the urban sector, with a total inequality reduction of 24.4 percent (final income) in 2010. Post-fiscal income reduces extreme poverty in the rural sector by 15.5 percent, and the poverty gap and squared poverty gap by 28 and 37.2 percent, respectively (US$2.50 line).
Treating pension income as transfers (sensitivity analysis) rather than as market income has little effect on inequality, but makes a significant difference on market and net market income poverty. Disposable income extreme poverty (LBM) falls by 10.3 percent in the benchmark scenario, but by 15 percent in this sensitivity analysis. This difference is due mainly to the effect of pension income, as a transfer, on the urban poor. However, when pension income is considered a transfer the effectiveness of direct and total transfers is reduced sharply.
Comparing 2008 and 2010, these results imply that despite the large reduction of indirect subsidies (by 1.4 percentage points of GDP), compensated for by only a modest expansion of direct transfers (0.2 points of GDP), the effect of the fiscal system in reducing inequality increased slightly between these two years. This reflects the low redistributive efficiency of indirect subsidies when compared to direct transfers. On the other hand, as reported above, the reduction of indirect subsidies did imply a slight reduction in the redistributive impact on extreme poverty from 16.2 percent in 2008 to 15.1 percent in 2010 (US$2.50 poverty line).
Another way of analyzing this difference is by comparing the change in post-fiscal inequality and poverty between 2008 and 2010 attributable to redistribution through the fiscal system: 11 percent of the reduction in the post-fiscal Gini coefficient between the two years can be attributed to changes in redistributive policies, while 13 percent of the increase in the national poverty headcount can be attributed to the changes in redistributive policies. 11 In other words, the compositional shift from indirect subsidies to direct transfers increased the overall efficiency of the fiscal system, and the slight increase in direct transfers was sufficient to maintain the inequality reducing effect, but insufficient to compensate the poor for the cut in net post-fiscal benefits. The gap in redistributive efficiency between indirect subsidies and direct transfers means that each peso shifted from the former to the latter significantly increased the impact of fiscal resources on poverty per peso spent, but the reduction of indirect subsidies without a sufficient compensation through direct transfers clearly harmed the poor.
Incidence of Taxes, Transfers, and Subsidies at the National, Rural, and Urban Levels: 2008 and 2010
Table 3 presents the incidence of taxes and transfers nationally by decile with respect to market income in 2010. Direct taxes are highly progressive, reflecting the first exemption of workers in the first four deciles from personal income taxes and the effect of the negative income tax. To test different assumptions on the incidence of indirect taxes, two scenarios are estimated. In the benchmark, all rural consumption and urban consumption in informal markets are assumed to evade indirect taxes. This is the assumption used in the SHCP (2012) estimates for the incidence of VAT. Under these assumptions, indirect taxes are close to neutral, reflecting both the informality assumptions and a zero VAT rate on foods and medicines (plus exemptions on health, education, and public transport services). To test for the sensitivity to the informality assumptions, table 3 also presents results assuming that all consumers are subject to VAT (maintaining the zero rate and exemptions). In this case, indirect taxes become regressive.
The tax system overall nationally is mildly progressive in the benchmark scenario, but regressive at the bottom half of the distribution in the sensitivity analysis.
Transfers are highly progressive overall, and households in the first decile receive on average net monetary benefits equivalent to 32 percent of their market income, and net total (cash and in-kind) benefits representing 138 percent in the benchmark scenario. However, net monetary benefits are significantly less progressive in the sensitivity analysis, and households become net contributors on average from the second decile, instead of the forth decile.
As noted before, transfers in-kind account for the bulk of the redistributive incidence of the fiscal system, reflecting their budgetary weight and redistributive efficiency. Despite their small share of fiscal resources, direct transfers are also very important for the poorest deciles. Indirect subsidies represent a relatively small share of benefits for the poorest deciles, but despite their reduction in 2010, they become more important than direct transfers from the third decile.
There are additional important differences between urban and rural populations (not shown in the table). Net monetary benefits increase market income by only 8.3 percent for the poorest urban decile, and become negative by the third urban decile. In contrast, rural areas are estimated to obtain net monetary and total benefits equivalent to 97 and 373 percent of market income, respectively. Relaxing the strong VAT informality assumption of the benchmark analysis (not shown in the table) has the effect of turning the highly progressive rural tax incidence into a regressive one: the average tax burden for the poorest rural decile jumps from 1.4 to 10.7 percent of market income. Even in this scenario, however, after all taxes and monetary benefits (post-fiscal income), rural households still only become net contributors by the ninth rural decile.
Indirect subsidies overcompensated the poorest 40 percent for indirect taxes in 2008 and reduce the net effect of indirect taxes significantly even for higher income households, while in 2010 the indirect tax burden surpassed subsidies in all but the first decile.
Distribution of Benefits
Figure 1 presents the concentration coefficients for all benefits analyzed in 2010, calculated at the national, urban, and rural levels. Nationally, the coefficients for transfers vary from −0.54 (Oportunidades) to 0.68 (fiscal subsidy on private school tuition). The most progressive include targeted transfers and food programs, health services for the uninsured, and primary education; all these are progressive in absolute terms. Those that are only progressive in relative terms include subsidies to contributory social security pensions, indirect subsidies, and tertiary education. The only unequalizing (regressive) transfers are subsidies to the social security systems for public sector workers and private education deductions. When contributory pensions are considered a government transfer (and households are initially ranked by market income without contributory pensions), they are progressive in relative terms: the concentration coefficient equals 0.26 nationally in the sensitivity analysis. However, contributory pensions become regressive when they are treated as a component of market income (the benchmark scenario), with a (national) concentration coefficient of 0.70. The wide difference between the two coefficients not only reflects the dependence of many pensioners on their pension as their primary income source (so that without their pension they would fall considerably in the income distribution), but it also shows that access to contributory pensions is concentrated on relatively high income workers.
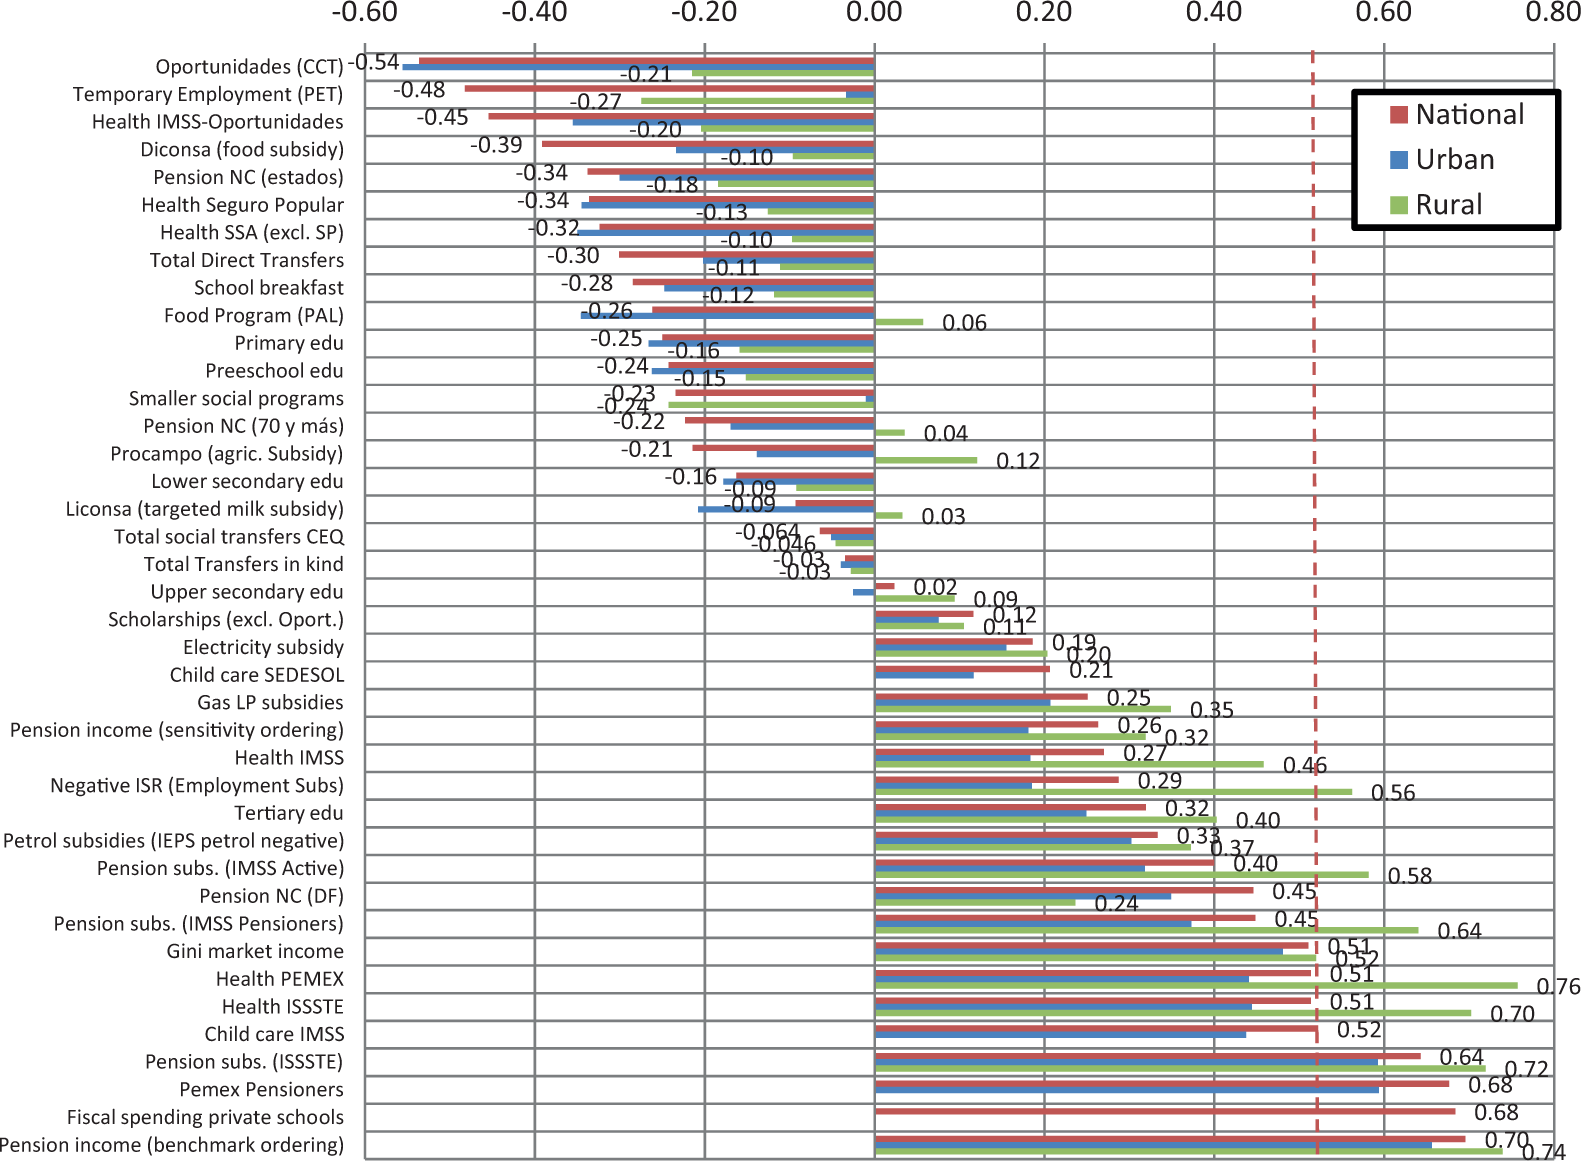
Concentration coefficients of public benefits: national, urban, rural, 2010.a Source: Author’s estimates using data from ENIGH (2008, 2010) and SHCP (2008a, 2010a). Note: ENIGH = Encuesta Nacional de Ingresos y Gastos de los Hogares. aCoefficients are calculated with population ordered by per capita household net market income including pensions (benchmark), except for “Pension income (sensitivity),” which is based on net market income excluding pension income (treated as a transfer).
We observe an interesting contrast between the rural distributions of individual transfers, which are almost invariably less progressive than the national or urban distributions. Even Oportunidades is only moderately progressive in absolute terms in the rural sector, and 70 y más is only progressive in relative terms. The contributory social security systems have minimal rural coverage, and these benefits are regressive within the rural sector. These results do not imply that transfers are less well targeted in rural than in urban areas but reflect rather the large differences in income levels and poverty rates between the two sectors. Only 5.6 percent of the urban population is extremely poor (US$2.50 poverty line; table 2), and these receive 14 percent and 6.4 percent of direct and total urban transfers, respectively. On the other hand, the extreme rural poor represent 35.6 percent of the rural population, receiving 43.8 percent and 38.6 percent of direct and total rural transfers, respectively. Transfers per capita are larger for the rural than for the urban extreme poor: direct (total) yearly transfers represent 195 (1,231) US dollars PPP per capita for the urban poor, but 451 (1,421) for the rural poor.
Despite the differences in overall progressivity, when all cash and in-kind transfers are added up (Total social transfers CEQ), the concentration coefficients are similar at the national, rural, and urban levels. This is explained by the differences in the relative weights of transfers within each sector: the lower progressivity of transfers within the rural sector is compensated by the larger rural share in the more progressive transfers. Direct transfers are significantly less progressive within either sector than they are nationally, which implies that this level of national progressivity arises largely from the pro-rural allocation of these transfers.
A significant fraction of programs concentrates resources disproportionately on nonpoor population, who, using the upper national poverty line (línea de bienestar), represent 48 percent of the population. For example, the extreme poor, representing 19.4 percent of the population, obtain only 7.4 percent of the benefits from noncontributory day-care centers (Estancias Sedesol), 6.6 percent of gasoline subsidies, 6.2 percent of public tertiary education, 1.6 percent of IMSS pension subsidies, and 0 percent of IMSS day-care centers. Even in the case of Oportunidades, which was originally designed to provide a basic floor of human capital to the extreme poor in the poorest rural communities, and as is shown here is still among the most effectively targeted, 46 percent of its resources do not benefit this group.
Coverage rates of the extreme poor (US$2.5 PPP) by the principal direct transfers in 2010 are as follows: Oportunidades (64.5 percent), PROCAMPO (17.7), 70 y más (10.2), PAL (2.3), Programa de Empleo Temporal (PET; 0.7), other scholarships (4.1), other noncontributive pensions (2.3), other social transfers (2.5), at least one of the above (73.3). Seguro Popular covers 73 percent of the extreme poor, contributory health services covers 9.1 percent, contributory pension subsidies (to active workers as well as pensioners) cover only 2.5 percent, and public university services covers just 1.9 percent.
Conclusions, Caveats, and Policy Implications
This article has analyzed the redistributive effects and efficiency of Mexico’s fiscal system, in its principal instruments and in the aggregate, nationally as well as within Mexico’s highly differentiated urban and rural sectors. Two caveats are in order before interpreting and drawing policy conclusions from these results. First, the interest of this analysis does not assume that redistribution is the only, or even the principal, objective of all these tax and spending instruments. But many fiscal instruments have redistributive objectives, among other possible functions, and all fiscal instruments, whatever their objectives or classification, have redistributive effects. These effects often generate intensive public interest and political debate without rigorous empirical evidence to back them up.
Second, the article has not tried to evaluate the impact of the instruments analyzed on households’ welfare. This would require the application of either experimental or quasi-experimental evaluation methodologies, which are obviously unfeasible for the large-scale, wide-coverage, and long-established interventions analyzed here (national public education, health, and social security systems), or ex ante microsimulation methodologies, which are beyond the scope of the present study (but would be a natural future extension). There are four well-known factors that are of particular relevance here: behavioral effects (e.g., labor, savings, intra- and inter-household transfers, and fertility); indirect effects through the market system (general equilibrium) or external to it (externalities); combined effects of multiple interventions; and quality and household valuation of in-kind transfers.
For these reasons, the results presented here should be interpreted as the potential rather than actual redistributive impact of Mexico’s fiscal system. This is especially true for the large and comparatively efficient redistributive effects associated with in-kind transfers. These result from an increase in resources allocated to these transfers as well as the expansion in the coverage of education and health services over the last two decades. There is much evidence, however, that as basic services have achieved or are approaching universal coverage, the quality of these services has become the more relevant unequalizing factor. Since these services are universally accessible, especially to urban and upper income groups facing less geographic or economic barriers to access, their high degree of progressivity is in itself strong evidence of their low quality: as households rise in the income ranking they opt out of the public system in favor of costly private services.
With these caveats in mind, this analysis entails three principal reform implications:
Redistributive opportunity costs and reform opportunities. The wide range of concentration coefficients across as well as within the principal policy dimensions analyzed (education, health, social security, income support, and food programs), and the large differences in the redistributive efficiency of the principal fiscal instruments reveal significant opportunities to improve the system’s redistributive impact.
Integral tax–benefit reform. Fiscal reforms should be conceived and implemented integrally everywhere (Mirrlees et al. 2011), but especially in the context of Mexico’s low-revenue/high-inequality fiscal equilibrium. A broad tax base (free of redistributively inefficient tax subsidies) and an effective, universal, and well-funded system of benefits should be pursued as a single renewed fiscal contract. Increasing the overall redistributive impact of the fiscal system does not require increasing the progressivity of each of its components. Given the common trade-offs between tax progressivity and tax efficiency, a concern for tax progressivity can be counterproductive in redistributive terms. The results presented here show that redistributive efficiency could be increased significantly by shifting resources from indirect tax spending instruments to direct transfers and the provision of a universal noncontributive social protection floor.
Political, economic, and geographic barriers. The present analysis has documented but not explained the persistence of inefficient redistributive instruments. In some cases, these reflect capture of rents by organized interest groups. This includes unfunded public sector social security benefits that are well above those available to formal private sector workers, as well as agricultural subsidies. In most other cases, the explanation involves a simple inequality trap: in a context of high (market) income inequality, poor households cannot afford to incur the costs that are often associated with access to public benefits. These include explicit or implicit user fees (especially in higher education and hospital services), social security contributions, labor opportunity costs in attending tertiary education, and purchasing power to access subsidized goods and services. Finally, geography and population dispersion, which is exceptionally high in Mexico, acts as a third type of barrier contributing to both income and fiscal inequality. In this context, social policy must be explicitly designed to minimize these costs, by minimizing user fees and contributions in favor of general tax finance, by shifting from broad supply side subsidies to well-targeted scholarships, and by shifting from generalized indirect subsidies to direct transfers.
Footnotes
Declaration of Conflicting Interests
The author(s) declared no potential conflicts of interest with respect to the research, authorship, and/or publication of this article.
Funding
The author(s) received no financial support for the research, authorship, and/or publication of this article.