
Abstract
A great deal of research has studied the effects of income and tax changes on charitable giving. However, little work has focused on how these relationships were affected by the Great Recession. This article estimates the tax and income effects using the 2009 Panel Study of Income Dynamics. The estimates are notably different than the typical findings from before the recession. Most importantly, tax effects are higher and income effects are lower. These unusual patterns are more pronounced for secular giving than for religious giving, and the effects are muted when only considering tax itemizers. The estimates are used to develop policy analytic results, considering the effects of the 2013 personal income tax rate increases and possible tax deduction limits currently under consideration. I find the tax increases to have a moderately stimulative impact on giving but predict a cap on charitable deductions would have a large negative impact.
Nonprofit and voluntary activities are central to the provision of public goods in America and are as old as the republic itself. Indeed, this has long struck outside observers as unique. In what is probably the most famous passage from Democracy in America, de Tocqueville wrote in 1835 that “The Americans make associations to give entertainments, to found establishments for education, to build inns, to construct churches, to diffuse books, to send missionaries to the antipodes; and in this manner they found hospitals, prisons, and schools” (de Tocqueville 2002: 581). He went on to make an explicit distinction from the Europeans: “Wherever, at the head of some new undertaking you see the government in France, or a man of rank in England, in the United States you will be sure to find an association” (de Tocqueville 2002: 581).
American tax law’s accommodation of philanthropy can be seen, therefore, as an expression of the social contract. The imposition of the individual income tax in 1913 was quickly followed in 1917 by the charitable deduction that we still see today. The congressional debate on this policy contains this argument from an unidentified congressman, “If a man wants to make a gift to charity, he ought to be encouraged to do so and not [be] discouraged. He ought to be encouraged to make such a gift rather than be penalized for doing so” (Desmond 1967: 8).
In effect, deductions for charitable contributions were an acknowledgment that public goods in America have always been, in no small part, a private endeavor. As such, the taxes foregone on contributions to qualifying charities were a way for private citizens to direct public resources in exchange for their own investments. This is in contrast to the notion that charitable contributions are, in modern parlance, “tax loopholes.”
Given the importance of charitable contributions for the provision of public goods, it is no surprise that they have been a focus of public finance research. In particular, public finance economists have studied the impact of income, as well as the “tax price of giving,” on donations.
The tax price of giving is defined as 1 − τ, where τ is the effective marginal tax rate, and charitable contributions are tax deductible. 1 When the tax rate increases, the deductible portion of a contribution increases by the same amount, so the effective price of the contribution falls. For example, if τ is 25 percent and a taxpayer donates a dollar, his taxable income falls by the dollar and this saves him 25 cents in taxes—making the price of the contribution (1 − τ) or 75 cents.
The effects of income and tax price on giving are generally studied in terms of elasticities (the percentage change in giving associated with a particular change in tax rates or income). The price elasticity of giving shows how tax policy will affect the nonprofit sector and allows us to predict the effects of changes in tax rates on donation levels. The income elasticity allows us to predict the rates of growth in the sector as disposable income grows.
Researchers have found a range of price and income elasticities, but the most common values have generally clustered around unity for price and between 0.5 and unity for income. We might expect these values to have changed in the wake of the Great Recession of 2007–2009. The recession created a downdraft in income and was associated with instability in expectations about taxes. For several years, citizens saw average household income fall, and politicians discussed tax changes that could either increase or decrease the price of giving. In short, the economic and policy environment became one characterized by uncertainty.
Policy uncertainty has negative effects on the economy (Baker, Bloom, and Davis 2015), and it may alter giving behavior. 2 For example, Alm (1988) demonstrates why itemizers might lower deductions in response to greater uncertainty. Hughes and Luksetich (2008) analyze Panel Study of Income Dynamics (PSID)/Philanthropy Panel Study (PPS) data from 2001 and conclude volatility in income, which could serve as a proxy for uncertainty, decreases giving.
How would this uncertainty affect elasticities? Examining charitable giving during and immediately following the Great Recession provides an opportunity to explore this question.
A new line of research quantifies economic policy uncertainty (EPU) and it clearly shows that EPU was at unusually high levels in 2008 (Baker, Bloom, and Davis 2015). For example, EPU in October 2008 was more than twice its value in both October 2004 and October 2000. Some of this was political: then-senator Obama famously campaigned for repealing the Bush tax cuts for the wealthy (Calmes et al. 2008). In practice, this amounted to calling for a 5 percent tax hike on high earners. Although most Americans were exempt from the pledge, the wealthy—the group that makes most charitable donations—were not. EPU might lurk behind unusual income and price elasticities in the wake of the Great Recession.
Other trends could have affected tax price and income elasticities of giving during this time as well. Income inequality is one example. It is well established that income inequality has been on the rise in the United States and other developed nations. From 2001 to 2008, the share of total income going to the top 5 percent of US earners increased by approximately 11 percent (Alvaredo et al. 2016). There is ample reason to suspect this trend may have impacted charitable giving. Past research suggests that the wealthy have different giving habits than others. In a survey of the literature, List (2011) concludes that the wealthy are more sensitive to changes in the tax price of giving. Hence, a greater share of income may be going to a socioeconomic group more sensitive to changes in tax prices, affecting price and income elasticities.
In sum, elasticities calculated for the 2008–2009 period—the heart of the Great Recession—can help provide insight into the effects on giving from income decreases, greater macroeconomic and policy instability, and greater income inequality. This has important policy implications in an era in which policy makers are questioning long-established policies such as the tax deductibility of charitable donations and the role of government in providing many charitable public goods.
This is the first article to estimate price and income giving elasticities during the 2008–2009 recession. After surveying the literature and summarizing the recent trends in American charitable giving, I use the 2009 data from the PSID/PPS to produce the latest and, to date, only elasticity estimates for this period. To provide context for my estimates, I also present comparable estimates for the 2001 wave of PSID/PPS data. The 2009 estimates suggest donations are less responsive to income and more responsive to price than literature norms. Comparing the 2009 and 2001 PSID/PPS data, we see that income elasticities increased from 2001 to 2008, while tax price elasticities declined. These results yield implications for both policy and future research.
Background
Economists have measured the price and income elasticities of giving for many years. Andreoni (2006) provides a thorough assessment of the empirical and theoretical studies in this literature. Most pertinent to this analysis, empirical studies of the tax price elasticity using American data have found values varying from as low as −7.07 to as high as +0.12 (Clotfelter and Steuerle 1981; Robinson 1990; Steinberg 1990; Wu and Ricketts 1999; Peloza and Steel 2005). The modal value in the literature has generally coalesced around unity (−1), especially when calculated using effects from permanent tax changes (Auten, Sieg, and Clotfelter 2002).
Despite the relative price elasticity stability seen overall, elasticities vary somewhat across nonprofit subsectors. Feldstein (1975) derives elastic (lower than −1) estimates for contributions to education, health, and social welfare organizations, but an inelastic (between −1 and 0) estimate for religion. Reece (1979) estimates an elasticity below −1 for religion but above −1 for education. Yetman and Yetman (2013) distinguish between giving to charities supported by a small group of donors (private charities) and charities supported by a broader base of many donors (public charities). They find that the tax price elasticity is around −1 for public charities but is closer to −2 for private charities. Helms and Thornton (2012) have shown that religious donations by religious people have a lower sensitivity to price than secular donations by secular people.
Past studies have found a range of estimates for the income elasticity of giving. Surveys by Steinberg (1990) and Clotfelter and Steurle (1981) indicate that the average income elasticity is in the 0.60 to 0.80 range, but with measured elasticities as low as 0.11 (Christian and Boatsman 1990) and others closer to 2 (Randolph 1995). Some of the inconsistency between studies may be due to the tendency of cross-sectional data to underestimate the income elasticity by interpreting transitory income shocks as permanent (Brown 1996). To solve this problem, some writers have introduced a longitudinal component into the estimates with panel data, generally, finding higher income elasticities than cross-sectional studies. Panel data models using fixed effects produce estimates less biased by unobserved heterogeneity (Bakija 2000). Recent estimates of income elasticity from panel data models range from 0.40 for overall taxable income (Gruber and Saez 2002) to 0.70 (Bakija and Heim 2011) or larger in higher income individuals.
Researchers have also attempted to disaggregate the impact of permanent and transitionary responses. Randolph (1995) estimates transitory price elasticity to be higher (in absolute value) than permanent price elasticity. In contrast, Auten, Sieg, and Clotfelter (2002) find that permanent income has a larger impact on giving than changes in current income. 3
Obviously, income and tax considerations are not the only incentives impacting an individual’s willingness to give. Other factors, such as social capital, values, beliefs, and volunteering, also play a major role (Andreoni 1990; Jackson et al. 1995; Clark 2002; Bekkers and Wiepking 2010). Bekkers and Wiepking (2010) provide an excellent overview of the many motivations that drive charitable giving. 4
Recent Giving Patterns in the United States
As shown in figure 1, total charitable giving by individuals in the United States is generally estimated to be about US$250 billion, a level first attained in 2004. After 2007, however, it declined and did not recover until 2014. The latest estimates are from 2014 when giving came to US$258 billion in inflation-adjusted dollars. Charitable giving by individuals represents 72 percent of total dollars given in 2014. The other 28 percent came from corporations (5 percent), foundations (15 percent), and bequests (8 percent).
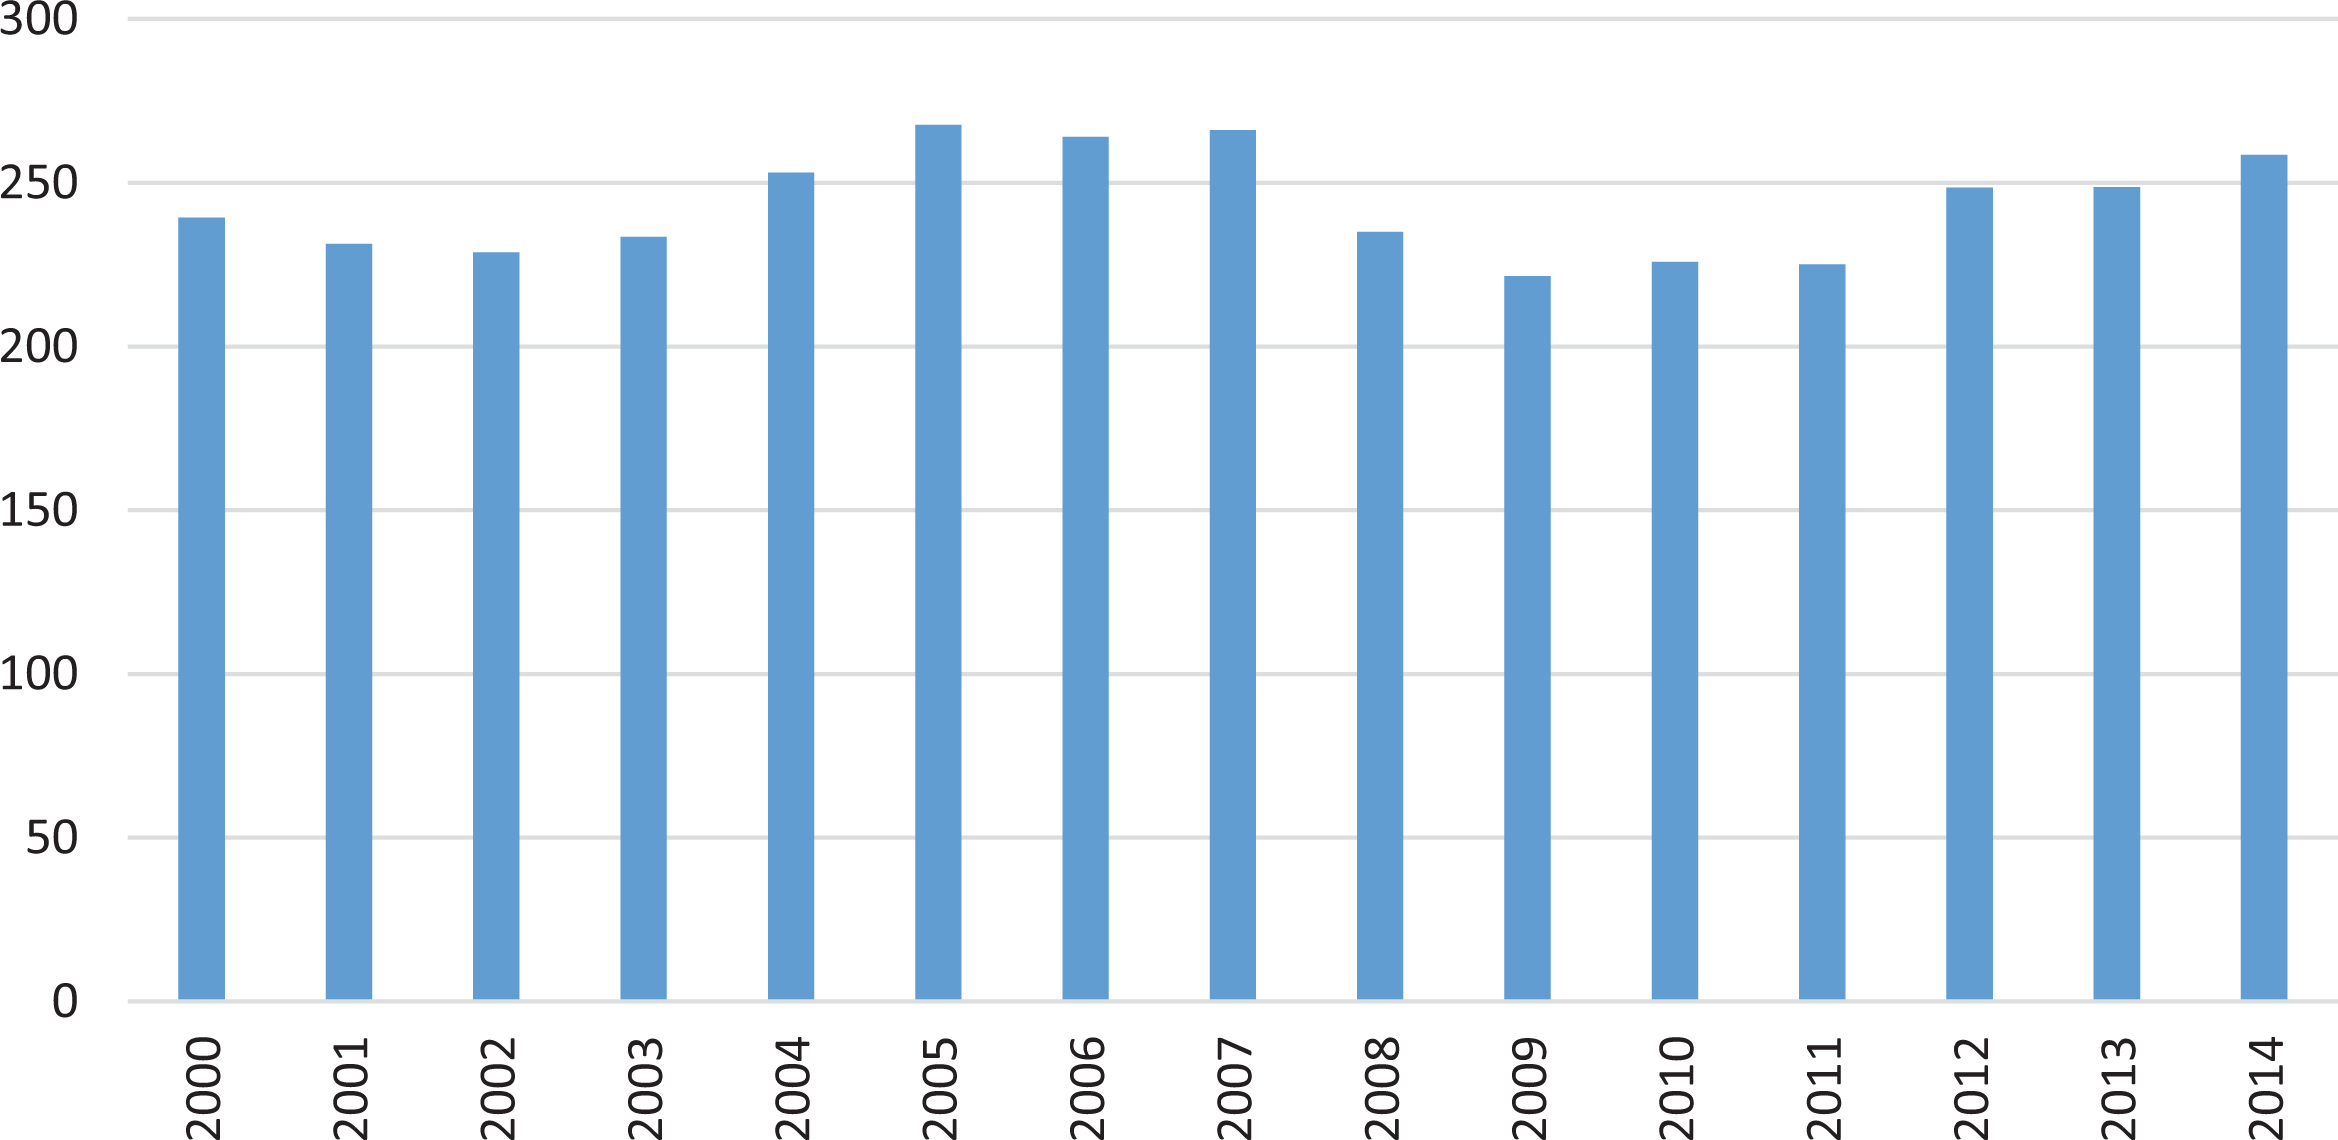
Total billions of inflation-adjusted dollars given charitably by individuals in the United States, 2000–2014. Source: Giving USA.
The most obvious explanation for the decline in charitable giving after 2007 is the Great Recession and its impact on household income and wealth. As shown in figure 2, the median American family experienced at least four consecutive years of diminished real purchasing power.
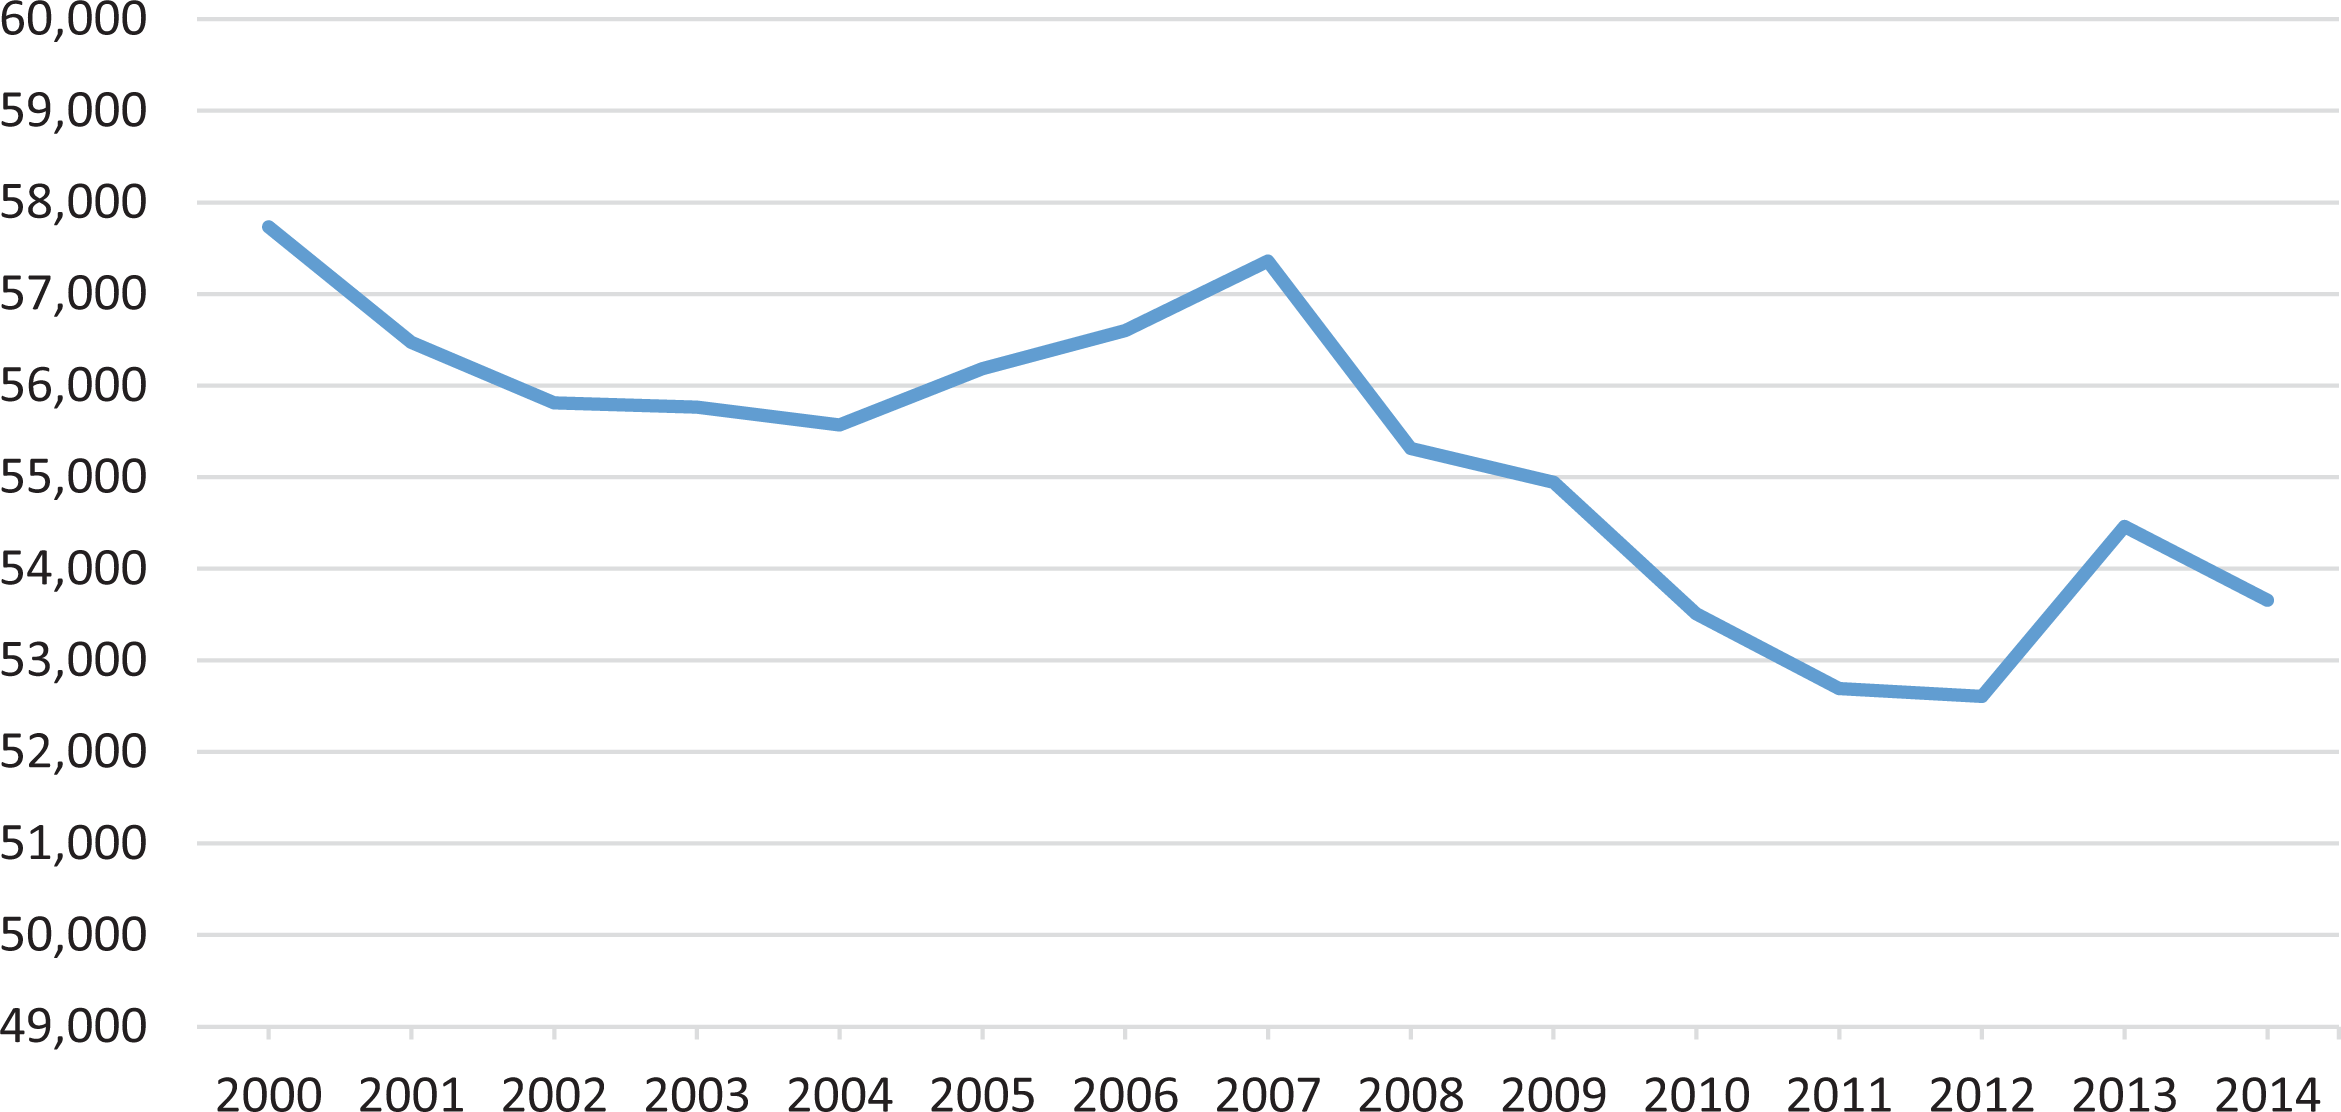
Real median household income in the United States from 2000 to 2014 in 2014 dollars. Source: US Census Data.
Figure 3 reveals that real average household giving (calculated as total charitable giving divided by the number of US households) in America peaked in 2005 at US$3,099 (in 2014 dollars). It declined rapidly in the 2007 to 2009 period and has gradually climbed back toward its 2005 level. Notably, real giving per household begins to recover in 2011, a full year before median household income began to climb in 2012. This is likely due to the earlier recovery of top-quintile incomes (Proctor, Semega, and Kollar 2016).
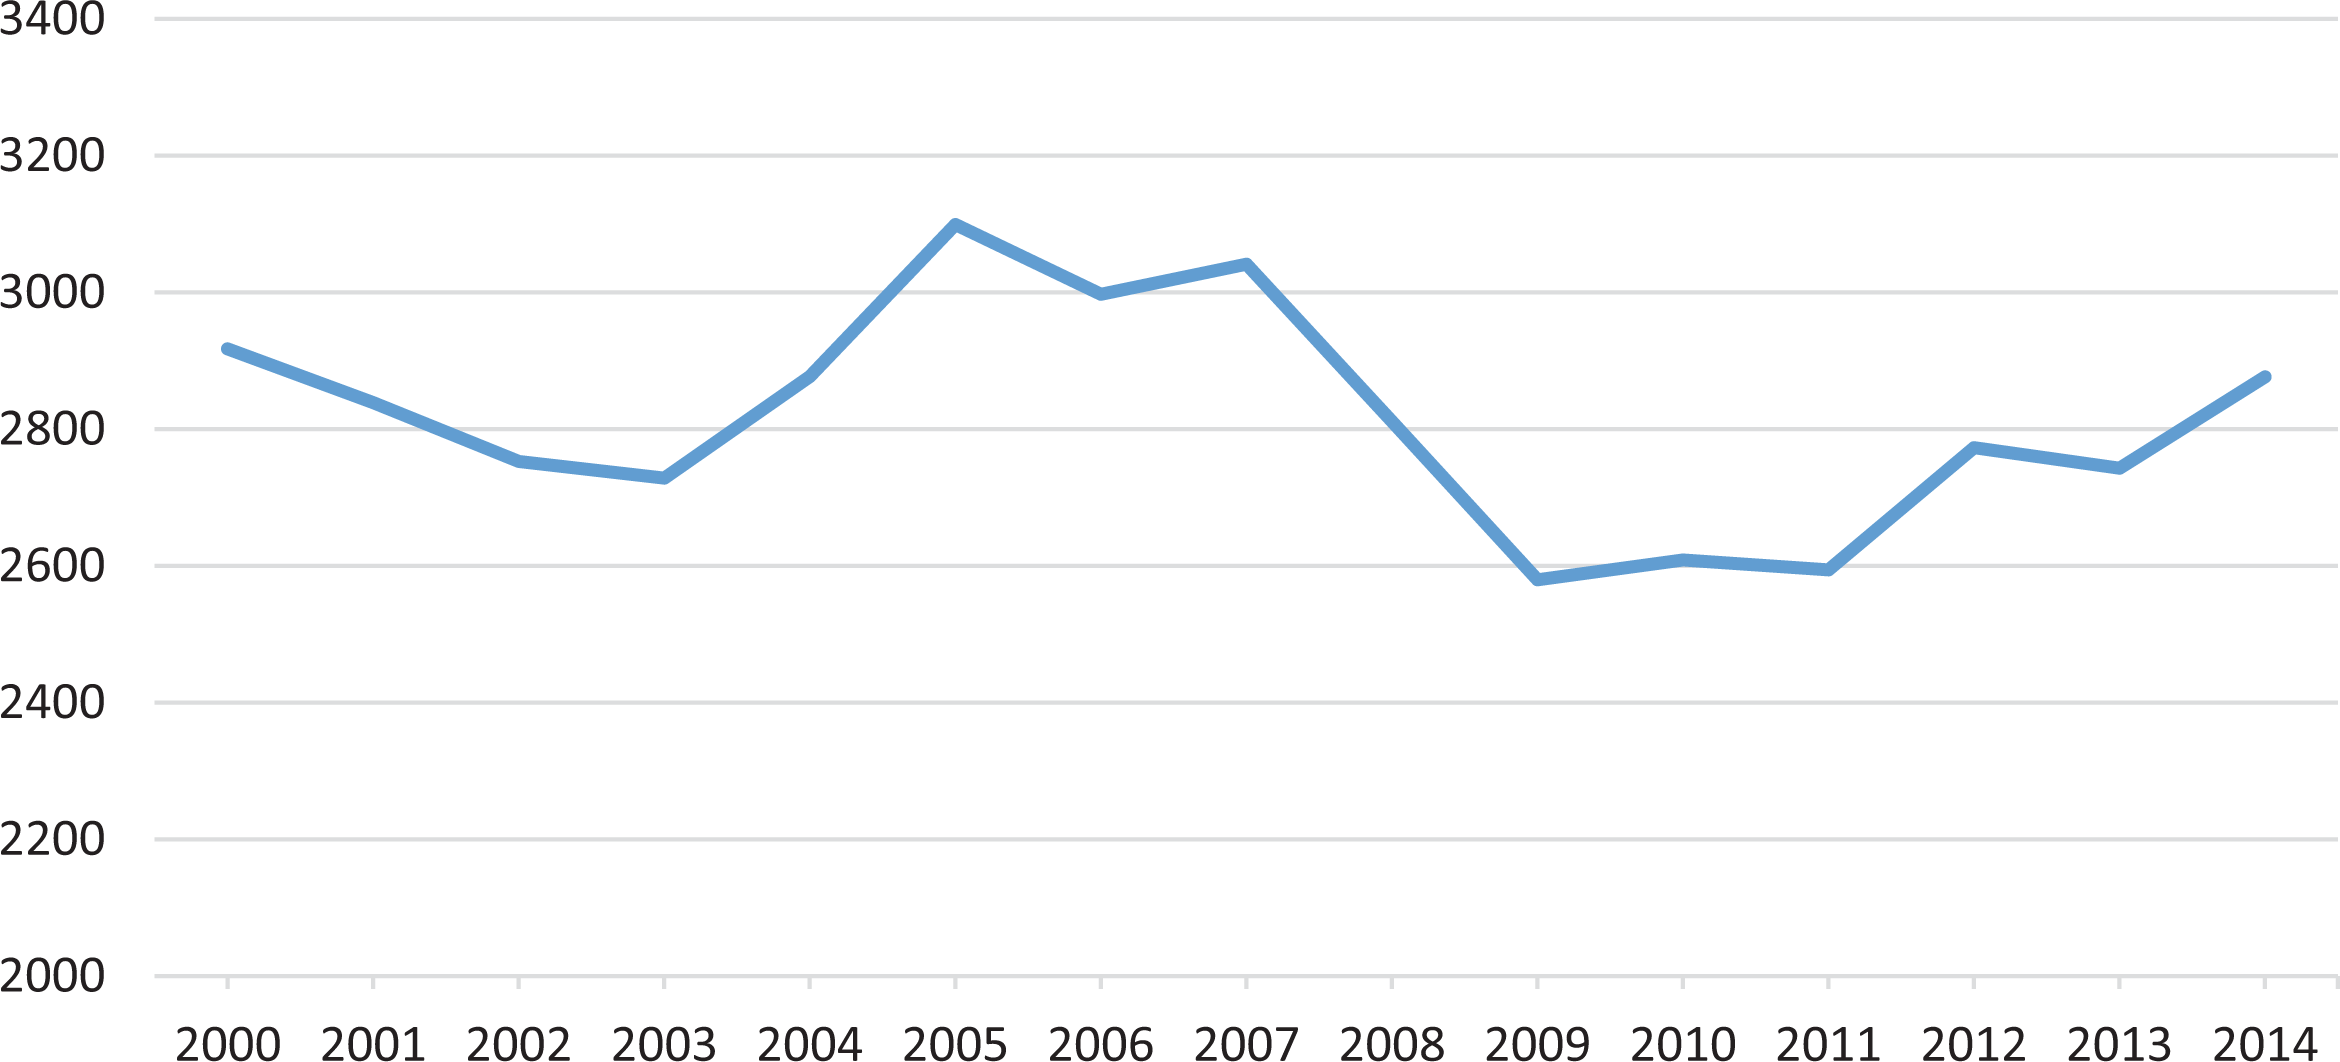
Real charitable giving per household in the United States from 2000 to 2014 in 2014 dollars. Source: Giving USA and US Census Bureau.
To a large extent, the figures above show a clear correlation between household income and giving levels: both precipitously dropped after the recession, stabilized a few years later, and then began climbing upward by 2012. But to understand this relationship causally and estimate the underlying mechanisms, we need to develop empirical models.
Models
We are interested in the effect of the price of giving, 1 – τ, on the amount of donations an individual chooses to give,

where
Any empirical strategy to estimate equation (1) features an endogeneity problem: 1 − τ is itself a function of donations, because effective marginal tax rates are determined by income net of donations. Since 1 − τ and

To understand the intuition here, suppose a taxpayer has earned US$1,000 in income and faces a nominal marginal tax rate of 0.5. His or her “first-dollar” price is one minus 0.5 which equals 0.5. Now, assume the same taxpayer donated US$100 to charity. His or her “last-dollar” price of giving the 100th dollar is 1 − 0.45 which equals 0.55.
A second econometric issue regards model specification. Almost any data set measuring charitable giving is bound to have a large proportion of zeros, causing ordinary least squares estimates to be inconsistent. The literature has developed several remedies. When analyzing a single cross section of data, a full-information maximum likelihood (FIML) Tobit model is often used (Lankford and Wyckoff 1991; O’Neil, Steinberg, and Thompson 1996; Andreoni, Brown, and Rischall 2003; Bradley, Holden, and McClelland 2005). Other popular alternatives include symmetrically censored least squares (SCLS) and censored least absolute deviation (CLAD) models (Wihelm 2008). Comparing FIML Tobit against SCLS and CLAD, Wihelm (2008) finds that FIML Tobit performs well. 6 Keeping in line with literature norms, I estimate my system using the FIML Tobit model, the results of which I compare with a two-stage quantile regression model.
Data
The best data set to estimate the tax price and income elasticities of giving is the PSID, a national panel survey that has been conducted every one or two years since 1968. 7 In 2009, the Center on Philanthropy at Indiana University (since renamed the Lilly Family School of Philanthropy) sponsored a module of questions on charitable behavior called the PPS. The survey asked families different combinations of questions on a broad range of issues, including inquiries about various types of charitable donations (Center on Philanthropy Panel Study 2009). Respondents were asked how much they contributed in the year 2008 to all charities, as well as to specific categories of charities, including religious organizations, “combination” organizations such as the United Way that bundle gifts for secular nonprofits, organizations that aid the poor, health organizations, educational organizations, and “other” charitable organizations. 8 The PSID/PPS data are widely considered to be high quality and reliable (Wihelm 2007). Since the PSID/PPS’s inception, numerous studies have used it to explore various facets of giving (Hughes and Luksetich 2008; Wilhelm 2008; Wilhelm, Brown, Rooney, and Steinberg 2008; Brown, Harris, and Taylor 2012; Thornton and Helms 2013; Yörük 2014).
The tax price of giving depends on each family’s effective marginal tax rate, which is not available in the PSID/PPS data. To calculate this rate for each family, I used the National Bureau of Economic Research’s “TAXSIM” tax calculator. 9 This calculator utilizes the PSID/PPS data for each respondent’s relevant demographic characteristics (e.g., state of residence, marital status, number of dependents, and senior citizens in the home), income amounts and types (e.g., labor income, dividend income, property income, and unemployment compensation), and expenses (e.g., itemized deductions and childcare expenses). TAXSIM determines whether a taxpayer would have itemized his or her deductions and estimates a marginal tax rate for each family. The model has been used extensively over the past twenty-five years and has the advantage of being updated annually to reflect changes in the tax code. Researchers have found TAXSIM to provide an accurate measure of the true marginal tax rate (e.g., Butrica and Burkhauser 1997).
The PSID measure of income includes wages, dividends, interest, welfare benefits, pensions and annuities, unemployment, worker’s compensation, child support and alimony, gifts from relatives or other people, and other income sources. The total household income includes income received by both the household head and the spouse.
As explained above, it is useful to distinguish between current and permanent income. A convenient way to estimate permanent income is to average several years’ income across time. Below, I sum all sources of income for each family in the panel in 2004, 2006, and 2008, correct for price inflation using the consumer price index, and average the sums across the three years. The correlation between permanent income and 2008 current income is .91. In 42 percent of households, 2008 income was lower than permanent income, confirming the recessionary pattern depicted in figure 2 (The Lily Family School of Philanthropy, 2016).
To capture the effect of wealth on giving, I construct a variable that sums several stocks of resources. These include the value of pensions, savings and investments, and the value of homes. Education, race, and religion are measured according to the status of the household head. The PSID/PPS data, supplemented with the TAXSIM results, are summarized in table 1.
Summary of Panel Study of Income Dynamics/Philanthropy Panel Study Data.
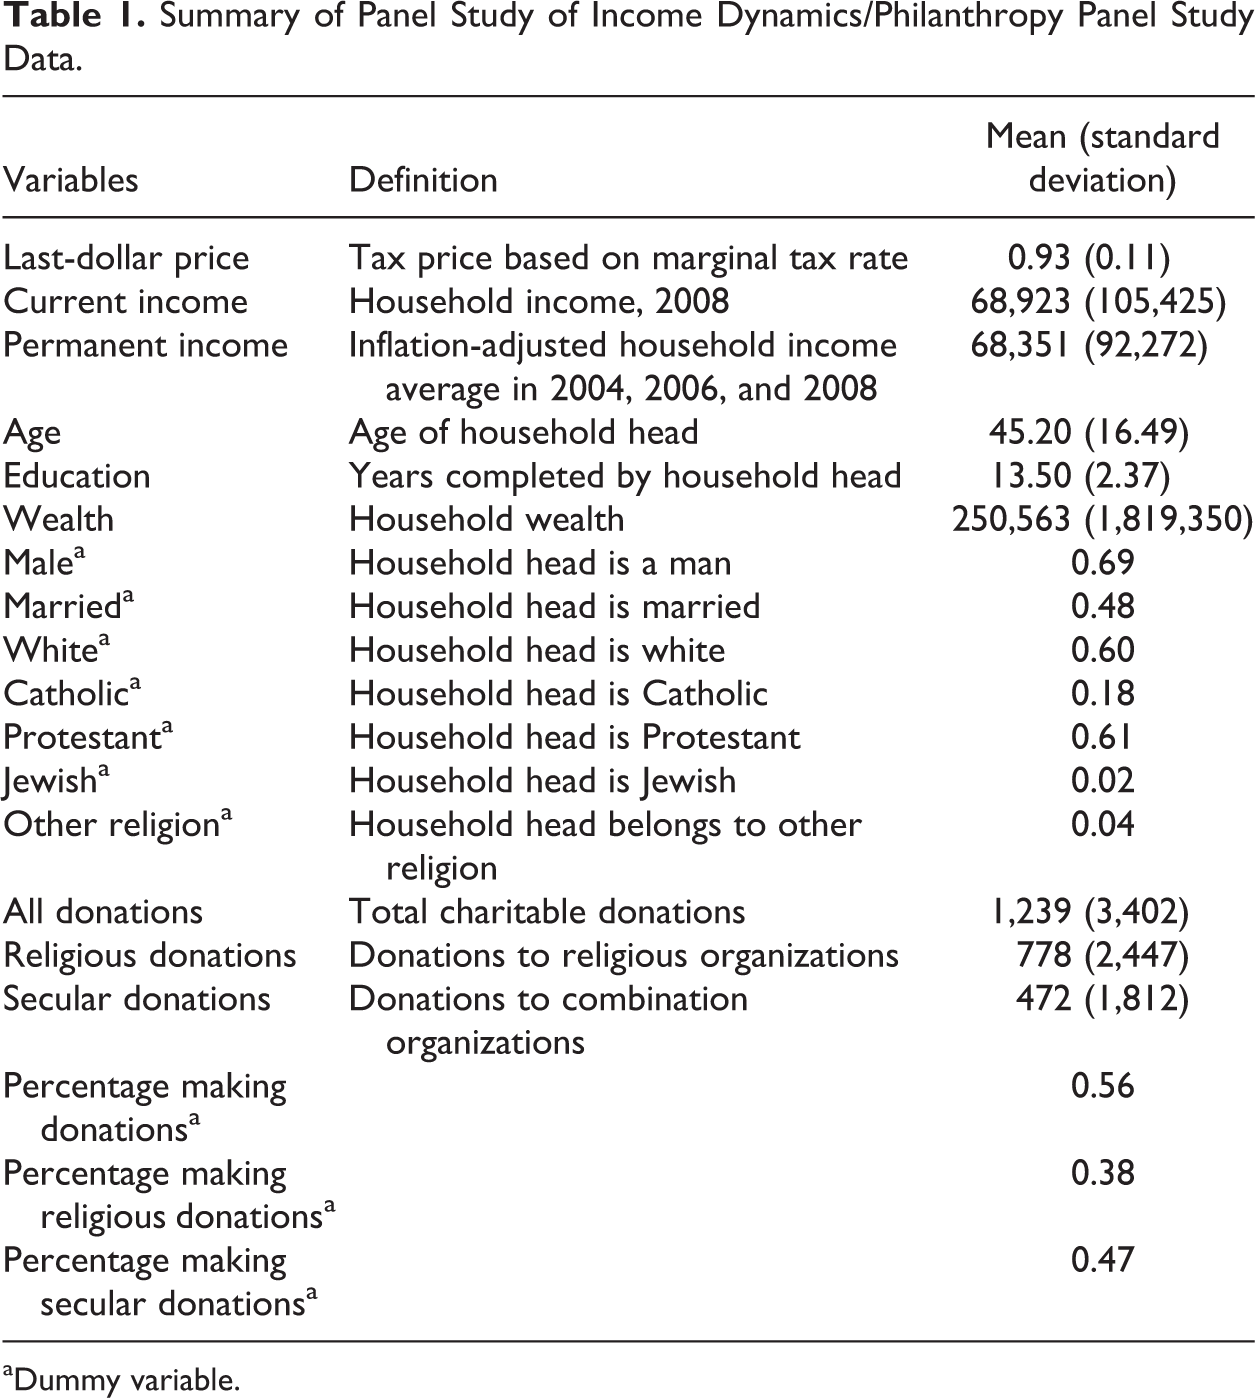
aDummy variable.
In 2008, 56 percent of households in the sample made charitable contributions, averaging US$1,239. The average household contributed 1.60 percent of gross income to charity. Among those making positive contributions, the percentage was 2.40 percent.
Traditionally, the PSID/PPS has found lower giving rates than other surveys, because it does not count gifts under US$20 (Brooks 2007a). 10 However, US$1,239 is lower than even the previous years of PSID data analysis. For example, the 2001 PSID (which measured giving in calendar year 2000) found the average giving level was US$1,221 to US$1,512 in 2008 dollars—and 64 percent of households gave. This is consistent with the evidence presented earlier that charitable giving has dropped substantially during the recession.
The unweighted average marginal tax rate in 2008 was 19 percent. Using this average marginal tax rate and factoring in whether a taxpayer itemized deductions, the unweighted average tax price of giving in 2008 was 0.93.
The mean household income in the 2008 data was US$68,923 and the median was US$49,700, which is very close to the median value US$49,341 in the US Census data. The average respondent had some college education (about 13.50 years of education). Wealth had a mean value of US$250,563 and a median value of US$27,500, confirming the expected skewness of the wealth distribution. Sixty percent of the sample were white and 79 percent were either Protestant (60 percent) or Catholic (18 percent). Fifteen percent of the sample identified with no religion.
Empirical Results
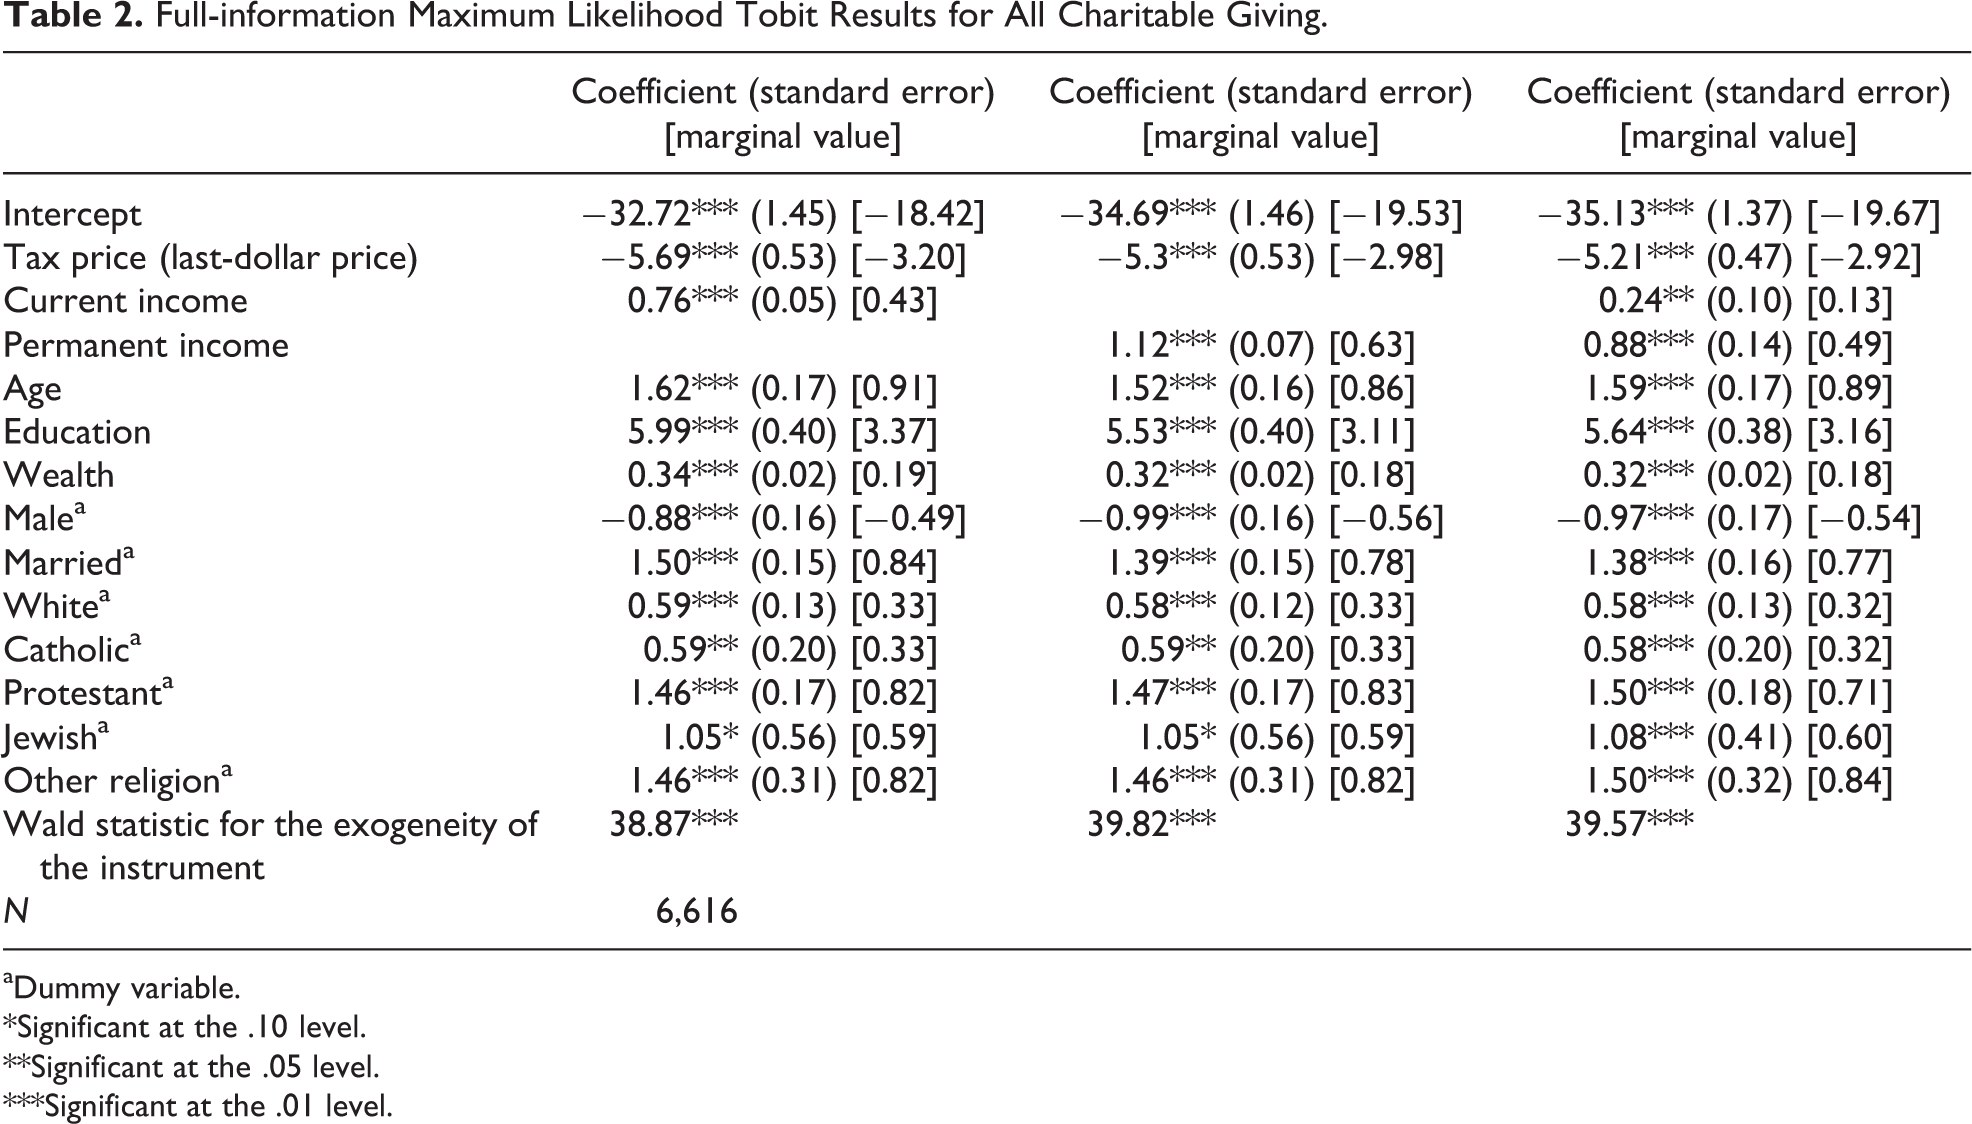
Table 2 presents the results of FIML Tobit models for all donations. The first model uses the permanent income measure, the second uses current income, and the third includes both. To estimate the marginal effect from each coefficient, I adjust the raw coefficients by the proportion of positive givers (0.56).
Full-information Maximum Likelihood Tobit Results for All Charitable Giving.
aDummy variable.
*Significant at the .10 level.
**Significant at the .05 level.
***Significant at the .01 level.
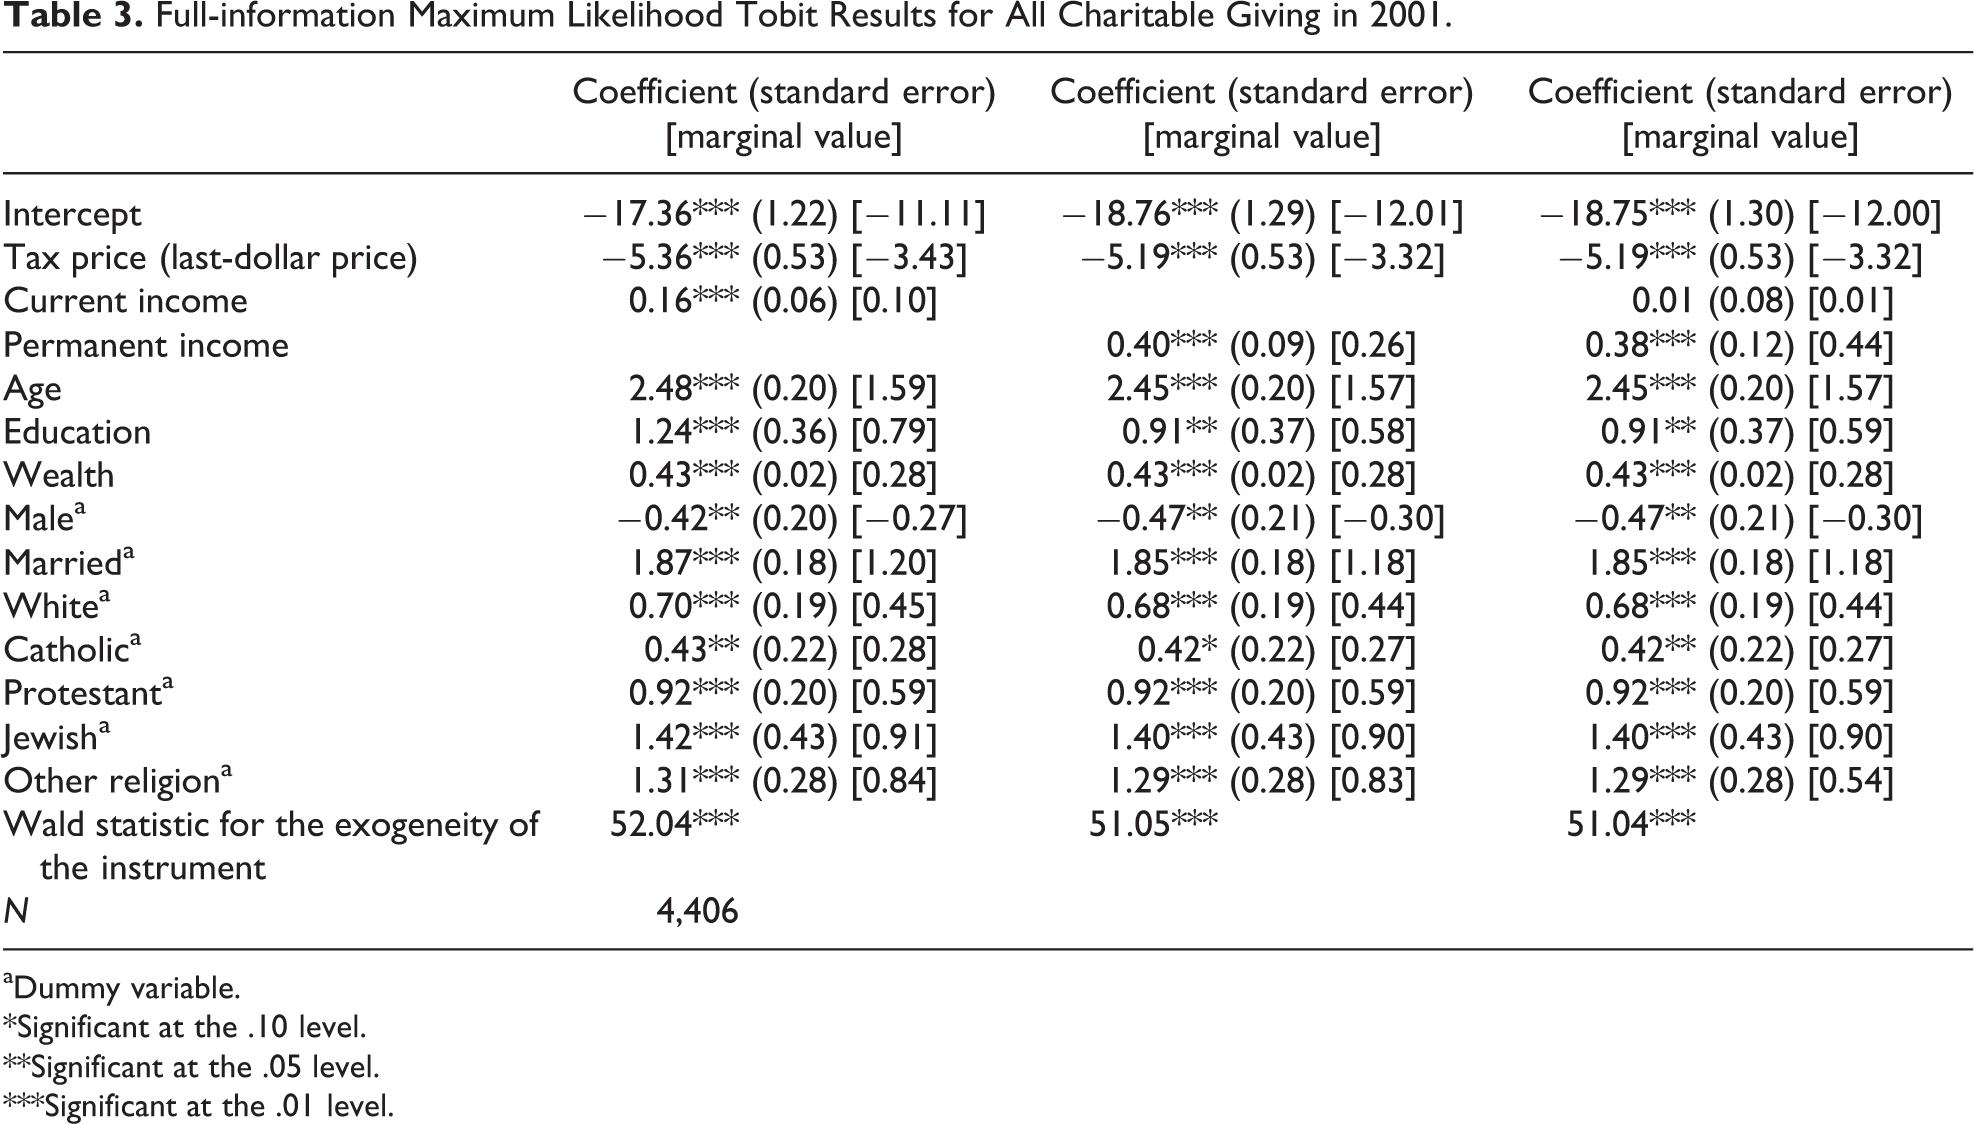
The regression results in table 2 tell the story of giving in the wake of the recession. To begin with, the tax price elasticity of about −3 is higher (in absolute terms) than the longtime literature “norm” of unity and significantly larger even than more recent estimates from panel data (Bakija and Heim 2011). However, this finding is tempered when comparing the 2009 results to those from the same data set in 2001 (table 3). Indeed, the 2009 price elasticity is somewhat lower than it was eight years earlier, notwithstanding its unusually high value compared to studies using other data sets.
Full-information Maximum Likelihood Tobit Results for All Charitable Giving in 2001.
aDummy variable.
*Significant at the .10 level.
**Significant at the .05 level.
***Significant at the .01 level.
Second, current income elasticity is somewhat lower than what research typically finds. This is true both when permanent income is excluded (0.43) and when both sources of income are factored in the model (0.13). However, these elasticities are slightly elevated when compared to the 2001 estimates drawn from the PSID data (table 3).
Third, the permanent income elasticity is higher than current income elasticity (0.49 vs. 0.13). This is consistent with the last finding that income elasticity is depressed in a period of falling income as households give closer to habitual levels as opposed to income-dictated levels. This is consistent with the findings of Auten, Sieg, and Clotfelter (2002) who found that the permanent income elasticity tends to be higher than current income elasticity.
The other coefficients in table 2 are fairly straightforward and consistent with past studies. Giving is inelastic in wealth, with a coefficient of just under 0.20. Age and education are positively associated with giving: a 10-percent increase in age is linked to a 9-percent increase in giving, while a 10-percent increase in education is associated with an increase in giving of more than 30 percent. Ceteris paribus, gender, race, marriage, and religious affiliation are all also significantly correlated with giving.
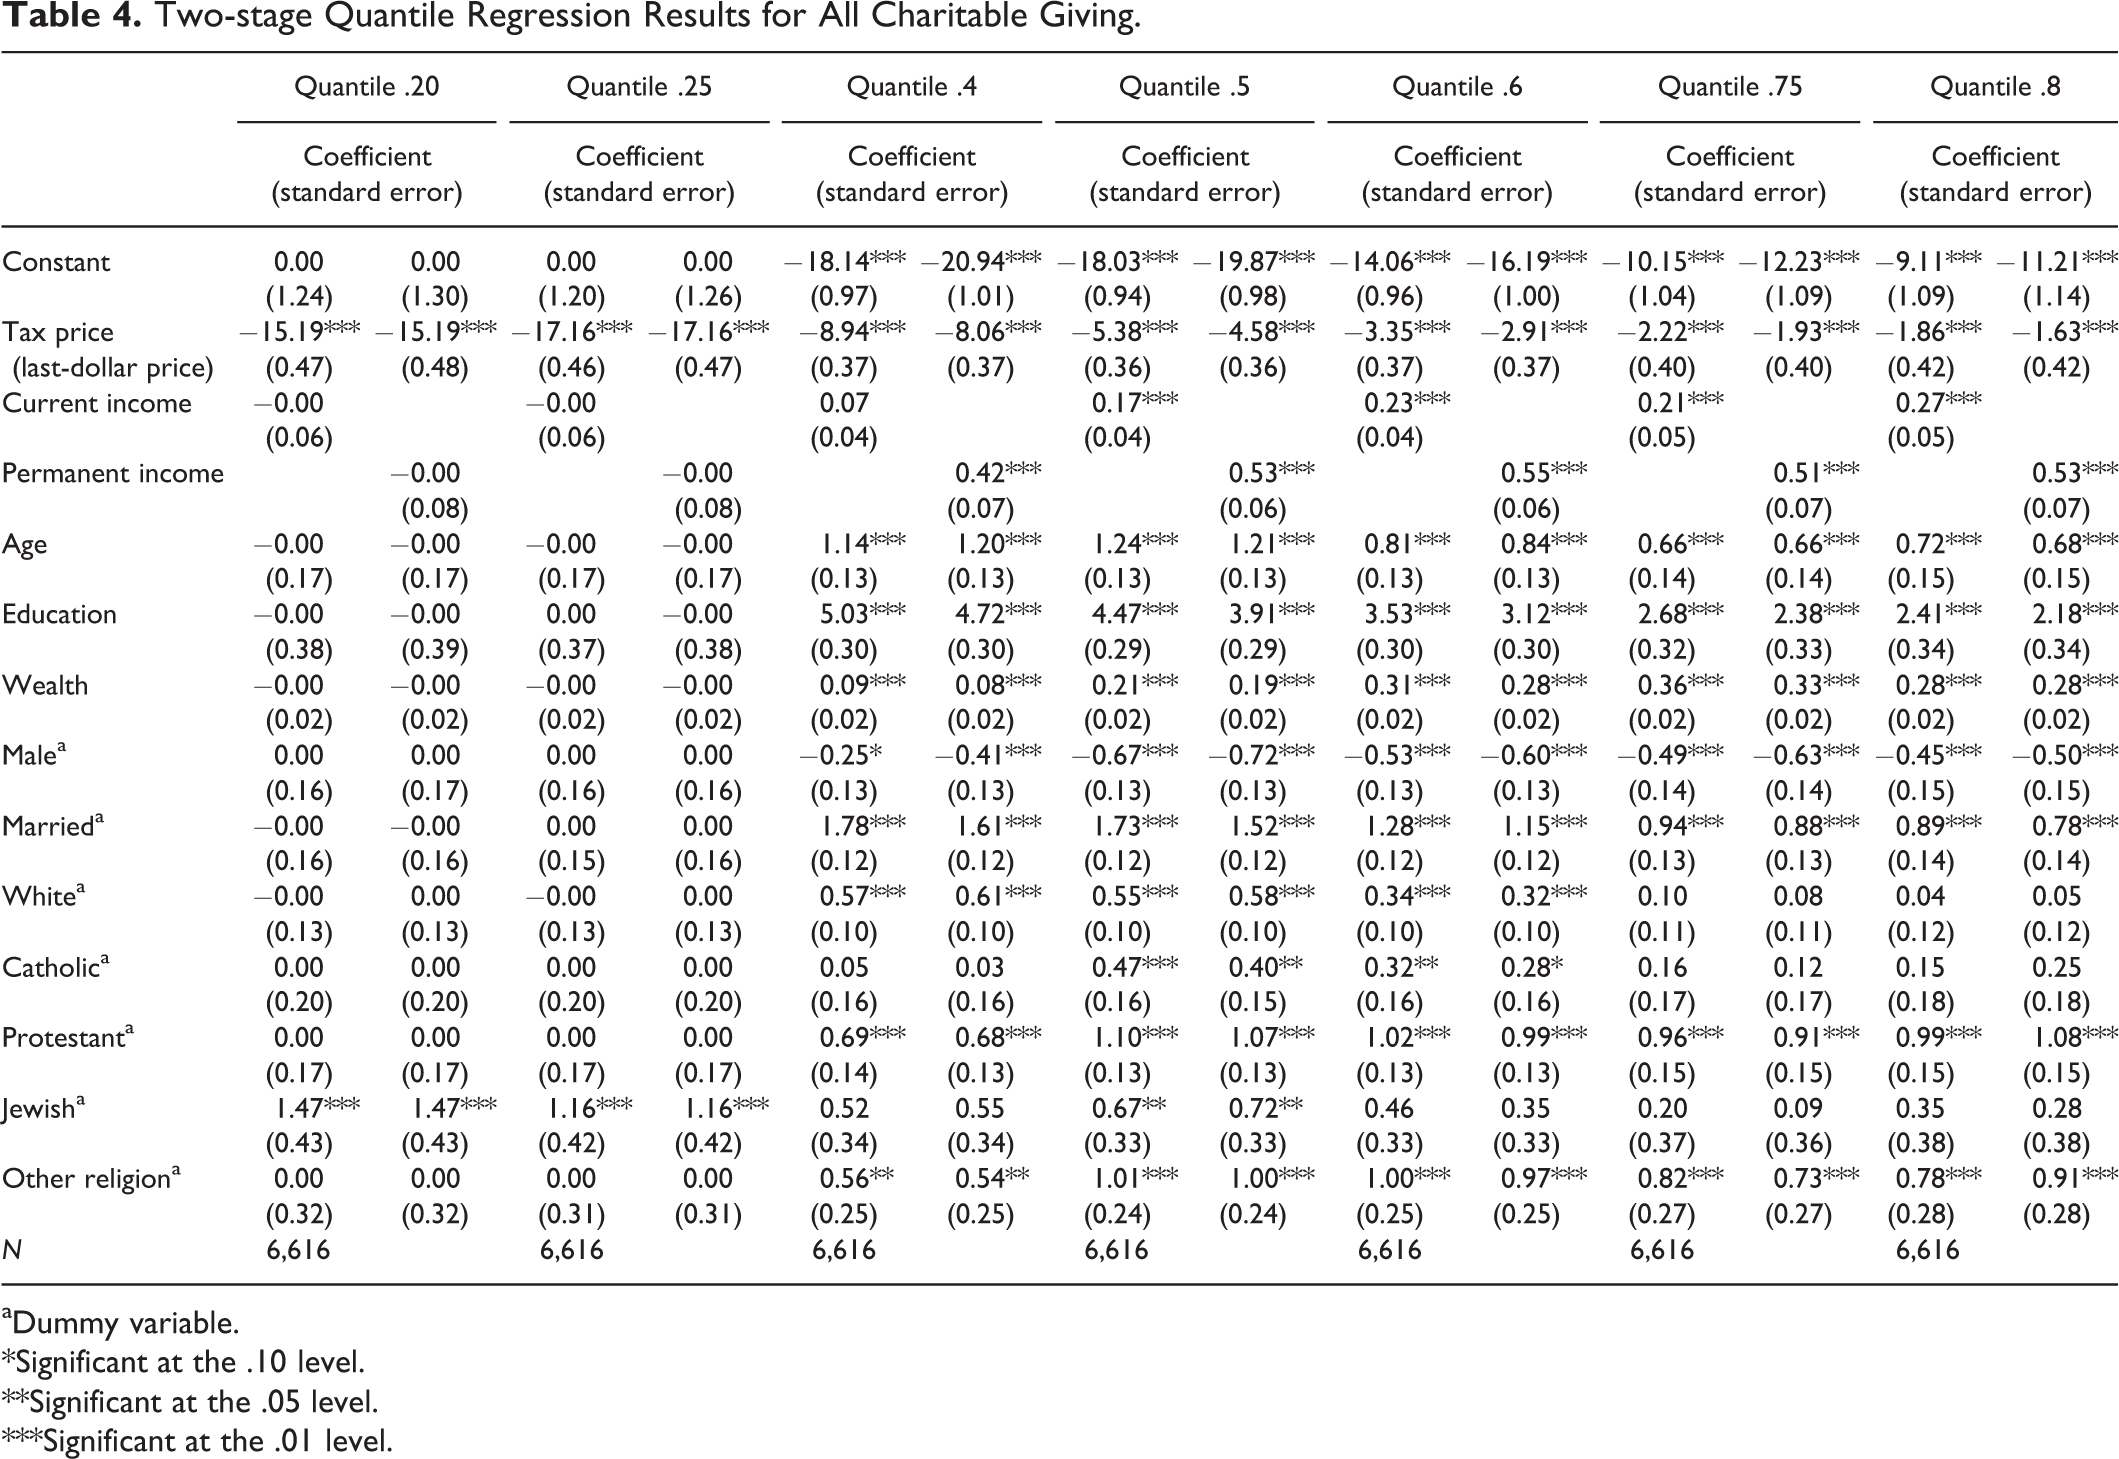
Table 4 presents the two-stage quantile regression results. These are similar to the FIML Tobit results but add some granularity to the estimates at different quantiles in the giving distribution. The first decile is not calculable because the large number of zeros prohibits convergence. Starting at the second decile, the tax price elasticity falls (in absolute terms) as donations rise but remains consistently higher throughout the distribution than the historic estimates. It is closest to the FIML Tobit estimated at the sixtieth percentile. Current and permanent income effects are even lower in the quantile regression than in the Tobit models, reinforcing the overall finding that income elasticities are depressed in 2009 compared to historical levels.
Two-stage Quantile Regression Results for All Charitable Giving.
aDummy variable.
*Significant at the .10 level.
**Significant at the .05 level.
***Significant at the .01 level.
Assuming that the wealthy donate more to charity, table 4 yields interesting insights about a potential link between wealth and giving. For one, these findings do not suggest that wealthy donors are more responsive to changes in tax price. In fact, as noted above, tax price elasticity decreases as we move higher in the giving distribution. This suggests that big donors are less responsive to changes in tax price than others, in contrast to what might be predicted by the findings of List (2011).
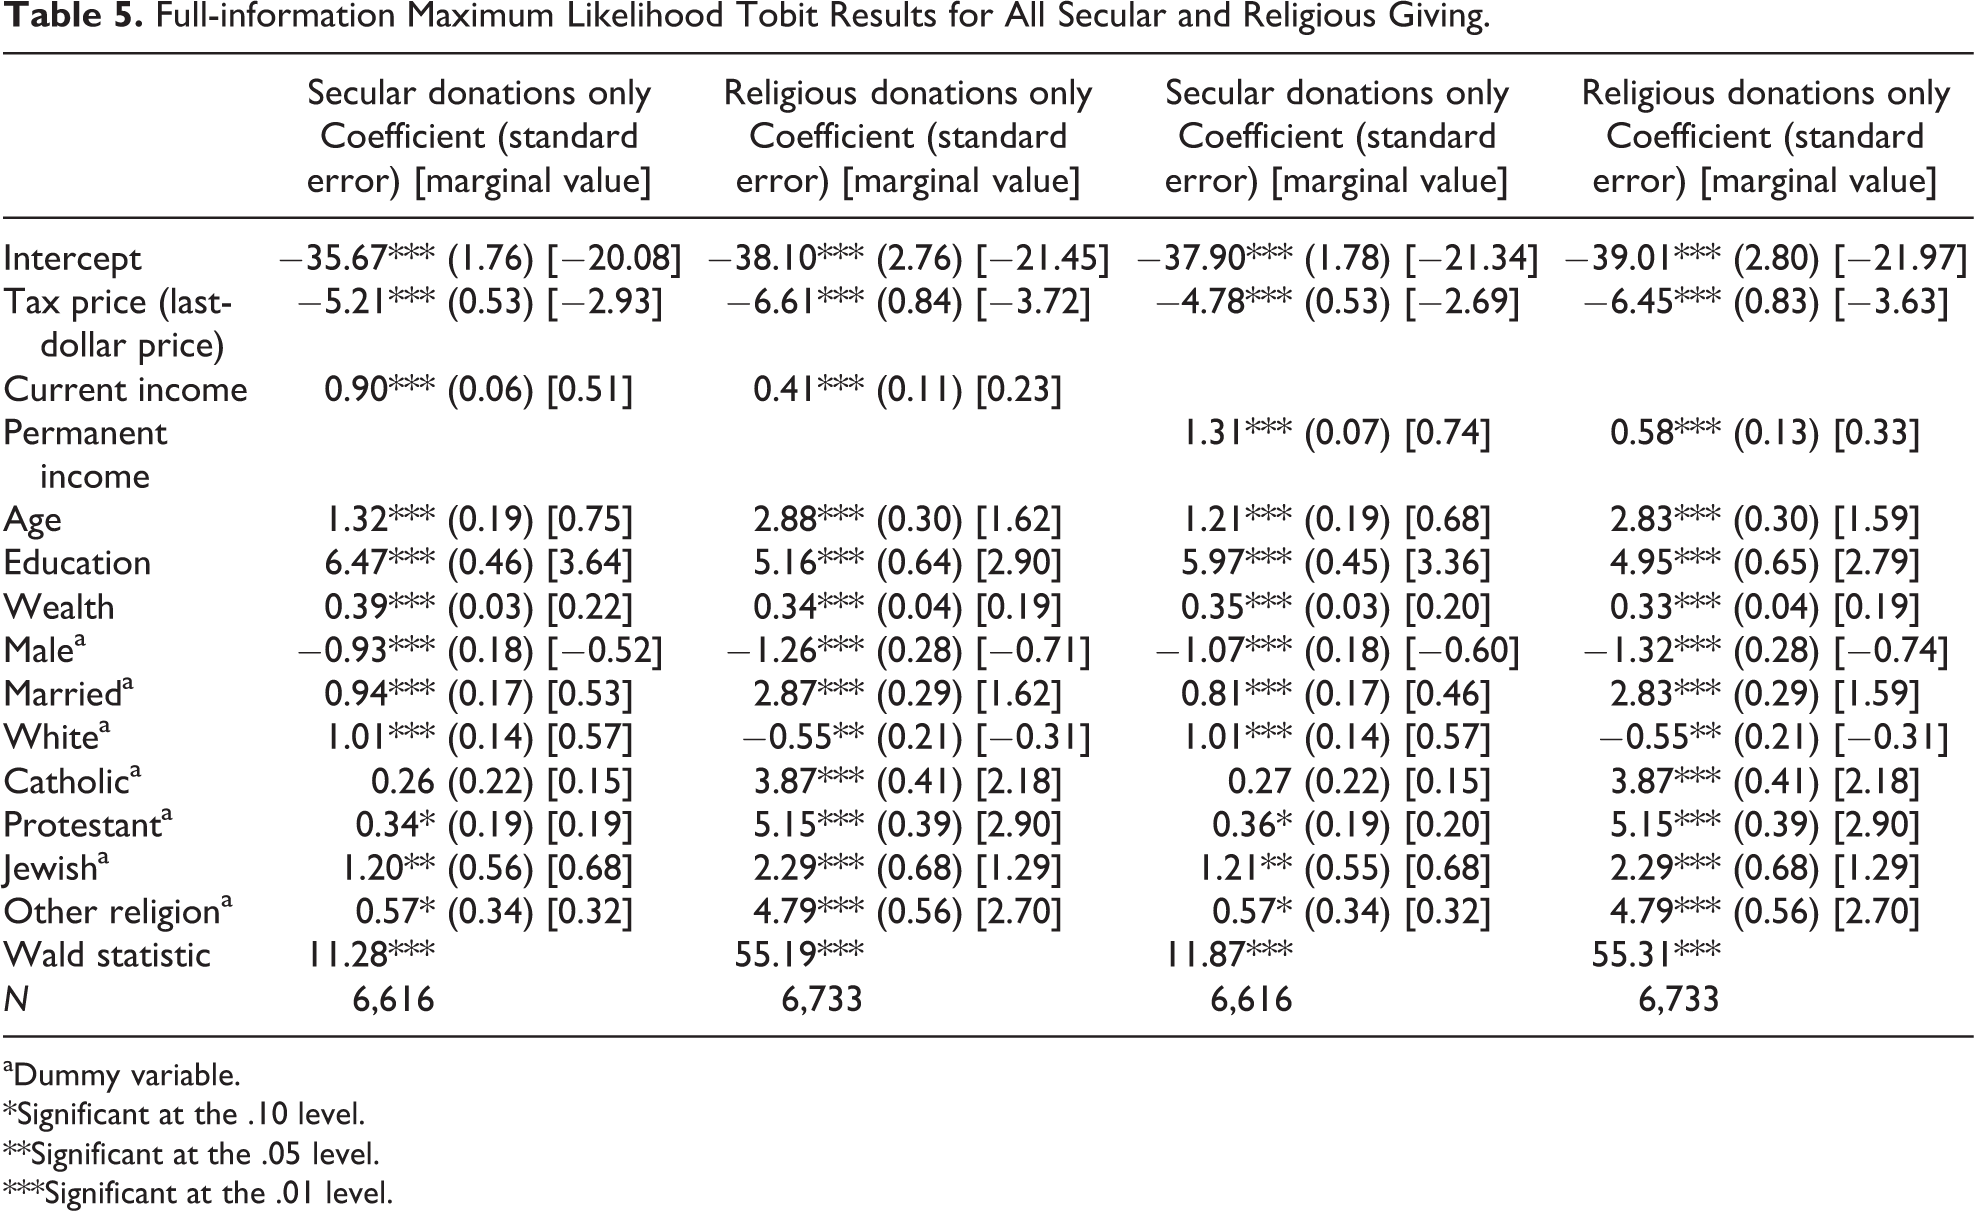
We turn now to the differences between giving to religious and secular organizations. To be sure, this is an imperfect distinction in the PSID/PPS data. Religious contributions are classified as those to “religious organizations,” all other contributions are those I classify as “secular.” This will inevitably lead to misclassifications in cases such as Catholic hospitals. However, it should capture the difference between houses of worship and other organizations dedicated solely to religious activity compared to other nonprofits.
Three points stand out in the inspection of the results in table 5. First, the basic patterns from tables 2 through 4 play out in both religious and secular giving: price elasticity is elevated over typical historic levels, income elasticity is depressed, and permanent income elasticity is higher than current income elasticity.
Full-information Maximum Likelihood Tobit Results for All Secular and Religious Giving.
aDummy variable.
*Significant at the .10 level.
**Significant at the .05 level.
***Significant at the .01 level.
Second, religious giving has a much lower income elasticity than that for secular giving, reinforcing the idea that religious gifts may be especially resistant to pressure from falling income. To some, this might seem surprising. After all, many churches encourage their congregations to donate a fixed percentage of their income (i.e., tithe). This would imply an elasticity closer to unity since donations are, under a strict tithing assumption, predicted to fall in direct proportion to income. Two possible explanations exist for why income elasticities for religious giving are inelastic. First, there might exist a floor of giving for religious donors. Second, it may possibly be the case that religious donors do not follow tithing rules as rigidly as they are prescribed.
As in the case of general giving, the price elasticity of religious and secular giving stands out when compared to the extant literature. For one, this article finds both to be price elastic (i.e., less than −1). These estimates contrast with previous studies that tend to find religious giving to be price inelastic and secular giving to be elastic (Feldstein 1975; Reece 1979). They also imply that religious giving is more elastic with respect to price than secular giving.
A few other results stand out. The positive association between age or marriage and religious donations is stronger than it is for secular donations, while education has the opposite effect. Unsurprisingly, all religious affiliations affect religious giving more than secular giving; however, it is notable that all religious affiliations except Catholic are associated with significantly higher secular giving. This is especially intriguing since the extent to which religious individuals donate to secular causes is an unsettled question within the literature. 11
Discussion and Policy Analysis
The findings above from 2009 (and 2001) suggest the Great Recession may have had an impact on giving patterns, by depressing price elasticity and increasing income elasticity. This bolsters the income inequality hypothesis.
Table 4 clearly shows that current and permanent income elasticities are higher at the top end of the giving distribution. Assuming that big givers are high earners, this suggests the wealthy are more sensitive to income changes. If a higher concentration of income concentrated among the wealthy, then we would logically expect average income elasticities to be higher during this time.
Another factor affecting income elasticities may have been elevated income volatility, a concept closely related to economic uncertainty. Hughes and Luksetich (2008) find that income volatility negatively impacts charitable giving, even when holding persistent income and current income constant. Researchers have noted large income shocks occur during recessions (Guvenen, Ozkan, and Song 2012). As such, it is plausible that income volatility may have decreased charitable giving during the Great Recession—a period when income volatility was exceptionally high (Guvenen, Ozkan, and Song 2012). If true, this would probably be reflected in income elasticities that are more elastic, explaining the increase from 2001 to 2009.
I now turn to policy analysis using the new elasticity estimates to show the effects of potential tax law changes on charitable giving. In January 2013, President Barack Obama signed into law the American Taxpayer Relief Act of 2012, which increases the top marginal personal income tax rate from 35 percent to 39.60 percent for annual taxable income above US$450,000 (for couples filing jointly). The PSID/PPS data show that 0.51 percent of families both have income affected by the increase and itemize deductions. Their effective tax price of giving would thus drop from 0.65 to 0.60 per dollar donated, a price decrease of 7.07 percent. The price effect would be at least partially offset by the income effect of lower disposable income from a higher tax bill, ceteris paribus.
An example helps to make the price and income effects clear. Imagine a family with US$1 million in annual income and charitable donations of US$20,000 (2 percent of income). Ignoring all other deductions and income adjustments for simplicity, the tax increase will lower their disposable income by 2.53 percent or US$25,300. As mentioned above, their tax price of giving falls by a bit over 7 percent. Applying the permanent income and price elasticity estimates in table 2 (0.63 and −2.98, respectively), we can see that the income effect on giving is predicted to be −1.60 percent or −US$320. 12 Meanwhile, the price effect is predicted to be +21.12 percent or US$4,223. The net effect on giving is estimated to be +19.50 percent or US$3,903.
To many laypeople, this is a counterintuitive result, because it predicts that the tax increase leads to a relatively large increase in short-run giving. This is completely predictable, however, given the nature and magnitude of the income and price effects. Of course, because the policy change affects only about 0.5 of the 1 percent of taxpayers, the net effect on philanthropy will be much lower than the percentage for the example family. Using the PSID/PPS data, the net effect of the tax increase is an increase in total giving of about 1.13 percent.
A more complicated policy reform proposal is a cap on deductions, which would limit the tax saving for each dollar of deductions taken by high-income households. One level that is frequently considered is 28 percent, the cap proposed by President Obama in his Fiscal Year 2013 budget and previous budgets, and a level still sought by many leaders in the US House and Senate in 2016 (although it will probably be less popular in the Republican-dominated Congress in 2017). This constraint would only bind households with a top marginal income tax rate above this level. For an itemizer at the top marginal rate, this means a tax price increase of 10.80 percent (from the old top rate of 35 percent) or 19.20 percent (from 39.60 percent). In the case of this policy, there is only a price effect because the tax rate has not risen or fallen; only the tax price has risen.
For the example family above, earning US$1 million, their tax price rises from 0.60 to 0.72. After the tax increase above, they are giving US$23,903 (US$20,000 + US$3,903). The new price effect on giving for this family will be (once again using the −2.98 elasticity) −57.30 percent, or −US$13,699, for a new giving level of US$10,205.
Again, this example is especially pronounced because it centers on the small percentage of the population affected: extremely high earners who itemize deductions. What happens when we look across the whole population? Table 6 summarizes the predicted impact of a 28-percent cap in the cases of all giving, secular giving, religious giving, and the top 1 percent of earners.
Predicted Effects on Giving of a 28-Percent Deductions Cap.
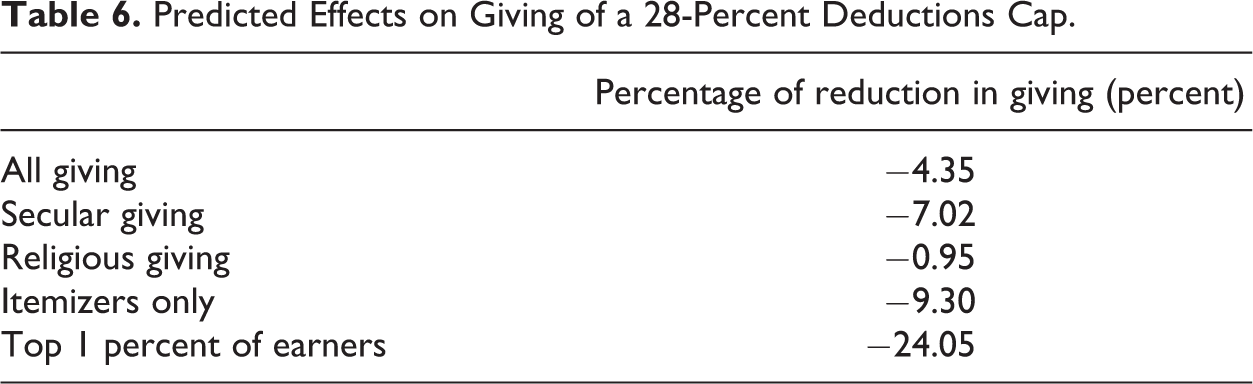
The 28-percent cap could be expected to lower total charitable giving in the short run by 4.35 percent, ceteris paribus. 13 Based on the Giving USA estimate that individual giving came to approximately US$258 billion in 2015, we can calculate a total loss of giving from this cap of about US$11.2 billion in the first year.
Using the permanent income estimates for tax price elasticity for secular and religious gifts, we can predict a loss of annual giving in these two categories of 7.02 percent and 0.95 percent, respectively. The muted effect on religious giving is due to both the lower price elasticity and the fact that lower income households and nonitemizers are overrepresented in this group of givers.
The most profound effect comes when we consider the top 1 percent of earners who itemize deductions. Why look specifically at this group? To begin with, they represent 7.40 percent of all dollars given in the PSID/PPS data. Second, many so-called elite nonprofits disproportionately draw from this donor pool—top universities and think tanks, symphony orchestras, some hospitals, and certain environmental groups, to name a few. Among this group of donors, we estimate a 24-percent reduction in giving from the 28-percent deduction cap. For nonprofits operating largely within this donor base, the results would be serious—maybe catastrophic.
There exists one major caveat to these predictions; namely, the dynamic economic effects of tax reform. Some commentators believe that the adverse effects of a deduction cap or floor (not implemented but considered) could be offset by positive growth effects of tax reform (Marr, Huang, and Friedman 2013). If so, that would attenuate the negative effects predicted here. In addition, there are probably relevant behavioral dynamics that would change the impacts in the long run. For example, charitable giving patterns might revert to historical norms after a period of time after a deductions cap. These hypotheses cannot be tested with the PSID/PPS data.
Further Research and Conclusion
This research has shown that the historically typical price and income elasticities are not applicable in the wake of the Great Recession. When compared to typical estimates, price elasticity is higher (in absolute terms), while income elasticity is lower. Policy analysis shows that these unusual elasticities have consequential implications for American giving as tax policy changes. The 2013 tax increases should have had a small positive impact on giving, while the likely tax rate decreases in 2017 should have the opposite effect. Meanwhile, any deduction cap would have a large negative impact on giving.
Several questions remain for future research. For example, the 2009 data and later data rounds offer a rich set of research possibilities not addressed here. For example, the role of wealth is not central to this article, but wealth changes played a large role in the recession. How did this affect giving? Related to this, how did Americans’ changing relationship with debt affect donations? Careful study of wealth and debt elasticities could provide important insights. Apart from wealth and income, the role of policy uncertainty needs to be further explored. As mentioned above, a growing literature suggests uncertainty dampens economic growth. Perhaps insights from this line of research could be used to better understand giving during economic crises.
Second, the large differences between the PSID/PPS results in 2001/2009 and the bulk of the extant research are worth investigating. Indeed, merely comparing the 2009 results here with literature norms would imply elasticity changes that are opposite those we see in a comparison with the same data in an earlier year.
The work here leaves many theoretical questions unanswered as well. For example, a structural model of giving behavior in a stochastic tax policy environment might elucidate the elevated price elasticity found here. Similarly, a model that featured an effective “giving floor” could help us understand the muted income elasticity in the face of the recession’s income downdraft. Related to this, it would be useful to develop a structural model that compares the asymmetric effects of income increases and decreases in the short and long runs. Future studies could also explore the theoretical ramifications of heterogeneous effects within the giving distribution, a concept briefly touched upon in this article.
Finally, future authors might choose to take up several public and nonprofit management issues raised here. For example, what are the impacts on public services we could expect from tax and income changes affecting philanthropy? How should public and nonprofit managers react to mute adverse effects? These and other research questions will fruitfully occupy future work.
Footnotes
Acknowledgments
The author is grateful to Jim Alm and three anonymous referees, Mike Strain, Alan Viard, and Rachel Ayerst-Manfredi, for their helpful comments. Andrew Quinn, Austin Peters, and Emma Bartlett provided excellent research assistance.
Declaration of Conflicting Interests
The author(s) declared no potential conflicts of interest with respect to the research, authorship, and/or publication of this article.
Funding
The author(s) received no financial support for the research, authorship, and/or publication of this article.