
Abstract
This article assesses the neutrality of Captura de Plusvalía, a land value capture policy implemented in Bogotá (Colombia) in 2004. The case offers a rare opportunity for assessment because the policy application had a scattered spatial and temporal structure but on an urban agglomeration ruled by a single master plan and revenue collecting authority. The analysis reveals that (a) the relationship between value capture and prices is negative (static neutrality); (b) this result holds under various spatial specifications and controls; (c) the policy is not endogenous to the built output or the spatial distribution of the land prices; and (d) there is no evidence of preemption, a theoretical feature where landowners consider that the policy onset represents a regulatory taking, compelling them to accelerate developing timing (dynamic neutrality).
Land value capture strategies have been widely promoted as efficient local public finance tools (Fernandez, Kapfer, and Creutzig 2016). This growing importance, however, has not been sufficiently supported by evidence regarding their spatial economy effects. Particularly, more research is required about neutrality, an advantage when compared to traditional property taxes (Wildasin 1988). The neutrality of the pure land tax is caused by the inelasticity of land supply and manifests as a decreasing effect of the tax on the land prices (Needham 2000).
The land value development tax (LVDT) is a value capture (Captura de Plusvalía) strategy implemented in Bogotá in 2004. This city offers an interesting case study because the implementation of the LVDT had clearly traceable spatial and temporal variations. Garza and Lizieri (2016) demonstrated that the LVDT rate in Bogotá had its expected negative sign on land prices, while leaving untouched the amount of built environment. These authors, however, did not analyze the dynamic adjustment and the possible sample selection bias of the policy application. This article emphasizes those concerns.
The spatial dynamics of land value taxation as an urban regulation is described by Turnbull (2005). In this theory, landowners/developers perceive the onset of enacting a land exaction as the period before a regulatory taking by the state. In such a case, value capture is not neutral because the rents flow is a function of the time when the regulation is enabled.
In this article, we assess whether value capture in Bogotá has been neutral, using public spatial information about land prices and uses, planning, socioeconomic conditions, and economic and construction sector performance during 2001 to 2010. The empirical strategy distils into a series of spatially controlled difference-in-differences (DiD) and spatial DiD models. Specifically, we will test the following hypothesis: (a) the relationship between value capture and prices is negative; (b) that relationship holds, even when prices are positively associated to the built output; and (c) if we use proxies for the value capture that differ in spatial and temporal scope, there should not be differences in the absolute value of their parameters (the effect of dynamic adjustment).
This article follows the logic and uses the same source of land prices information for Bogotá as Garza and Lizieri (2016). However, our treatment of the information and subsequent analysis is completely different. We are not clustering or aggregating the land prices information to adapt it to a planning geographical classification. Quite the opposite, we are adapting all the sources of information to the available information on land prices. In addition, our sample selection models correct for potential value capture endogeneity.
The Conceptual Problem
Land taxation has been considered an ideal source of public finance because of being neutral. It does not affect the built environment market. The pure land tax is neutral because it is charged on a residual value, the capitalization of land rent as determined by location. Pure land (site value) taxes have been charged in places as different as Australia, South Africa, and Jamaica (Franzsen 2005). Pittsburgh and Hawaii have had split-rate taxation, charging land more than proportionally to structures. There are evidences regarding the market neutrality of such a policy (Oates and Schwab 1997; Plassman and Tideman 2000; Kwak and Mak 2011).
Pure land taxation is, however, rarely used, and there are more examples of using one-time land exactions, including impact fees (Ihlanfeldt and Shaugnessy 2004), development gains tariffs (Connellan 2004), land transfer taxes (Haider, Anwar, and Holmes 2016), and land development taxes (Korthals 2009). The United States has had a consistent trend toward the replacement of traditionally unpopular property taxes for these exactions (Rosenberg 2006).
LVDT
LVDT have two problematic features when compared to the pure land tax. The first one being that they are levied and charged only when there is a development request; consequently, they are not a steady source of revenue. The second, and most relevant for our research purposes, is that they might not be neutral (Rose 1973).
In addition, the LVDT effect on land prices can be detected only when there is a low degree of spatial substitution between submarkets. Figure 1 represents this idea. The upper panels of figure 1 represent a housing market and the effect of a limiting urban regulation, the panels in the middle show the transmission of such an effect in the land price, while the lower panels represent the impact of LVDT.
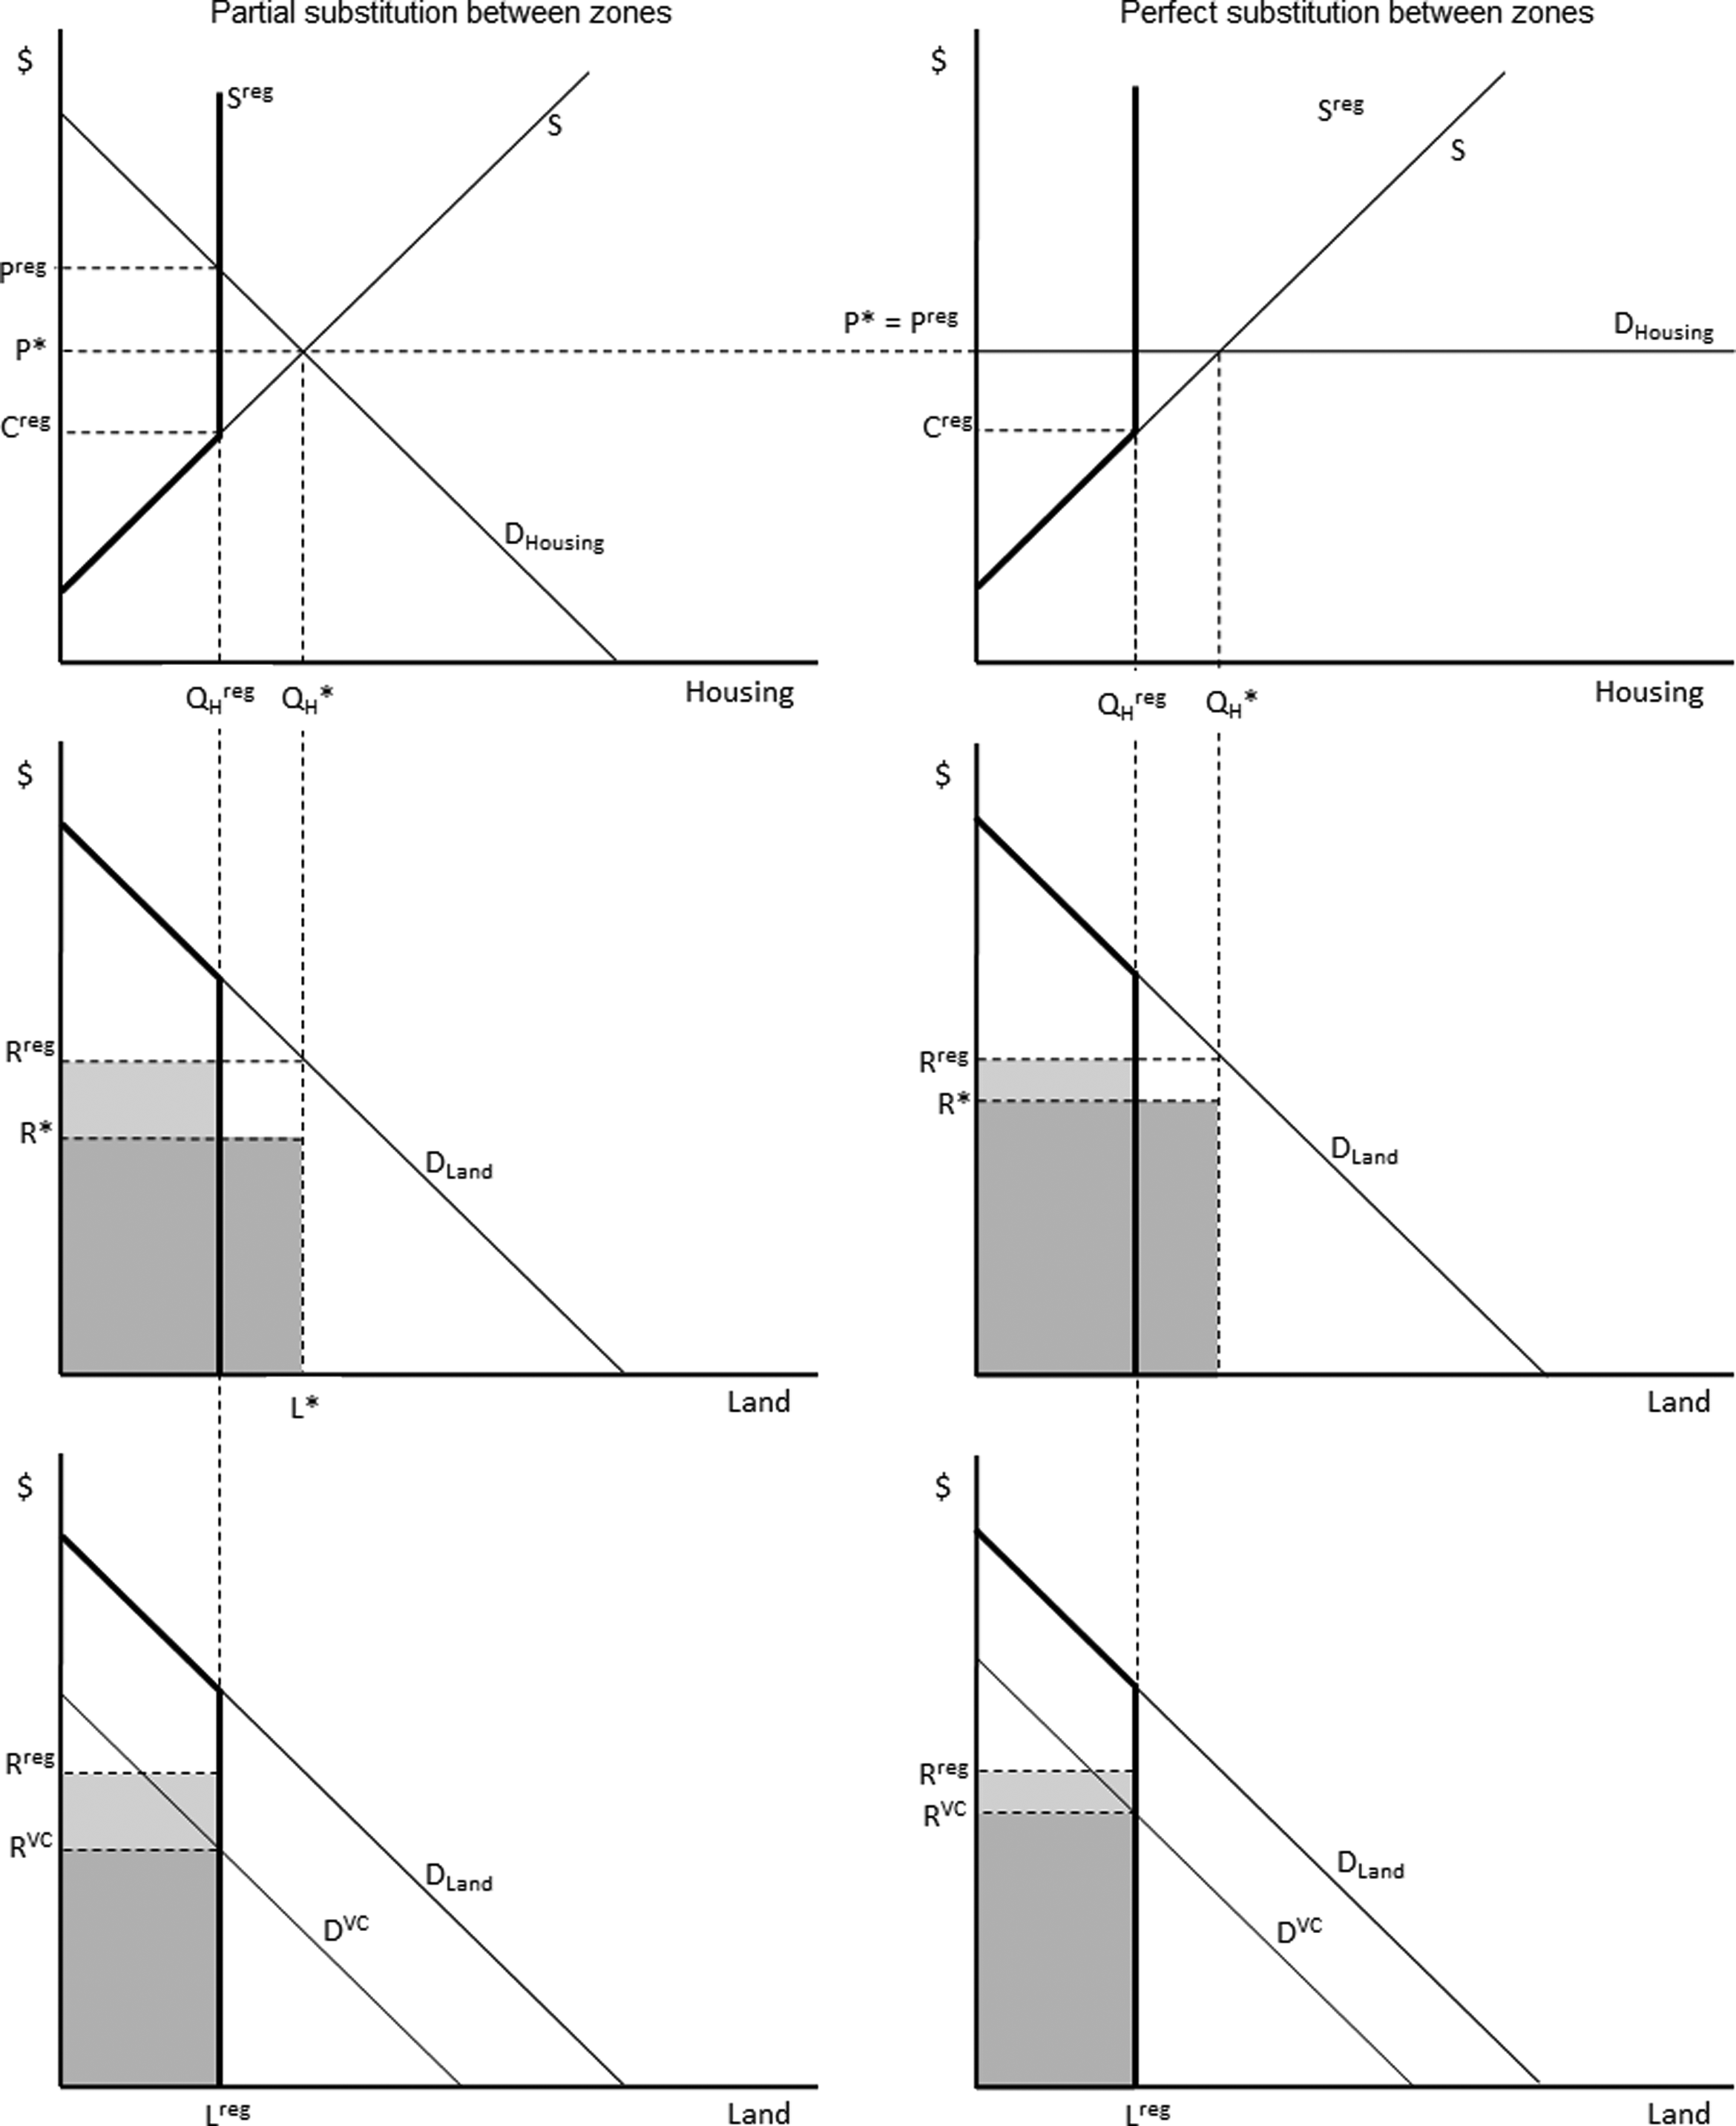
Regulation and value capture with different demand substitution between submarkets.
Figure 1 represents two types of housing markets for a spatial unit and the corresponding spatial relation between it and other submarkets: the left side panels have partial substitution between zones, and the housing demand is downward sloping; right side panels have perfect substitution between zones, and the housing demand is horizontal (infinite elasticity).
The upper left panel of figure 1 shows how regulation diminishes total supply from S to S reg, and housing price per square meter increases from p* to p reg. Land rent (measured as the difference between price and cost) increases from R* to R reg in the middle left panel. In the upper right panel, regulation also produces a supply shortage, but prices do not increase because the demand substitution allows consumers to buy housing in neighboring zones. That is why in the middle right panel the land rent does not increase in the same proportion as it does in the left panel (the difference between R* and R reg).
In the bottom panels of figure 1, we examine the LVDT impact on land markets. In the left panel, the LVDT rate is 50 percent, diminishing the residual land rent from R reg to R VC (and demand payment capability from D reg to D VC) but leaving the amount and price of housing untouched in the top panel. The same effect on prices is smaller in the right panel, even when it is also neutral (it leaves untouched the housing quantity). Consequently, econometric analyses will most likely detect an LVDT effect in cases like the one depicted in the left panels, with a low degree of substitution between zones (e.g., when there is high socioeconomic spatial segregation).
Dynamic Features
The static comparative results presented above might vary in a dynamic setting. Turnbull (2005) presents a theoretical framework where the threat of being subjected to regulations can accelerate development timing. Anderson (2005) builds upon that theoretical framework when analyzing the dynamic effect of impact fees as planning tools that have the same effect of regulatory takings. The threat of taxation (or rates increase) might accelerate development timing when market-defined (demand) structural density is increasing. This requires income growth control in an econometric panel setting. There are two cases: (a) if the LVDT is charged before development occurs, and demand is growing, it must be dynamically neutral; and (b) if the LVDT is charged at the precise moment of development, and demand is growing, its effect on development timing is uncertain and should be empirically determined.
These dynamic features have a crucial importance for econometric assessment because the regulatory threat could manifest as a preemption of the development potential and the enacting of the tax per zones will show no detectable effect. Our case study resembles the situation depicted because the LVDT is charged at the moment of development, with economic growth, and following a scattered spatial and temporal agenda that permits us to examine possible early dynamic adjustment by landowners/developers.
The Case Study
Bogotá, Colombia’s capital, has 7.1 million inhabitants and about 36,000 hectares of built environment. The city is limited by the Andes Mountains to the East and the Bogotá River to the West, and it is a continuous and very dense urban agglomeration (Inostroza, Baur, and Csaplovics 2013).
The city enacted its LVDT in 2003 and started levying and charging it in 2004. The tax is ruled by spatial planning units (UPZs) as defined in the master plan 2000, and its levying requires the Planning Department (Secretaría Distrital de Planeación [SDP]) to assess every UPZ to detect areas with an expected price increase effect due to public action (either infrastructural or regulatory). 1 Every time a construction license is requested in the areas under surveillance, a double appraisal of the project will determine the amount to pay, and the city collections authority produces the corresponding bill. The LVDT is charged as a percentage of the land price increase due to public action, and such rate went from 30 percent in 2004 to 40 percent in 2005 and 50 percent since 2006 and onward. 2
These processes have been burdensome for the SDP, and the definition of all the areas with LVDT potential has been slow and spatially uneven. The LVDT cases can be freely obtained in the website of SDP for the years 2004 to 2008. 3
Consequently, in Bogotá, we can track the temporal/spatial onset of the policy zone by zone, in a large urban agglomeration regulated by a single master plan and with the same authority for levying and charging the tax (Amézquita, Sánchez, and Abaunza 2015). These are advantages for our research because, in other countries, the land exactions can be either monetary or in kind, have a long-standing tradition that does not allow one to determine before and after policy periods, and large metropolitan areas are divided among jurisdictions with different urban and taxation policies (Bird and Slack 2004).
Sources and Processing: Main Variables
Our land prices sources are the reports of land price appraisals by Lonja de Propiedad Raiz de Bogotá, the local association of real estate surveyors and businesses. This source was also used in Garza and Lizieri (2016) who assess the same LVDT. However, and in contrast to these authors, we do not cluster or aggregate the Lonja information but spatially adapt other sources of planning and socioeconomic information to the Lonja spatial classification. In addition, we explore the time lagged interactions of our dynamic setting and control for possible sample selection bias of the zones that had the policy during 2000 to 2010.
Lonja collects information per zones classified according to the dominant land use. These zones have increased from 116 to 129, as Lonja reports have improved and professionalized. We use only the 116 that reported information in the period 2000 to 2010. Some of these are split into nonadjacent polygons, and consequently, our balanced panel database is composed of 141 independent spatial units (cross sections). 4
According to Anderson (2005), the approval of charging the exaction in a UPZ will cause developers to discount it in their land price biddings. However, the dynamic effect of such decision could be that before the tax is enacted, development timing accelerates. To observe the full effect, we need a spatial and time changing database controlled by other land price determinants.
The built output is proxied by construction license requesting square meters per zone and year. 5 Income growth is directly determining a natural growth trend in land prices and structural densities. This article uses Bogotá’s gross domestic product (GDP) per capita (collected by the National Bureau of Statistics [Departamento Nacional de Estadística (DANE)]) as time control. As regulations modify the spatial structure of land prices, we use Bogotá’s master plan as defined in 2000 and valid for twelve years. This is a set of urban regulations for the entire period of analysis 2000 to 2010. Regulations are included as dummy variables when they spatially intersect part or all, of a Lonja zone. The regulations are tratamientos and zoning:
Table 1 shows the evolution of the two most important variables in our analysis: land prices per square meter and licensed meters, reported for our 141 spatial units (cross sections). If an UPZ (that intersects or completely contains a Lonja zone) reported LVDT cases in the SDP website, we consider that the corresponding Lonja zones had LVDT since that year and onward. As we can see in table 1, their number increased from thirty-nine in 2004 to seventy-seven in 2008 and onward.
Price and Licensed Meters Growth per Lonja Zones: Before and after Land Value Development Tax.
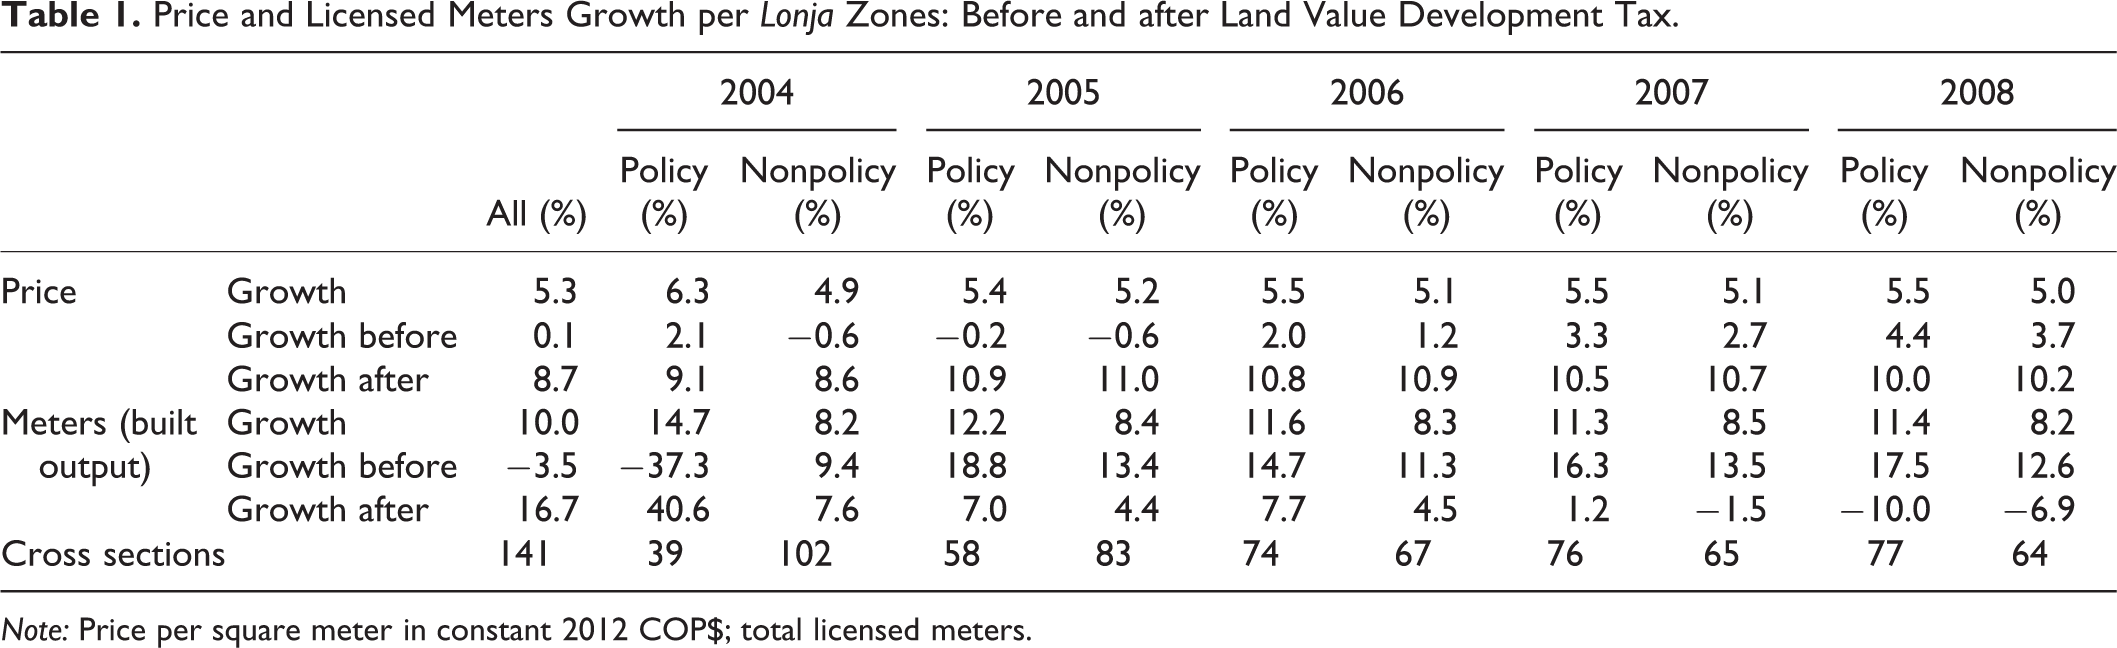
Note: Price per square meter in constant 2012 COP$; total licensed meters.
According to table 1, prices and meters grew faster in zones with LVDT. Furthermore, prices growth was faster after the corresponding zone ruled the LVDT. In principle, these facts would be at odds with our hypothesis that LVDT is neutral and must be paid entirely by the supply side. However, we must consider that (a) growth differences between zones with and without the policy decreased with the policy year (in both prices and meters); (b) the number of cross sections with LVDT increased very fast in 2004 to 2005, but stalled toward 2007 to 2008, in coincidence with political and legal resistance to its use; and (c) price growth was always substantially higher after the policy than before, while it was the opposite for the meters.
From these observations and the theoretical framework, we need a treatment effects model with time control for the trend. We know that the number of zones with the policy, and their spatial presence, increased; however, there was no policy agenda in this process. In order to be certain of this characteristic, we use a Heckman selection model. We also use three dummy variables that proxy the policy and allow us to perceive differences due to dynamic adjustment: Value capture: dummy for all the zones since 2004. It works as a period dummy, and if its parameter is negative, it represents a city level deceleration of land prices growth (the same time-series logic of Garza [2016] when analyzing the period 1960 to 2010). VC2004: dummy for all the zones that enacted the LVDT in 2004 and consequently were part of the policy during 2004 to 2010. VC2008: dummy for all the zones that enacted the LVDT between 2004 and 2008. These are all the zones that had the policy during any subperiod of 2004 to 2010.
Other Variables
The spatial distribution of land prices is added as a cubic-spline function, using as knots the subcenters defined by Avendaño and Henriquez (2012). It is important to distinguish between this theoretically derived land prices spatial distribution and a purely spatial econometrics approach, which we use alternatively as spatial controls.
The socioeconomic control is introduced as the spatially weighted average Estrato of the blocks inside the Lonja zone. Estrato is a Colombian spatial classification used to proxy income of the households and used in calculating utilities’ tariffs. The land use types of the Lonja classification are also used as controls.
Econometric Results
Spatially Controlled DiD
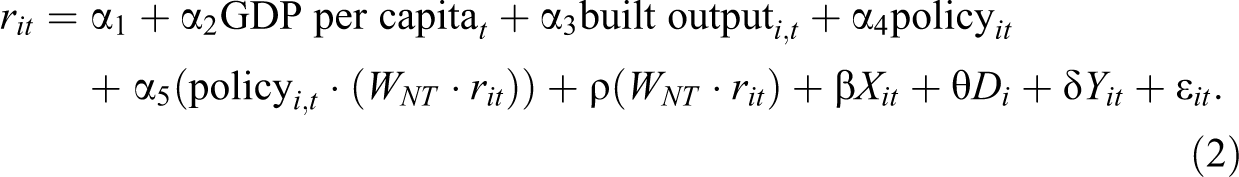
The value capture policy implemented in Bogotá since 2004 offers a quasi-experiment framework, which allows for assessment pre- and postimplementation, with spatial, social, and economic controls. This is the DiD assessment equation to be estimated:
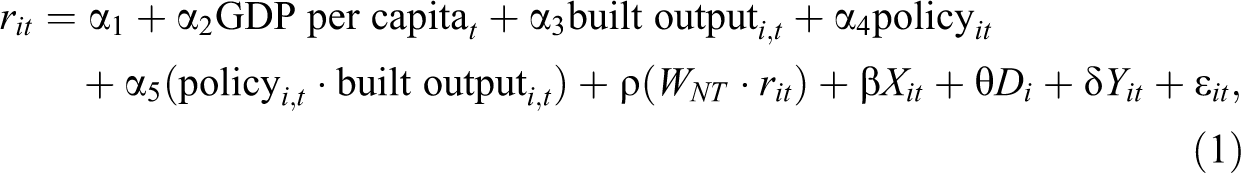
where rit is the land price per zone i and year t; policy is a dummy variable that takes the value 1 in any zone with value capture; built output i,t are the total license meters per zone and year; ρ is the spatial autoregressive parameter, which in the present case pools over all the rit , following a spatial weights matrix WNT increased in all the N zones and T years (a spatial autoregressive [SAR] component in panel estimation); 8 Xit are socioeconomic controls and land use type; Di are location-related controls (cubic-spline price function); and Yit are planning variables. 9
Table 2 presents regression results for equation (1) using the three dummies that proxy the policy application: value capture, VC2004, and VC2008. If the announcement of the policy had dynamic effects beyond what is structurally predicted by the model, the obtained parameters for the three variables should be different, particularly between VC2004 and VC 2008.
Spatially Controlled Determinants of Land Prices per Zones.
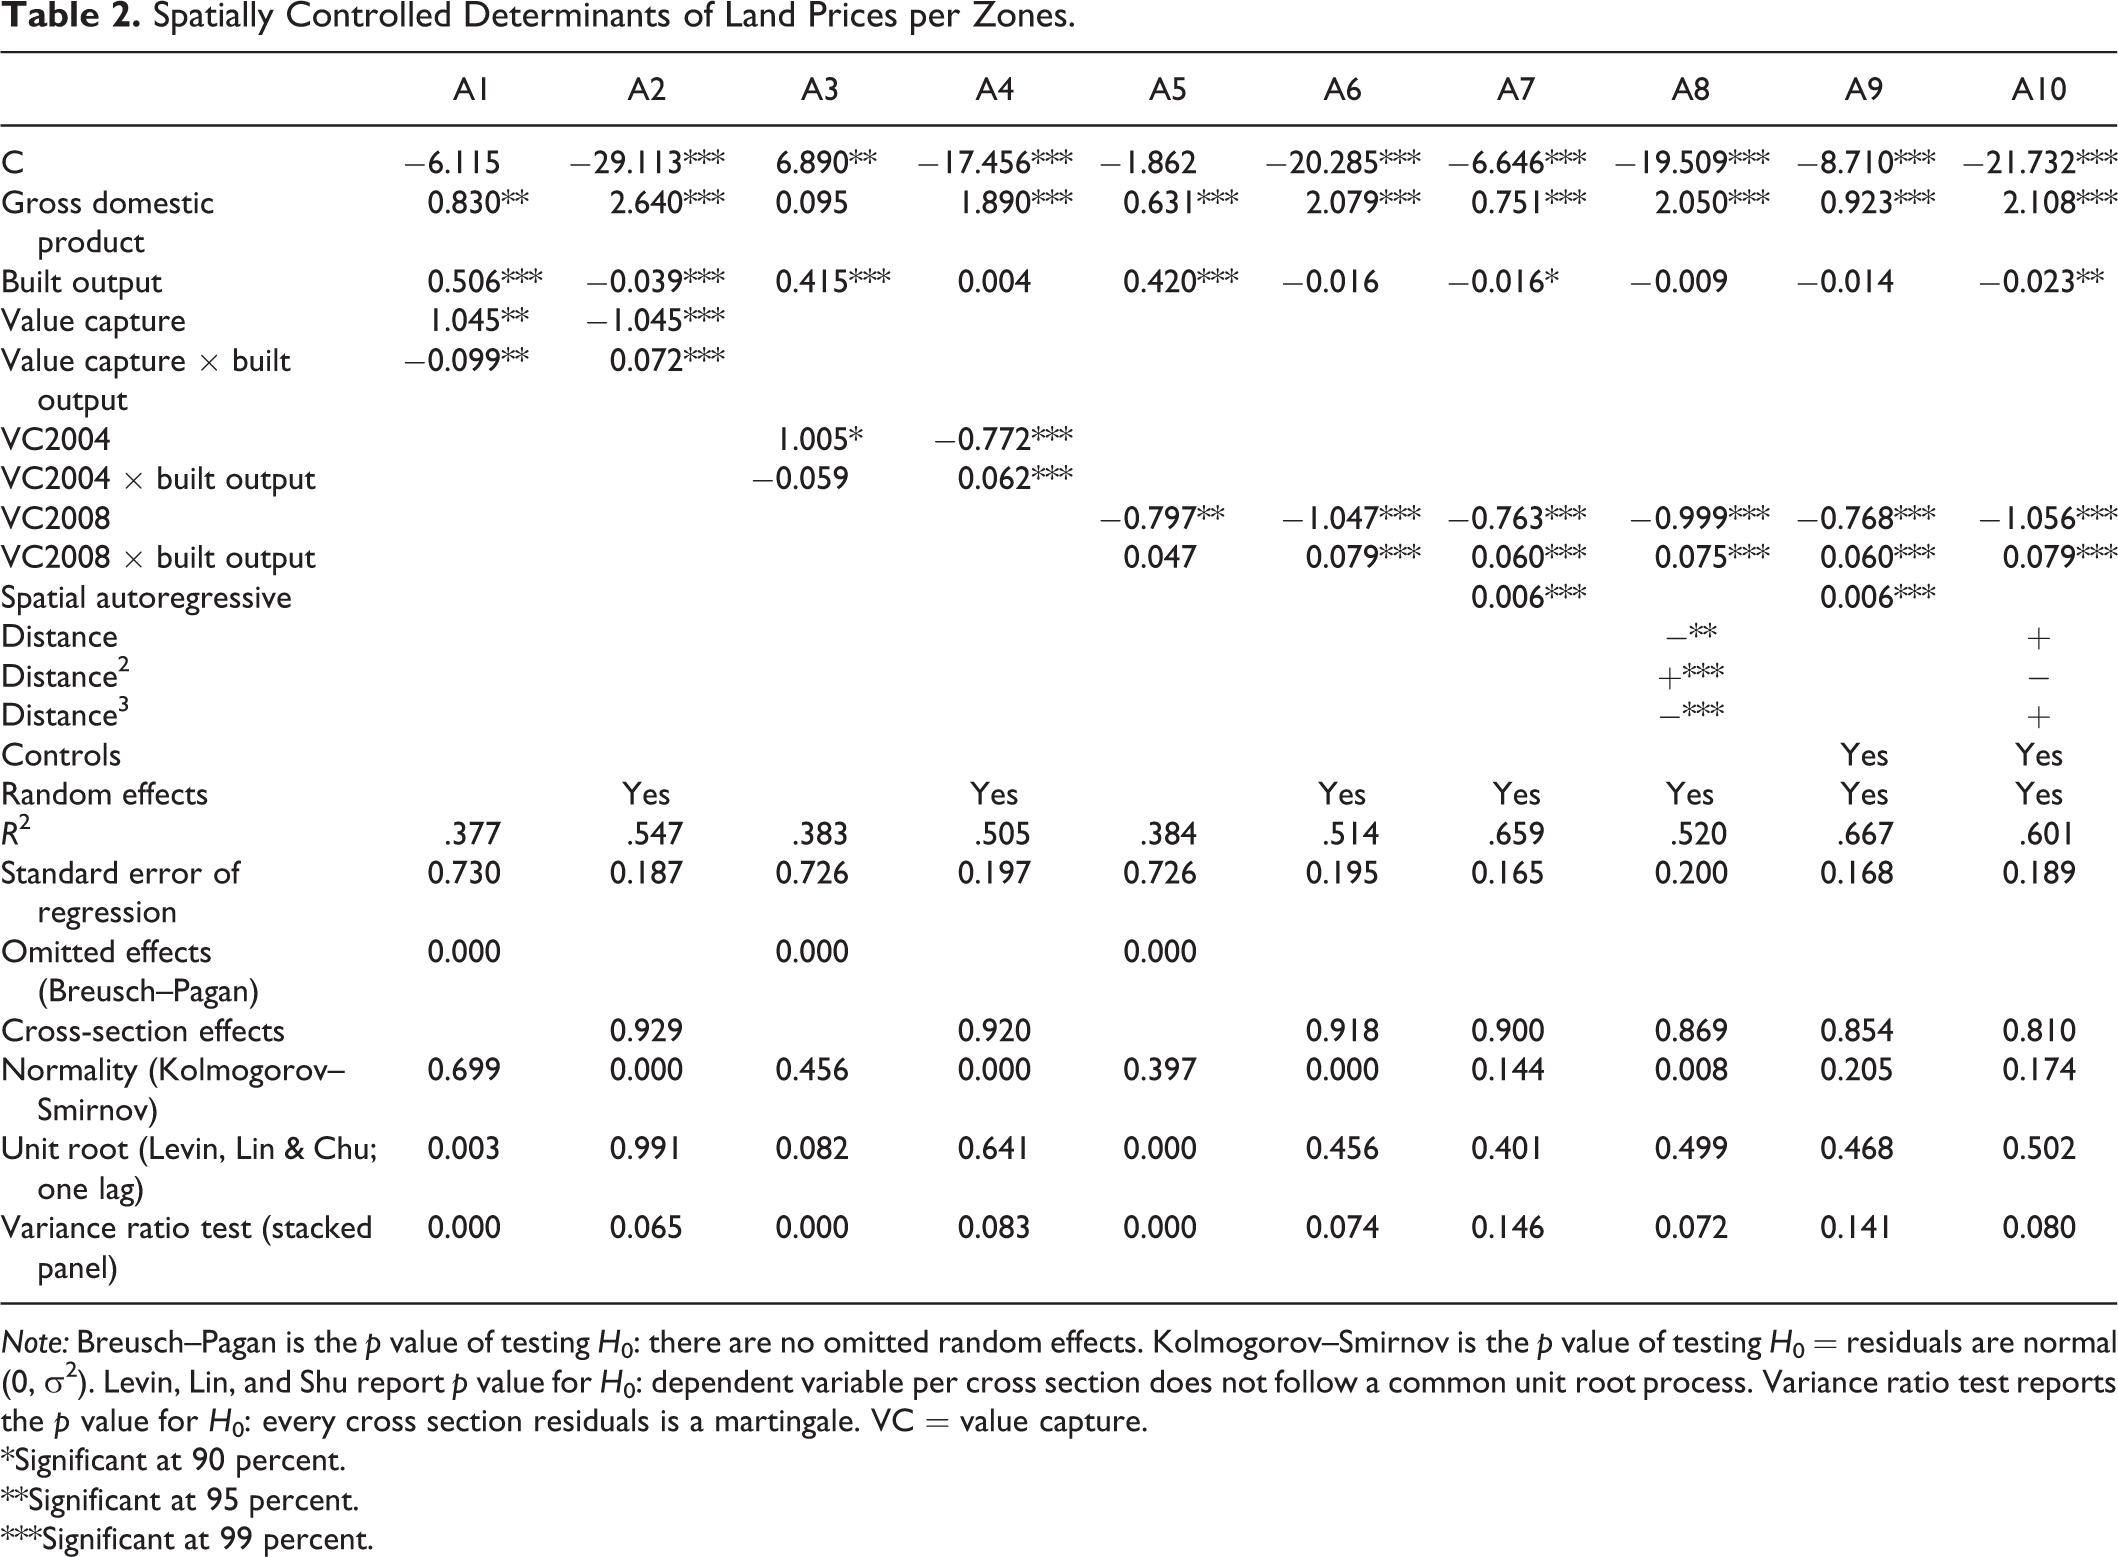
Note: Breusch–Pagan is the p value of testing H 0: there are no omitted random effects. Kolmogorov–Smirnov is the p value of testing H 0 = residuals are normal (0, σ2). Levin, Lin, and Shu report p value for H 0: dependent variable per cross section does not follow a common unit root process. Variance ratio test reports the p value for H 0: every cross section residuals is a martingale. VC = value capture.
*Significant at 90 percent.
**Significant at 95 percent.
***Significant at 99 percent.
GDP per capita impact is positive and significant in all the models but A3 (without random effects). Built output is unstable, changing its sign and losing its significance in the different specifications. The policy effect changes with the use of random effects in models A1 to A6, in exactly the opposite direction that the DiD estimator (its interaction with the built output).
Some of our variables are pure cross section and perform as a type of panel fixed effect (distance to center, WNT in the SAR component, master plan regulations). However, the null hypothesis of nonomitted random effects was always rejected in models A1, A3, and A5. Consequently, all the subsequent models incorporate random effects (their corresponding cross section ρ are substantial, and range between 0.810 and 0.929).
The regressions are well behaved when including random effects: they do not reject the hypothesis of normality (despite the spatial controls), exhibit martingale variance processes, and do not have unit root (despite the time-series correlation of panel-expanded spatial matrices and land prices). In addition, all the random effects models in table 2 report significant and negative policy dummy, no matter the variable used.
The effect of the built output on prices changes signs and is not significant, even in the preferred random effects models. Only in four models there are significant built output and interaction effects: A2, A4, A7, and A10. These four models have opposite signs: when built output is positively associated with prices (as expected), such effect decreases in the policy, and when the association is negative (unexpected), the effect increases in the policy. In accordance to our neutrality hypothesis, the negative effect of the policy on prices is never counterbalanced (in absolute terms) by its positive interaction with the built output.
Models A8 and A10 include a cubic-spline price function, while models A7 and A9 include a SAR component. Both strategies are spatial controls that target the same spatial structures, and consequently, we use them alternatively. However, cubic spline has the wrong signs and is not significant in model A10.
Models A9 and A10 also include the controls: estrato, type commercial, type industrial, and four of the planning actions (out of eight zoning and six tratamientos as presented above) selected using stepwise regressions. All these controls and the panel effects are expected not to influence the structural relation under inquiry (the negative effect of the policy dummy on the prices, with a nonsignificant relationship with the built output).
The negative effect of the policy on prices is observed in all the models with random effects, regardless the dummy variables: value capture, VC2004, and VC2008. We reject that there is statistical difference in the value of the VC2004 and VC2008 parameters (Wald tests at 90 percent significance), evidence against an early dynamic adjustment (preemption ala Turnbull). 10
Spatial DiD and Heckman Selection Models
In this section, we perform spatial DiD analyses that intend to find out whether there is spatial endogeneity between the prices and the policy. In this new set of regressions, we interact the policy dummies with the SAR component. This specification is presented in equation (2) and its results in models C1, C2, and C3 of table 3.
Spatial Difference-in-differences and Heckman Selection Models.
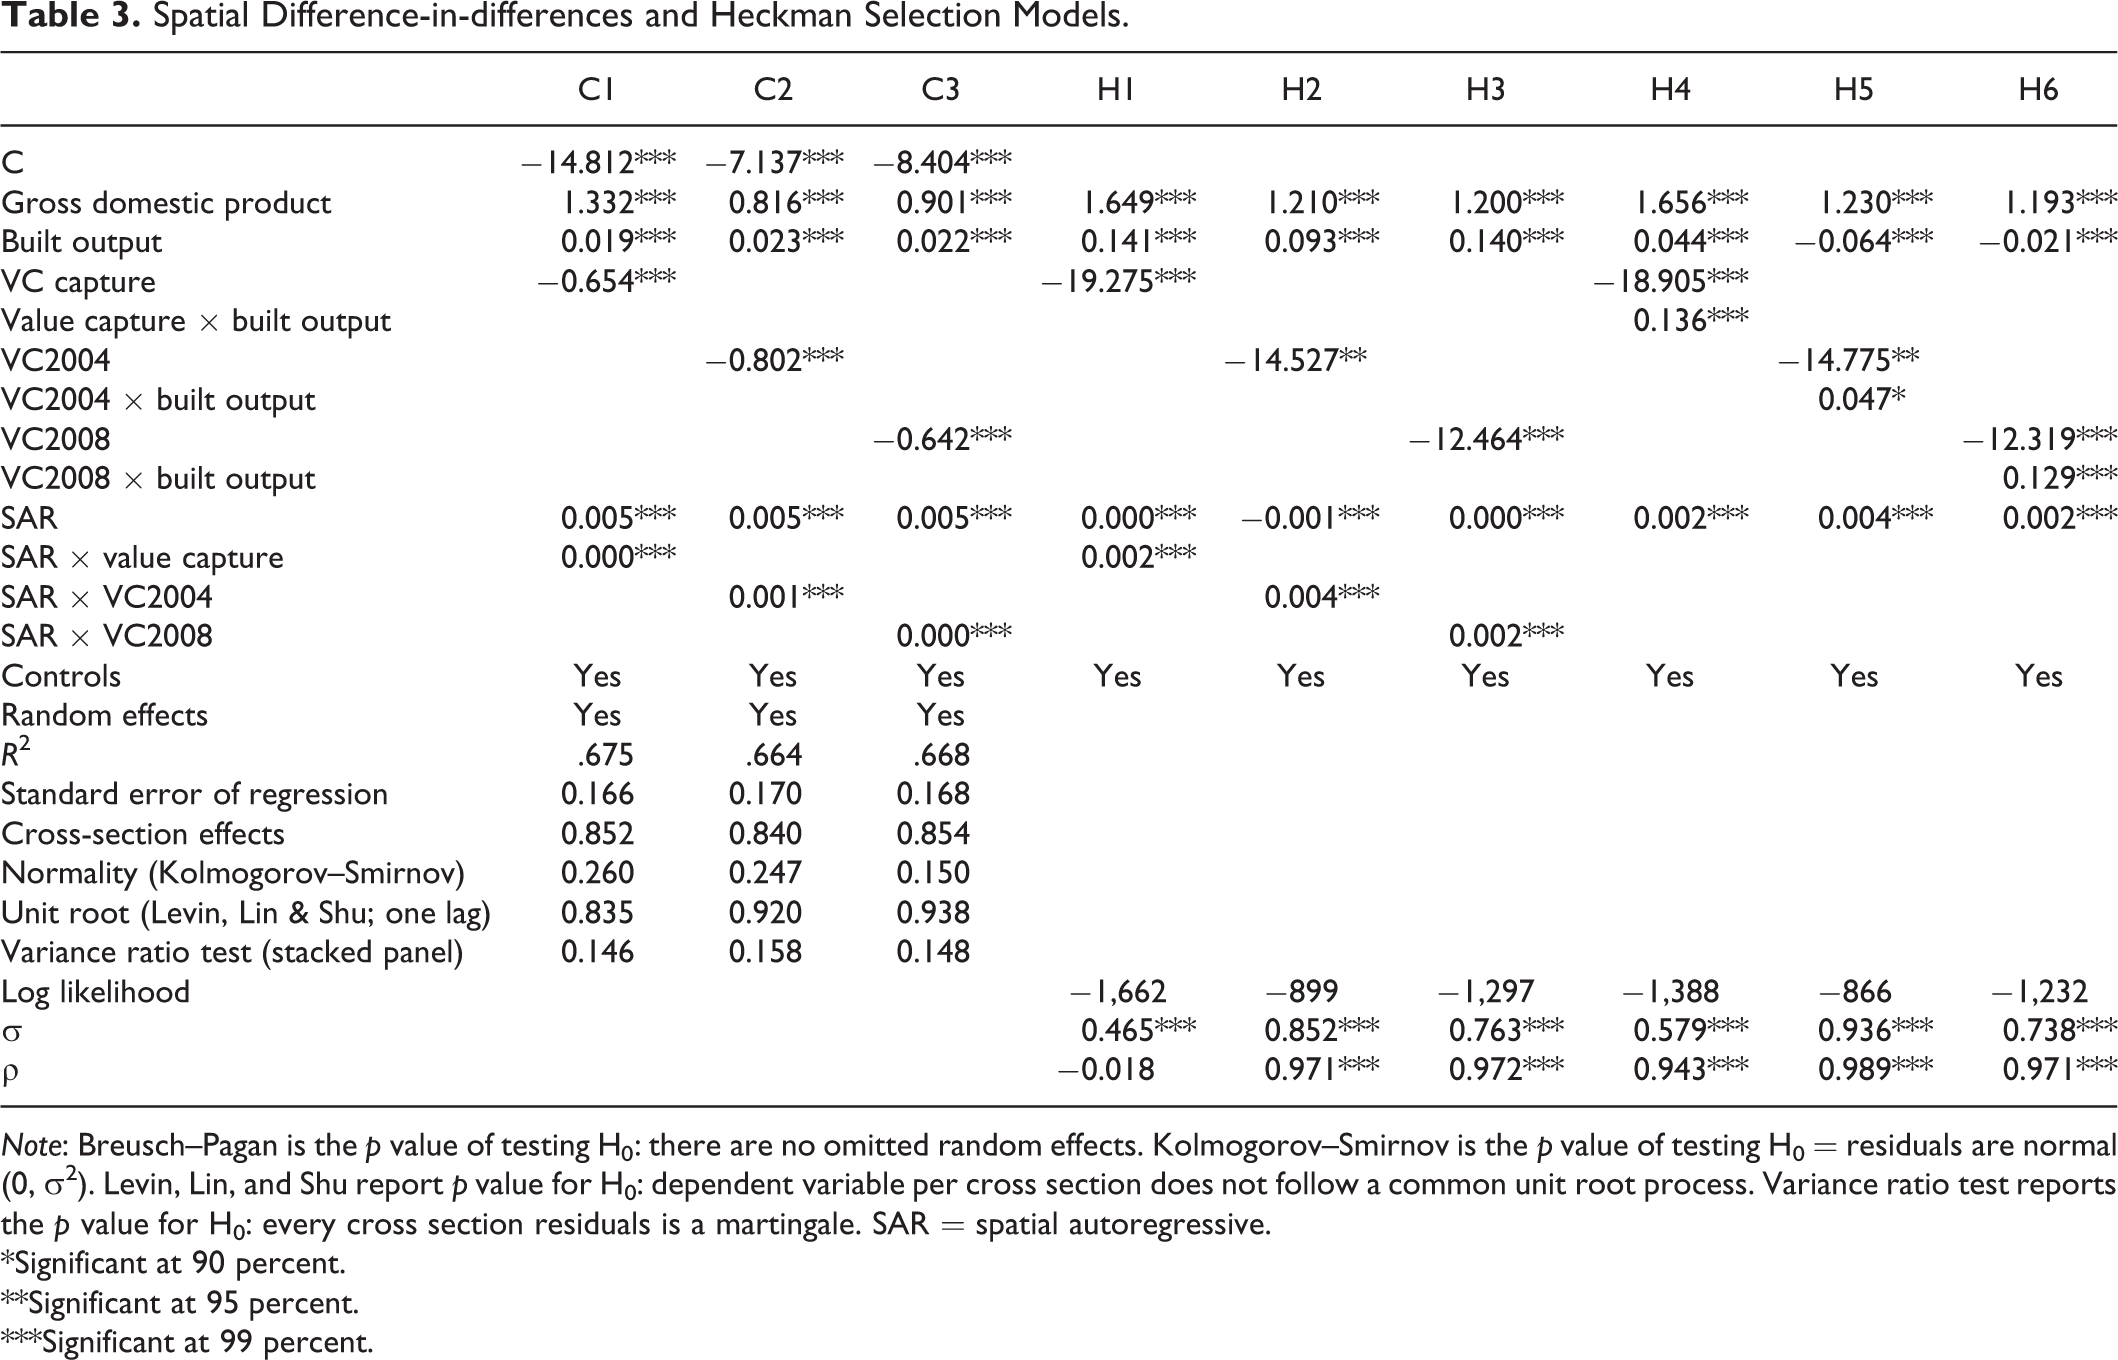
Note: Breusch–Pagan is the p value of testing H0: there are no omitted random effects. Kolmogorov–Smirnov is the p value of testing H0 = residuals are normal (0, σ2). Levin, Lin, and Shu report p value for H0: dependent variable per cross section does not follow a common unit root process. Variance ratio test reports the p value for H0: every cross section residuals is a martingale. SAR = spatial autoregressive.
*Significant at 90 percent.
**Significant at 95 percent.
***Significant at 99 percent.
Models C1 to C3 confirm all the findings so far, including the negative effect of any of the policy dummies on prices, and the nonstatistically significant difference in the value of their parameters. We are using all the controls, random effects, and the spatial DiD: the interaction of the SAR component and policy. This spatial DiD parameter (SAR × value capture, SAR × VC2004, and SAR × VC2008) is always positive and significant, indicating that the negative relation between prices and value capture is moderated by some degree of spatial market substitution. This is the situation depicted in the left panels of figure 1, with the land tax being paid by the land supply side via a price decrease. As the spatial DiD parameters are relatively small in relation to the policy dummies parameters, the degree of substitution is low, this is expected in highly segregated cities like Bogotá (Alfonso 2012).
To be reasonably certain that selection of policy zones has not played a role in the results, we run Heckman selection models (Heckit) on both the spatially controlled DiD and the spatial DiD that we have used so far. The Heckit specifications are presented in equations (3) and (4) for the spatial DiD and for the spatially controlled DiD, respectively, and their results depicted in models H1 to H6 of table 3.
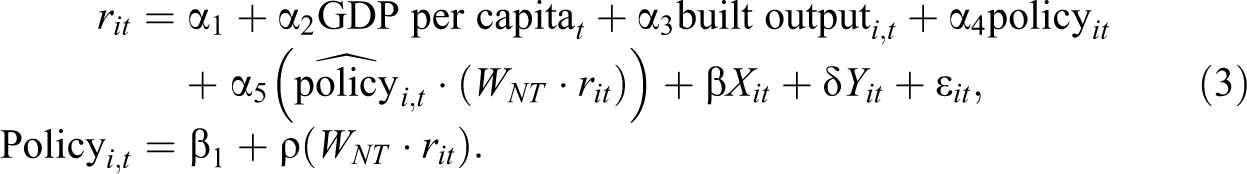
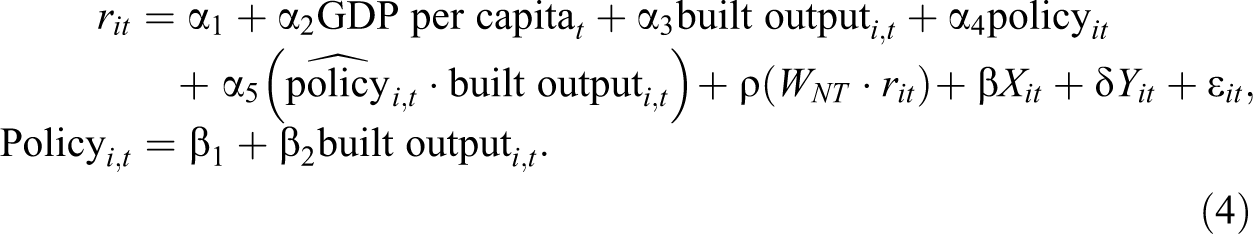
Table 3 presents equation (3) in models H1 to H3 and equation (4) in models H4 to H6. As we can see, all the results hold when using sample selection models: the negative sign of the policy on prices regardless of the variable used, the positive effect of GDP, and the unstable built output when using equation (4). Built output is, however, consistent and significant in the spatial DiD (equation 3), but the value of the policy interaction and SAR is small. The low quality of the model H1, with a ρ nonstatistically different from zero, was expected, because in this case the dummy variable value capture is applied to all the zones since 2004 and onward (more like a period than a spatial panel dummy). It is, however, remarkable that the ρ is positive and significant in the comparable model H4. We consider that this is precisely because the interaction between value capture and built output is a variable that changes among zones (as opposed to value capture that is a period dummy).
Since all the results hold in the Heckman models, we conclude that we do not have sample selection problems. The theoretically expected negative relationship between land prices and value capture holds, and the policy is not endogenous. However, dynamic neutrality is not fully supported. The zones with the policy are the ones with an increased positive relationship between land prices and built output (according to the interaction term), even when the direct relationship between the prices and built output was nonsignificant or negative in most of the regression exercises. Finally, in the regression setting the policy dummies are not statistically different, resembling a situation like the one depicted in the left side of figure 1: it has some degree of spatial market substitution and no preemption or dynamic adjustment due to regulatory threat.
Conclusions
Land value capture is an increasingly popular revenue collecting tool when compared to traditional property taxes. However, it is a one-time land exaction that might not be market neutral, a remarkable feature of the pure land tax. The lack of neutrality can manifest as effects on the market-determined amount of built output.
Dynamic analyses highlight another problematic feature of value capture, its perception as a regulatory taking by developers and landlords. Even when the levying and charging is neutral, the onset of its application might accelerate development timing and have market effects.
We analyze a Colombian version of value capture, named Captura de Plusvalía, a one-time LVDT levied and charged upon request of development permission. Captura de Plusvalía has been applied since 2004 in Bogotá. The city offers a suitable treatment effects case study because it has pre- and post-policy periods with a spatially scattered application but the same master plan and tax collection authority. Our analysis period is 2000 to 2010, including 141 city zones, their prices, built outputs, regulation, spatial and socioeconomic features, and other controls.
We find evidence of neutrality because (a) the relationship between the policy and prices is negative, with and without spatial and nonspatial controls, time lagged prices and endogenous regulation (Heckman models); and (b) the relationship between prices and the built output is nonconclusive, even when using the sample selection models. In addition, the results were the same when using three different dummy variables as policy proxies: value capture (a period dummy), VC2004 (a spatial/temporal dummy for the zones with the policy since 2004), and VC2008 (a spatial/temporal dummy for all the zones with the policy).
The absolute value of the policy dummies parameters is not statistically different. Consequently, the onset of the value capture policy per zones and years did not affect the absolute value of the negative relationship with the prices (there is no preemption). We conclude that the onset of the policy is not seen as a threat of regulatory taking by developers and landowners, and value capture must be dynamically neutral. Consequently, and according to the theory, the tax cannot be passed forward to final users in the form of higher built environment prices.
Supplemental Material
Supplemental Material, PFR714551-Online_Supplement - Spatial and Dynamic Features of Land Value Capture: A Case Study from Bogotá, Colombia
Supplemental Material, PFR714551-Online_Supplement for Spatial and Dynamic Features of Land Value Capture: A Case Study from Bogotá, Colombia by Néstor Garza in Public Finance Review
Footnotes
Acknowledgments
The author would like to thank Professor James Alm, the two anonymous referees, and Dr. Gene Thorley for their revisions and suggestions.
Declaration of Conflicting Interests
The author(s) declared no potential conflicts of interest with respect to the research, authorship, and/or publication of this article.
Funding
The author(s) received no financial support for the research, authorship, and/or publication of this article.
Supplemental Material
Supplemental material for this article is available online.
Notes
References
Supplementary Material
Please find the following supplemental material available below.
For Open Access articles published under a Creative Commons License, all supplemental material carries the same license as the article it is associated with.
For non-Open Access articles published, all supplemental material carries a non-exclusive license, and permission requests for re-use of supplemental material or any part of supplemental material shall be sent directly to the copyright owner as specified in the copyright notice associated with the article.