
Abstract
This article evaluates the impacts of reductions in residential effective tax rates on homeownership in Detroit, Michigan. The decline in effective tax rates was driven by a citywide reassessment that significantly reduced effective tax rates. These estimates are used to infer the potential impacts of moving from a traditional property tax to a split-rate tax in which the tax rate applied to land is higher than the tax rate applied to structures. Using Detroit parcel-level data over the years 2012–2019, we find that tax reductions resulting from property reassessment generated a very small net decrease in homeownership. Our evaluation suggests that moving to a split rate tax would likely result in a minimal change in the homeownership rate in Detroit.
Introduction
This article evaluates the impact of citywide reductions in residential effective tax rates on homeownership in Detroit, Michigan. The decline in effective tax rates was driven by a citywide reassessment that significantly reduced effective tax rates. While understanding the effects of the reassessment on homeownership decisions is in and of itself an essential policy question, the reassessment also offers an opportunity to draw inferences regarding the potential impacts of moving from a traditional property tax to a split-rate tax in which the tax rate applied to land is higher than the tax rate applied to structures. Assuming revenue neutrality, Anderson et al. (2022) demonstrated that moving to a split-rate tax in Detroit would result in significant reductions in the tax burden on residential property but increases in tax burden for some parking and vacant properties as well as some commercial and industrial properties. In the years following the 2007–2009 financial and real estate crisis, Detroit property values collapsed, but the assessed values used for the properties did not fall proportionally. This situation led to a citywide reassessment; Detroit's Assessor's Office conducted a major reassessment between 2014 and 2017, leading to reductions in assessment for approximately 68 percent of residential properties during a period in which property values were stable or increasing. The reassessment provides an opportunity to examine how associated reductions in tax burden affected homeownership in the city.
Reductions in assessed value resulted in significant declines in effective tax rates, which is equal to the tax payment divided by market value (MV). Throughout the analysis period, Detroit experienced generally stable or rising MVs and stable statutory tax rates. Therefore, assessed value reductions significantly cut effective tax rates for most Detroit residential property owners. We use this relationship to simulate the corresponding changes in homeownership that could result from the adoption of a split-rate tax. The complex property tax environment in Michigan requires a more detailed discussion that will be offered later in this article. However, as an introduction, this brief explanation offers the needed intuition for our evaluation.
Our objective is to approximate the behavioral responses of potential property buyers regarding homeownership if Detroit were to implement a split-rate tax (reduce the statutory tax rate on structures and increase the statutory tax rate on land). As shown in an analysis developed for the City of Detroit by Anderson et al. (2022), moving to a split-rate tax would lower the tax burden for 98 percent of improved residential properties, but raise the tax burden on surface lot parking and vacant properties, and some commercial and industrial properties, especially in the central business district. More specifically, Anderson et al. (2022) use a microsimulation to estimate changes in taxpayer incidence associated with moving to a split-rate tax with the constraint of initial revenue neutrality. The microsimulation is based on estimated changes in capped value taxable value (TV) for each parcel, fixed fractions of TV for each parcel, revenue neutral differentially weighted millages that are equivalent to single rate millages, where these weights are assigned to each property's 2019 total millage rate to modify parcel-level rates. Their approach accounts for varying millage rates across properties, including millages excluded under principal residence exemptions, neighborhood enterprise zone certificates, senior and veteran exemptions, and commercial and industrial millage rates and assumes that all overlying taxing jurisdictions will enact a split-rate tax.
Although our primary interest is in evaluating the impacts on residential properties, we are aware that other properties will experience an initial tax increase under a split-rate system. For context, most residential properties in Detroit sit on parcels with less than $1,000 in land value, which is a small fraction of total property value; we think that use of the reduction in tax burden due to the reassessment as a proxy for moving to a split-rate tax is a reasonable strategy. Our approach uses annual parcel-level data on tax burden and homeownership as indicated by the principal residence exemption 1 , assessed values, and other parcel characteristics for 2011 through 2019. As highlighted above, for the evaluation, there were significant changes in the property assessment that reduced assessed values and tax burdens for many residential properties.
The impact of a significant and permanent tax reduction on the rate of homeownership depends in part on the relative responsiveness of potential buyers of rental properties versus potential buyers of properties to be used as principal residences. It may also depend on the decisions of the owners of the property to maintain tenure as the tax environment changes. As discussed in the literature review, we consider the relative benefit of a tax reduction for homeowners and rental properties in the context of the mortgage interest and property tax deduction on the income tax. Due to the complex tax advantages for homeowner-occupied properties, the anticipated effect of a tax reduction on homeownership in Detroit is indeterminant. Although the theoretical discussion offers some insight, we rely on empirical analysis to shed light on the impacts with the caveat that estimates should be considered a first-round partial equilibrium effect. Tax reductions resulting from the revaluation are not the same as a tax change resulting from the imposition of a split-rate tax. Therefore, the behavioral responses may not be the same in the two scenarios. Also, within a general equilibrium context, a higher land tax could potentially reduce land prices but also stimulate development. Therefore, we expect that any reductions in land values, and thus land taxes, would be more than fully offset by increases in the value of structures due to development. However, we do not capture these longer-run effects in this evaluation. For these reasons, the evaluation should be viewed as providing guidance and not as a precise forecast.
In the next section, we offer a brief review of the most relevant literature that includes discussing research on land taxation, Detroit's convoluted property tax and the real estate environment, and research on home ownership decision factors. The literature review provides conceptual frameworks that serve as a basis for empirical evaluation. This review is followed by empirical analyses that include simulations of the expected magnitudes of the effects on homeownership. The report concludes with a summary discussion and implications of the findings.
Literature Review and Theoretical Framework
The literature review begins with a brief overview of the research on the potential benefits of land taxation relative to the traditional property tax. From this body of research, we draw inferences regarding the anticipated effects of implementing a split-rate tax in Detroit. We then discuss recent research on Detroit's property tax environment, focusing on tax delinquency and assessment practices. The Detroit property tax environment discussion is followed by a review of several articles on the relationship between property taxation and homeownership. We begin with a discussion of the research on land taxation.
Land Taxation
Economists tend to favor a land tax, or a split-rate tax, wherein land is taxed at a higher rate than improvements relative to a traditional property tax. The arguments are that land value taxation is more efficient and may increase the speed and intensity of capital development (Anderson 1999; Banzhaf and Lavery 2010). Eliminating or reducing the tax on structures may encourage development by removing or reducing the property tax penalty associated with adding improvements to a property. Land taxation also increases the cost of holding land in an undeveloped state, thereby shifting forward the optimal time of development (Shoup 1970; Zax and Skidmore 1994). 2 Using a panel of municipal data from Pennsylvania, Yang (2018) recently conducted an empirical examination of the impacts of increasing the tax rate on land and lowering the tax rate on improvements. Her empirical analysis suggests that land values tend to rise following the implementation of the split-rate tax. 3 These ideas have motivated the inquiry about how the performance of a split-rate tax would affect economic activity, including homeownership, in Detroit. We now turn our attention to recent research on the Detroit property tax environment, beginning with a review of the Michigan property tax policy.
Michigan and Detroit Property Tax Environment
Before 1994, property taxation was the main revenue source for Michigan public schools. Reliance on the property tax generated substantial variation across school districts in the tax base due to differences in property values, resulting in significant differences in expenditure per student. The property tax burden in Michigan was well above the national average. 4 These conditions prompted voters and policymakers to implement a series of reform measures (Feldman et al. 2003).
In 1994, Michigan voters adopted Proposal A 1995, which shifted a significant portion of school financing to state sales and property taxes. The reform included the imposition of the TV cap, which served to restrict the growth at the parcel level in property value for tax purposes to the rate of inflation or 5 percent, whichever is lower. 5 Until the 2008–2009 real estate crisis, the TV cap generated significant differentials between long-time and new property owners (Skidmore et al. 2010). However, those differences diminished when property values slumped in the wake of the real estate crisis. Proposal A also had substantial post-recession effects on local government revenue-generating capacity. When assessed values fall substantially, the TV cap suppresses revenue recovery in a rising value market. Proposal A also added the “homestead exemption,” which limits the statutory millage rate to support public school operating expenses; however, the exemption only applies to owner-occupied principal residences. For most school districts, including Detroit, the homestead exemption resulted in a full exemption of the millage used for school operating expenses, reducing the average statutory millage rates by about one-third for owner-occupied (or homestead) properties. 6 Note, however, that there was significant variation in homestead millage rate reductions across jurisdictions. In 2019, thanks to the homestead exemption, owner-occupied properties in the City of Detroit enjoyed a 17.83-mill reduction in their statutory rate relative to non-homestead properties. 7 Finally, through Proposal A, the state government added a 6-mill “state education tax” and increased sales and cigarette taxes to support elementary and secondary public education.
Given the TV growth cap imposition, it is helpful to distinguish between the statutory property tax rate and the effective tax rate. The statutory tax rate is the millage rate applied to the tax base or the aggregate TV of a locality. Detroit property owners pay statutory millage rates that are much higher than the statewide average; in 2019 the millage rate for owner-occupied properties was 68.7 mills per $1,000 of TV. 8 These millage rates are comparable to several other struggling Wayne County jurisdictions—such as Inkster and Highland Park. However, the statutory rate is much higher than average for the Detroit metropolitan area and other metropolitan areas of Michigan. For reference, in Michigan, state equalized value (SEV) is equal to 50 percent of market value (MV). 9 When property value growth is greater than the rate of inflation, a gap emerges between a property's TV (which grows at the rate of inflation or five percent, whichever is lower) and SEV (which can grow faster than inflation). However, TV is reset to reflect MV when a property is sold so that TV equals SEV. Therefore, the TV cap generates significant inequality in tax burden across otherwise similarly valued properties.
In the years after the real estate crisis, 2010–2014, significant differences emerged between SEV and MV; MV had fallen dramatically, but SEV had not declined enough to reflect changing market conditions (Hodge et al. 2016). The steep drop in MVs prompted a decision to perform a citywide reassessment. This resulted in a complete reassessment of the city's property during the 2013–2016 period to bring SEV back in line with MVs. Our evaluation exploits the reassessment to determine the degree to which reductions in effective tax rates generate behavioral responses to homeownership decisions.
Given the imposition of Proposal A coupled with challenges in accurately assessing property value after the financial crisis, the effective tax rate is a more meaningful measure of the tax burden than the statutory tax rate. We define the Effective Tax Rate for a residential property i using the following equation:

Hodge et al. (2016) documented that SEVs did not initially fall with MV; therefore, effective tax rates for most residential properties increased dramatically. Due to growing concerns about overassessment, the State Tax Commission intervened in late 2013 and conducted a reassessment on a sample of properties. In 2014, the city of Detroit announced that it was going to conduct a reassessment of property throughout the city, and in January 2015 assessments were reduced throughout the city by as much as 5 percent to 20 percent. The citywide reassessment of the property was completed in 2017. Reassessment brought both SEV and TV down and more in line with MVs for many parcels, resulting in significant declines in effective tax rates. The reassessment resulted in a decrease in assessments of $213 million in a single year with reductions for 95 percent of the properties (Snell 2016). We rely on the reassessment and corresponding declines in effective tax rates to examine how homeownership responded to the change.
Homeownership
Much of the research on the impacts of taxation on homeownership centers on the favorable tax treatment of homeownership in the U.S. income tax code (Poterba and Sinai 2008). Although there is much debate about the usefulness of deductions for property taxes and mortgage interest payments on federal and state income taxes, these deductions offer tax savings for homeownership over renting, more so for middle- and high-income households. Rosen and Rosen (1980) present evidence from time series analysis indicating that such favorable treatment encouraged homeownership over renting. However, Bourassa and Yin (2008) focused on young households, concluding that favorable tax treatment raises housing values so much that it reduces the homeownership rate among younger households that are on the margin between owning and renting. Similarly, Hanson (2012) finds that the mortgage interest deduction did not encourage homeownership. Although one may draw some inferences from this work on the potential impacts of a reduction in property tax burdens resulting from the imposition of a split-rate tax, these studies are somewhat ancillary to the question of how reduced property tax burdens would affect homeownership across Detroit.
Of more direct relevance is the work of Ihlanfeldt and Boehm (1983), who examined the relationship between property taxation and the demand for homeownership. In their framework, due to the property tax deduction on income taxes, a reduction in the property tax rate increases the price of homeownership relative to renting. Thus, homeownership is discouraged relative to renting. However, there is an opposite effect in that the overall price of housing declines relative to the cost of nonhousing goods. Thus, homeownership is encouraged. Their empirical evaluation suggests that the opposite effect dominates so that a property tax rate reduction increases the probability of homeownership.
In the context of Detroit, prices are so low that mortgages are not available for many residential properties; any impacts associated with favorable income tax treatment are not applicable for many potential homeowners. Only 21 percent of residential sales in 2017 had mortgages in Detroit. According to the Urban Institute, as few as 7 percent of all residents have a mortgage in Detroit (Ratcliffe and Kalish 2016). Additionally, many Detroiters fall into lower income categories where it is not advantageous to include itemized deductions in their income tax returns. Therefore, the associated negative homeownership effect described by Ihlanfeldt and Boehm (1983) may not be dominant in Detroit. In addition, potential rental property owners may be more responsive to tax reductions because they have greater access to financial resources than typical Detroit potential homeowners; rental property investors are better positioned to purchase property than potential buyers of a principal residence. Additionally, due to the exemption for main residence, rental property owners will receive relatively more significant tax reductions from the reassessment than homeowners. Also, a land tax might also encourage the development of additional units that would bring down the costs of renting and thus discourage homeownership. Given these offsetting considerations, a priori, we cannot predict whether a residential tax reduction (or the introduction of a split-rate tax and associated residential tax reductions) will increase or reduce homeownership in Detroit. We rely on empirical analysis to offer insight.
Empirical Analysis
Our strategy in this evaluation is to use changes in TVs driven by the reassessment (and thus changes in effective tax rates) during this period, which resulted in reductions in effective tax rates and estimated the changes in homeownership probability. The idea is to evaluate the behavioral responses to reductions in effective tax rates by the reassessments using quasi-dynamic discrete choice modeling. The framework is similar to a traditional first-difference approach that eliminates unobservable fixed effects. These estimates are then used to simulate the potential impacts of moving to a split-rate tax. Notably, the method we use does not rely on cross-parcel differences in effective tax rates, but rather on parcel-level changes in effective tax rates brought on by the reassessment. Using changes over time rather than cross-parcel differences to estimate the impacts of reduced effective tax rates on homeownership decisions will minimize the potential problems or biases associated with assessments and increase confidence that the estimates are causally determined.
Data
Parcel-level data come from a panel provided by the City of Detroit. The data set we use is an unbalanced panel that covers the years 2011 through 2019, with an average of 293,800 parcels per year. In the entire data set, about 90 percent of the parcels are residential, 8 percent are classified as commercial, and 2 percent as industrial. During this period, residential assessments were reduced as part of the city's effort to better align assessments with MVs. Table 1 reports the average sale price of improved residential properties during the 2011–2018 period. These comparisons affirm that the downward TV adjustments were driven by the effort to bring the assessments in line with state guidelines and not by continued declines in the real estate market.
Average Residential Property Sale Prices.
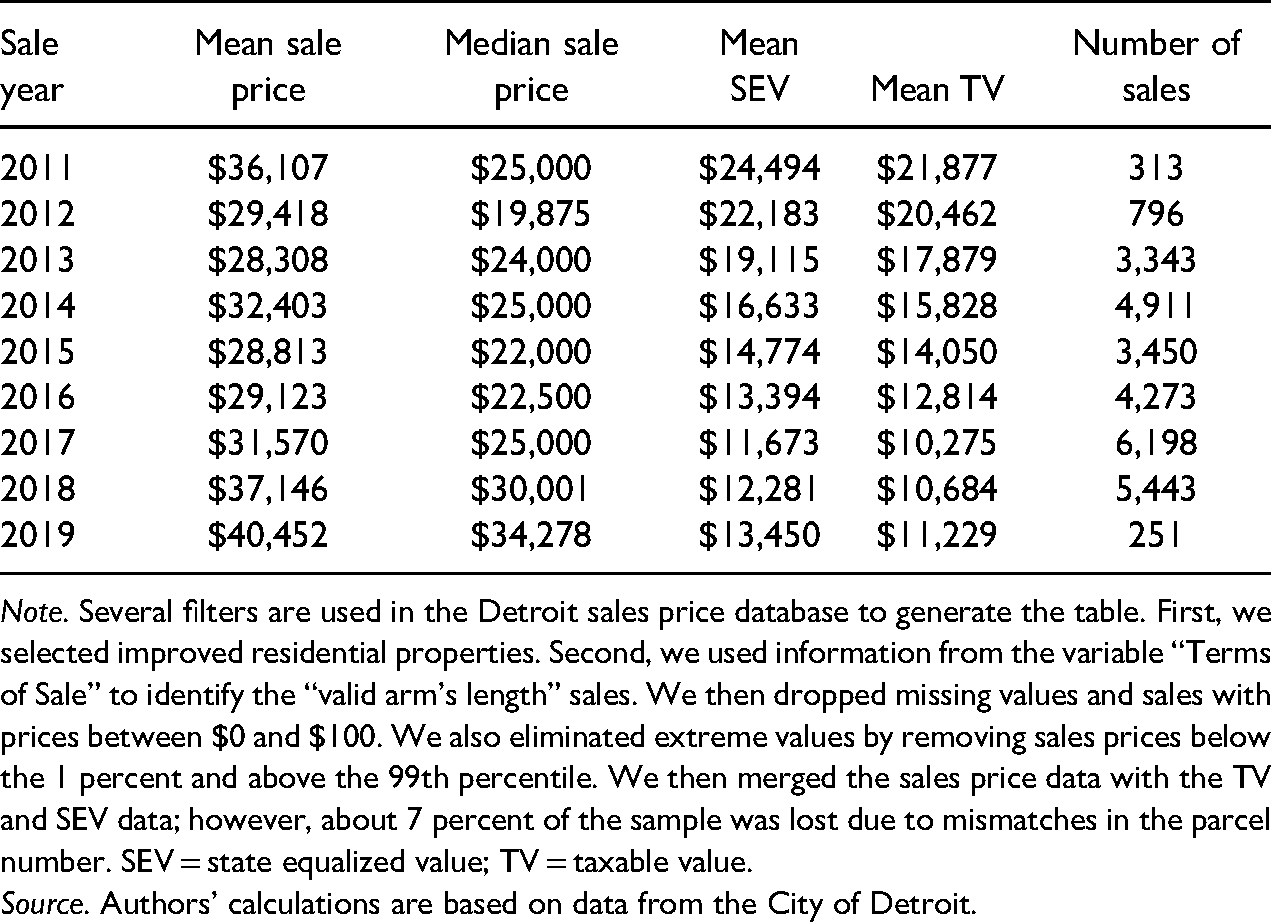
Note. Several filters are used in the Detroit sales price database to generate the table. First, we selected improved residential properties. Second, we used information from the variable “Terms of Sale” to identify the “valid arm's length” sales. We then dropped missing values and sales with prices between $0 and $100. We also eliminated extreme values by removing sales prices below the 1 percent and above the 99th percentile. We then merged the sales price data with the TV and SEV data; however, about 7 percent of the sample was lost due to mismatches in the parcel number. SEV = state equalized value; TV = taxable value.
Source. Authors’ calculations are based on data from the City of Detroit.
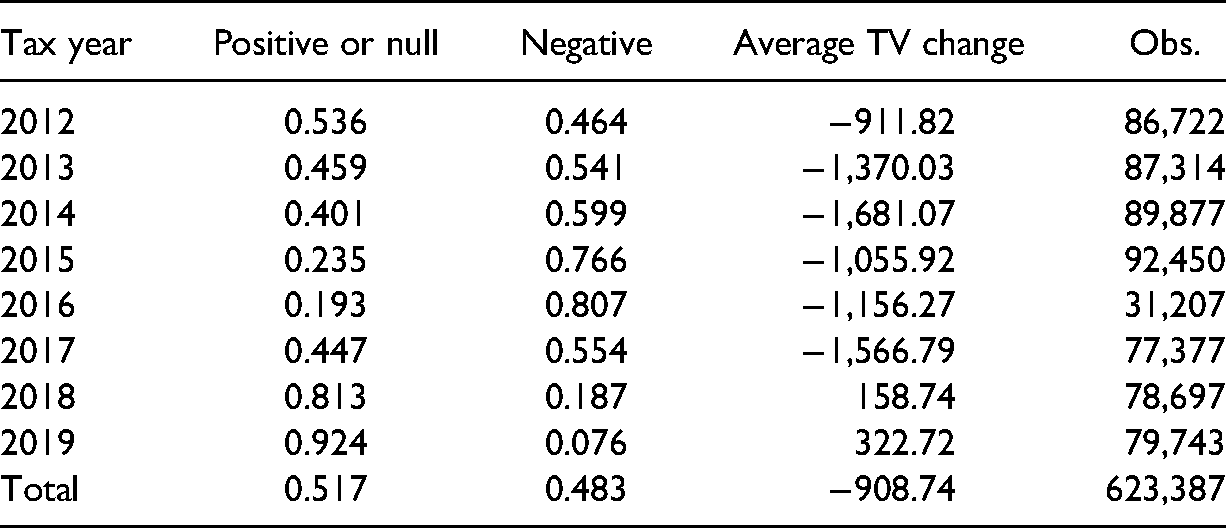
As shown in Table 1, by 2012, citywide average sales prices had stabilized. 15 These data coupled with Table 2 demonstrates that the TV declines and thus declines in effective tax rates throughout the evaluation were not driven by market conditions but rather the reassessment. However, even though this evidence shows that reassessment primarily drives assessment declines, it could be that assessments are driven up or down by market conditions, thus creating the potential for endogeneity. If we were using aggregate data, these market trends could be a concern. However, we think this is less likely to be the case for our parcel-level analysis.
Proportion of Positive (or null) and Negative Changes in Taxable Value (TV) Over Time TV Change.
The key independent variable for our analysis is parcel-level TV. The parcel-level data are an unbalanced panel for the years 2011 through 2019. We focus on the change in TV from period t to period
We present summary statistics for the control variables used in our evaluation, which are shown in Table 3. Additionally, Appendix Table A1 provides a list of all variable names and definitions. Parcel-level features include the lot size, owner-occupied status, the millage rate, tax liability, %ΔSEV, and %ΔTV. These variables help control for factors that may determine the value of the underlying property. In addition, we include census tract fixed effects to control for factors that differ by location within the city and year time effects to control for citywide changes over time. After cleaning the data, the analysis includes 623,387 parcel-year observations, although the number of observations is reduced by introducing lagged variables. The average statutory rate is about 86 mills; for every $1,000 of TV, the property owner pays $86 in taxes. However, note that the minimum statutory millage is 22.1, and the maximum is 89.1. 17 The average size of a parcel is 0.11 acres. We also control the principal residence exemption with a dummy variable that equals one if the property receives the main residence exemption (owner-occupied) and zero otherwise.
Summary Statistics for key Variables for Improved Residential Parcels.
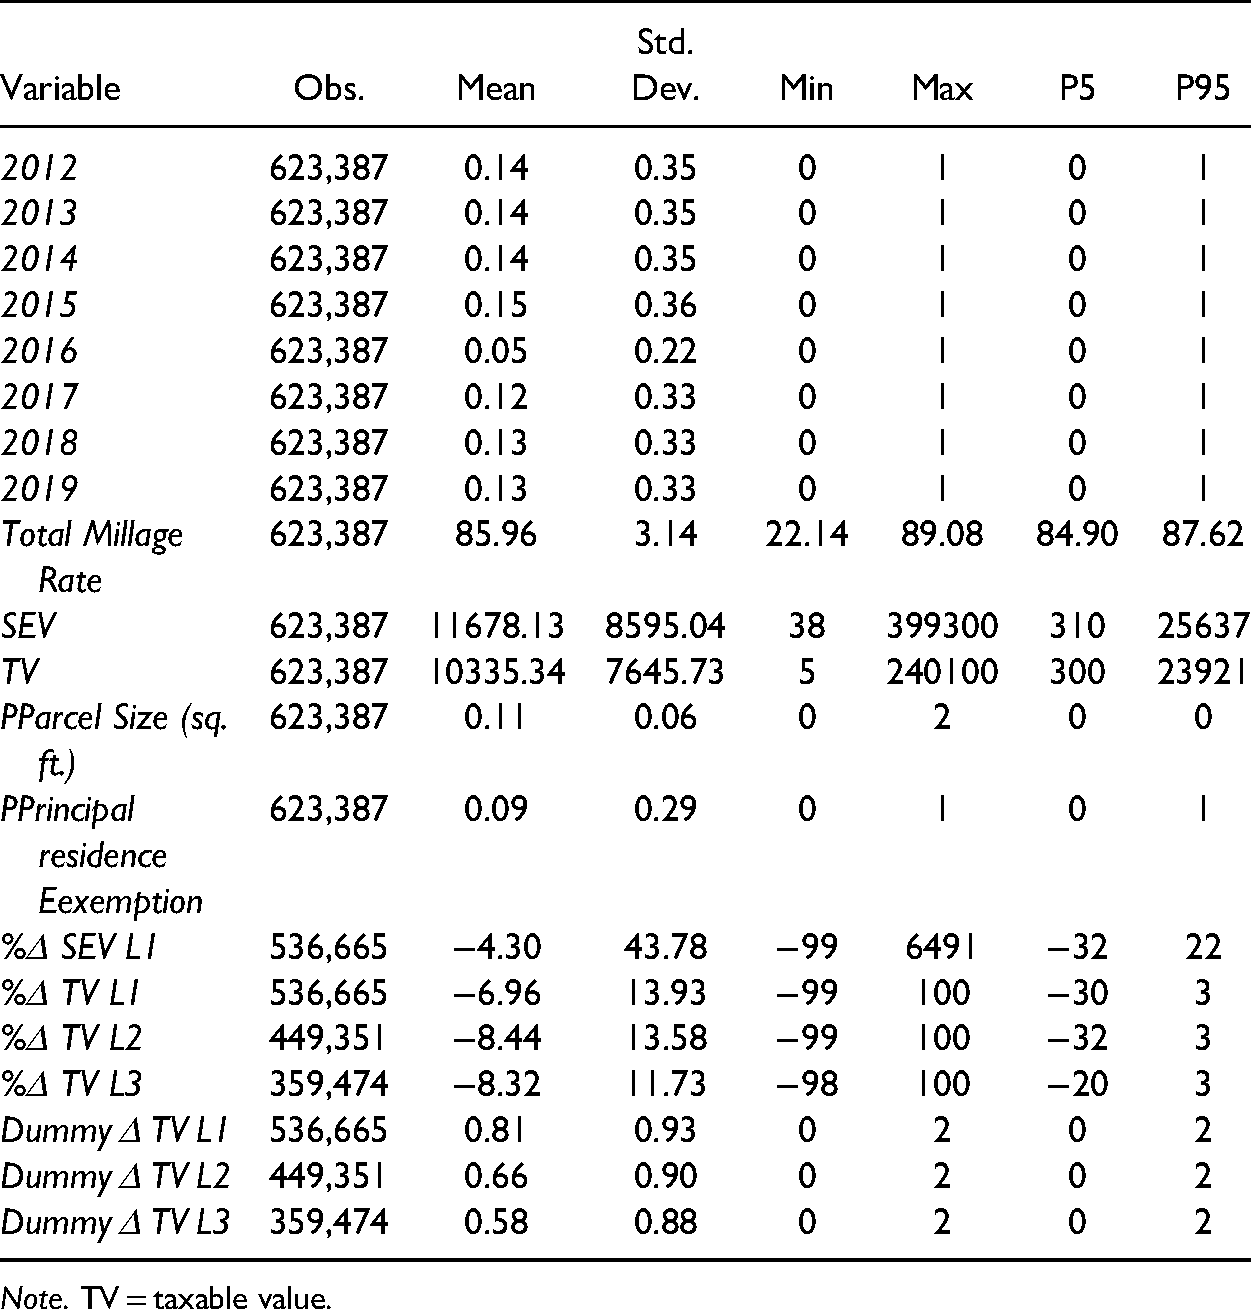
Note. TV = taxable value.
Our objective is to determine the degree to which a reduction in TV (and thus a reduction in tax burden) may influence homeownership decisions. Therefore, we focus our evaluation on those properties that changed ownership status. Here, our sample includes parcels transitioning from rental property status to owner-occupied property status relative to those properties that remained in rental property status
Number of Properties by Change in Homeownership Status, 2012–2019
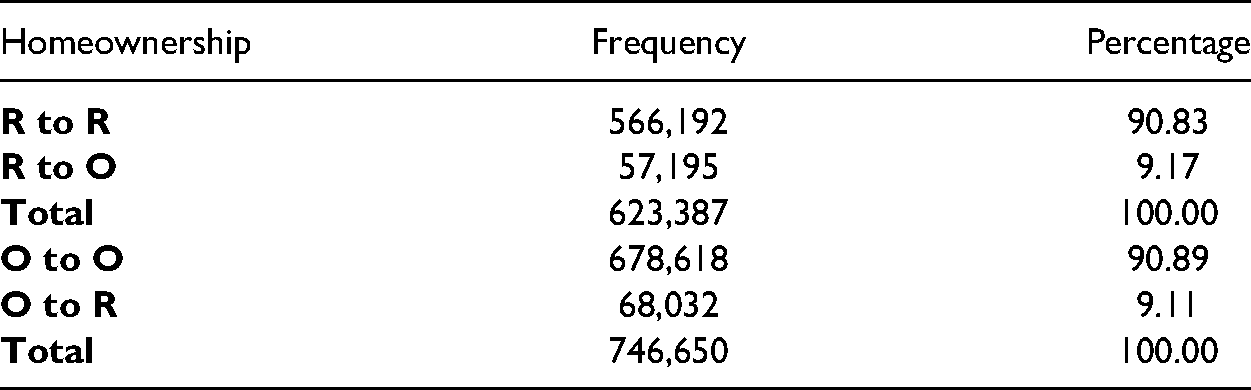
We examine two subsets. The first is composed of 623,387 parcel years, of which 57,198 shifted from rental to owner-occupied status year over year, whereas 566,192 parcels remained in rental status year over year. Although 91 percent of the cases remained in the rental property state, 9 percent of the parcels changed ownership status from one period to the next. The second subset is composed of 746,650 parcel years, of which 68,032 shifted from owner-occupied to rental status year over year, whereas 678,618 parcels remained in owner-occupied status year over year. Again, about 9 percent of the parcels changed ownership status from one period to the next. Our approach predicts changes in ownership status where a reduction in TV may affect the probability of moving from (a) a rental to owner-occupied status and (b) from owner-occupied to rental status using dynamic discrete choice logistic regressions. Panels A and B of Figure 1 offer maps of the proportion of residential parcels that are owner occupied in 2012 and 2019, respectively. The map is divided into quartiles according to the 2012 data, with red indicating higher homeownership rates (55%–73% in dark red) and blue indicating lower homeownership (0%–35% in dark blue). The maps show a general pattern of reduced homeownership during the period.
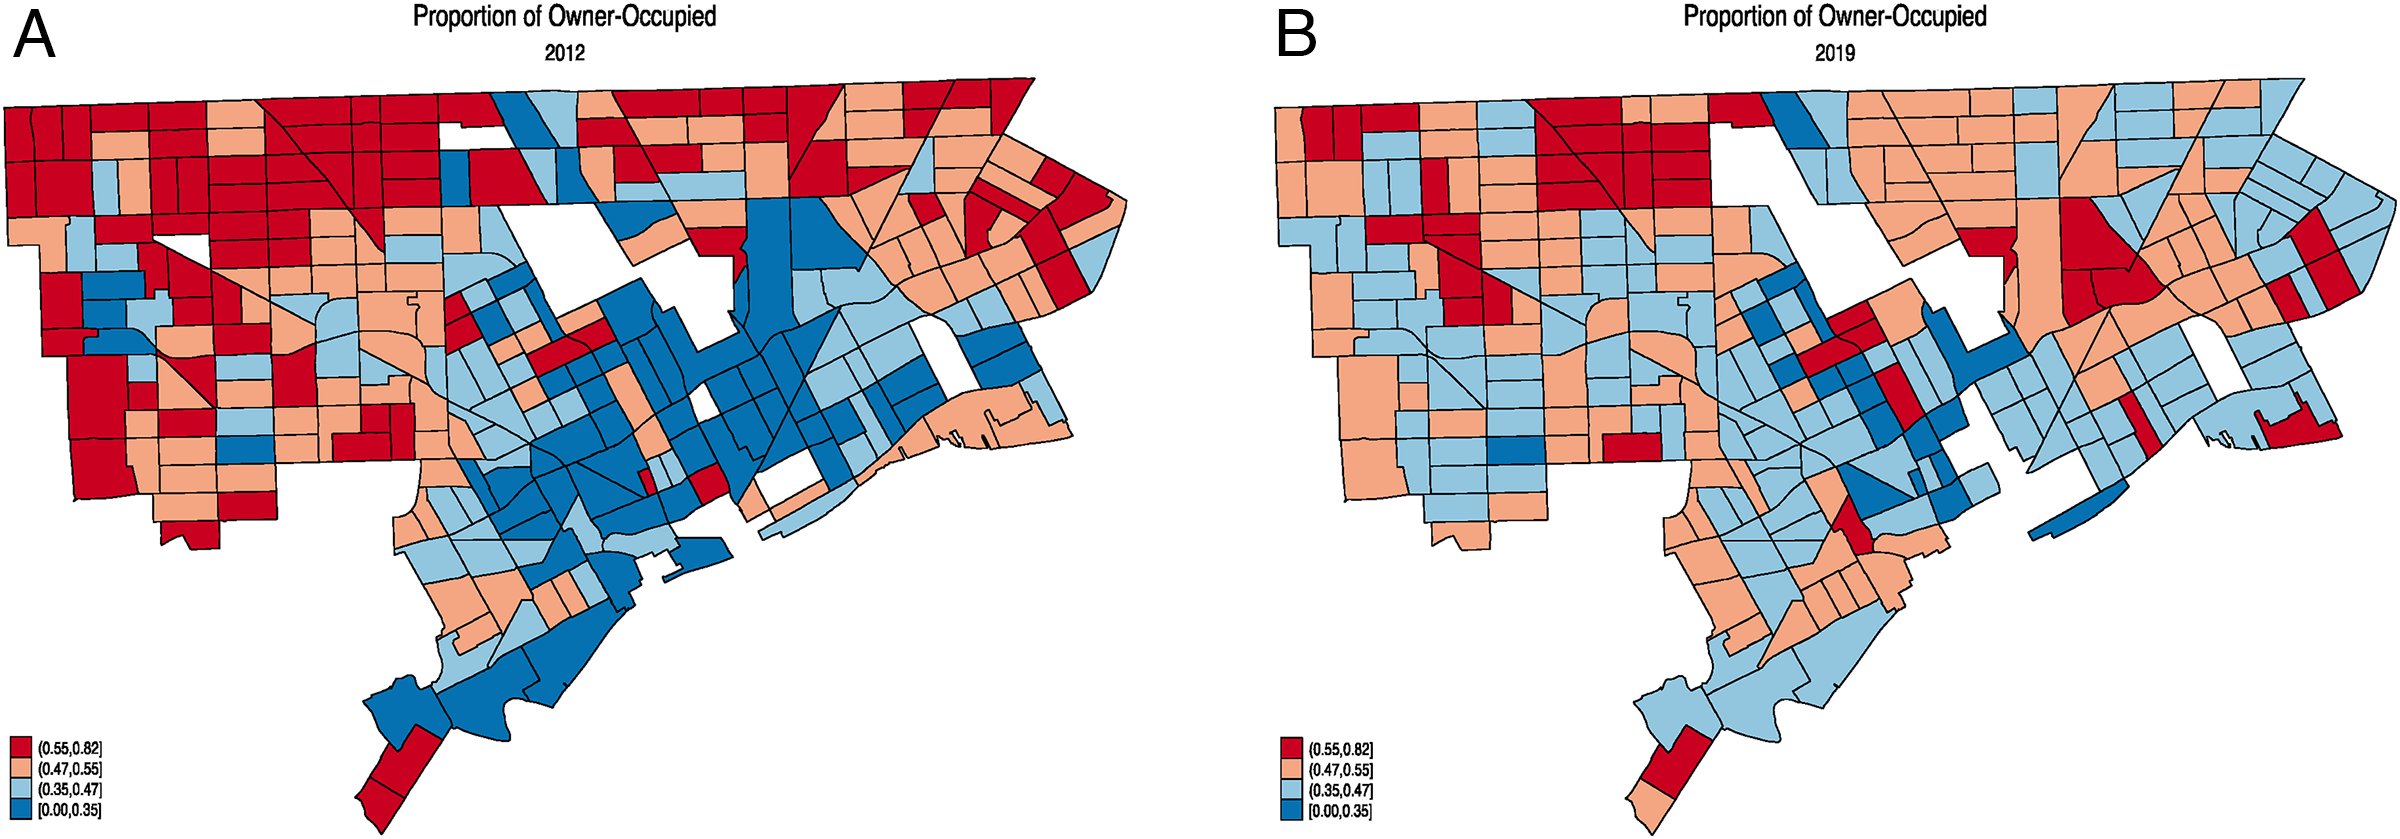
Proportion of residential parcels that are owner-occupied in 2012 and 2019.
Methods
This section presents an evaluation of how reductions in TV (and thus effective tax rates) affect owner-occupied status. As discussed in the literature review, the effect depends on the responsiveness of potential home buyers to rental property investors. Specifically, we model possible outcomes that are determined by property owner behavior. A given property can move from rental to owner-occupied status (
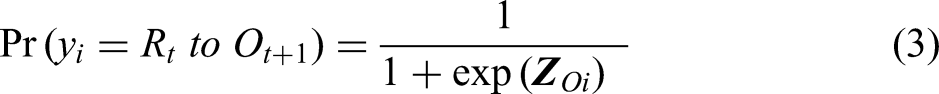
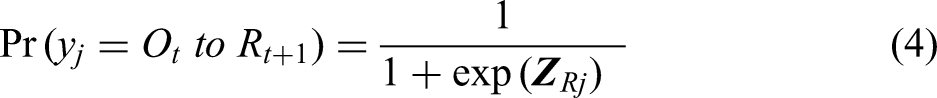
We estimate the impacts of a TV reduction on the likelihood of a parcel transitioning from a rental property to owner-occupied and transitioning from owner-occupied to a rental status. We estimate the effect of a TV decline on these decisions. Note also that the configuration of the modeling is dynamic in that we are assessing the determinants of homeownership status from one period to the next. Along these lines, we introduce %ΔTV lagged one, two, and three years to determine the length of time it takes for a new equilibrium condition to emerge. Since we are interested in evaluating the impact of assessment decreases on the probability of changing homeownership status, we estimate a logit regression model as illustrated in equation (2).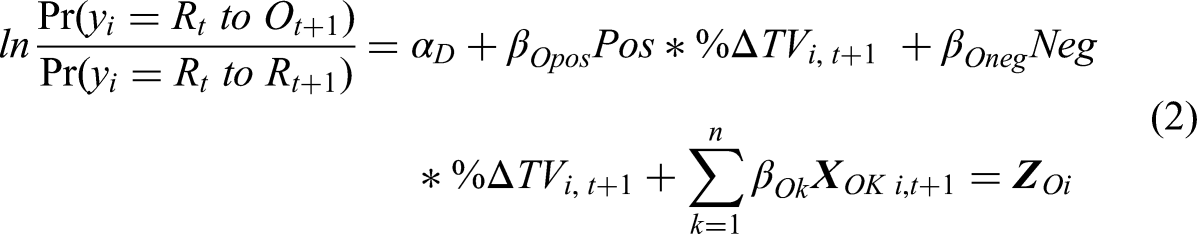


It is possible that the assessment declines could take several years for any impacts to be fully reflected in the homeownership status. Our analysis includes an evaluation of the temporal implications of the reduction of TV in homeownership status. To estimate the temporal impacts, we include lags of both Neg*
Results
The regression results are reported in Appendix Tables A2 and A3. We focus our discussion on Figures 2 and 3, which reports the effects of a reduction in TV for a one-, two-, and three-year lag for the
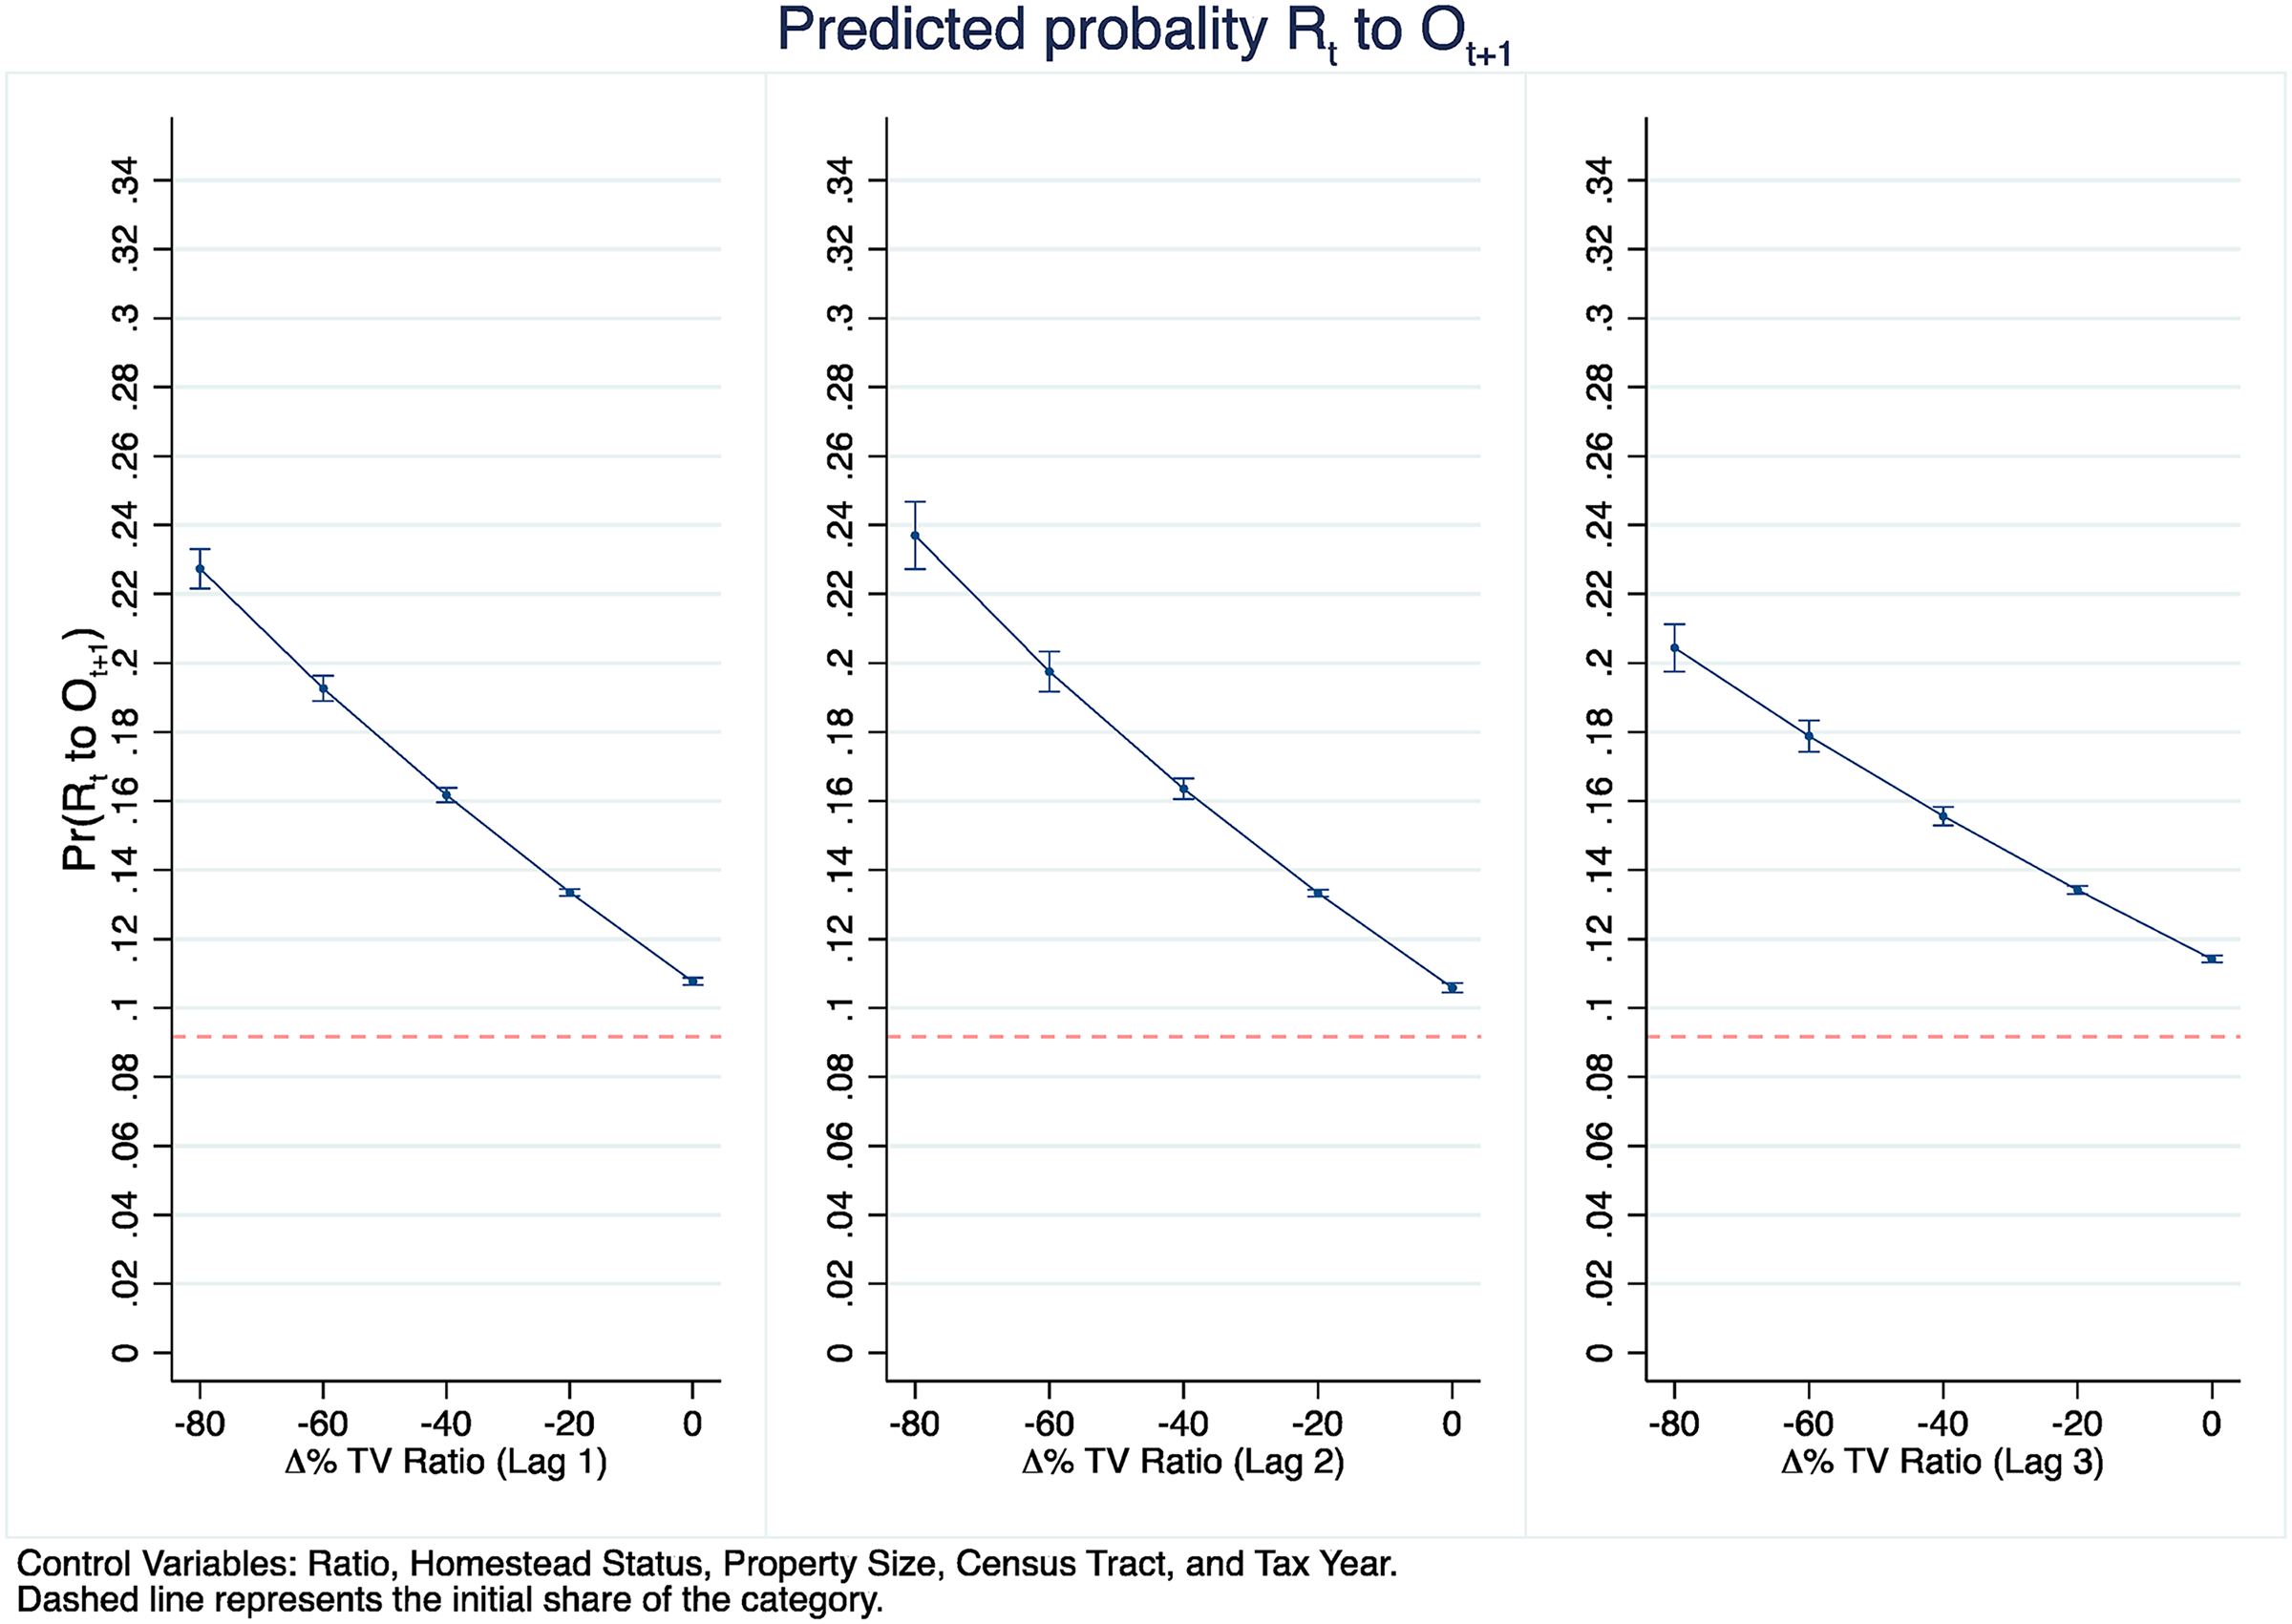
Marginal effects on transition from rental to owner-occupied status of a taxable value (TV) decline in periods t, t + 1, and t + 2.
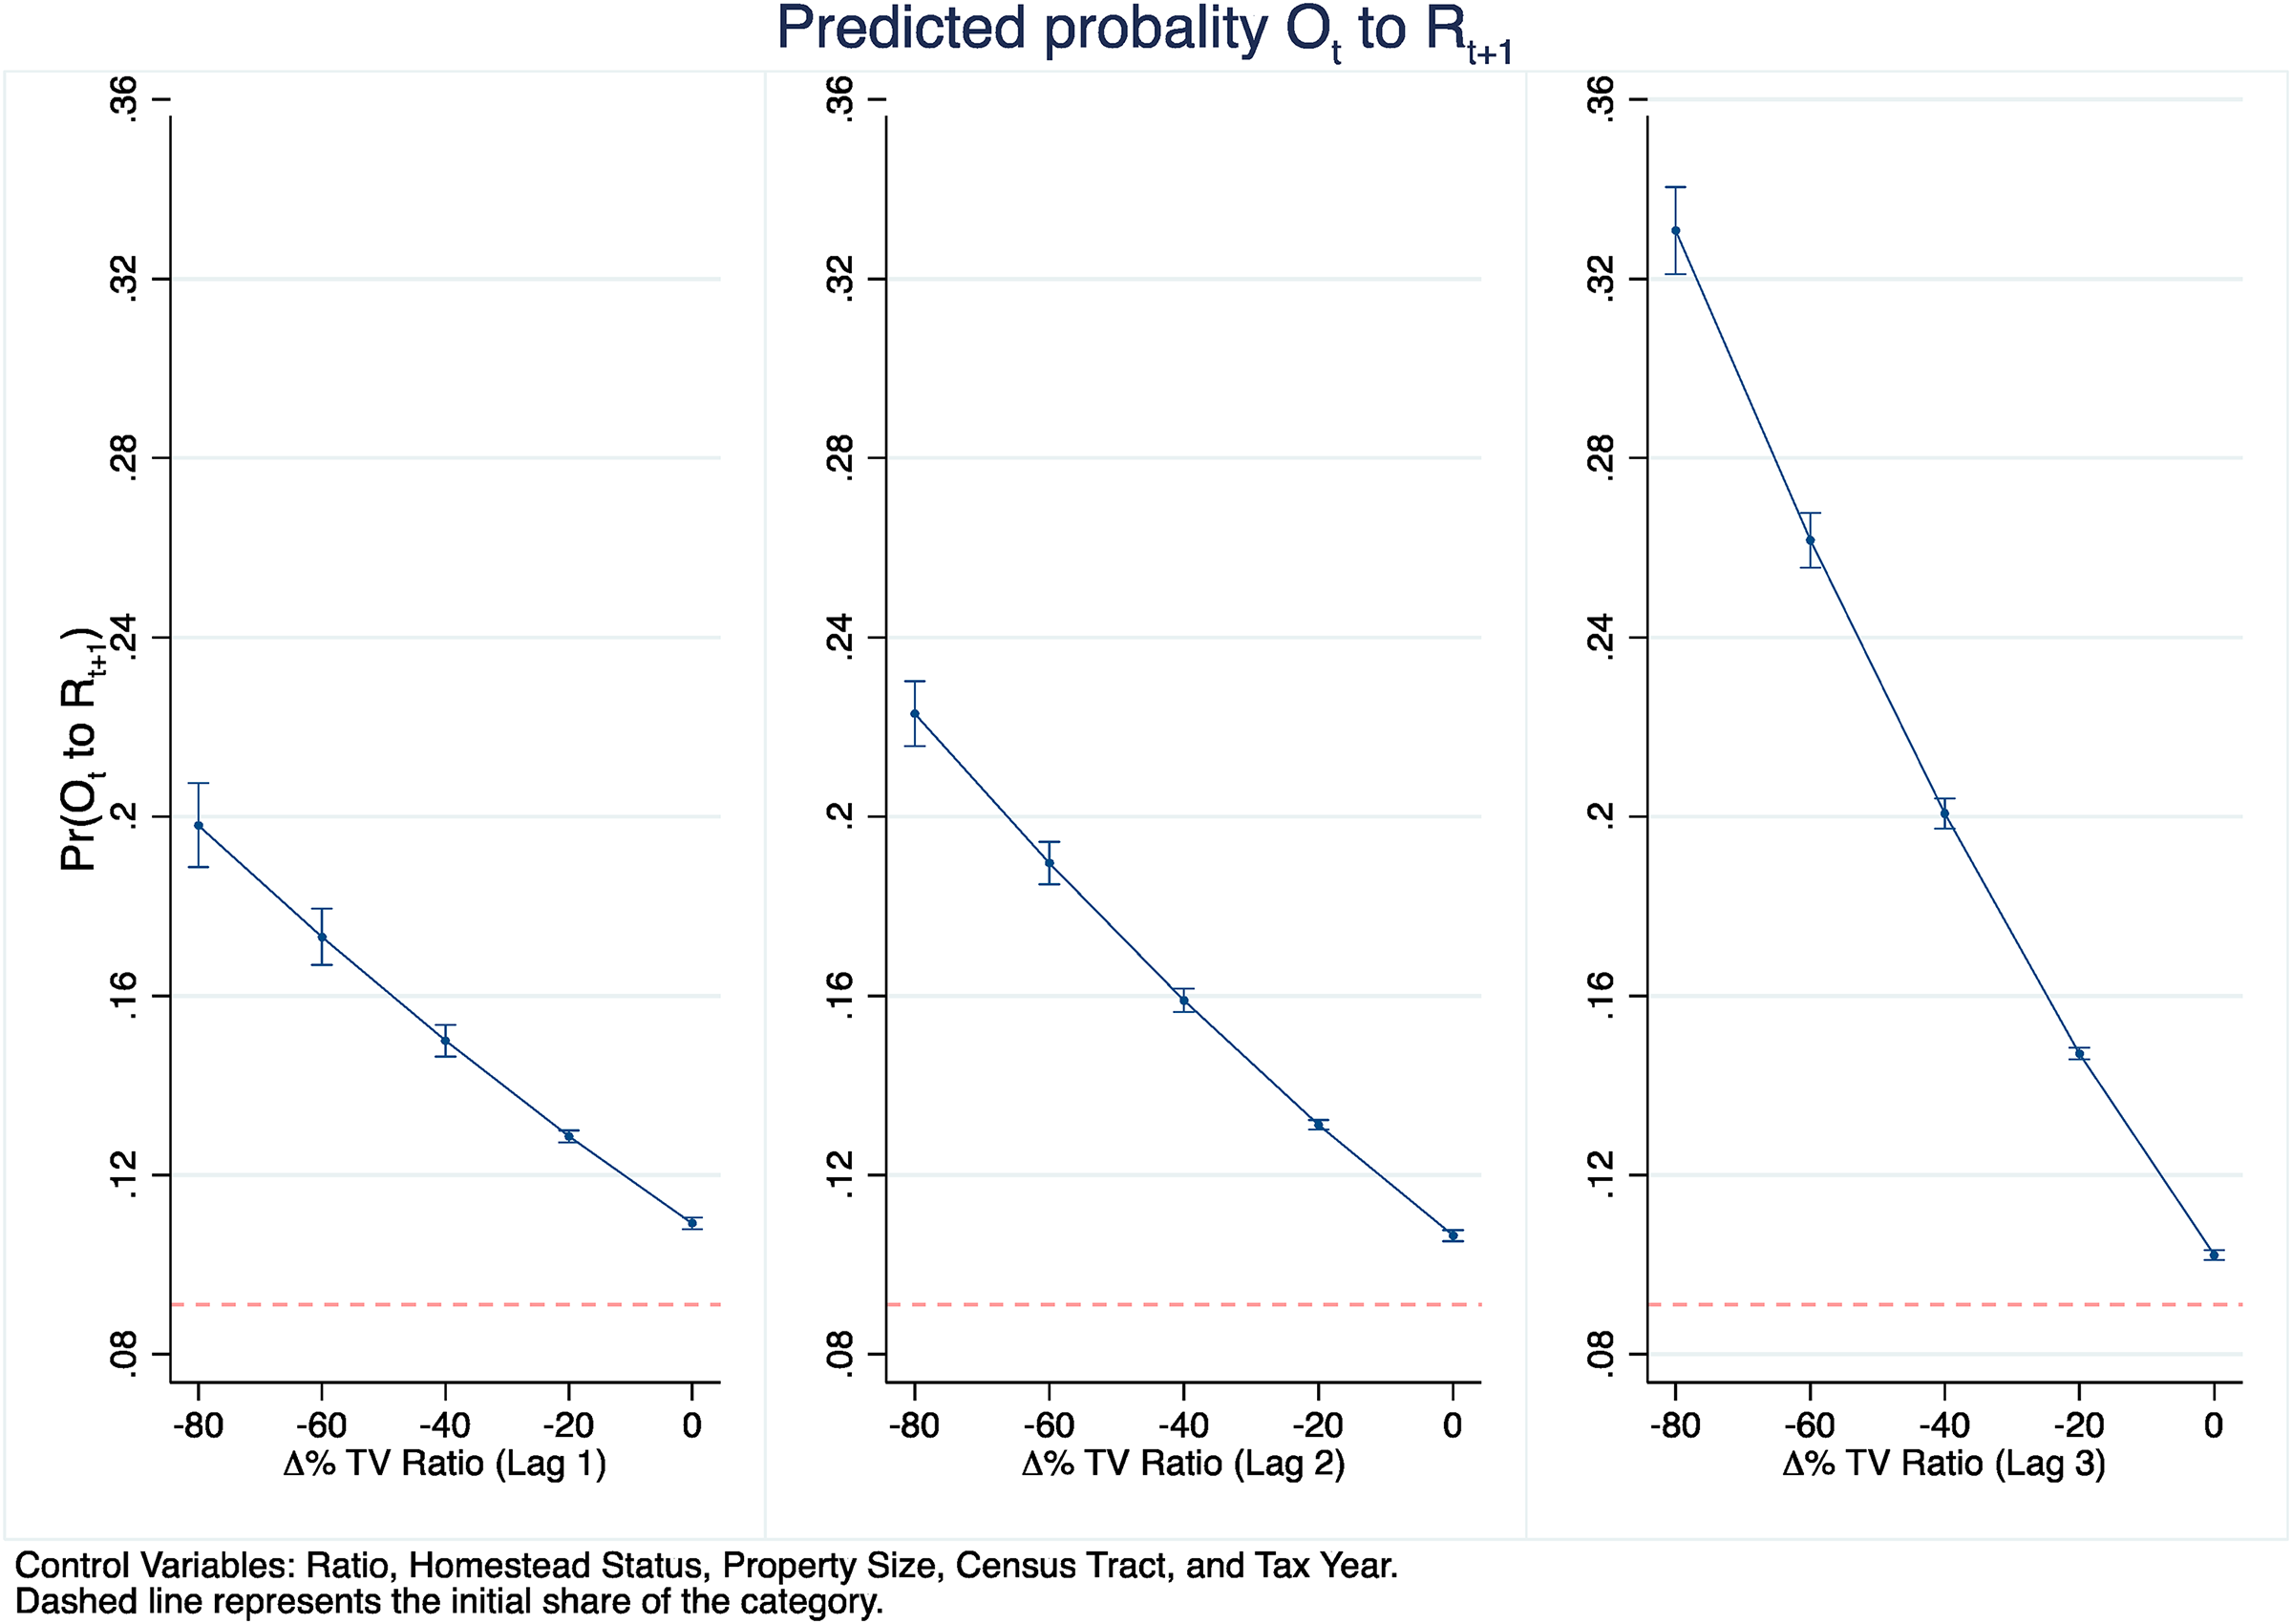
Marginal effects of a transition from owner-occupied to rental status of a taxable value (TV) decline in periods t, t + 1, and t + 2.
In Figure 4, we present a graph of the sum of the effects over the three years for the
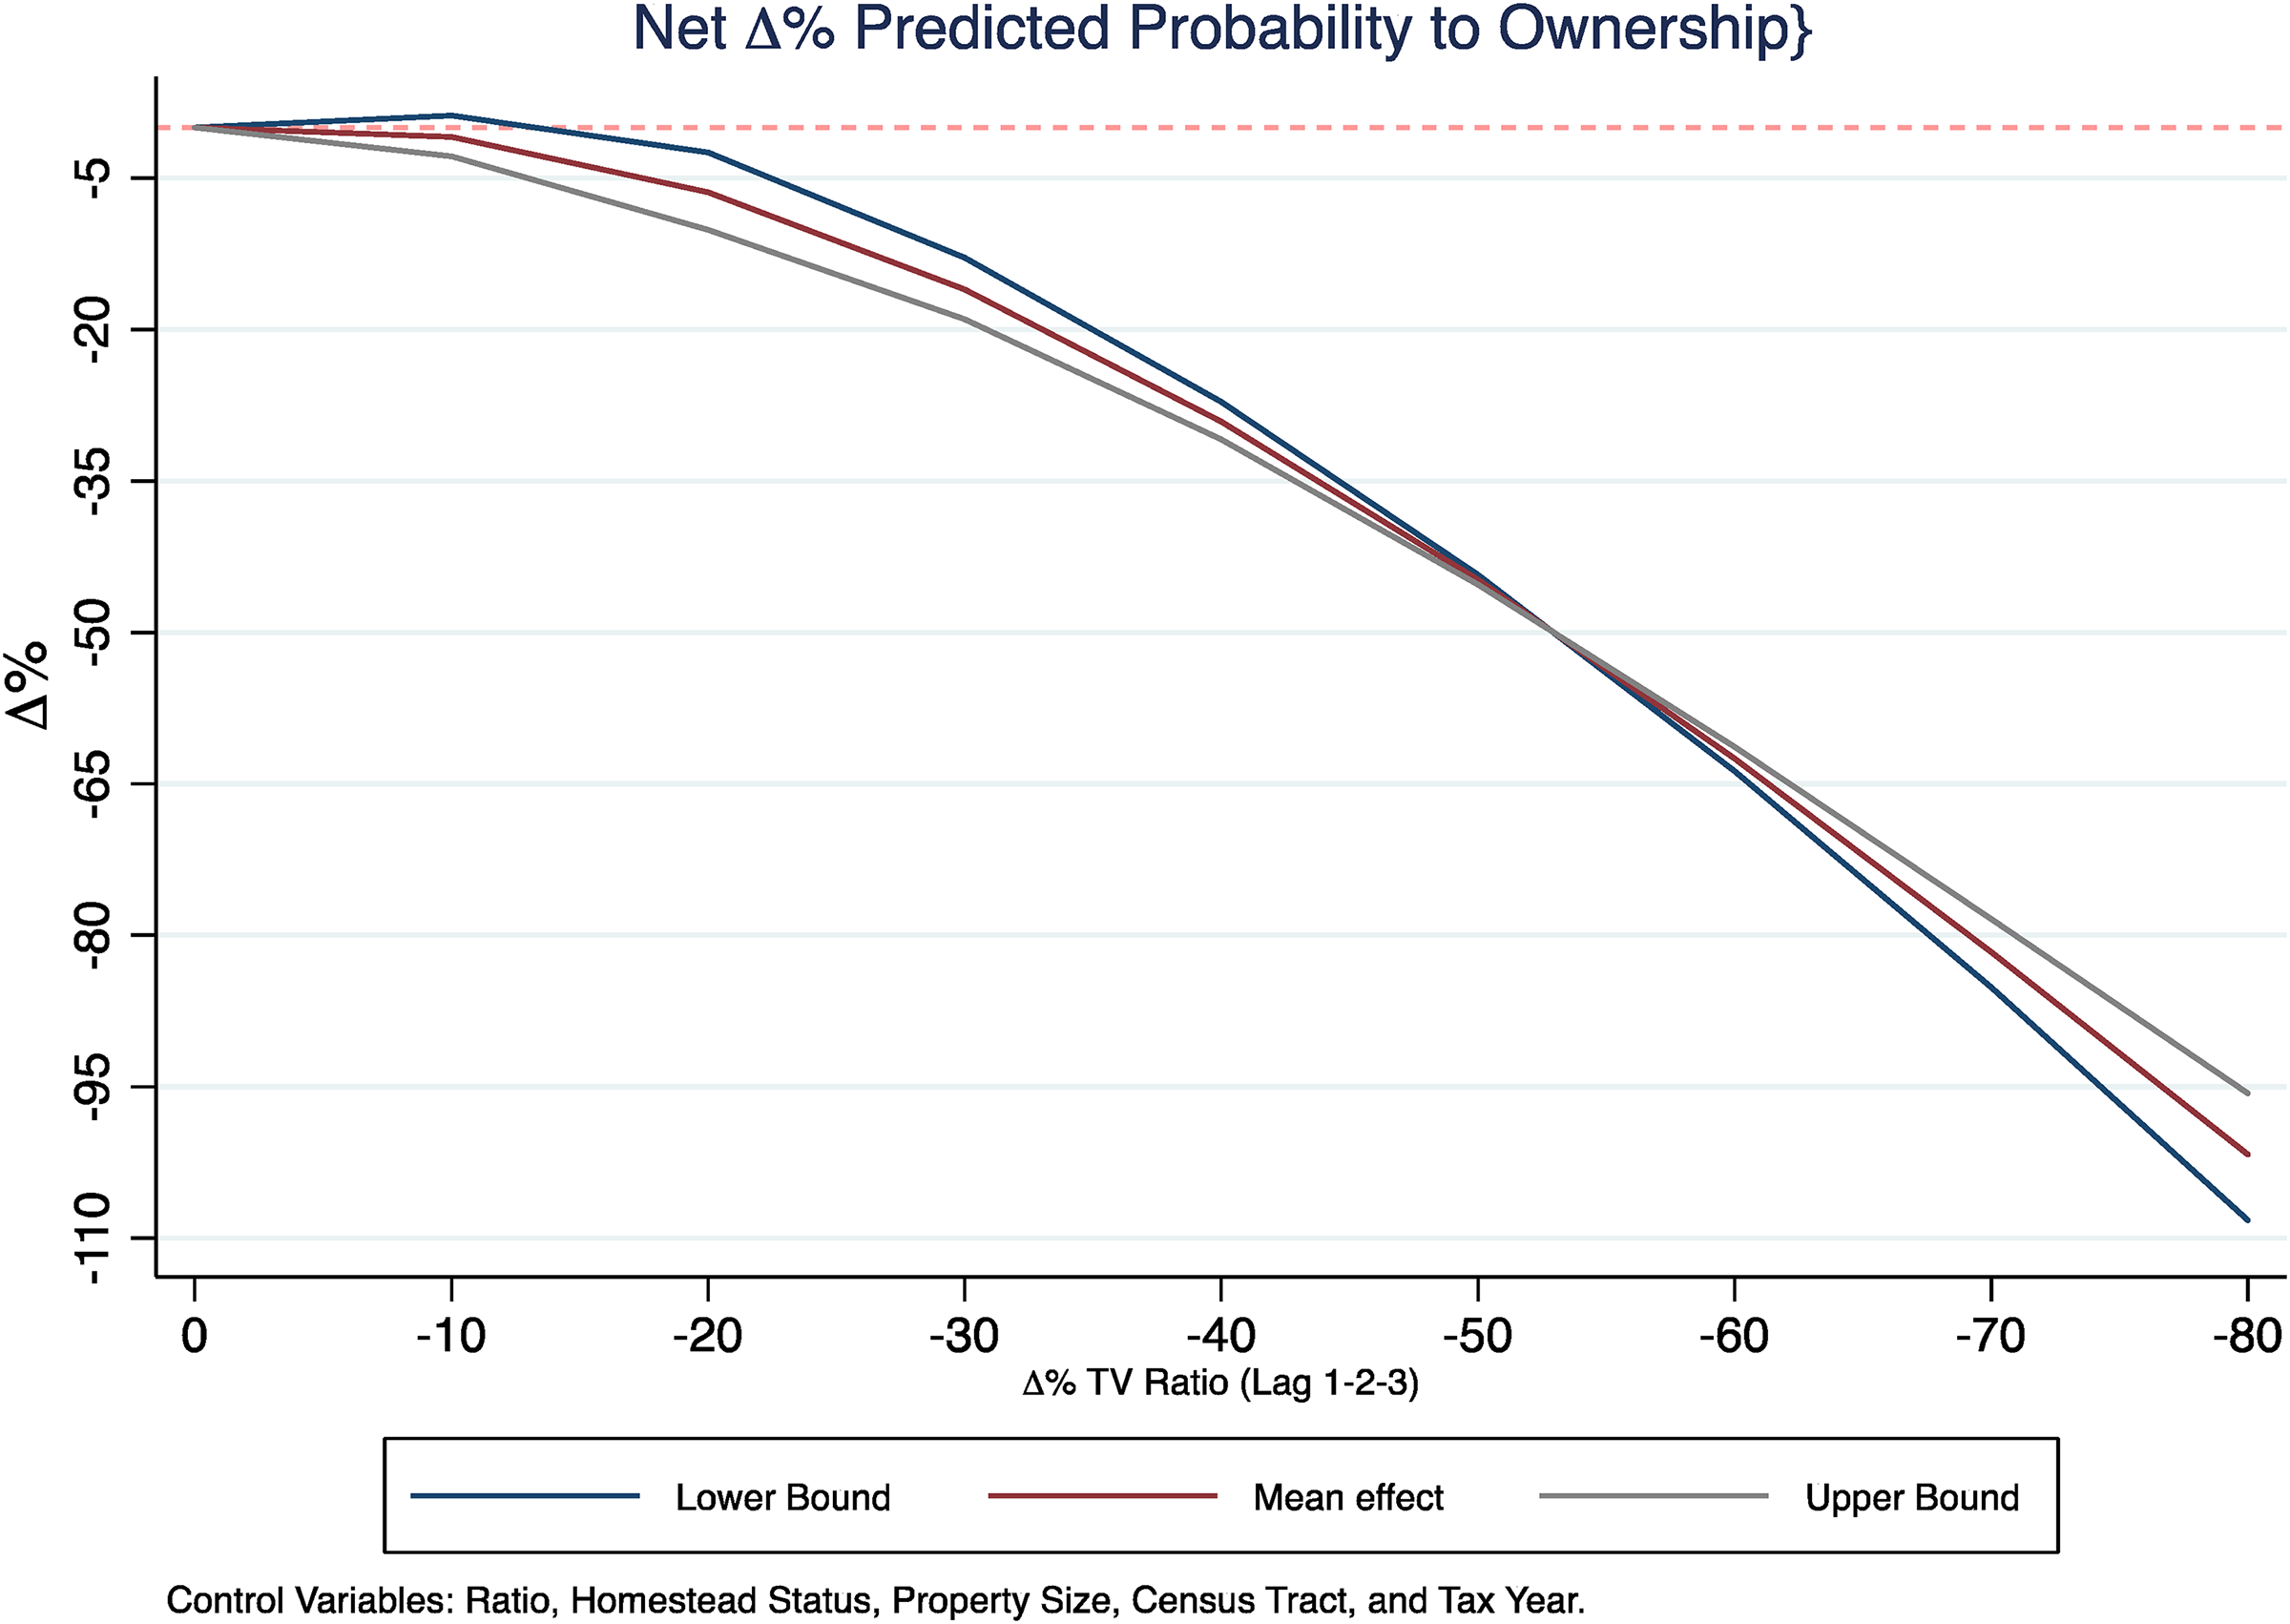
Predicted overall probability of increased homeownership.
To summarize, this evaluation suggests that declines in TV resulted in a small net movement from owner-occupied to rental status. Our estimates also indicate that the effects were observed one-, two-, and three years out from the TV reduction, suggesting lasting impacts. So far, we have presented analyses of how reductions in TV and, therefore, effective tax rates affected homeownership status. The following section offers simulations that show how significant the impacts are likely to be should a split-rate tax and associated tax reduction on residential properties be adopted in Detroit.
Simulations
The estimates presented in the empirical analysis provide evidence that the tax payment reductions driven by the reassessment increased. This finding in itself offers a meaningful contribution to the literature. However, the analysis presented here is part of a broader study designed to inform the potential impacts of imposing a split-rate tax in Detroit; therefore, we draw inferences from these estimates for the imposition of a split-rate tax in Detroit. As discussed in the introduction, there are some important caveats: (1) Tax reductions resulting from the revaluation are not the same as a tax change resulting from a split-rate tax, and thus the behavioral responses may not be the same and (2) in a general equilibrium framework, a higher land tax could potentially reduce land prices while stimulating development. We expect that reductions in land values and land taxes would be more than fully offset by increases in the value of structures due to development. The simulations below should be viewed as providing guidance and not a precise forecast. Given the limited split-rate tax impositions globally from which to evaluate the effects of implementation, particularly for a deindustrialized city such as Detroit, this evaluation is both critical and informative.
The estimates presented in this article provide a basis for simulating the potential impacts of moving from a traditional property tax to a split-rate tax. Anderson et al. (2022) calculated changes in parcel-level tax payments if Detroit were to move to a split-rate tax in a revenue-neutral scenario. They consider a 5-to-1 ratio where land is taxed at a rate five times structures and a complete land value tax. Table 5 below presents the anticipated impacts on homeownership under several split-rate scenarios for the average-valued residential improved property. The first row contains the property tax environment in 2019 with a 1 to 1 tax on land and structures. The homeownership rate is the proportion of improved residential properties that are owner-occupied in 2019. From this baseline, we calculate the anticipated changes from our analysis. The first and second columns present the different split-rate scenarios and expected tax reductions for each scenario for residential properties. The third column reports the predicted homeownership rates for each split-rate scenario.
Simulated net Impacts of Moving to a Split-Rate tax on Homeownership for Residential Property (O-R and R-O).
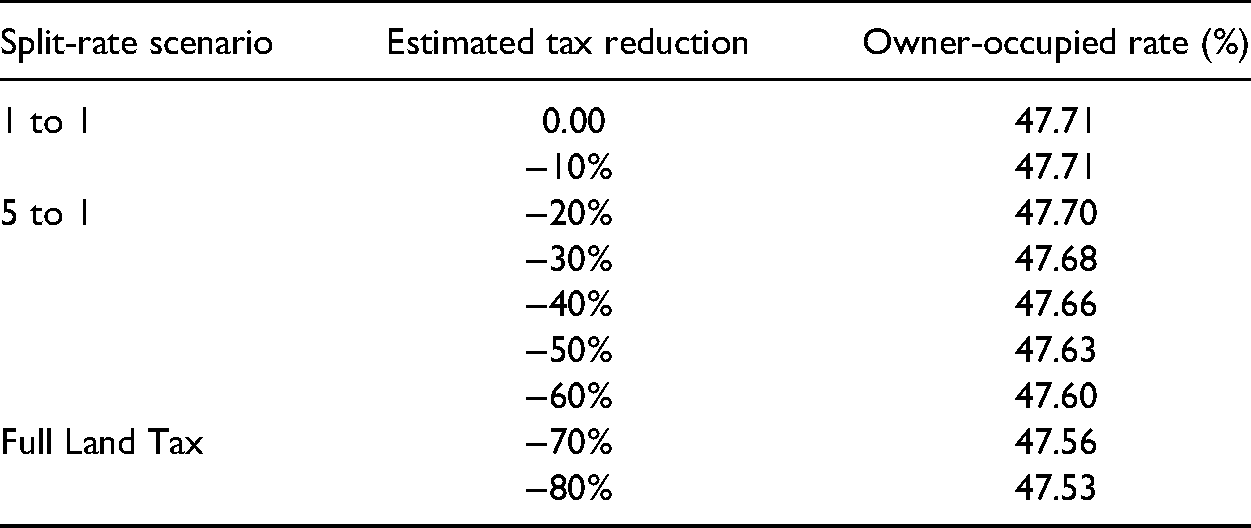
For this initial discussion, we focus on the 5 to 1 split-rate simulation, which Anderson et al. (2022) calculate would generate about a 20 percent reduction in taxes for residential properties. The calculations suggest that homeownership would decrease by 0.01 percentage points from 47.71 percent to 47.70 percent. Recall that our quasi-dynamic models estimate changes in status year over year. Table 5 reports transformed estimates that are calibrated to the level of overall homeownership under different split-rate scenarios. The estimates suggest that moving to a split-rate tax will have essentially no initial impact on homeownership.
Conclusions
This article offers an evaluation of how reductions in TV (and thus reduction in effective tax rates) resulting from a citywide reassessment affected homeownership decisions. These estimates offer helpful guidance about how moving to a split-rate taxation regime would affect homeownership in Detroit.
We find that tax reductions resulting from property reassessment generated a small net decrease in homeownership. Our evaluation also suggests that the impacts extend at least three years past the year of the change. These subsequent period impacts are consistent with those of Skidmore et al. (2012). They find that an exogenous decline in property tax rates brought on by the adoption of Proposal A resulted in property value increases over three years until new equilibrium conditions emerged. Generally, estimates support the notion that if a split-rate tax were to be implemented in Detroit, there would be little net change in homeownership. Our evaluation showed that a reduction in tax burden resulted in more properties moving from a rental to owner-occupied but also more properties moving from owner-occupied to rental status. The two effects work against each other. Although theory suggests that the net effect can go either way, it is unclear why the two effects work in the opposite direction. One possibility is that homeowners have the principal residence exemption, which results in a lower tax rate than rental property. Thus, the gross tax savings from the TV reduction for rental property owners will be greater than for homeowners. This may have increased the incentive for rental buyers to outbid potential homeowners from the owner-occupied to rental sales. More research is needed to better understand this result.
Last, we offer a word of caution. Our estimates are based on reductions in taxes resulting from the reassessment and not on an actual split-rate adoption. However, because land values are very low for most residential properties in Detroit, we think the tax reduction resulting from the reassessment offers a reasonable proxy for adopting a split-rate tax. Thus, our estimates provide helpful guidance on the potential impacts of adopting a split-rate tax in Detroit. In addition, there are other potential factors at play that we cannot fully control in our evaluation. For example, during the Great Recession, many investors bought distressed properties and then resold them when the markets stabilized. Our analysis may be clouded by this phenomenon. Regardless, our evaluation offers new analyses showing that correcting the overassessment of property may have resulted in a very small decrease in homeownership.
Footnotes
Acknowledgments
The authors would like to thank Invest Detroit and the Lincoln Institute of Land Policy for financial support for this study. They also acknowledge project support from Joan Youngman, Semida Munteanu, and Adam Langley at the Lincoln Institute of Land Policy, Cambridge, MA. We also thank Sebastien Bradley and Daniel McMillen for their helpful comments on an earlier draft of this manuscript. The views expressed in this article do not necessarily reflect those of Invest Detroit, the Office of the Chief Financial Officer, the City of Detroit, Wayne County, or any other local government units with taxing authority in Detroit. The analysis presented in this article should not be construed as policy recommendations. This article is based on the Lincoln Institute of Land Policy Report “Split-rate Property Taxation in Detroit: A Quasi-dynamic Economic Analysis—Assessment of Property Tax Reductions on Tax Delinquency, Tax Foreclosure and Homeownership” (![]() ).
).
Declaration of Conflicting Interests
The author(s) declared no potential conflicts of interest with respect to the research, authorship, and/or publication of this article.
Funding
The author(s) disclosed receipt of the following financial support for the research, authorship, and/or publication of this article: This work was supported by the Lincoln Institute of Land Policy (grant number no specific #).
Notes
Appendix
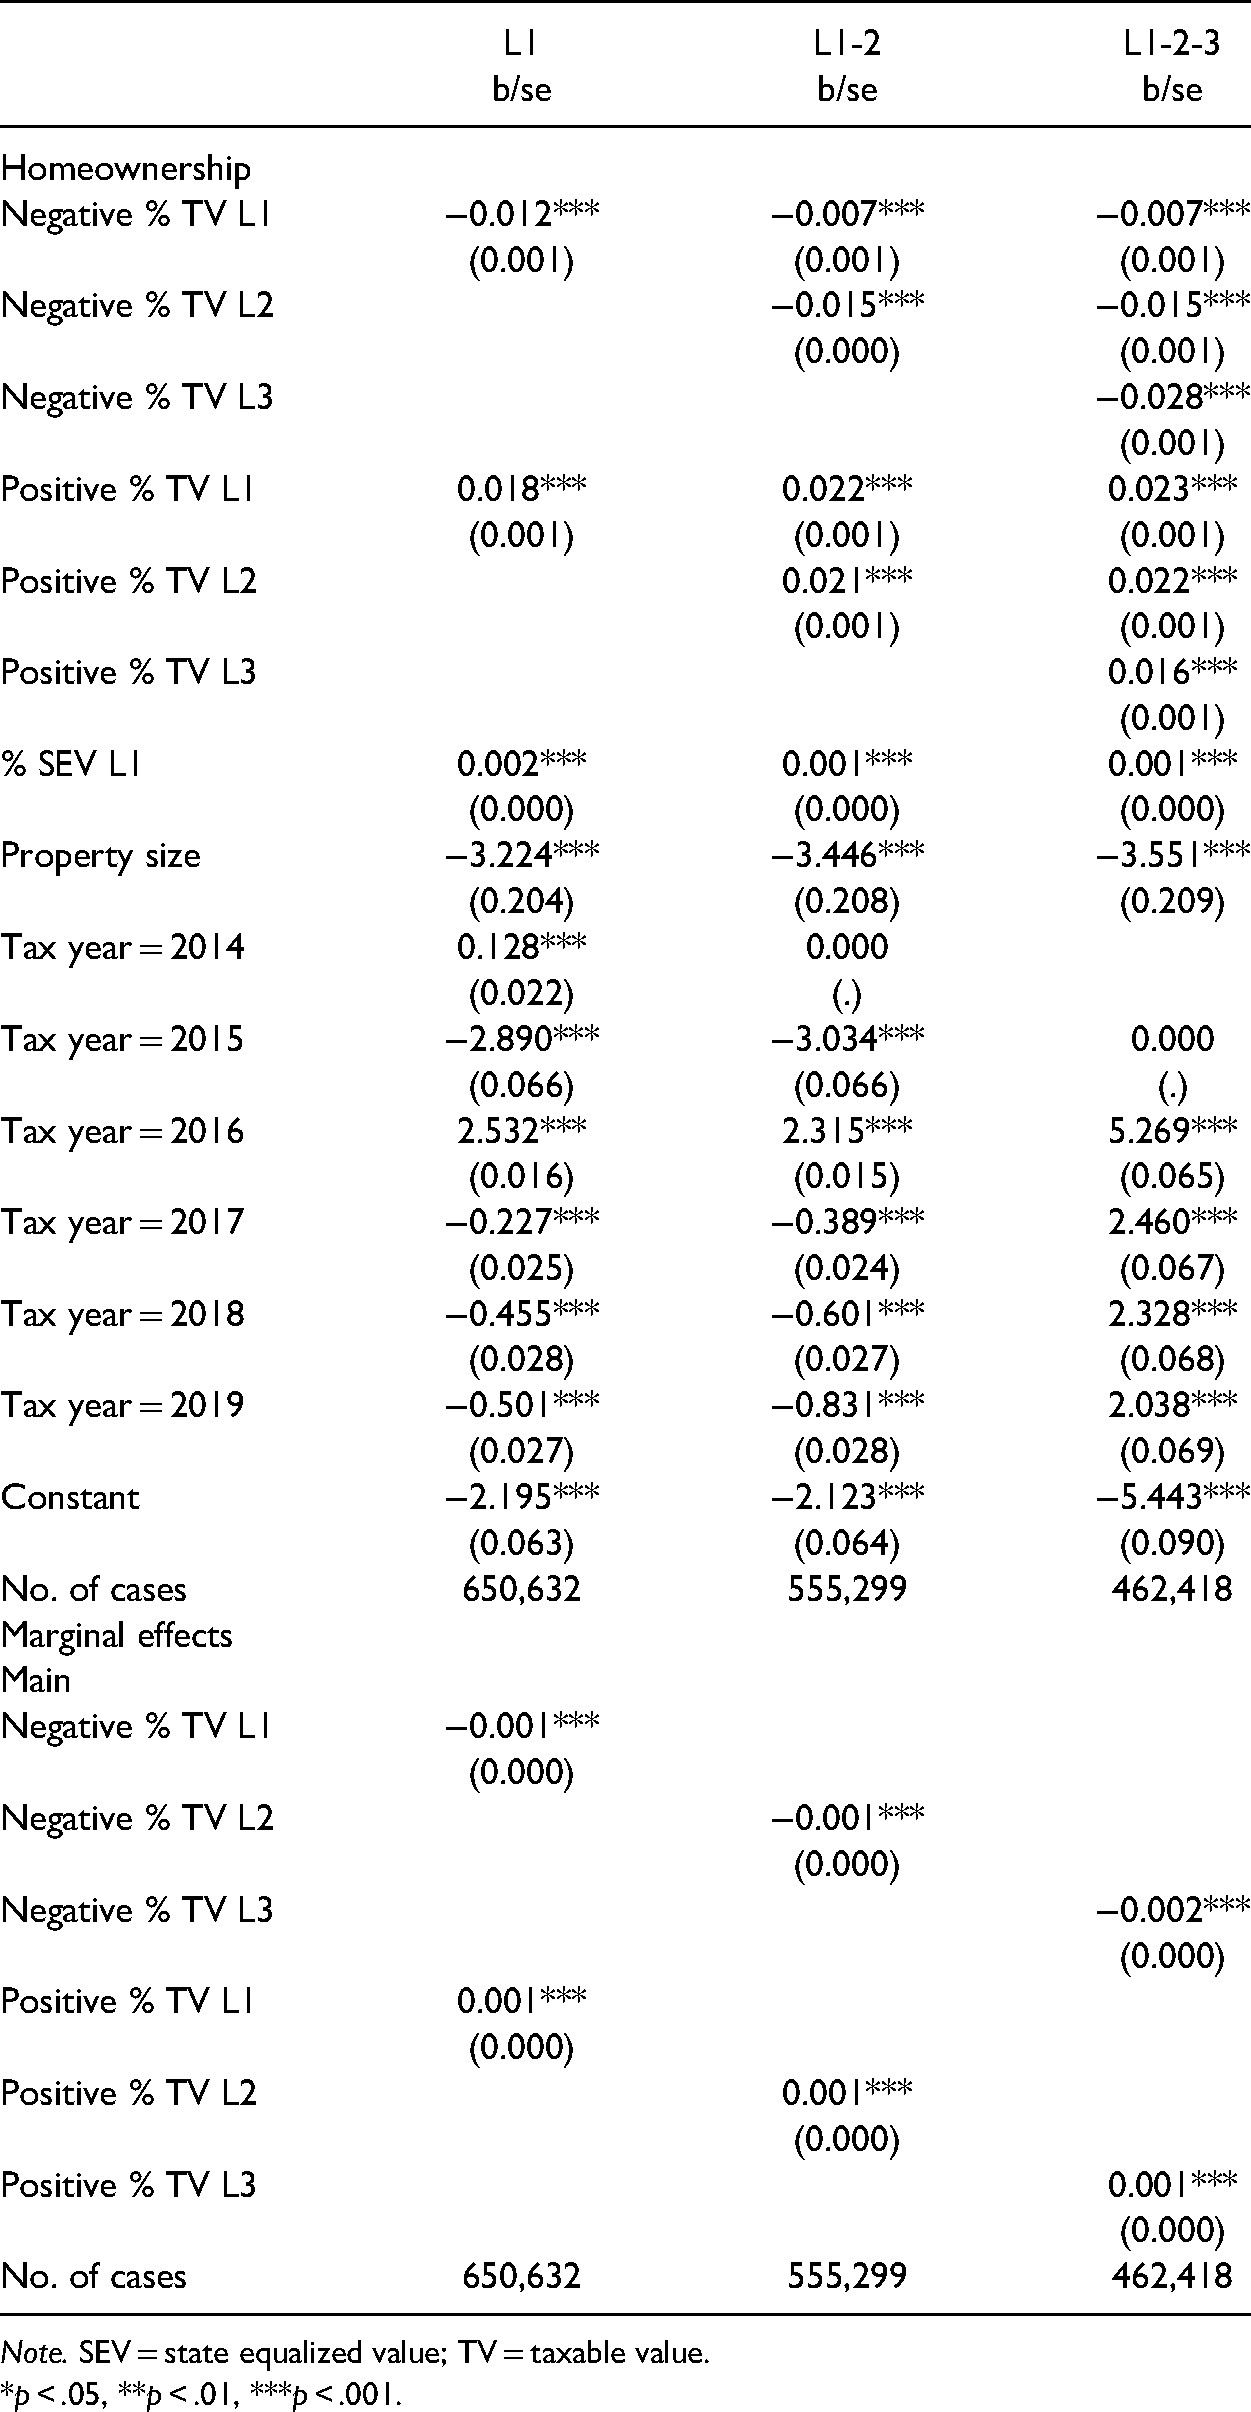
Owner-Occupied to Rental Status Regressions
| L1 | L1-2 | L1-2-3 | |
|---|---|---|---|
| b/se | b/se | b/se | |
| Homeownership | |||
| Negative % TV L1 | −0.012*** | −0.007*** | −0.007*** |
| (0.001) | (0.001) | (0.001) | |
| Negative % TV L2 | −0.015*** | −0.015*** | |
| (0.000) | (0.001) | ||
| Negative % TV L3 | −0.028*** | ||
| (0.001) | |||
| Positive % TV L1 | 0.018*** | 0.022*** | 0.023*** |
| (0.001) | (0.001) | (0.001) | |
| Positive % TV L2 | 0.021*** | 0.022*** | |
| (0.001) | (0.001) | ||
| Positive % TV L3 | 0.016*** | ||
| (0.001) | |||
| % SEV L1 | 0.002*** | 0.001*** | 0.001*** |
| (0.000) | (0.000) | (0.000) | |
| Property size | −3.224*** | −3.446*** | −3.551*** |
| (0.204) | (0.208) | (0.209) | |
| Tax year = 2014 | 0.128*** | 0.000 | |
| (0.022) | (.) | ||
| Tax year = 2015 | −2.890*** | −3.034*** | 0.000 |
| (0.066) | (0.066) | (.) | |
| Tax year = 2016 | 2.532*** | 2.315*** | 5.269*** |
| (0.016) | (0.015) | (0.065) | |
| Tax year = 2017 | −0.227*** | −0.389*** | 2.460*** |
| (0.025) | (0.024) | (0.067) | |
| Tax year = 2018 | −0.455*** | −0.601*** | 2.328*** |
| (0.028) | (0.027) | (0.068) | |
| Tax year = 2019 | −0.501*** | −0.831*** | 2.038*** |
| (0.027) | (0.028) | (0.069) | |
| Constant | −2.195*** | −2.123*** | −5.443*** |
| (0.063) | (0.064) | (0.090) | |
| No. of cases | 650,632 | 555,299 | 462,418 |
| Marginal effects | |||
| Main | |||
| Negative % TV L1 | −0.001*** | ||
| (0.000) | |||
| Negative % TV L2 | −0.001*** | ||
| (0.000) | |||
| Negative % TV L3 | −0.002*** | ||
| (0.000) | |||
| Positive % TV L1 | 0.001*** | ||
| (0.000) | |||
| Positive % TV L2 | 0.001*** | ||
| (0.000) | |||
| Positive % TV L3 | 0.001*** | ||
| (0.000) | |||
| No. of cases | 650,632 | 555,299 | 462,418 |
Note. SEV = state equalized value; TV = taxable value.
*p < .05, **p < .01, ***p < .001.