
Abstract
In 2012, the McCleary case ruling by Washington's Supreme Court significantly centralized school funding to re-equalize basic education access for all students. To understand the impact of the reform on school district finance, we examine changes in Washington school district revenues over 2004–2021. We document that the reform increased total district resources and the share of state funding for all districts rather than for disadvantaged districts alone. We also observe a decline in the use of local revenues by districts. Taken together, the results suggest that funding equity improvements in Washington were achieved through more abundant state revenue assistance and through the flattening of local levies, with prospectively stronger negative effects of the policy change on the local revenues of wealthier school districts over time.
Introduction
The funding arrangements of American public schools matter for millions of people, from students and educators to taxpayers and society at large as beneficiaries of economic growth enabled by K-12 through the development of human capital. Since the 1970s, several waves of education finance reforms have rolled through American states to challenge decentralized funding arrangements that had produced vast funding disparities between property-rich and property-poor districts in terms of resources generated from the local taxes (for a review, see Jackson, Johnson and Persico 2016). The state of Washington was not an exception.
Similar to the other Western states, the school districts in Washington had long relied on voter-approved property tax levies. This design meant higher local-levy revenue generation in property-rich districts and more reliance on federal programs in property-poor ones. The first state lawsuits, known as the Doran cases, occurred in 1978 and 1983 and questioned school funding adequacy across the state of Washington. 1 In both cases, the state's Supreme Court ruled that the Washington public-school funding system was inadequate and violated the state's Constitution. By the time of the third lawsuit - McCleary v. State in 2012 2 - Washington had already developed a rather centralized school funding system and ranked the top 8th in the nation in terms of the share of state aid in school-district budgets (see Appendix 1). Yet, the funding adequacy was challenged again.
As a result of the McCleary case, the Washington Supreme Court mandated that the legislature should find a way to “amply fund basic education” for every child in the state (McCleary v. State, 173 Wn.2d 477, 269 P.3d 277 2012). During this extended litigation, the Supreme Court ruled that local property tax levies could not be deemed to be a stable revenue source for school districts, because they “are wholly dependent upon the whim of the electorate, are available on a temporary basis, and rely on the assessed valuation of real property at the local level” (McCleary v. State, 173 Wn.2d 477, 269 P.3d 277 2012).
Enacted by the state of Washington on January 5, 2012 (Sun et al. 2024), the McCleary ruling mandated that the state should use a state-wide equalization formula and centralize funding so that dollars follow students, not the property tax base. The same ruling mandated that some of the property tax proceeds of property-rich districts be directed to poorer municipalities to support children in schools more uniformly. The expectation was that the school equalization formula would channel a significant portion of K-12 funding from Western to Eastern districts, so that the money would follow the students wherever they happen to live. By doing so, the McCleary mandate aimed at creating a more equitable school funding system that would effectively convert K-12 education into a locally provided and state-funded public service. In 2017, the state also enacted HB 2242, a follow up legislation of the McCleary regime (Fujioka and Knight 2025) that increased state property tax rates and capped local levy revenues creating what is known as the “levy swap” (Sun et al. 2024).
To understand the effects of the McCleary decision on school finance, we examine changes in the structure of school revenues from 2004 to 2021 using data for all state's school districts. We focus on assessing changes in the revenues per student for school districts grouped by their revenue wealth at the beginning of the observation period. In addition to the within-state comparisons by revenue wealth quartiles, we run models that examine the average effects of McCleary on revenue changes in Washington school districts relative to the revenues of school districts in three other Pacific Northwest states – Oregon, Idaho and Nevada.
In what follows, we review prior research on the effects of school finance reforms. Next, we present the conceptual framework, the empirical approach, data, and findings. The paper concludes with a reflection on policy priorities that could complement the school equalization reform agendas in Washington to sustain horizontal equity in property rich districts that express high preferences for education spending. Such considerations are important in light of the competition between publicly funded and privately provided K-12 options.
This study contributes to the literature in three ways. First, it helps bridge a significant gap in the scholarship on Washington's education finance policy where relatively few scholars have examined school funding patterns following the Doran school finance reforms of the 1980s. 3 While other scholars have already examined the effects of McCleary on teacher salaries, turnover, and career trajectories (Sun et al. 2024), to the best of our knowledge, we are the first to estimate the McCleary reform effects on school district revenues.
Grounded in the national scholarship on school finance reforms (Jackson, Johnson and Persico 2016; Lafortune, Rothstein and Schanzenbach 2018; Rothbart 2020), our study advances the understanding of these important reforms by showing that McCleary, an equalization reform, did not directly target the most vulnerable districts in its design. Instead, the reform was implemented in a way that expanded funding for all districts while still maintaining level differences between districts of different revenue wealth. In other words, it equalized education access by more ample resource allocations state-wide but stopped short of equalizing school district budgets.
Finally, by studying local fiscal responses to Washington's school finance equalization reform, we contribute to the literature on state and local government fiscal relations. Specifically, we show that following an increase in state funding after McCleary, local revenues exhibited no crowding out effect until the state imposed a mandatory local levy limit in 2018. These expansionary tendencies in the fiscal behavior of school districts suggest that unless local levies are constrained and the reform produces the state-local “levy swap”, as it happened in Washington after 2018, all school districts regardless of wealth may be expected to continue to draw revenues from their tax base rather than substitute local revenues for state transfers. In short, money sticks where it hits. By examining local fiscal responses to the McCleary reform from the public finance perspective, we illustrate that collective decision-making in the context of fiscal commons deviates from the expectations of the rational choice framework and may lead to the flypaper effect.
Goals and Effects of School Finance Reforms
Within the school finance literature, researchers have long sought to understand the effects of school finance reforms on school funding, intra-district school funding adequacy, equity between and within school districts, and changes in educational attainment following the reforms (for a review, see Lafortune, Rothstein and Schanzenbach 2018). Between the 1970 and the 2010s, 42 states had their school funding systems challenged in court and in 28 of these states, the courts overturned the existing system (Hanushek and Joyce-Wirtz 2023; Jackson, Johnson and Persico 2016). Education finance reforms are often contested and may reoccur on state agendas producing multiple reforms for the same state over time. Because of the lawsuits, state legislatures often amend formula parameters for school funding by changing how students are counted and by updating funding levels for inflation and other costs. 4
Many school finance studies find that litigations result in mixed outcomes producing variation in policy effectiveness over time and by state (Hanushek and Joyce-Wirtz 2023; Joondeph 1995; Kenyon and Munteanu 2022; Lafortune, Rothstein and Schanzenbach 2018; Manwaring and Sheffrin 1997). In some cases, school litigations do moderately improve the distribution of resources leading to more equal funding. However, in these instances, school funding tends to grow more slowly than the national average and even successful litigation efforts may not increase school spending over the long run (Hanushek and Joyce-Wirtz 2023). States with the lowest funding disparities (highest equalization) also tend to show smaller increases in school funding and have unintended consequences, including, for example, changes in debt issuance in districts with high tastes for education spending to overcome the “spirit” of equalization policy (Plecki 2000; Theobald and Picus 1991; Zimmer and Jones 2005).
Research on student performance finds that teachers matter the most in improving student performance and closing achievement gaps (Darling-Hammond 1999; Guarino, Santibanez and Daley 2006; Johnson 2006; Rivkin, Hanushek and Kain 2005; Rowan, Correnti and Miller 2002; Sanders and Rivers 1996). Therefore, to improve performance, school districts are often recommended to prioritize teachers’ pay and non-pecuniary benefits to attract, motivate, and retain high-quality personnel (Figlio 1997; Loeb and Page 2000; Murnane and Olsen 1990; Streams et al. 2011). Yet, such policy changes are not easy to sustain over time.
For example, when a court ruling led to the Kentucky Education Reform Act (KERA) in the 1980s, teachers got increases in pay and the gap between relatively poor rural Appalachian schools and wealthier urban locations closed (Rose v. Council for Better Education Inc. 1989; Streams et al. 2011). Specifically, KERA provided a salary boost to teachers with low and medium experience and equalized pay for teachers with high experience across the region. However, when Streams et al. (2011) analyzed the reform outcomes by 2006, they observed disparities in spending per student, achievement gaps, and a wide range of teacher compensation, controlling for teacher experience. Even though the reform first equalized teachers’ pay, the equal pay patterns disappeared after 2000, and schools returned to pre-KERA compensation schedules (Streams et al. 2011).
When Thompson and Crampton (2000) studied the effects of court rulings that had improved school funding in Arizona, Montana, Tennessee, and Washington, they compared the states’ trends in enrollment, expenditures (both operating and capital), and professional salaries to all other states in the nation over a 27-year period (1970–1997). All four states recorded sizable growth in per pupil spending and professional salaries after the reforms, but these increases still lagged behind the increases in other states. The effects on spending were mixed.
Rubenstein et al. (2008) did show equity improvements in states with strong accountability systems 5 after court litigation in the 1990s through the analysis of student performance, the coefficient of variation, Gini coefficient, McLoone Index, and Odden-Picus Adequacy Index as measures of equity. However, when the authors used a cost-adjusted national spending median as an equity benchmark, they found no relationship between accountability, litigation, and equity in post-reform states. Instead, school competition, housing segregation, and resource inequality were found to be key barriers to improved student performance.
However, by analyzing nationally representative data for children born between 1955–1985, Jackson, Johnson and Persico (2016) found strong positive effects of school finance litigation on education spending and student long-term outcomes such as wages, educational attainment, and a reduction in poverty for children from low-income families. Work by Lafortune, Rothstein and Schanzenbach (2018) corroborated these findings while also noting stronger effects for the longer duration of student exposure to the reforms.
Such aggregate effects are important for policymakers to assert and acknowledge; yet, they may mask variation in the outcomes across various reform contexts (Hanushek and Joyce-Wirtz 2023; Nguyen-Hoang 2025). The McCleary case in Washington offers us an opportunity to examine whether the reform lived up to its expectations in terms of improving school district equity and access to resources that enable higher student achievement.
Research on School Funding Equity in Washington
Prior to the McCleary reform, literature on school finance in Washington already documented declining disparities and some unintended consequences in school funding, teacher compensation, and student outcomes. Plecki (2000) estimated state-wide school equity in 1974–75, 1984–85, and 1994–95, and reported five equity measures of school district funding: the high/low ratio, the federal range ratio, the coefficient of variation, Gini coefficient, and the McLoone index. Over the three decades surveyed, Plecki (2000) showed a dramatic improvement in funding equity, with the high/low student funding ratio declining from 240 to 17.44, the federal range ratio declining from 8.22 to 0.32, the coefficient of variation declining from 1.08 to 0.45, the Gini coefficient declining from 0.29 to 0.046, and with the McLoone Index improving from 0.81 to 0.95, respectively. 6
Comparing the centralized and the decentralized school district funding in Washington and California, Theobald and Picus (1991) documented changes in the share of state and local school revenues in 1980 and 1990 and concluded that state centralization especially hurt Seattle Public Schools (SPS), Washington's largest school district. The reform also affected Seattle's inner-city teachers, whose salaries got significantly depressed because the state-mandated formula failed to account for regional cost-of-living differentials (Theobald and Picus 1991).
Another Washington study compared teacher pay between the 1980s and the 1990s and found that the state equalization reform reduced teacher pay in highest-paying districts by 13.6 per cent and improved pay in the lowest-paying districts by 44.6 per cent, narrowing the high/low ratio of teacher pay from 43.6 to 6 per cent, respectively (Theobald and Hanna 1991). The shift in resources, however, occurred from relatively poor urban districts to relatively wealthy white suburban districts. Both studies also concluded that the Washington state school equalization reform raised district dependency on the state and increased school exposure to state revenue fragility during recessions (Theobald and Hanna 1991; Theobald and Picus 1991).
When Conley and Rooney (2007) estimated the amount of funding necessary for all state's students to meet local, state, and federal expectations of learning through test scores using a hedonic model, they concluded that per-student funding would need to increase by 45 per cent (from $8 thousand to $11 thousand in 2004–2005), and that teacher and staff salaries would need to increase by 30 percent in order to meet that goal. The study also recommended reducing class size, hiring more teachers and librarians, and funding more of the professional development opportunities for teachers and administrators (Conley and Rooney 2007).
Conceptual Framework and Hypotheses
Similar to the other U.S. states, Washington's system of school finance in its current form reflects constitutional requirements, state-local funding arrangements, property tax limitations, litigations, and court mandates. State support to its property-poor districts is known as local equalization assistance or LEA. After the 2012 McCleary reform, LEA funds are partially drawn from the revenues of affluent districts. When a Washington county levies and collects property taxes within its jurisdiction, the state re-equalizes all the school funding according to a formula where dollars follow the students. Because of this, the funding does not stay within the purview of the county limits or the school district where properties generate tax revenues. The divergent incentives of the Washington State Board of Education, as an equalizer, and school district administrators, as resource managers, may influence school funding at the same time. As a result, the fiscal equalization reform may produce both direct and indirect effects.
Hypothetically, after an increase in intergovernmental aid, a county and a school district may potentially respond to the reform in three ways: reduce own-source revenues, effectively substituting local revenues for state transfers; maintain own-source revenues at the current level, effectively absorbing all state funds; and increase own-source revenues, effectively supporting the state policy of spending increases through additional local revenue effort.
The substitution effect, observed through a reduction in locally generated revenues, can be expected in environments with exceptionally high opportunity costs of education that could force local governments to reduce tax collections or reallocate them from school finance to other pressing needs (a stylized textbook example of this response is a choice between education and food on the production possibilities frontier). In advanced democracies, high opportunity costs of education are unlikely, since K-12 has great social and economic salience. Alternatively, the substitution effect may occur asymmetrically in districts that lose the incentive to generate local revenues because redistribution nullifies their resource advantages.
School districts may also not make any changes to their local revenues after an increase in state aid. In this case, aid is fully absorbed by districts regardless of need. School district managers may act strategically to maximize their funding and preserve funds that can be used later (Candelaria and Shores 2019; Hoxby 2001; Hyman 2017; Jackson, Johnson and Persico 2016) and “money sticks where it hits” (Afonso 2014; Oates 1999). As a result, school district revenues go up producing the flypaper effect (Oates 1999). The flypaper effect is justified normatively when state funds are allocated to poorer districts and are absorbed for immediate costs of education provision but is less defensible when state aid reaches districts on a per pupil basis regardless of need. As a result of the flypaper effect, local communities may misperceive the true cost of K-12 services and experience fiscal illusion.
The third and similarly expansionary response to an increase in intergovernmental aid may occur when state support signals to districts that they can increase funding for functions that are prioritized by the state. This signaling effect of state policy on local policy determination has been noted before, for example, in the literature on sustainability adoption (Homsy and Warner 2015). As a result, an increase in local revenues following an increase in intergovernmental transfers may lead to an overall expansion of public spending and may be interpreted within the public choice perspective as evidence of the Leviathan government (Brennan and Buchanan 1980).
Considering the above-mentioned theoretical options and the redistributive nature of McCleary, our hypotheses are formulated as follows. Since McCleary changed the funding formula to prioritize equalization, we expect that it will have had particularly strong positive effects on the resources of economically disadvantaged districts. Specifically, we expect higher real revenue increases in disadvantaged districts than in all other districts after the reform (
Though the state may use a variety of tax and non-tax revenue sources to finance equalized education access, we expect that a vast majority of the state equalization efforts will be financed by the local property tax relying upon a broad and sustainable tax base. To fund equalization, the state will engage in higher fiscal centralization and, as a result, all the districts will see an increase in the state share in total revenues, regardless of wealth (
Finally, since the use of local voter-approved property tax levies in affluent districts came under fire, highlighted disparities, and partially triggered McCleary, we expect that the share of local revenue collections of property-rich districts will decline more than in the other districts (
Data and Method
To test the hypotheses, we work with school district financial data from the National Council of Education Statistics (NCES). More details on the data are provided in Appendix 2. Before proceeding to analysis, we follow several steps in data processing. Since the state of Washington has a wide variety of school districts by student enrollment and revenue generating arrangements, the handling of outliers may have consequences for the results of analysis. We begin with the full population of 5,985 district-year observations with non-zero student enrollment (296 distinct school districts). Next, we remove outlier districts with enrollment below 150 students. Such districts tend to be in remote areas and tend to have high fixed costs of education distributed among a small number of students. As a result, they have exceptionally high per student revenues and spending but are qualitatively different from the conventional property-rich districts with truly high per pupil revenues and spending. By removing the atypical districts, we make sure that the results are not driven by them as outliers.
We also drop districts what are not represented in 2004, the year we use for creating the district wealth quartiles. The analytical sample for regression analysis includes a balanced sample of 246 distinct school districts that have repeated observations for all years of analysis. 7 Table 1 presents descriptive statistics of the sample without the outliers as well as shows the pre-reform and post-reform averages.
Descriptive Statistics.
Note: Descriptive statistics are constructed for the sample that excludes district-year observations with enrollment fewer than 150 pupils. The McCleary reform turns 1 starting in fiscal year 2012. *Real revenues are adjusted for inflation using the Consumer Price Index (CPI) and 2019 as the base year.
The data are then analyzed in three stages. First, we examine descriptive trends in the funding arrangements of Washington school districts between 2004–2021 to document revenue changes before and after the reform. We are particularly interested in how school district revenues changed by economic need. The intent of McCleary was to improve K-12 outcomes and re-equalize education access by providing ample resources to property-poor districts. Has this occurred? If so, how targeted were the increases in funding? What happened with the funding of rich districts?
Next, we run difference-in-differences (DID) models and event study analysis to corroborate the descriptive evidence. Applying the xtdidregress command in Stata and its accompanying syntax for model diagnostics, we focus on the tabular and graphical display of the effects of the reform on districts grouped by pre-reform revenue wealth while also controlling for district and year fixed effects. In addition to the Washington models that contrast the reform outcomes by district wealth, we run DID models to compare the differences in school district revenues in Washington and three other states of the Pacific Northwest – Oregon, Idaho, and Nevada. 8
Finally, we examine changes in Washington's education funding equity indices over time. Specifically, we look at five equity measures constructed by Plecki in 2000 and update them with the recent school finance data, extending the analysis to 2005–2020.
Descriptive Trends
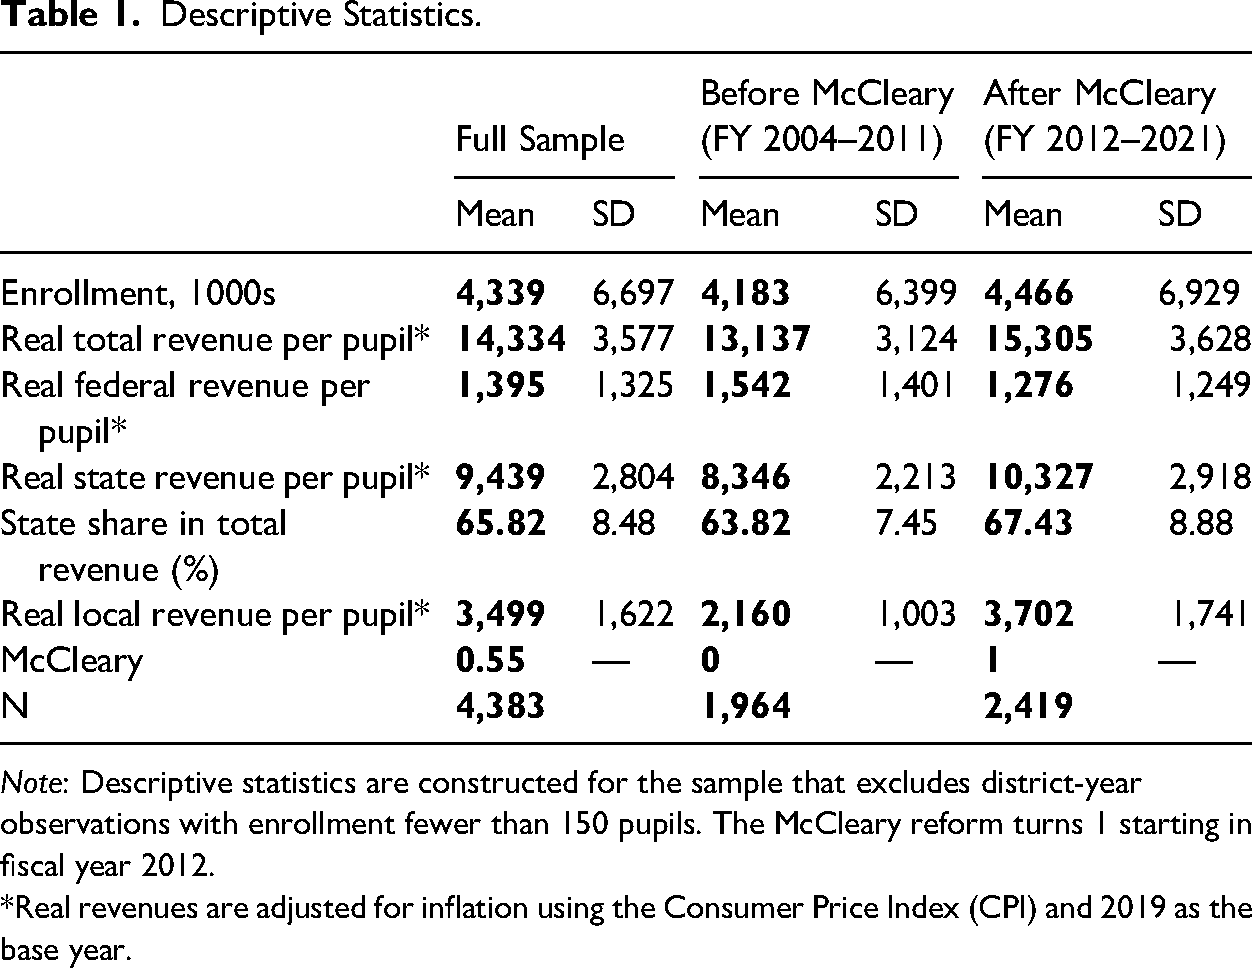
We begin the analysis with Figure 1, where school district revenues per pupil are presented by source. Total revenues per pupil are in real dollars, adjusted for inflation using the CPI and 2019 as the base year. Panel A uses the full sample that includes outlier school districts. Panel B excludes outliers.
Total Revenue per Pupil by Funding Source, Real 2019 Dollars.
The trends in Panels A and B are similar but are more informative in Panel B. From 2004 to 2021, average real revenues went up from about 12,500 in 2004 to about 17,500 per pupil in 2021 (in 2019 US dollars), a 40 percent increase. A steeper slope in revenue growth is observed after 2013, the first full year of McCleary implementation after its enactment on January 5, 2012. Federal funding did not change, state funding increased, and local revenues dropped after 2018, weakly mirroring an increase in state funding.
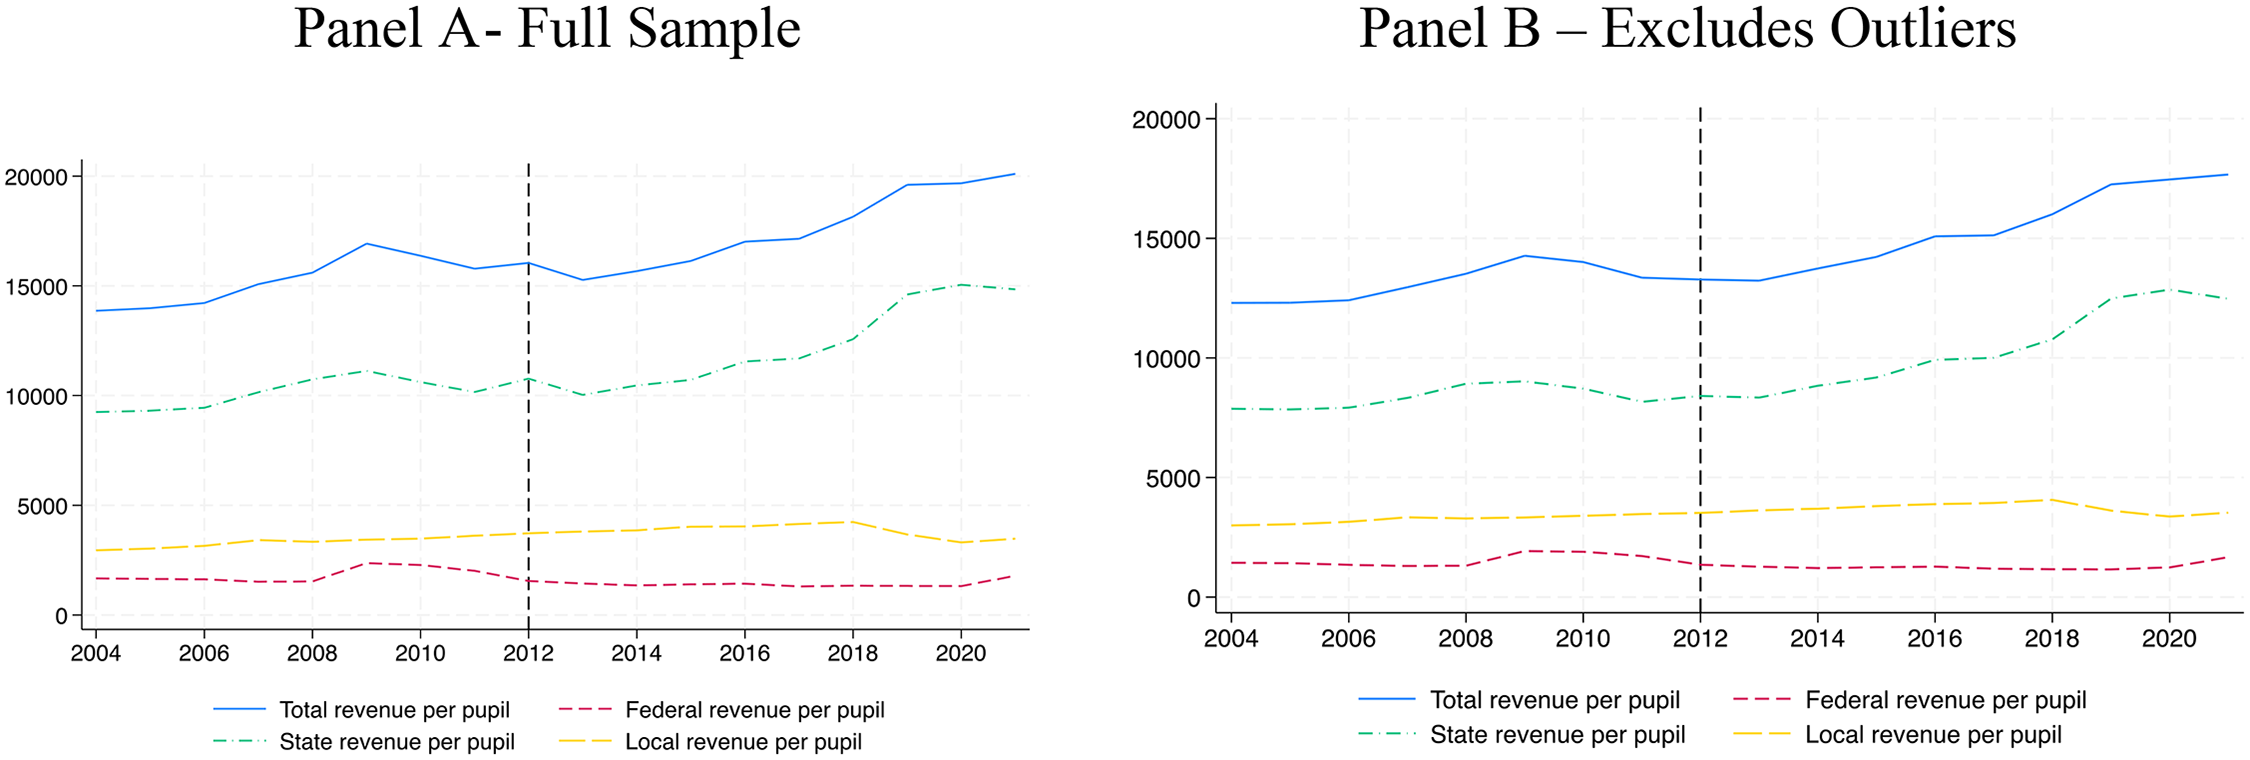
Next, we proceed to the analysis of total real revenues per pupil after grouping school districts into quartiles by their total per pupil revenues in 2004, the first year of observation. This way, we compare the relative changes in district resources for the bottom 25 percent, the middle 50 percent, and the top 25 percent of school districts. In Figure 2, we observe that all quartiles show upward growth. Differences in the average revenues by district quartile persist from 2004 to 2021. The McCleary reform does not appear to have prioritized an increase in the resources of property poor districts over the other districts. The preliminary analysis offers little evidence in support of H1.
Total Revenue per Pupil by Quartile, Real 2019 Dollars.
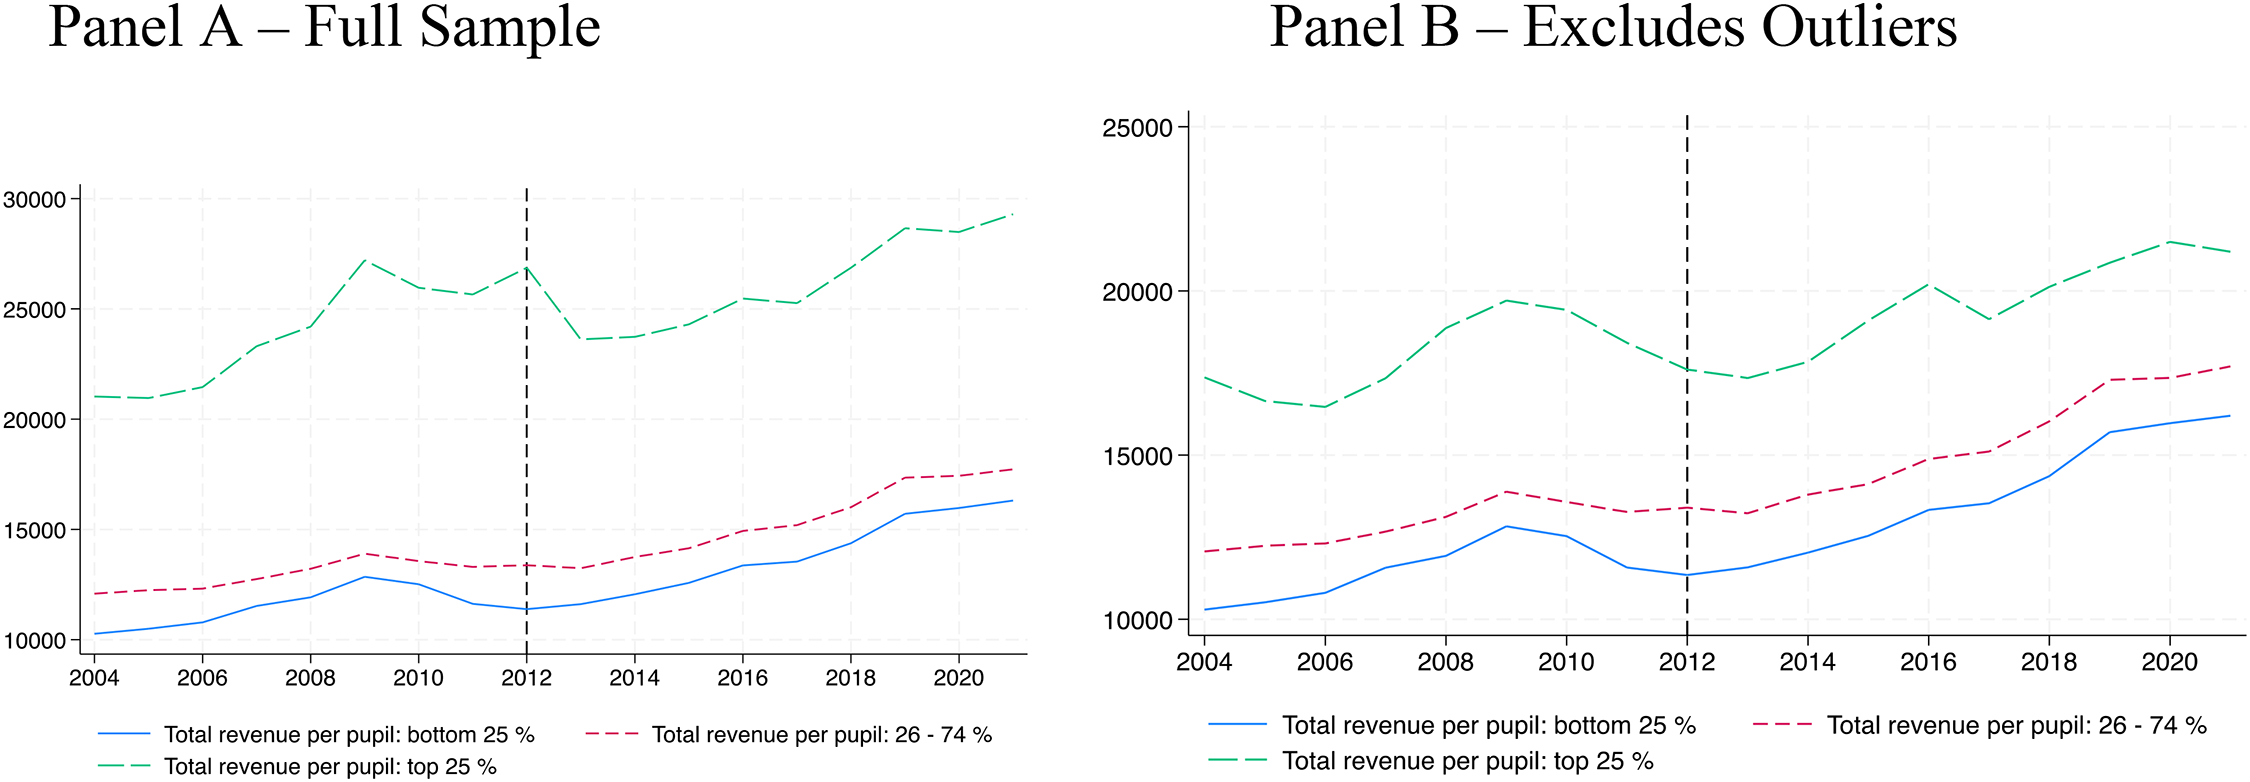
In Figure 3, we examine changes in the state share of revenues by quartile. In Panel A of Figure 3, small outlier districts with high per pupil revenues make an impression that state contributions to the revenues of high spending districts are disproportionately high. When we remove these outliers, a more intuitive pattern emerges, which is most pronounced in 2004: state aid is inversely related to overall revenues. Districts with lower total revenues per pupil receive higher levels of state support. These differences are pronounced before McCleary. We do observe a trend toward a convergence of the state funding share for the 75% of the school districts after the Great Recession of 2008 and before McCleary as well as a general upward trend in the share of state funding from an average of about 63 percent in 2012 to an average of about 73 percent in 2021. Descriptively, we find evidence in support of H2 for the state share increase across the board.
State aid Share in Total Revenue by Quartile, per Cent.
Finally, we look at the use of local revenues by quartile. According to Figure 4, from 2004 to 2012, miscellaneous local source revenues per pupil went up for all districts and were particularly high for the top quartile. Between 2012 and 2018, local revenues continued to increase. After 2018, when HB 2242 effectively went into effect to restrict new levies, local revenues per pupil dropped precipitously. This preliminary analysis partially supports H3: the McCleary legislation reduced local revenue generation at higher rates over time in more affluent districts. In all the other school districts, it also depressed local levy receipts.
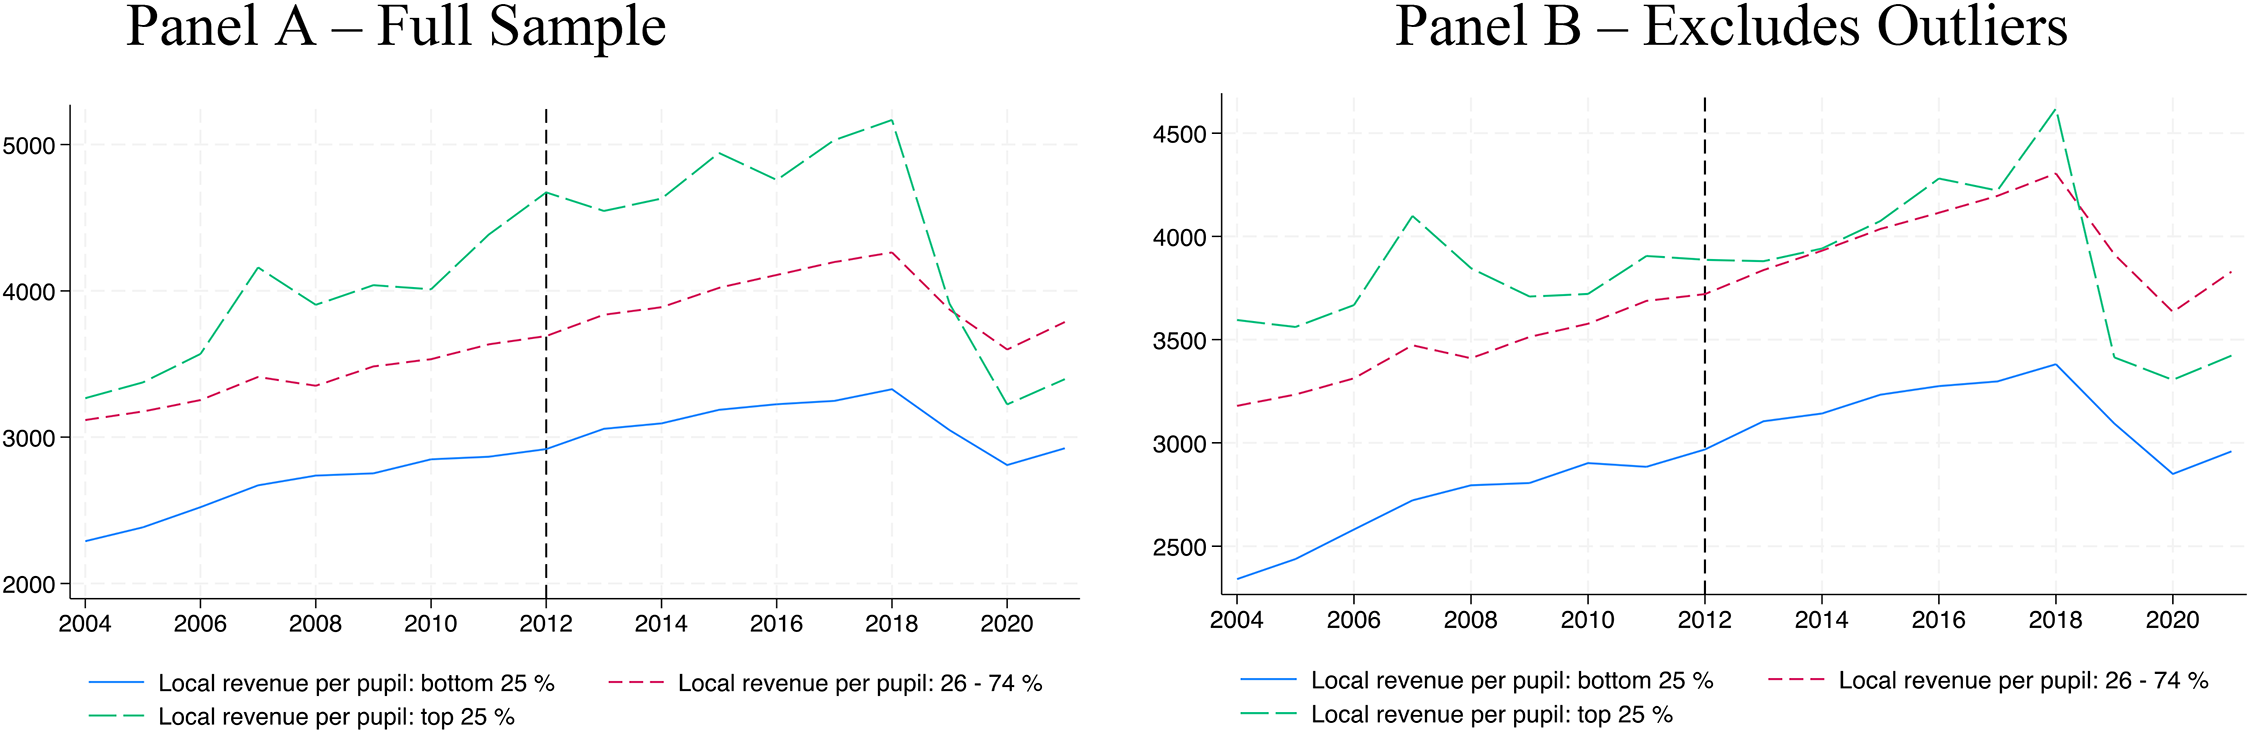
Local Revenue per Pupil by Quartile, Real 2019 Dollars.
Regression Analysis
Next, we document statistically significant effects of the McCleary reform on school district revenues. Specifically, the difference-in-differences (DID) regression models test how the McCleary reform changed absolute dollar funding for the disadvantaged districts (H1), state support for all districts (H2), and local revenue use by affluent districts (H3).
To test the hypotheses, we examine the following general model:
Our H1 focuses on the first quartile (bottom 25%) of school districts, H2 – on all districts, and H3 - on the last quartile (top 25%). For all three hypotheses, we present models by contrasting Q1 with the other districts. First, we show Q1 versus Q 2, 3, 4 taken together and then separately Q1 versus Q2, 3 and versus Q4. The two middle quartiles are combined into one group to facilitate the presentation and visualization of results. The results of DID models include an F-test for parallel trends and are presented in Table 2.
Difference-in-Differences Estimates of the McCleary Effects on the First Quartile of School Districts (Bottom 25%), Relative to the Other Quartiles.
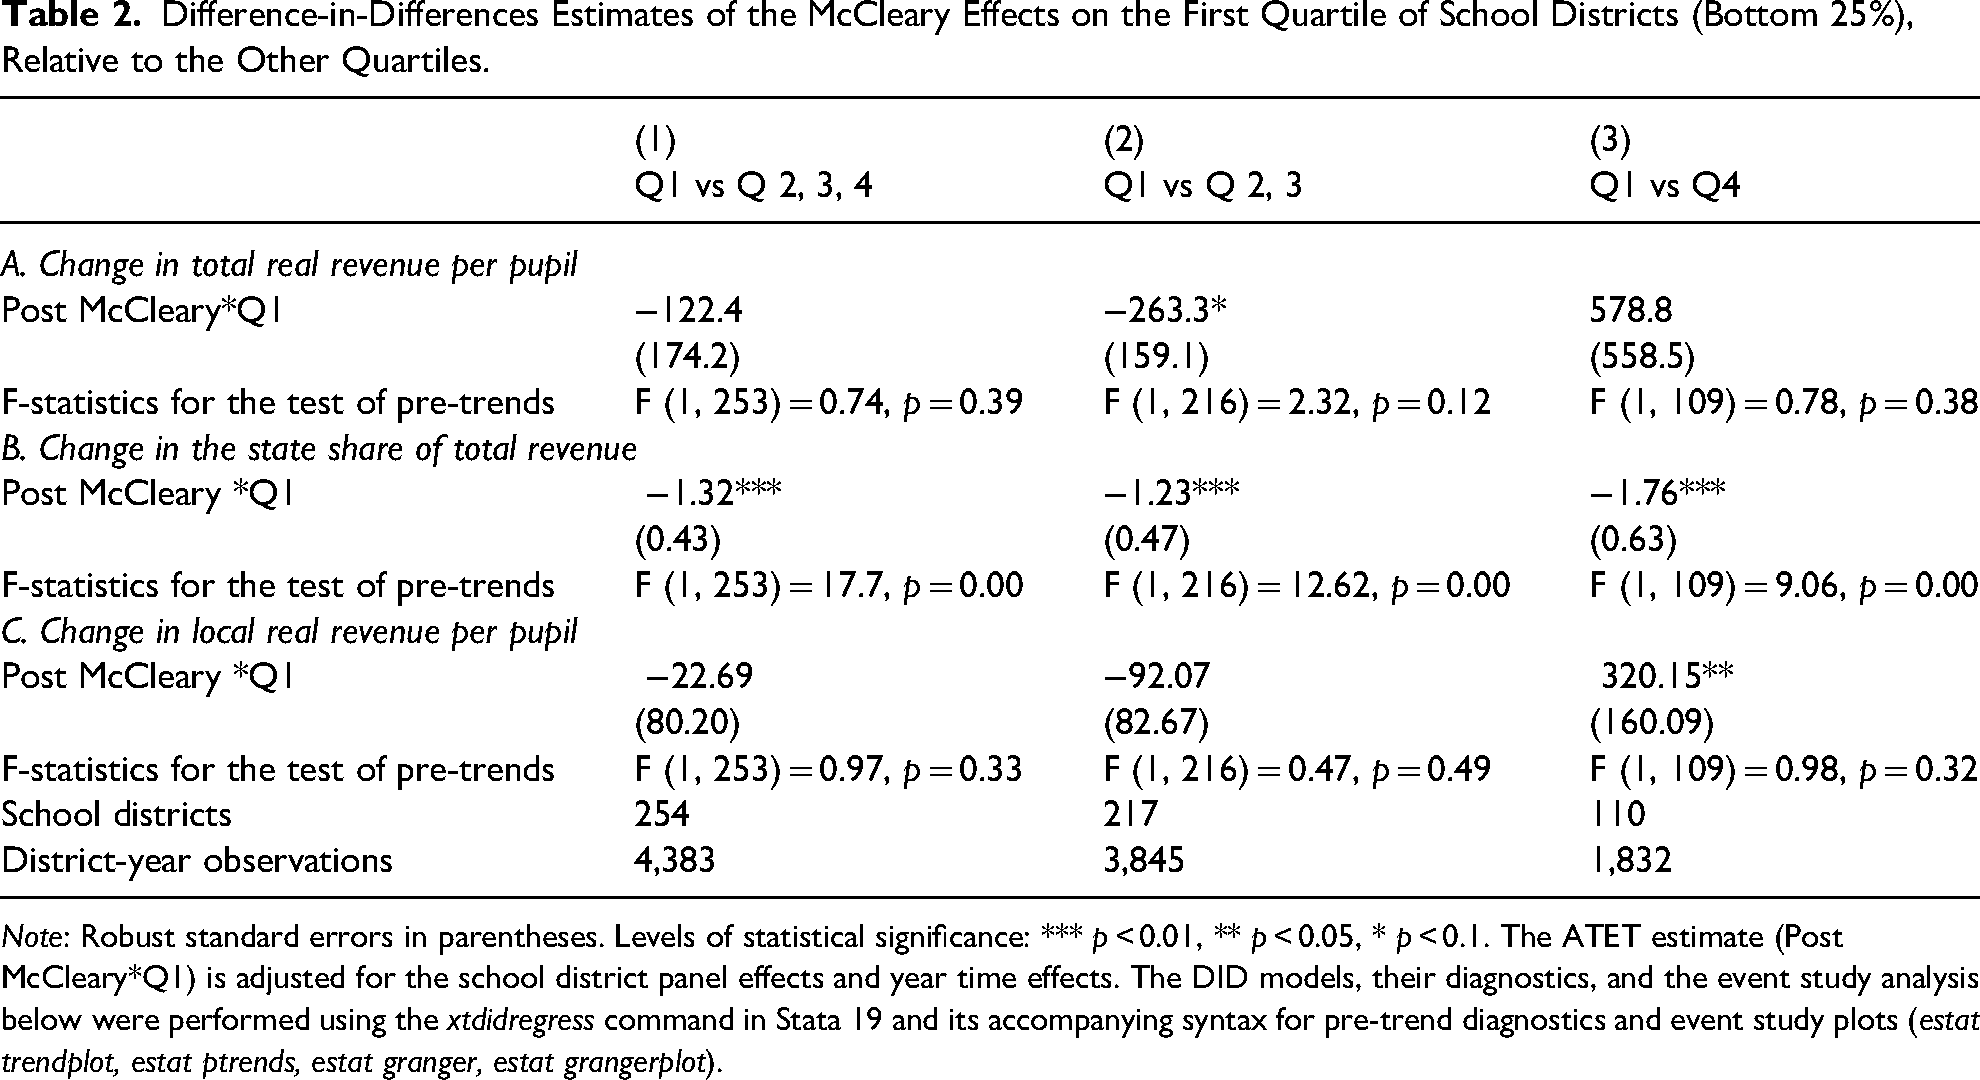
Note: Robust standard errors in parentheses. Levels of statistical significance: *** p < 0.01, ** p < 0.05, * p < 0.1. The ATET estimate (Post McCleary*Q1) is adjusted for the school district panel effects and year time effects. The DID models, their diagnostics, and the event study analysis below were performed using the xtdidregress command in Stata 19 and its accompanying syntax for pre-trend diagnostics and event study plots (estat trendplot, estat ptrends, estat granger, estat grangerplot).
Table 2 is followed by diagnostics charts in Figure 5 and event study models in Figures 6–8. As the equation below shows, the event-study models provide estimates of the “treatment” effects on the outcomes by year rather than averaging them over the treatment period.
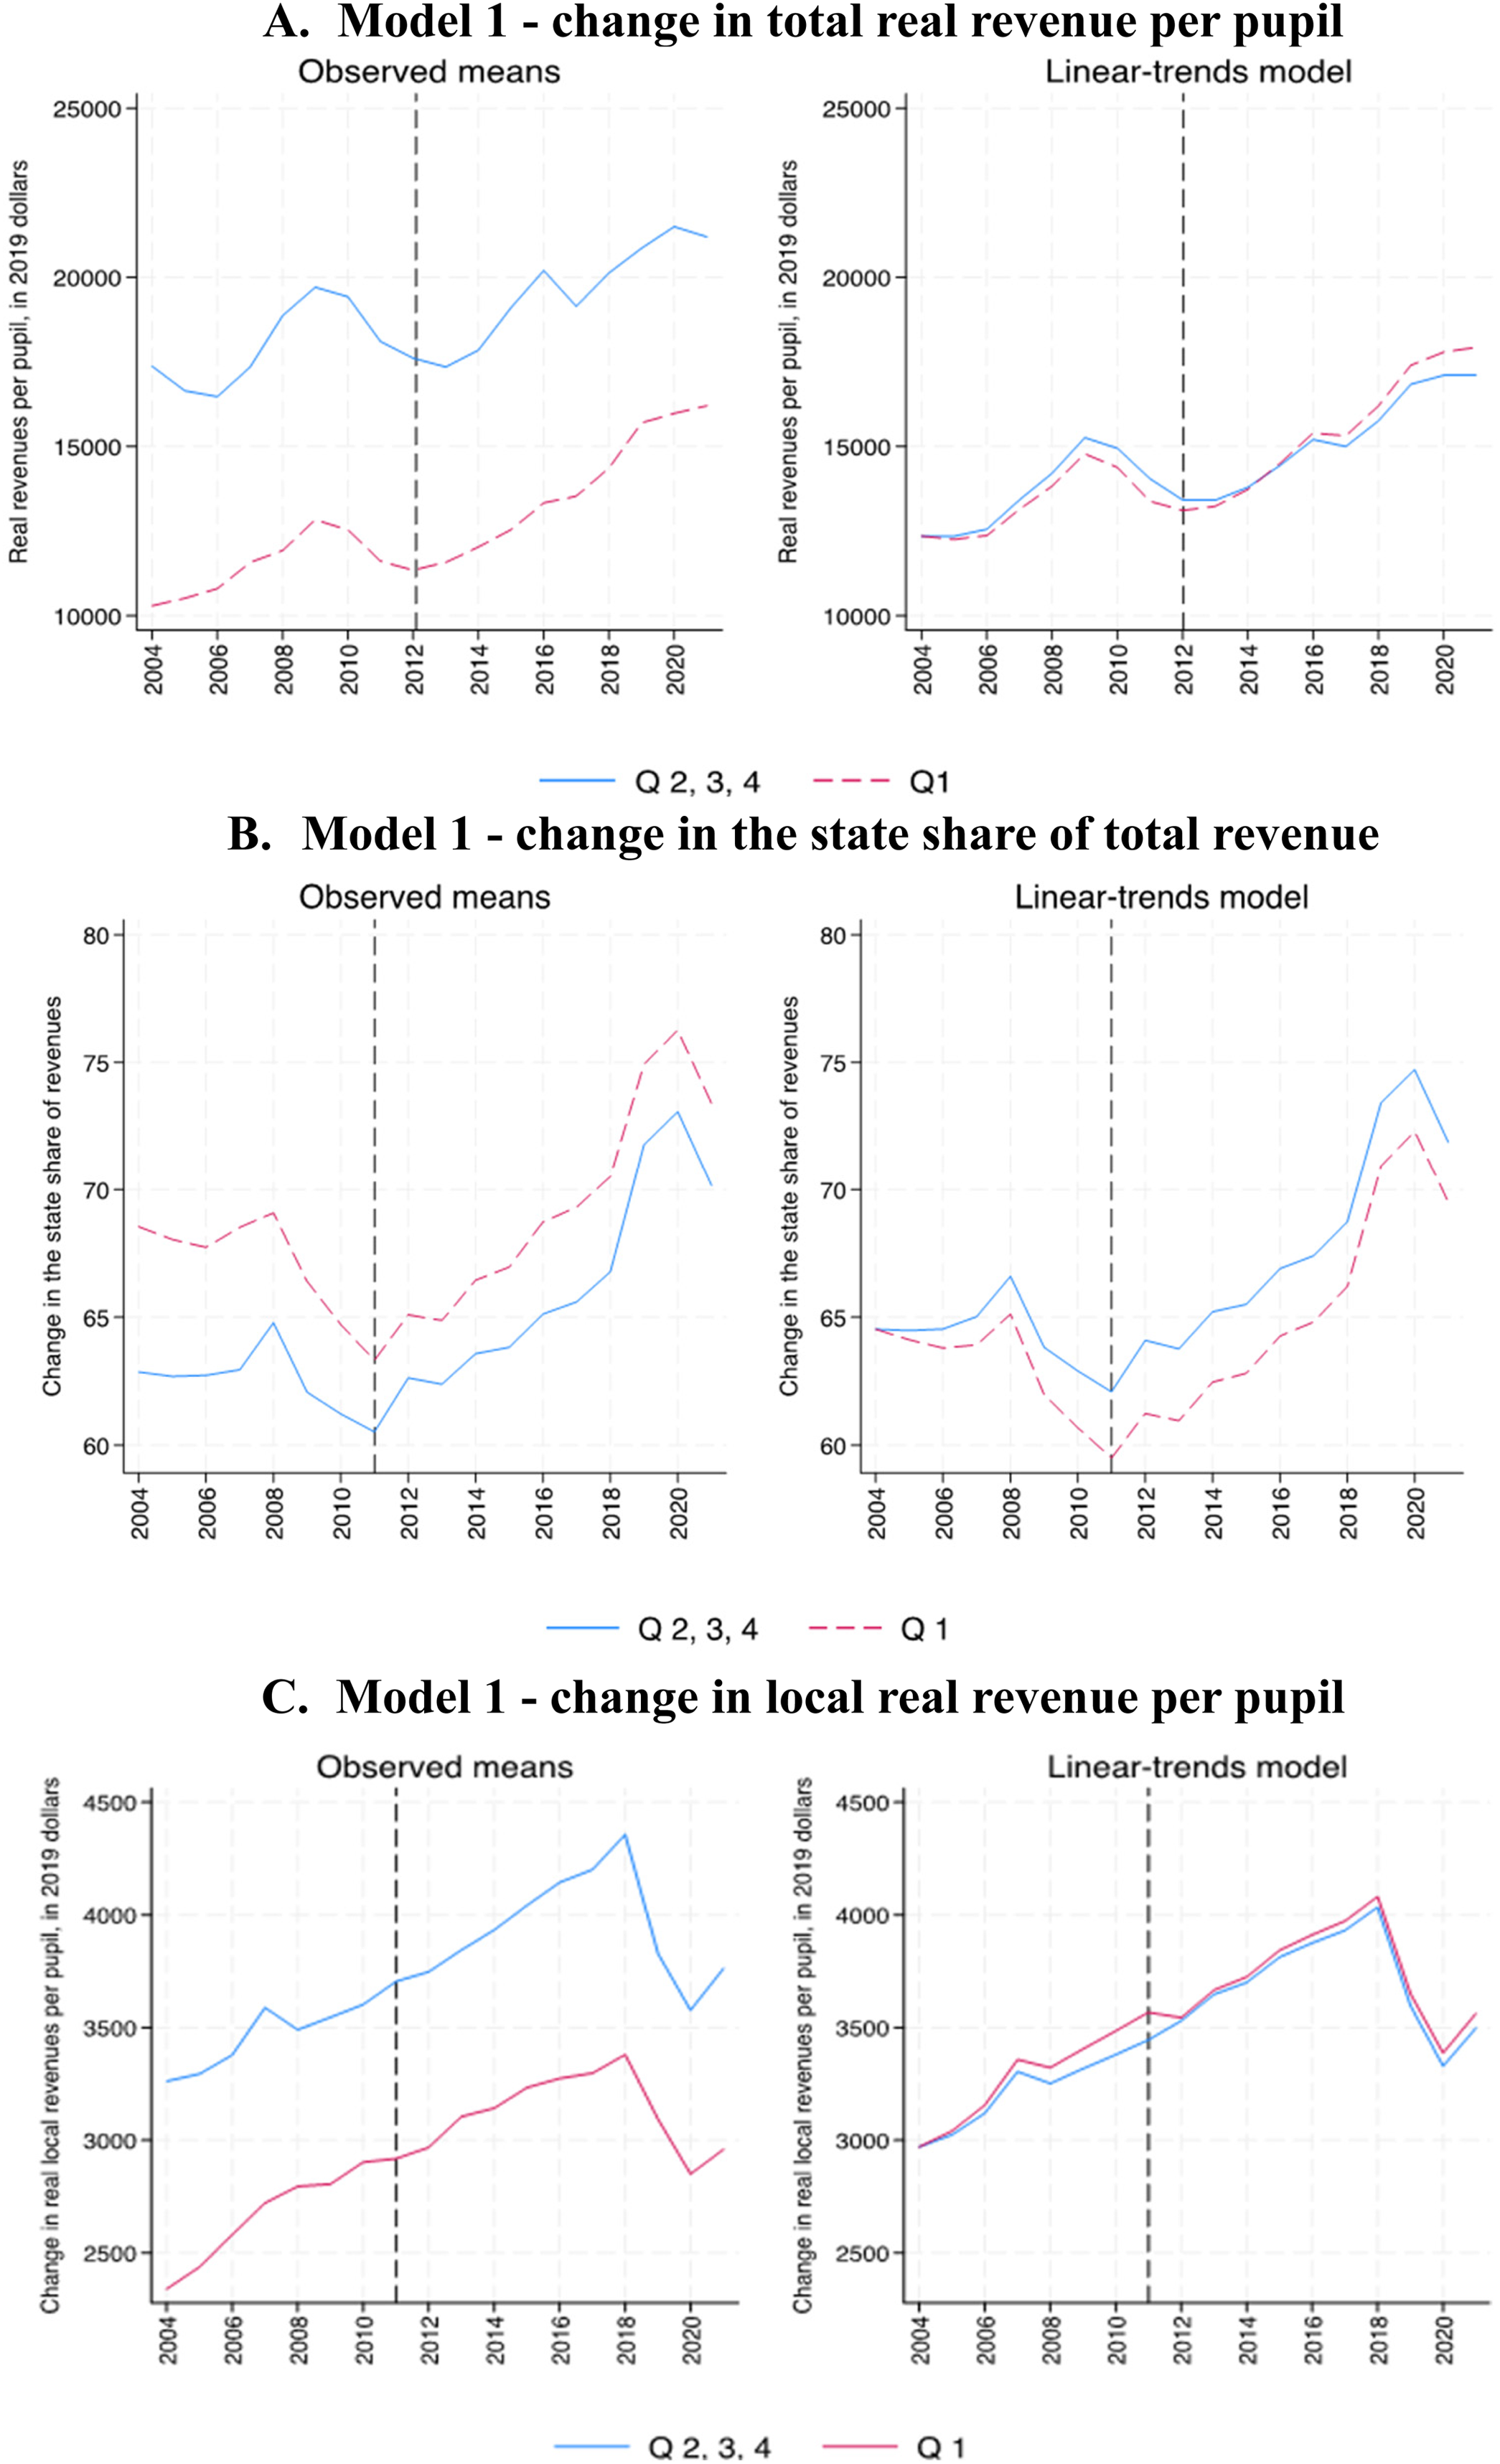
Graphical Diagnostics for the Difference-in-Differences Models (1) in Table 2.
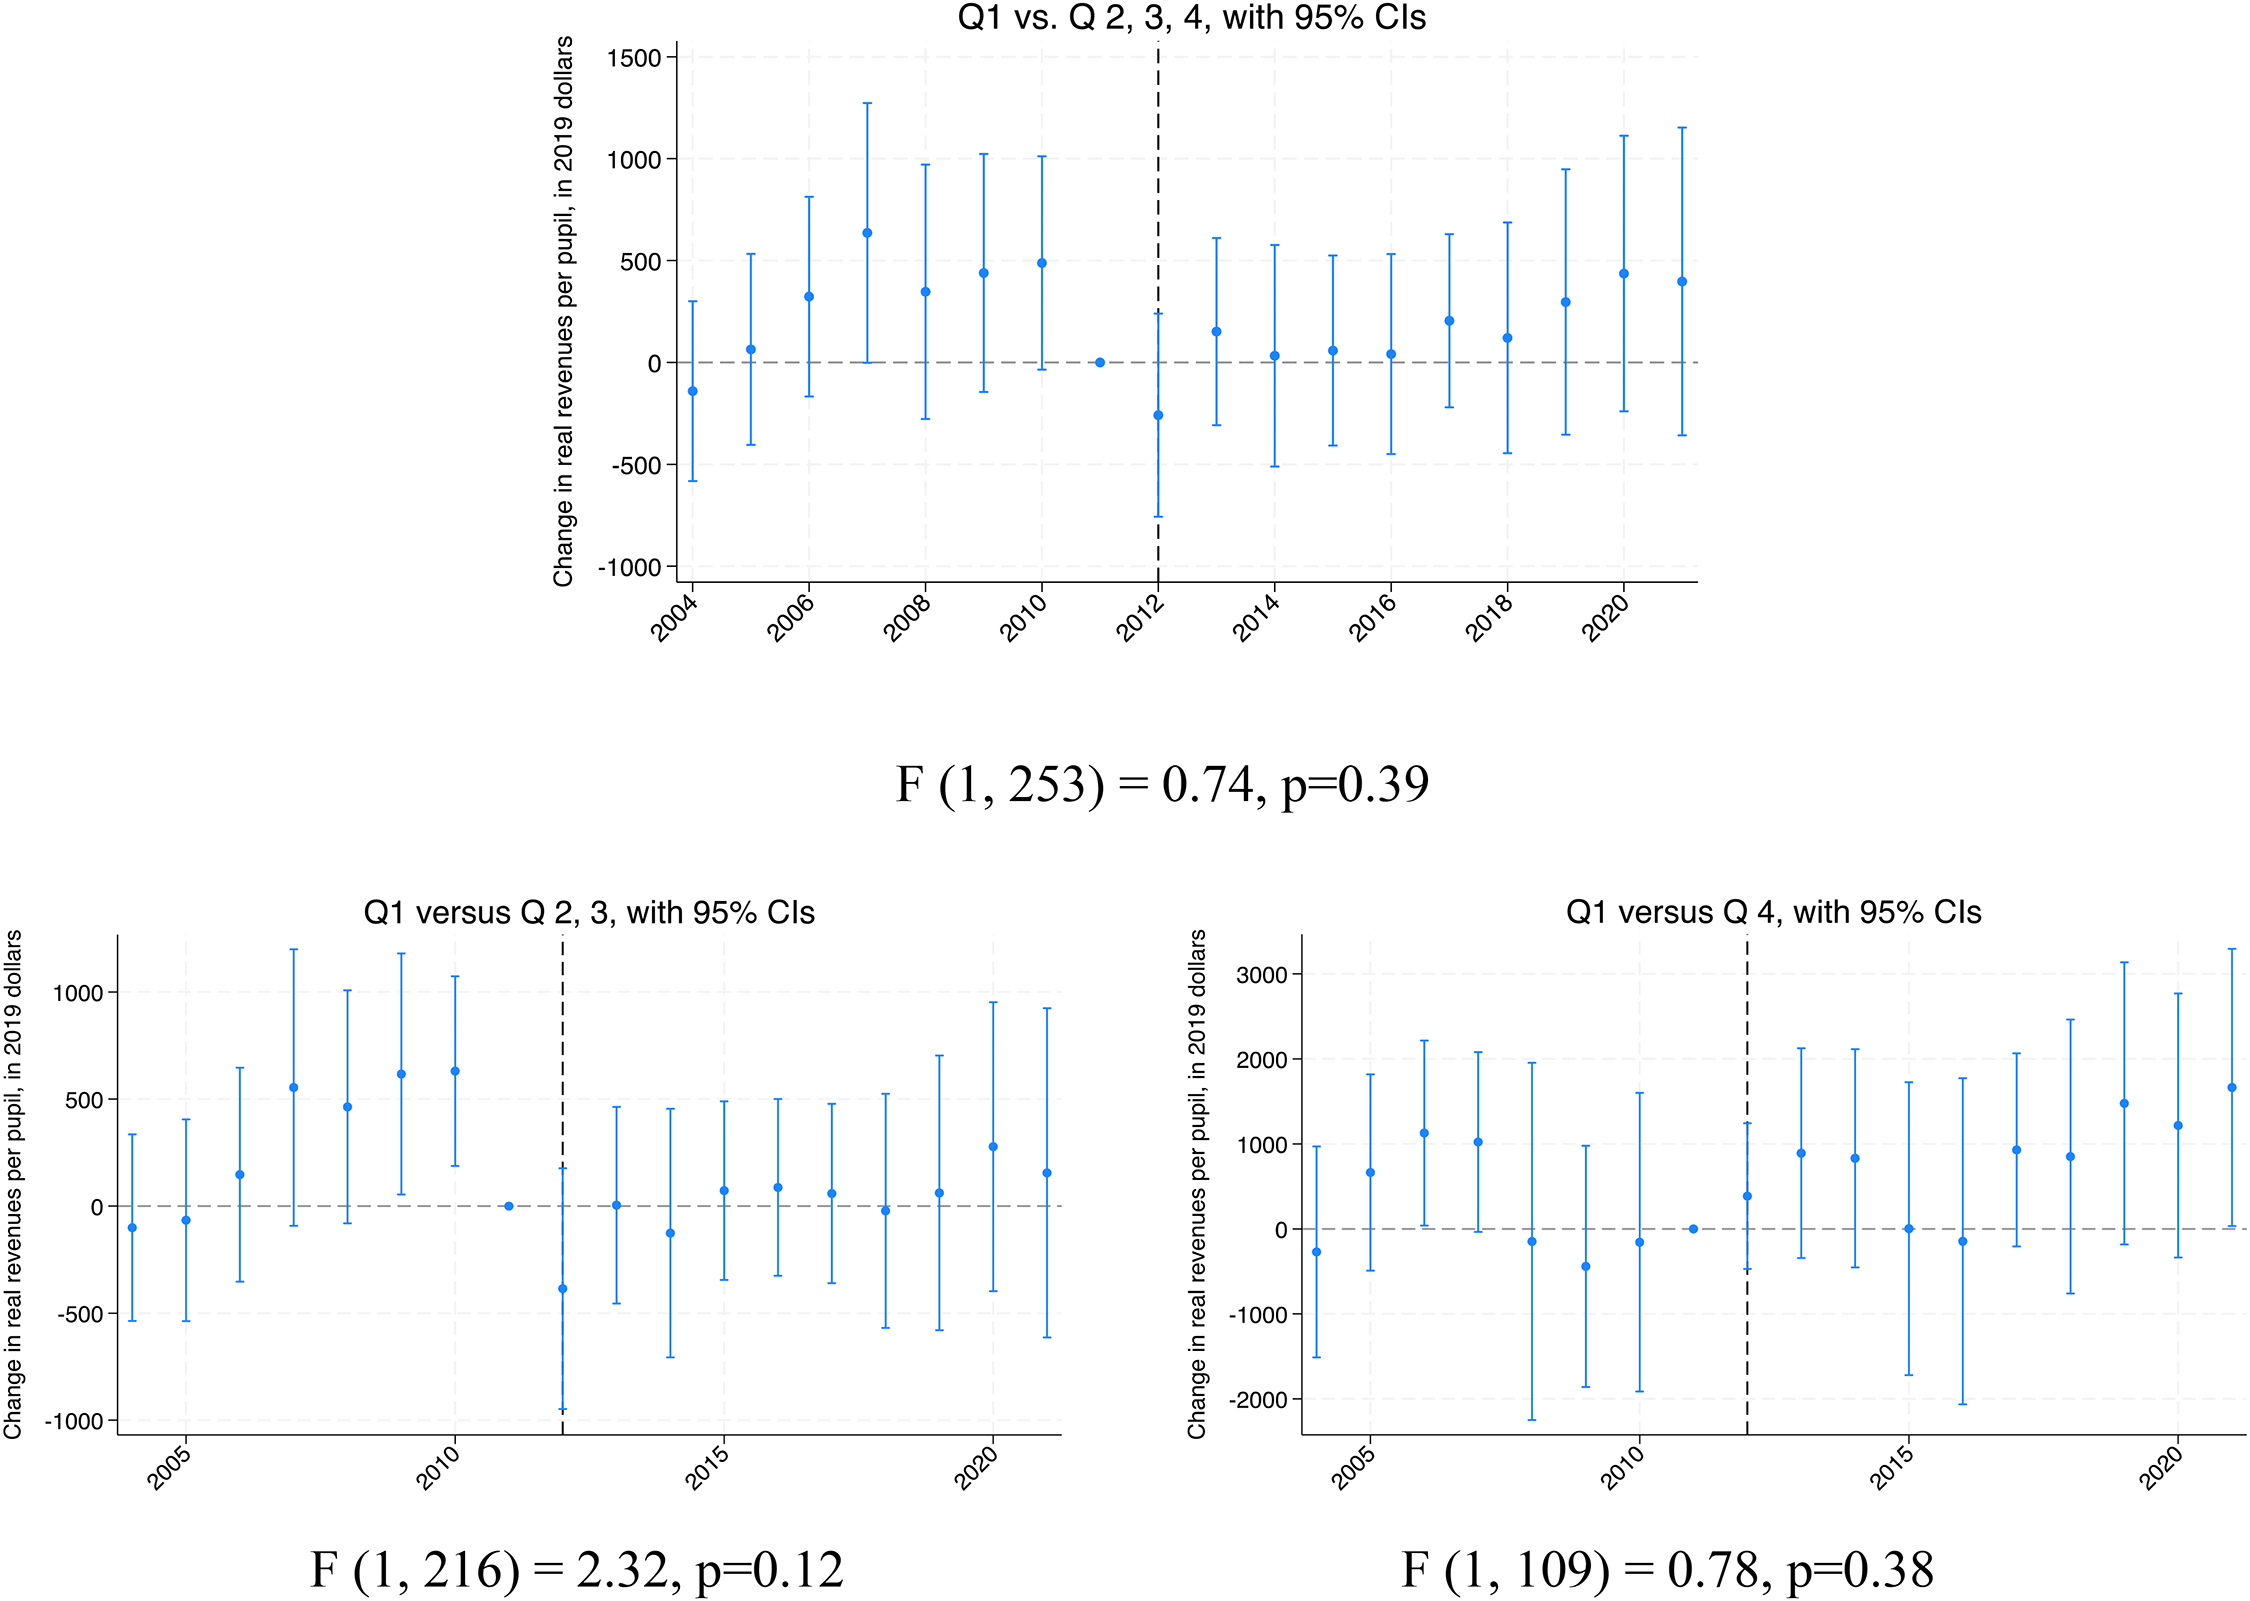
Event Study Plots for the Estimated Changes in Real Revenue per Pupil by Year for the First Quartile (Bottom 25 Percent) of School Districts Relative to the Other Districts.
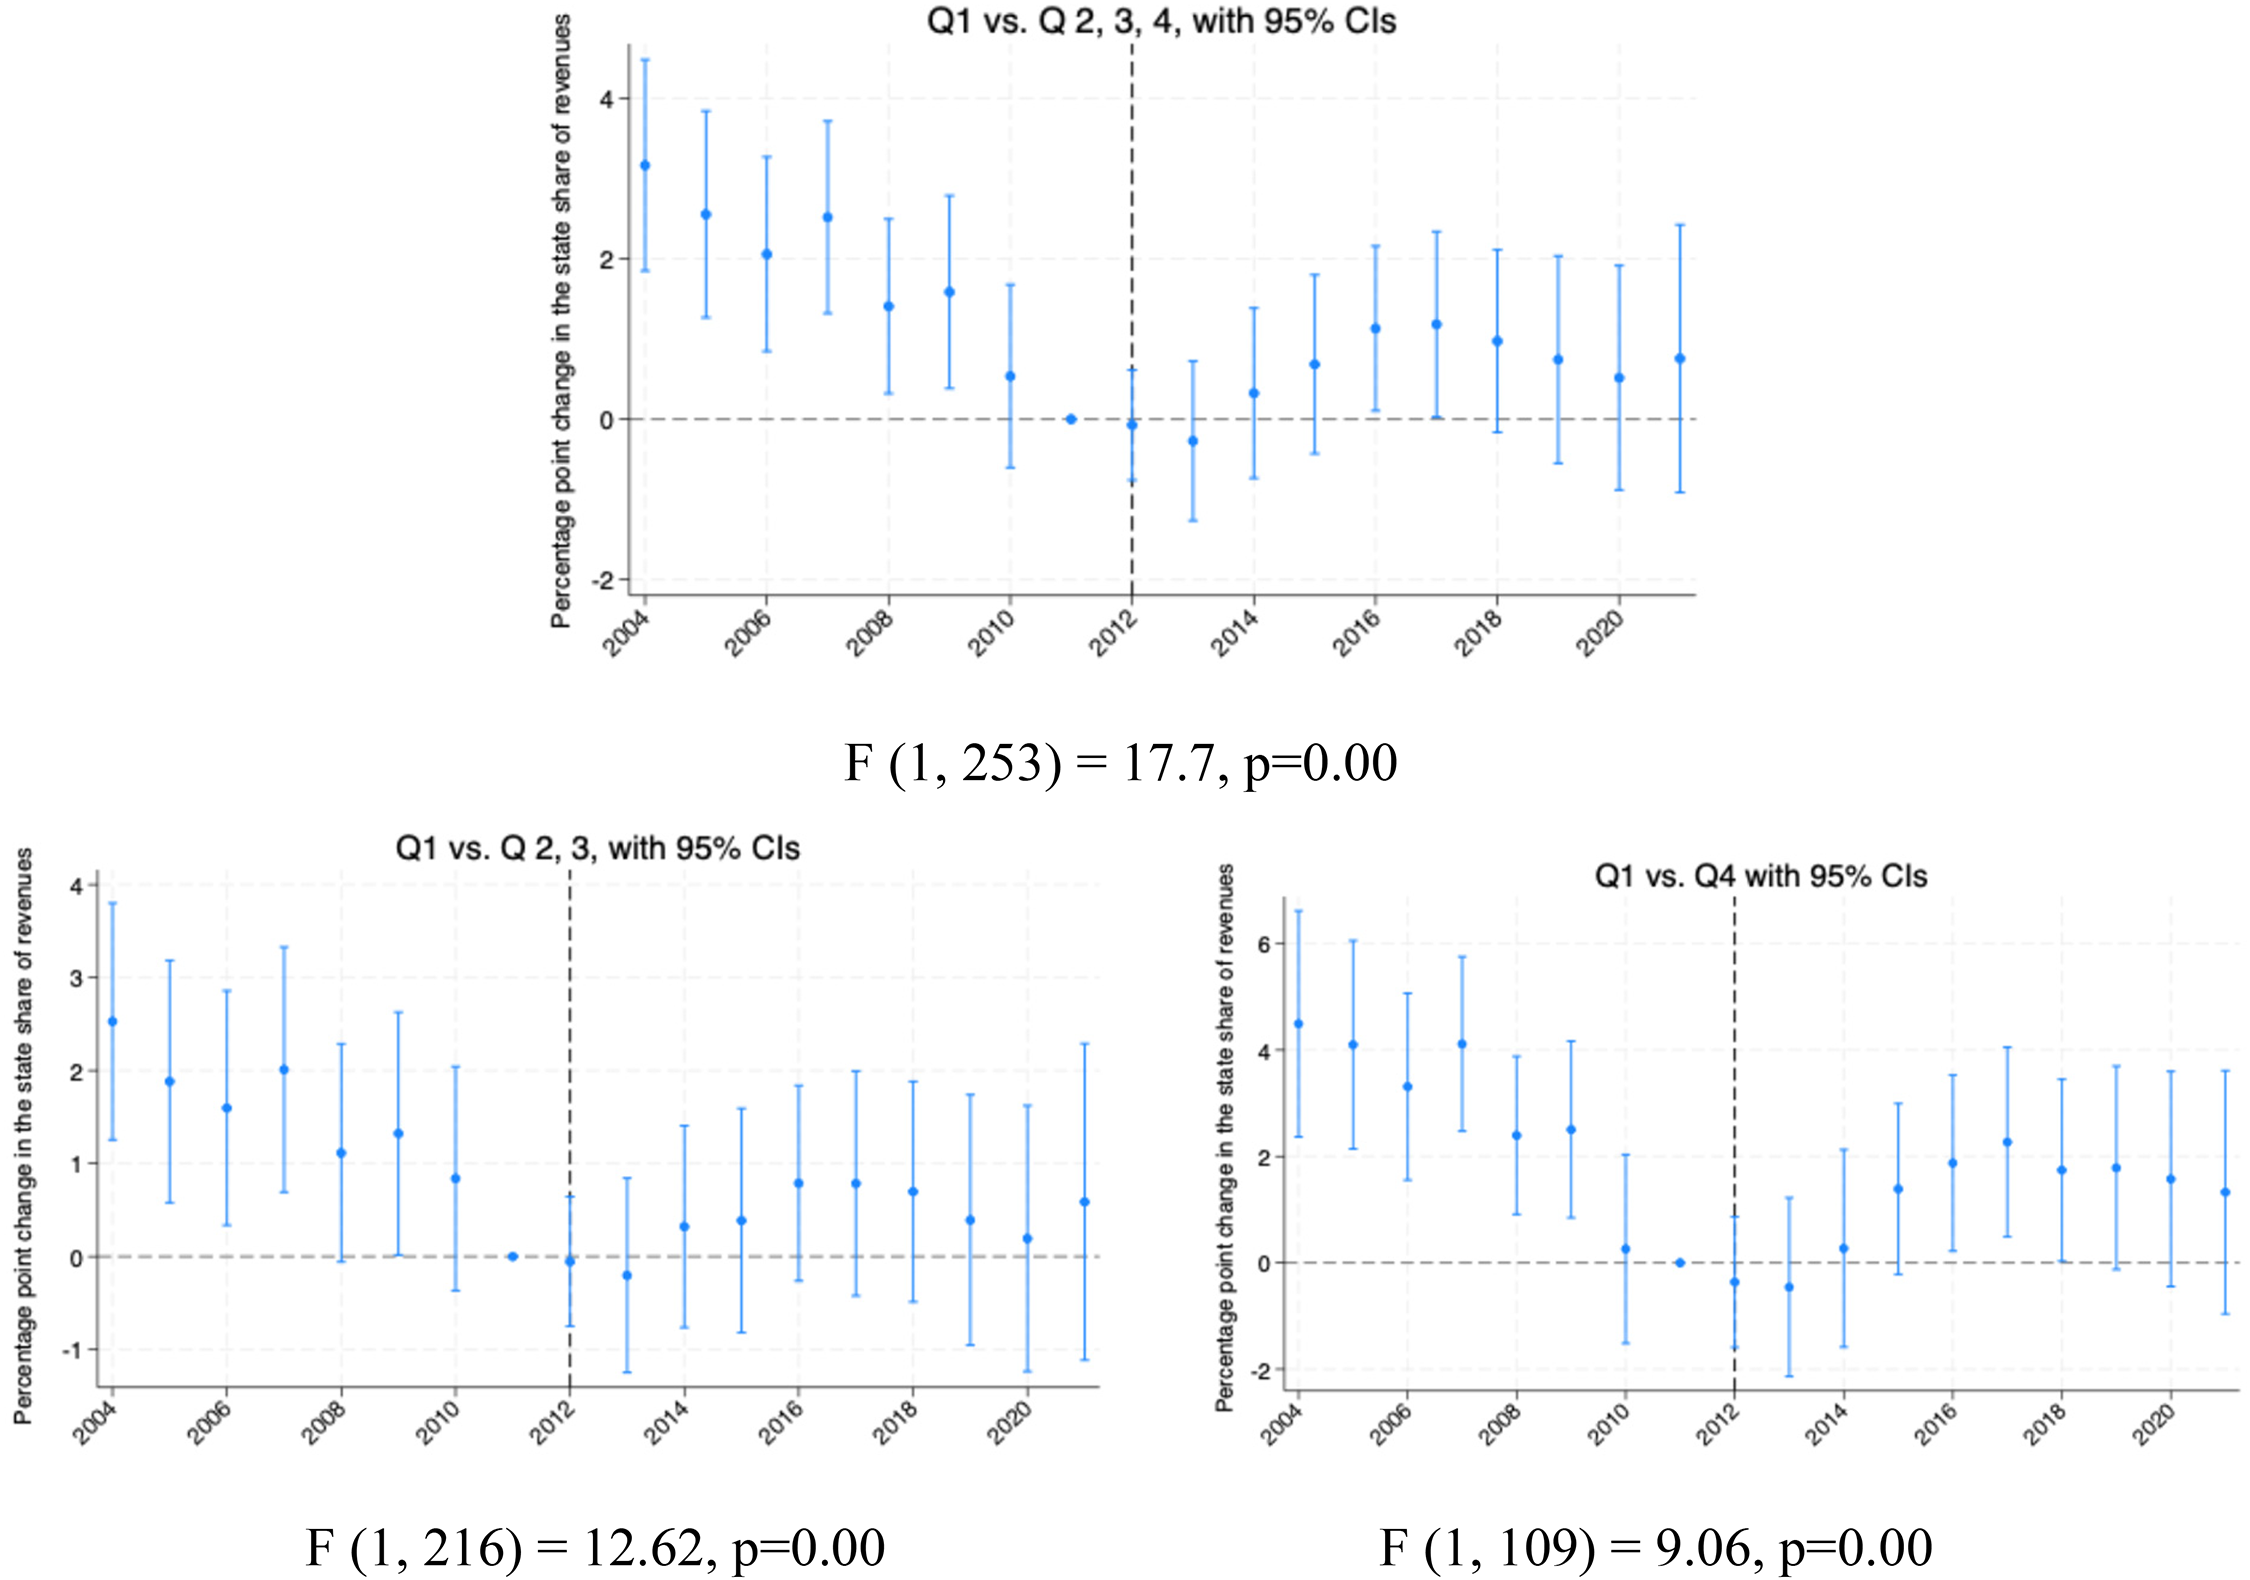
Event Study Plots for the Estimated Changes in the State Share of Revenues by Year for the First Quartile (Bottom 25 Percent) of School Districts Relative to the Other Districts.
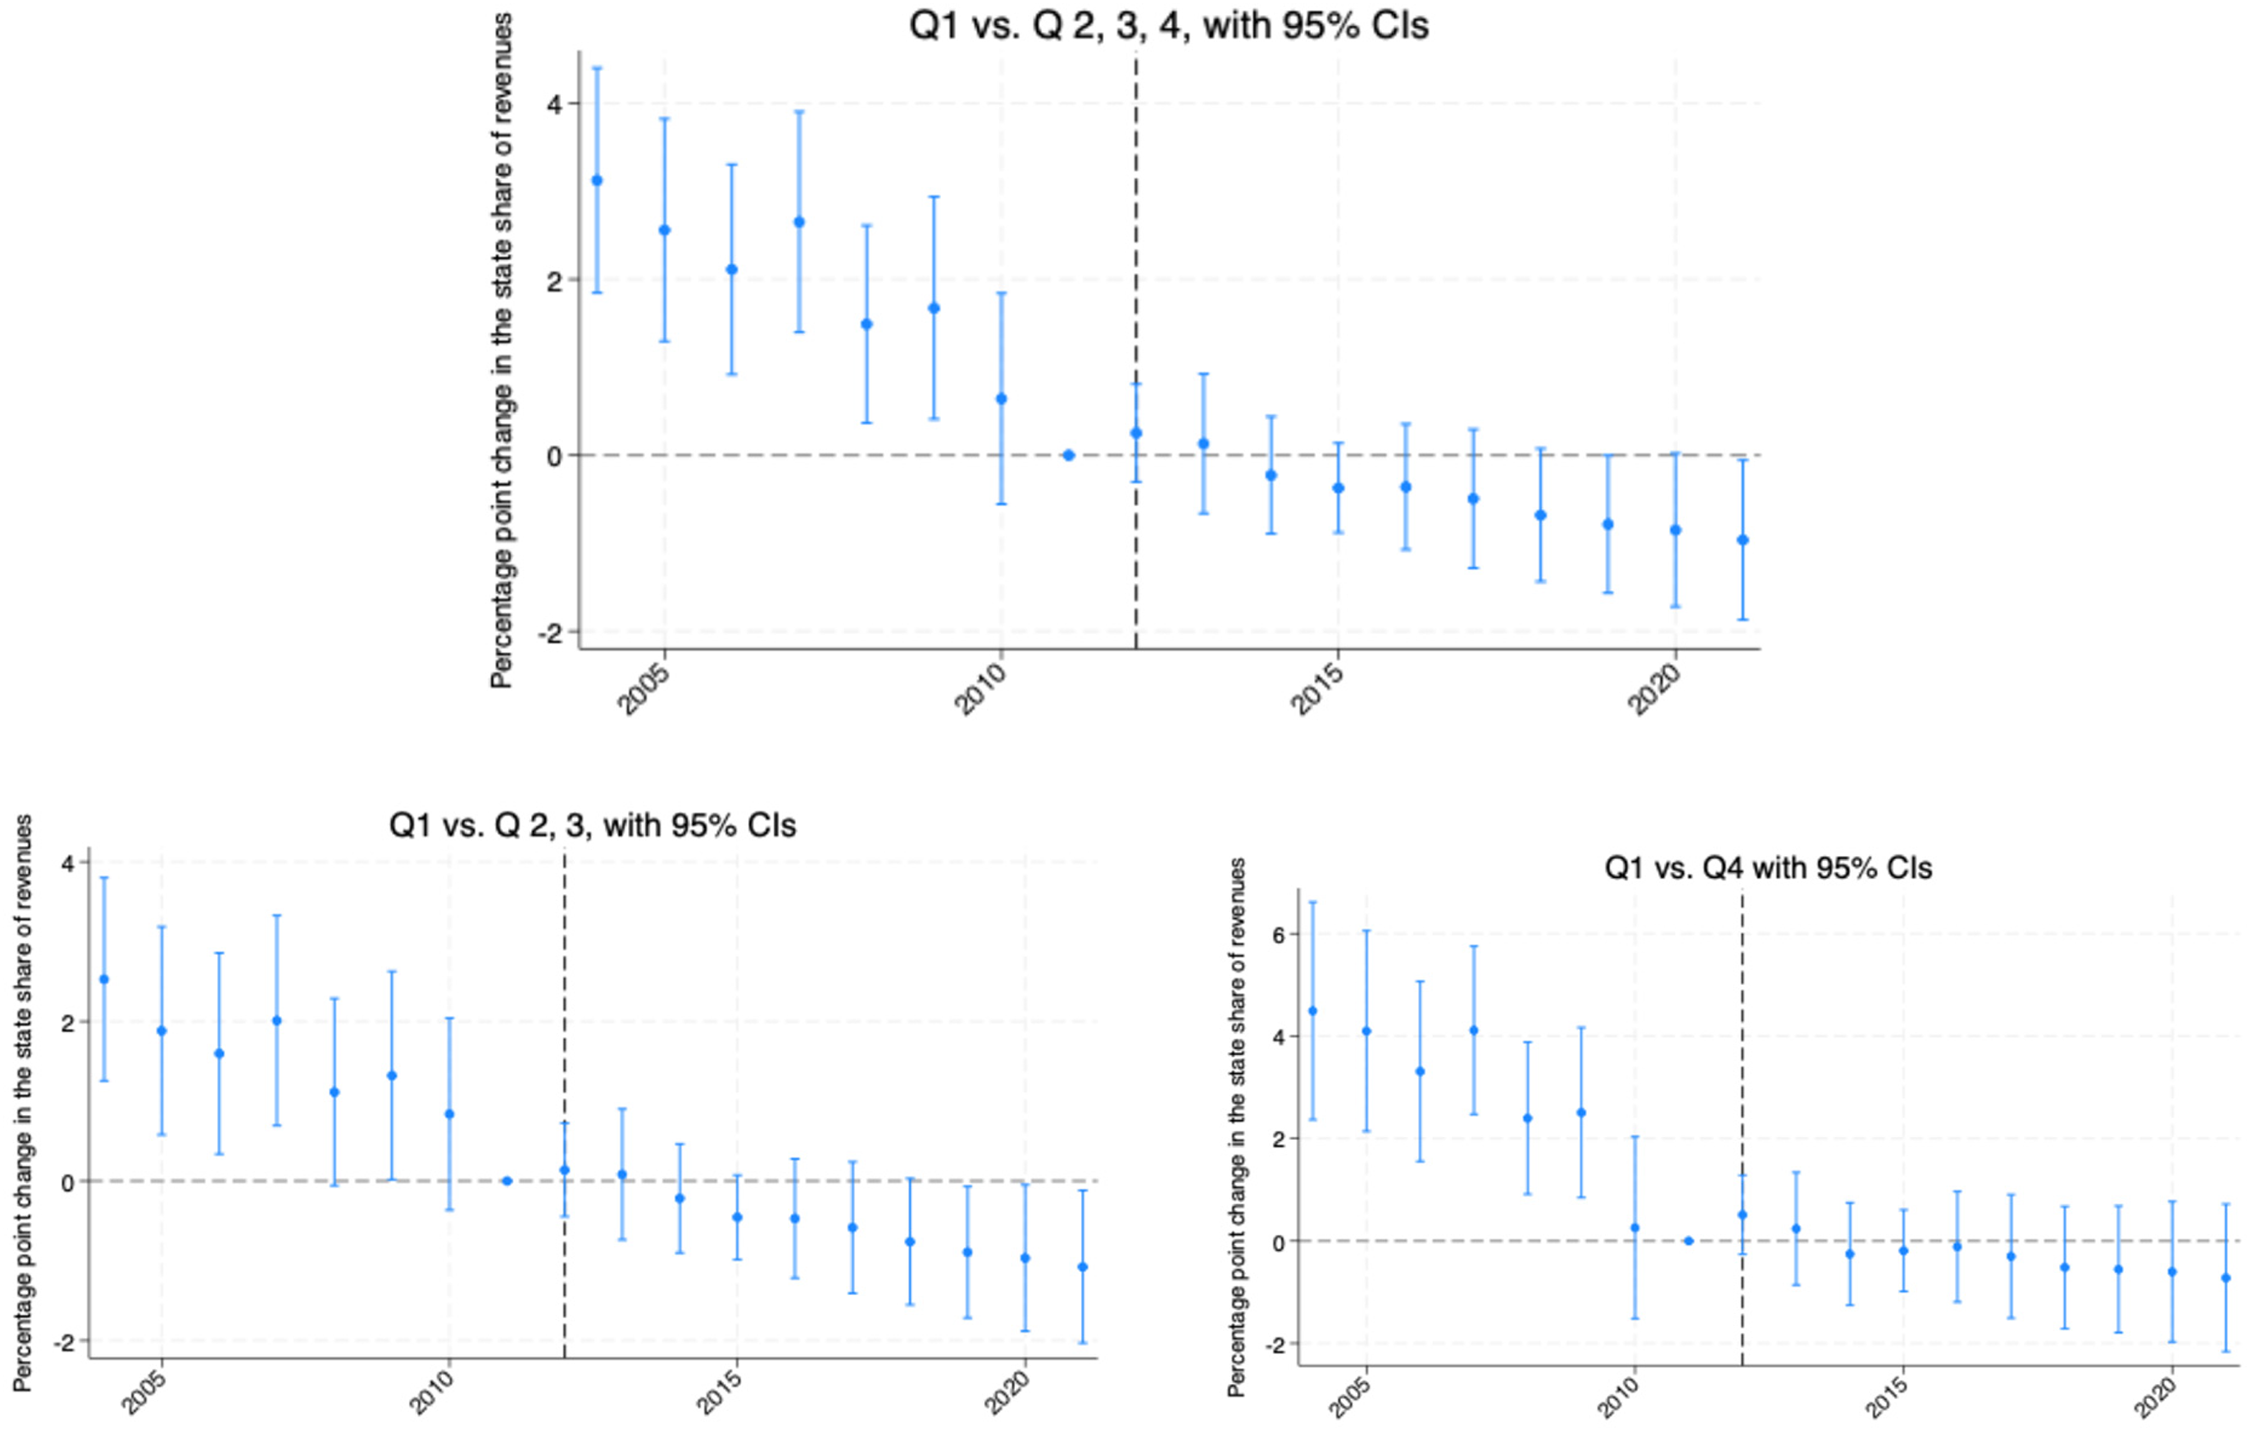
Sensitivity Analysis: Counterfactual Event Study Plots and DID Coefficients Assuming That the Negative Linear Trend in State aid Continued After 2011 in the Absence of McCleary. the Linear Trend in State aid is Predicted Using a Linear ARIMA Model with 6 Lags (regress stsh L(1/6).stsh).
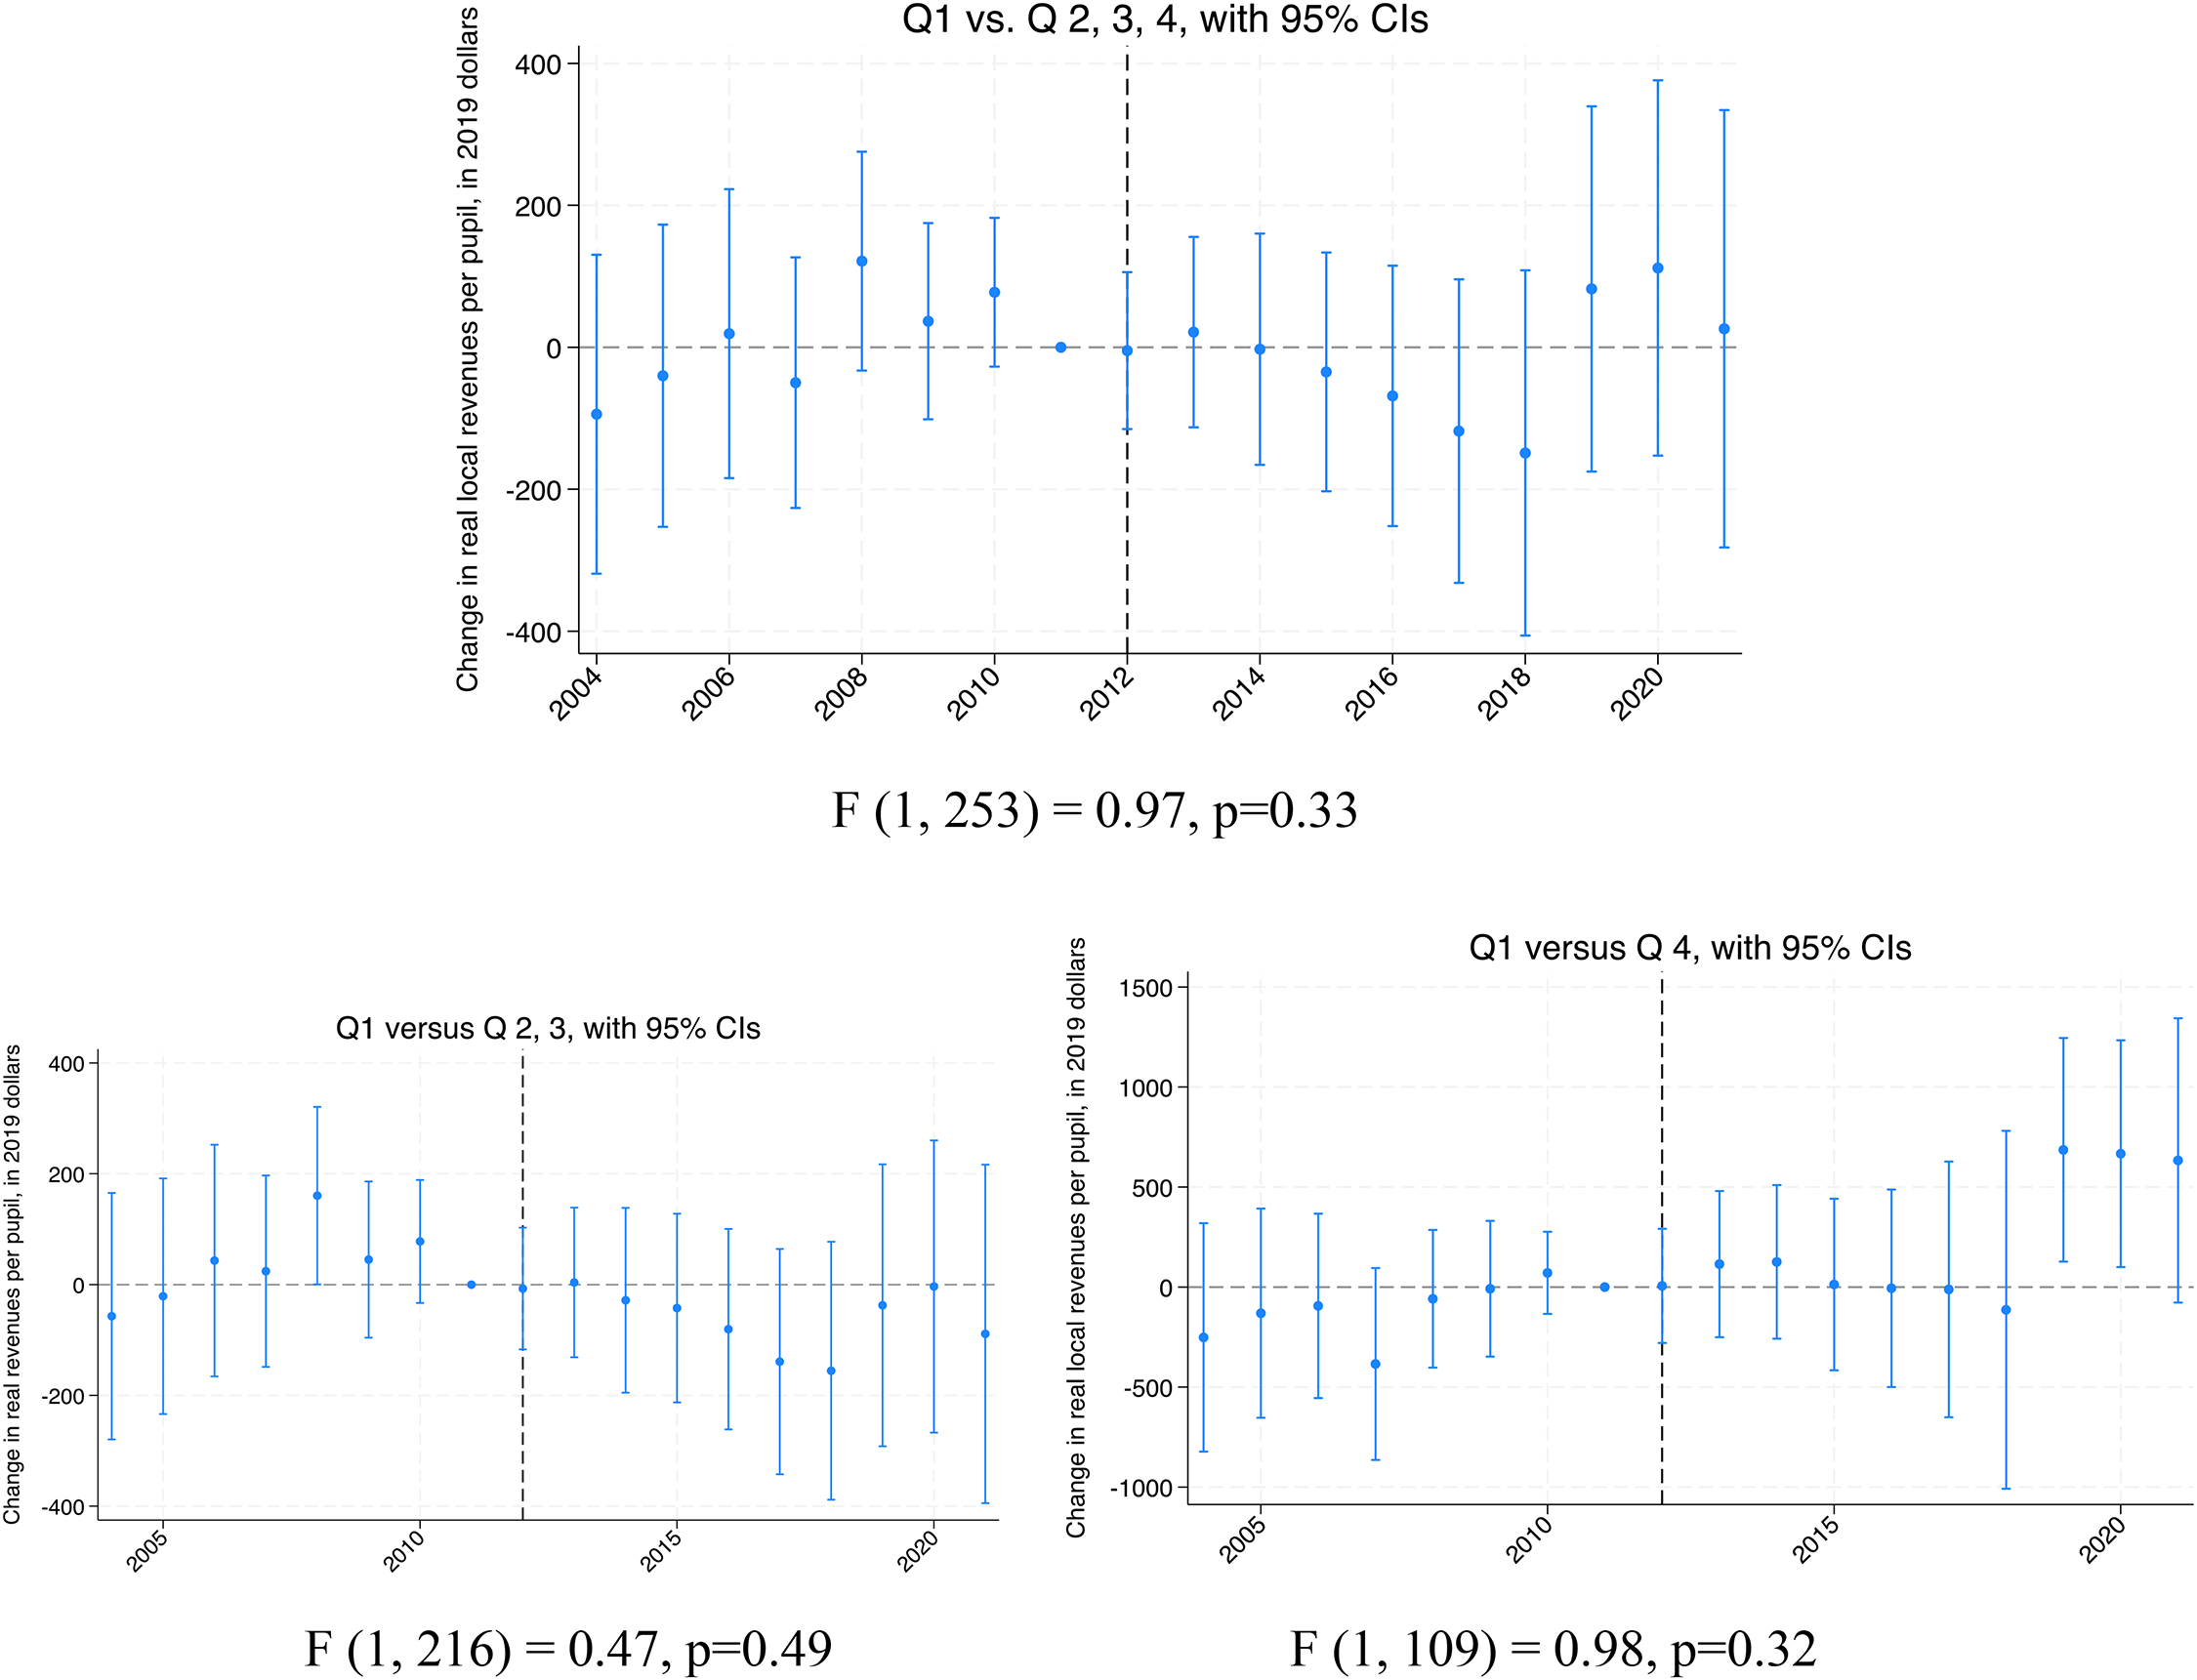
Event Study Plots for the Estimated Changes in the State Share of Local Revenues by Year, for the First Quartile (Bottom 25 Percent) of School Districts Relative to the Other Districts.
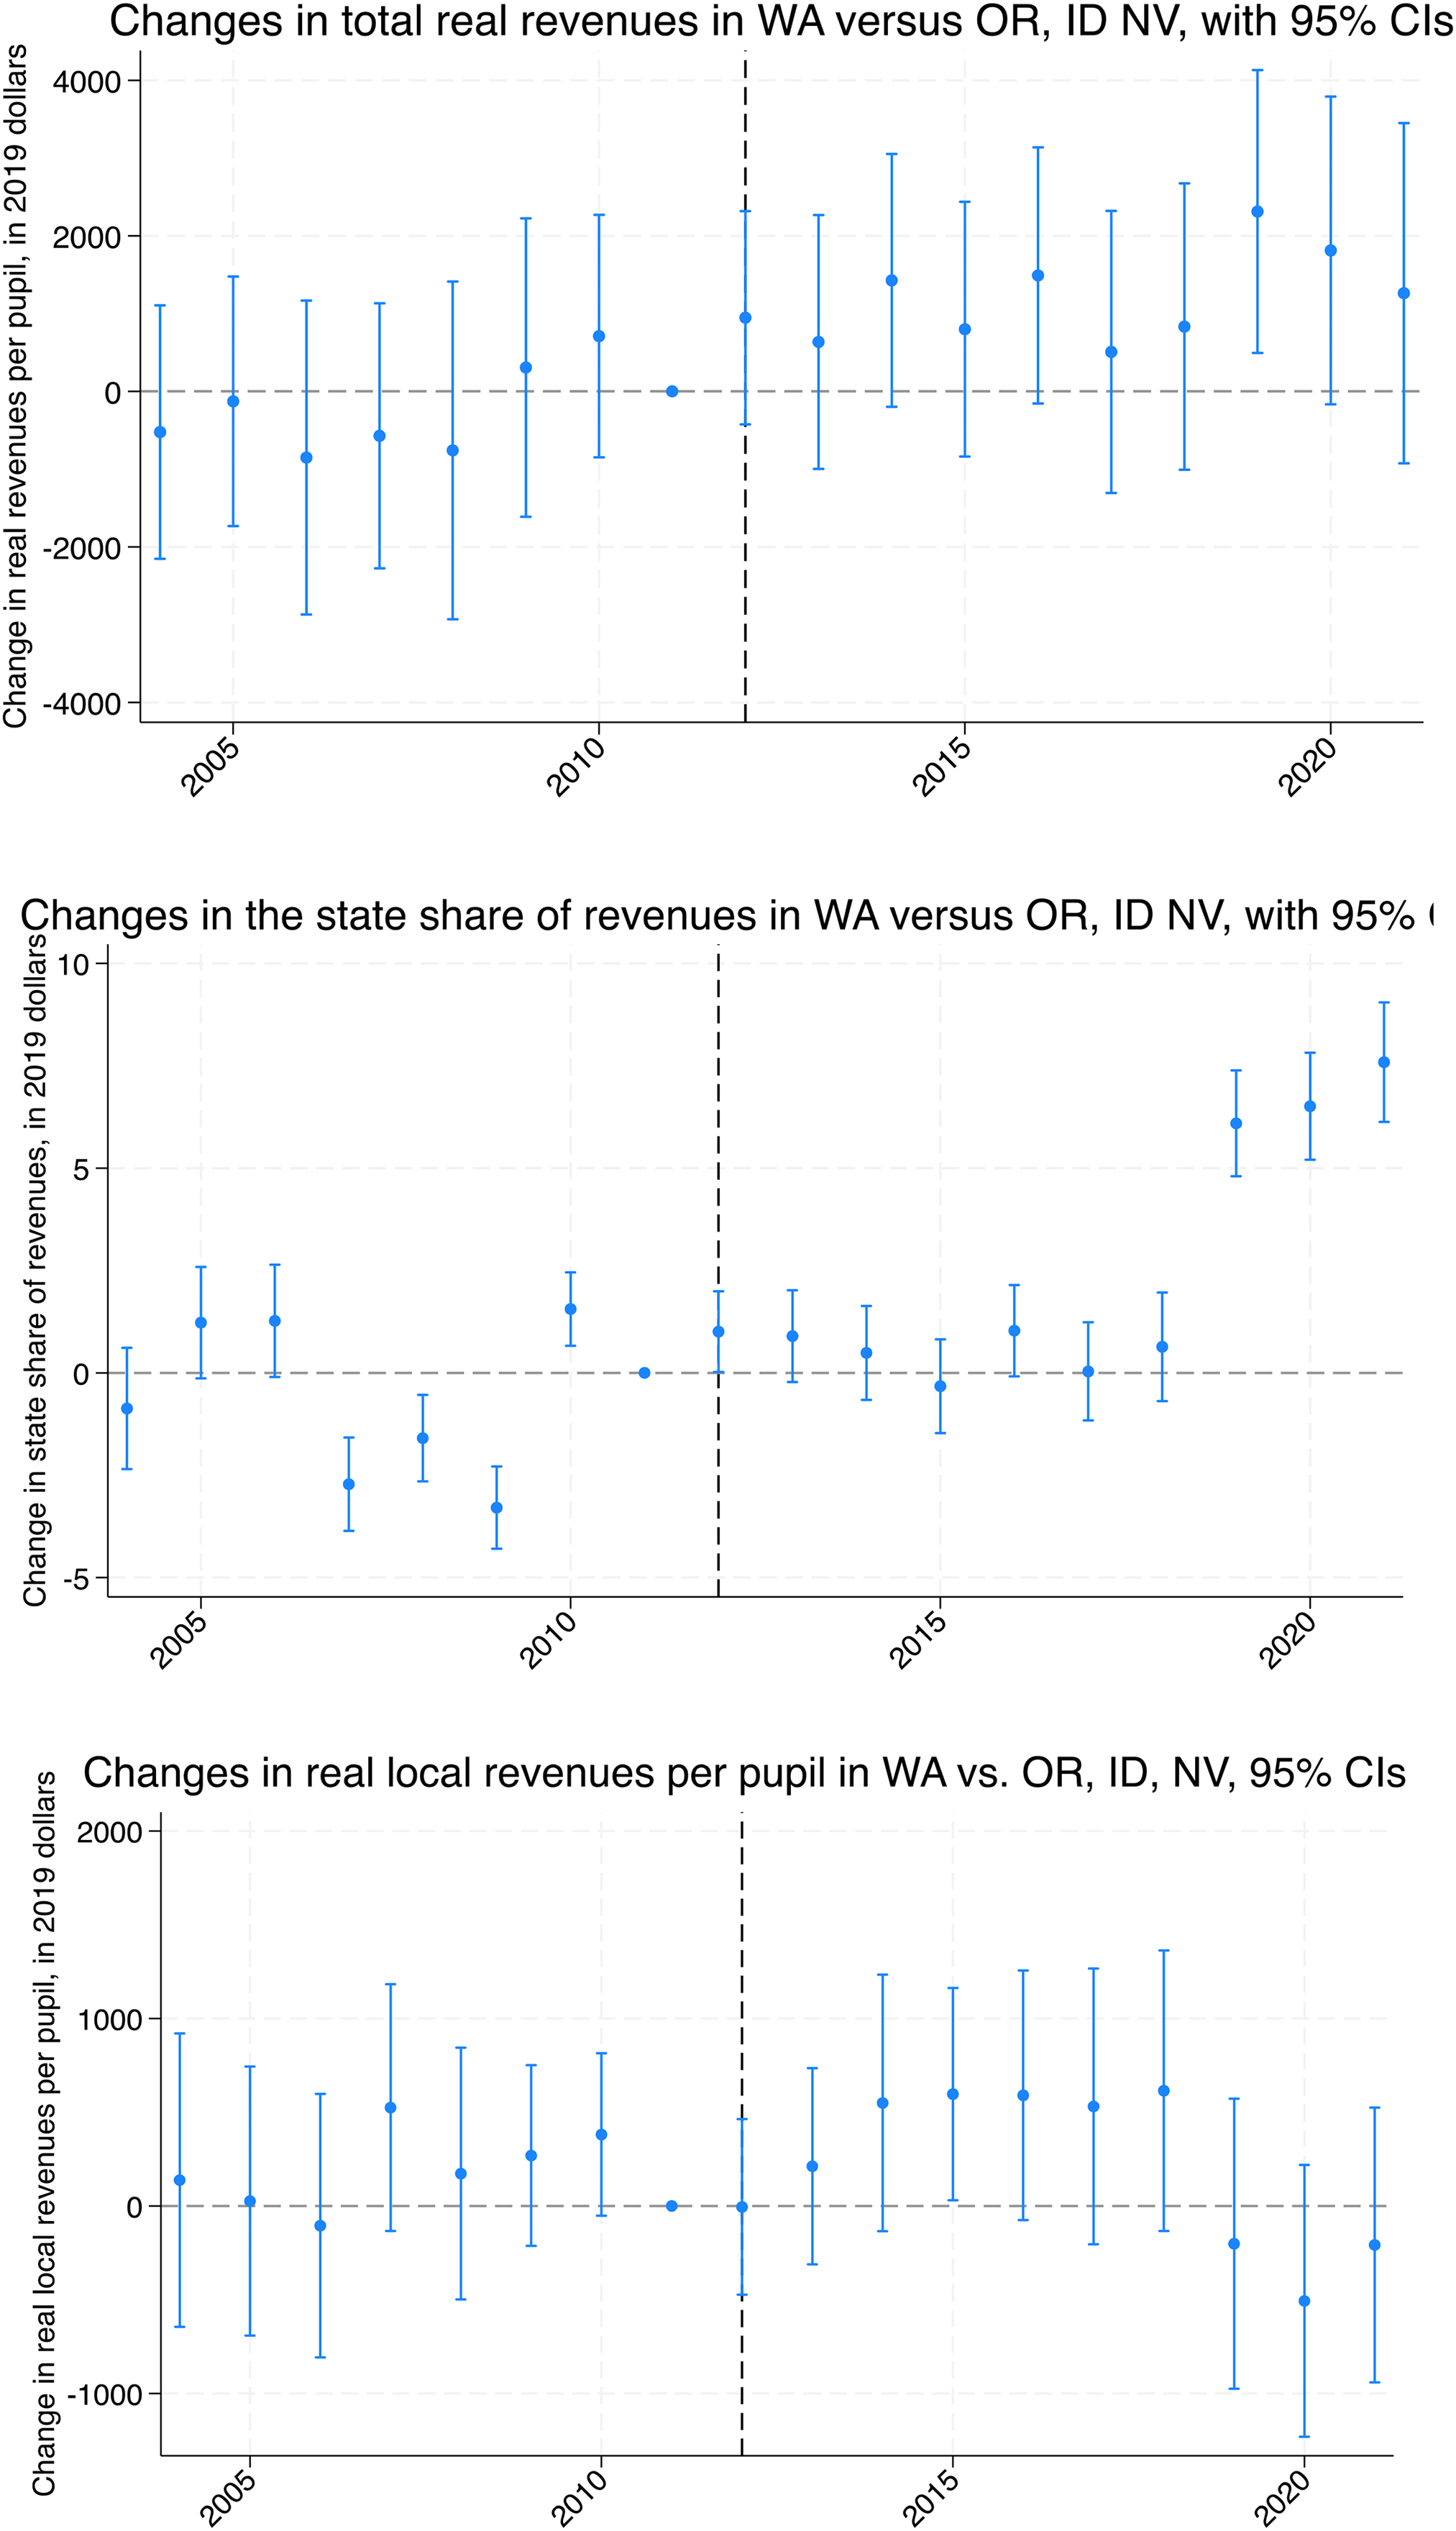
Event Study Plots for the Estimated Changes in Real Total Revenue per Pupil, State Share of Revenues, and Local Real Revenues per Pupil in Washington School Districts, Relative to School Districts in Idaho, Oregon, and Nevada After McCleary.
In addition to the within-Washington models, we use the same general DID and event study models to compare Washington to the other three states of the Pacific Northwest, a control group that includes Oregon, Idaho, and Nevada. 10 In these models, we do not divide school districts by quartile and are only interested in general effects of the reform across all districts as the supplementary analysis for our main findings.
We begin the analysis by examining the effects of McCleary on total real revenues per pupil in Panel A of Table 2. F-tests for Panel 1 models do not detect statistically significant pre-trends in any of the three models. Though the event study graph for the Q1 vs. Q2,3 model in Figure 6 does show statistically higher revenues in Q1, relative to Q2,3 in 2009 and 2010, these differences are not as large as to reject the null hypothesis of the F-test. Based on the F-test results, we conclude that the parallel trends assumption still stands. Out of three models, the Post-McCleary*Q1 coefficient is only marginally significant in Model 2. We view it as weak evidence for rejecting the null hypothesis and conclude that H1 - where we expected a targeted allocation of resources to districts of the lowest wealth - is not supported. Panel A model diagnostics in Figure 5 echoes the descriptive evidence in Figure 2 and suggests that after the implementation of McCleary in 2012 and until 2021, all school districts saw increases in real total revenues per pupil.
All things considered, McCleary was a rising tide that lifted all boats. It did help the poorest districts to secure more adequate resources on a per pupil basis, but it did so while maintaining differences in revenues between quartiles. The event study models in Figure 6 corroborate these results by showing the dynamics of differences in revenues between the quartiles before and after the reform.
Next, we proceed to the effects of McCleary on the state share of revenues. The Post-McCleary*Q1 interaction coefficient for the state share of revenues is consistently negative and statistically significant for all three models of Panel 2 in Table 2. This effect is counterintuitive because it goes against the logic of the equalization reform that aimed to increase support to the poorest districts. To understand and interpret it, we turn to the analysis of F-tests in Table 2 and event study graphs in Figure 7.
In Table 2, the F-tests for all three models of Panel B reject the null hypothesis and suggest a violation of the parallel trends assumption. The event study graph in Figure 7 corroborates the results of the F-test and shows a strong negative pre-trend in the state share of revenues for Q1 districts, relative to the other quartiles. In canonical DID studies, a strong pre-trend renders the results inconclusive because no causal claim can be made about the effect of a treatment when it may be confounded by another trend or treatment unfolding at the same time.
A policy evaluation context like ours, however, differs from a typical DID setting. Our assignment of school districts into quartiles - and consequently into the treatment and control groups – was never random. When the state of Washington declared that it would work to address school funding equity through McCleary, it already realized that school funding was growing increasingly unequal for its poorest districts. The negative pre-trend in the share of state funding for the poorest quartile is likely to have been one of the issues that the state intended to address. By setting up the study as a DID and looking at the comparative trajectories of district quartiles, we investigate if the reform actually made a difference.
Though our DID coefficient loses validity as an estimate of the causal effect of McCleary due to the strong pre-trend, the event study analysis still yields meaningful results. In Figure 7, we observe a significantly higher share of state revenues for Q1 districts than for the other districts in year 2005 and a consistent downward sloping pre-trend in the state share of revenues until 2012. After McCleary, the difference in state support and the negative trend in funding for the first quartile are no longer observable. Using this evidence, we conclude that McCleary tempered the negative pre-trend of aid reduction for the first quartile of school districts.
As additional exploratory analysis, we work in the vein of the pre-trend remedial approaches proposed by Rambachan and Roth (2023) to try to partially identify the effect of McCleary in the presence of a pre-trend. Specifically, we assume that the observed pre-trend for the state share of funding would have continued following the treatment time in the absence of McCleary. We then use the pre-McCleary data to run an ARIMA model (AR6) to create a linear forecast for the state share of revenues from 2012 to 2021. Next, we run the DID model using the pre-trend and the forecasted counterfactual data to examine how the estimated coefficients differ from the ones generated by the original DID model based on actual observed values. We tentatively interpret the difference of the two coefficients as a crude estimate of the effect of McCleary. Figure 7a presents the results of this sensitivity check both graphically and numerically. It suggests that, on average, McCleary curtailed the state funding decline for Q1 districts by 0.89 of a percentage point. Again, these results do not provide causal inference but attempt a partial identification of the McCleary effect in the presence of a pre-trend. Based on the patterns in the event study graphs in Figure 7 and the sensitivity analysis results in Figure 7a, we conclude that H2 - where we expected an equalization in state allocations across all districts - is supported.
Finally, we look at the use of local revenues by school districts. In Table 2, F-tests for parallel trends before McCleary are not statistically significant and allow us to interpret the DID estimates as causal effects of McCleary. Panel C in Table 2 suggests that after McCleary, Q4 districts received, on average, $320 less per pupil from local levies than Q1 districts, controlling for year and district fixed effects. The diagnostics graph in Figure 5, however, shows that after McCleary, local revenues continued to increase until 2018 when all school districts experienced a sharp decline.
Event study graphs in Figure 8 unmask the aggregate effect and show larger absolute losses in local revenues for the most affluent districts following HB 2242 implementation in 2017. Differences between Q1 and Q4 reach statistical significance at the 95% confidence level in 2019 and 2020. H3, where we expected affluent districts to reduce their local revenue generation after McCleary, is supported. However, we observe a decrease in local revenue generation by all districts following the state's legal constraint on local levies rather than due to the crowd out effect of local revenues by state transfers that we predicted in H3.
Now, we turn to the supplementary analysis of changes in Washington school district revenues after McCleary, relative to the revenues of school districts in Oregon, Idaho, and Nevada. The findings broadly align with the general district revenue patterns detected in Washington. In Table 3, controlling for the district and year effects, we show that McCleary increased total real revenues per pupil in Washington by an average of $1,568. We also find that the reform increased the state share of revenues by about 3%, relative to the districts unaffected by McCleary in the other states. Finally, the reform had no statistically significant effect on local revenues (Figure 9), a finding that reflects significant variability in local revenue generation across states and over time. 11
Difference-in-Differences Estimates of the McCleary Effects on Total Real Revenues, State Share of Revenues, and Local Real Revenues per Pupil in Washington School Districts Relative to School Districts in Idaho, Oregon, and Nevada.
Note: The ATET estimate (McCleary) is adjusted for the school district panel effects and year time effects. Robust standard errors in parentheses. Levels of statistical significance: *** p < 0.01, ** p < 0.05, * p < 0.1. The DID models, their diagnostics, and the event study analysis below were performed using the xtdidregress command in Stata 19 and its accompanying syntax for pre-trend diagnostics and event study plots (estat trendplot, estat ptrends, estat granger, estat grangerplot).
Common Equity Ratios in Education Finance.
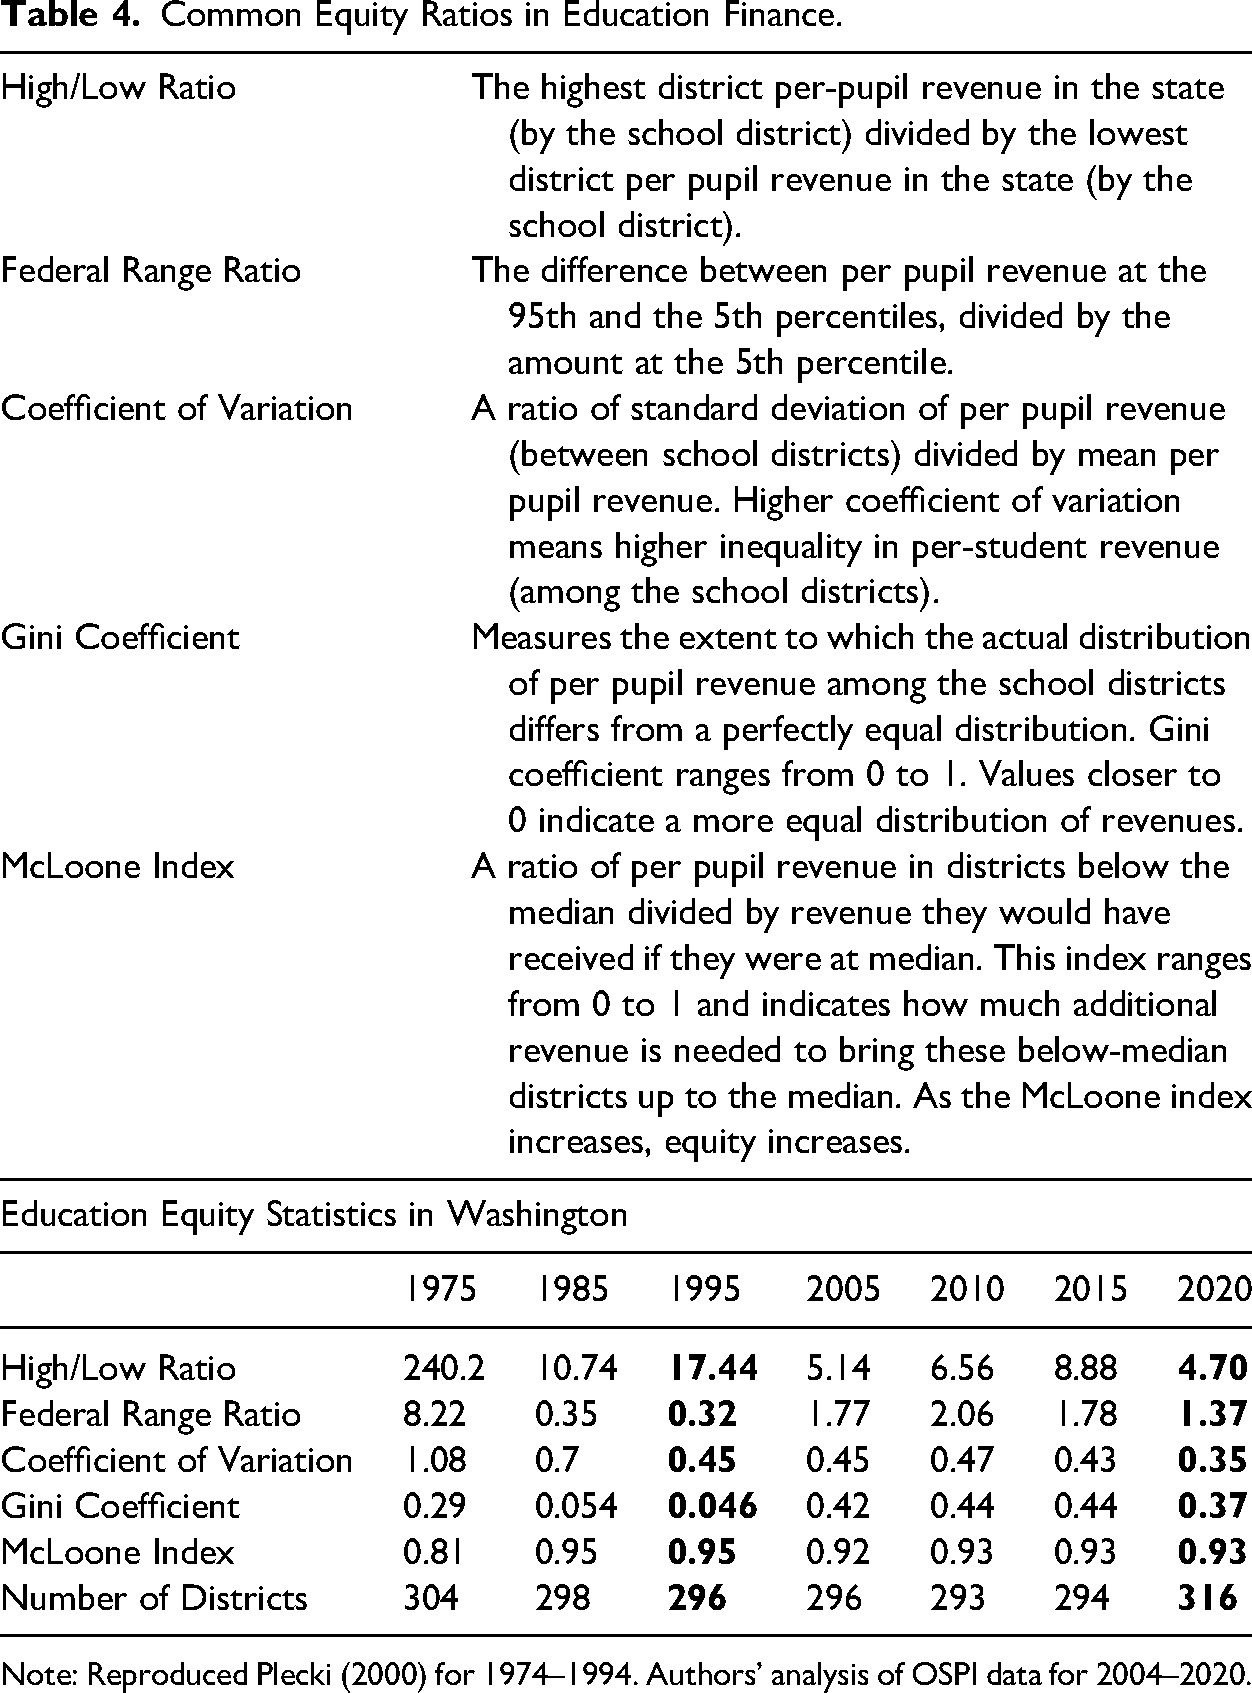
Note: Reproduced Plecki (2000) for 1974–1994. Authors’ analysis of OSPI data for 2004–2020.
Funding Equity Ratio Analysis
Now, we turn back to Washington and examine changes in education funding through the analysis of education funding equity ratios for 2005–2020. We focus on comparing the 1995 indicators with the 2020 indicators to track progress. Table 4 describes five equity measures and presents the historic ratios by Plecki (2000) for three years prior to the current analysis and four years in the observation period: 2005, 2010, 2015, 2020.
The High/Low ratio declined formidably from 17.4 in 1995 to 4.7 in 2020. To contextualize, the richest district in Washington spent 4.7 times more per pupil than the poorest district in 2020, relative to 17.4 times more in 1995. The Coefficient of Variation in 2020 (0.35) showed the lowest overall variation in school district revenues over the whole observation time. It means that district revenues showed more clustering around the mean in 2020 than in 1995 or any other year. However, the Federal ratio was significantly higher in 2020 than the federal ratio reported for 1995 (1.37 versus 0.32, respectively). Taken together, the two latter measures suggest that though the difference between the top and the bottom percentiles got smaller, the difference between the revenues of the 5th and the 95th percentile districts increased over time. The Gini Coefficient for district revenues in 2020 (0.37) was on par with the Gini measure of national income inequality 12 but differed dramatically from the Gini coefficients reported by Plecki (2000) for 1985 and 1995. 13 The McLoone Index did not change much over time and suggested that only 7% of additional revenue was required in 2020 to bring all below-median districts to the median (1–0.93 = 0.07).
Using two decades of educational equity measures, we show moderate improvement in student funding equity by 2020 through the high/low ratio, a lower variation in spending (CV), and a high share of districts close to the median revenue (McLoone), which are all expected results from the McCleary school funding reform. The federal range ratio and the Gini coefficient, however, point at room for further progress in equalization.
Discussion
Education funding continues to be the largest per capita spending category and a centerpiece of public debate on wealth inequality in the Pacific Northwest. Examining for the first time how Washington's school finance equalization reform of 2012 (McCleary v. State, 173 Wn.2d 477, 269 P.3d 277 2012) influenced school district revenues, this study shows that higher education access equalization was achieved through additional resource allocations to all the districts rather than via targeted revenue increases of property-poor districts alone. The McCleary regime also constrained local revenue growth by 2018, which, other things equal, will affect property-rich districts more than the other districts in the years to come.
We also show that the McCleary reform achieved equalization by further centralizing the design of public school revenue systems. Arguments in favor of the state-level centralization of school finance are not new and are typically viewed as an effective tool to address socio-economic disparities (Warner 2010). As a result of state action, McCleary v. State (2012) did produce an increase in the resources of economically disadvantaged districts. Along with this positive change, it also increased revenues of all school districts - an outcome that may be interpreted as evidence of the flypaper effect (Oates 1999) and Leviathan government (Brennan and Buchanan 1980), both of which lead to the overall expansion of public spending following an increase in intergovernmental transfers. Importantly, McCleary added a redistributive mandate for the state, and so its long-term success will depend on the state's willingness to monitor and fund the equalization effort.
Given the flickering signs of a reduction in local revenue generation, particularly in affluent districts in the last years of the observation period, we expect that state funding will continue to crowd out local sources and contribute to the fiscal illusion. One of the possible consequences of such K-12 finance design is linked to the misperception of the true costs of educational services by district residents who benefit from state support. Specifically, property owners and renters who underestimate the true cost of education and bear less than its full cost may be more willing to support further expansion of public spending. When linkages between voter tax burdens and benefits received are broken, as may be the case with the more redistributive designs of K-12, the state may be pressured electorally to assume an even more paternalistic redistributive role and grow spending.
Compared to the other states where public school funding remains a local issue (Kenyon and Munteanu 2022), Washington's level of state centralization is exceptionally high. Whether Washington can become a model for other states will depend on whether the outcomes of fiscal equalization for student achievement are positive. Future research on the effects of McCleary can then focus on academic achievement.
In light of the availability of alternative educational arrangements that include private and charter schools, excessive redistribution of local revenues by state may incentivize affluent families with high tastes for education to withdraw from the public K-12 system. Such unintended consequences can be expected if the redistributive efforts are taken too far and if local property tax dollars are redirected away from districts where they could still improve school amenities and education quality. The departure of middle- to upper class children from the public K-12 system may produce truly challenging externalities for equalization efforts through the flight of not only students, and therefore funding, but also social capital. Whether Washington can walk the delicate walk of pursuing equity while also providing high quality public amenities and student educational services to districts that value them is a key question for future research and policy. More broadly, evidence collected from each case of a school finance reform like the one we have examined in Washington can be regarded as a building block toward a more comprehensive understanding of the effects of education policy changes on local finance in heterogeneous fiscally federalist environments. A more thorough discussion of the intended and unintended consequences of such reforms has vast implications for the use of public sector resources and for the value that such investments create for social and economic progress.
Supplemental Material
sj-docx-1-pfr-10.1177_10911421251393120 - Supplemental material for Ample Funding for All: Fiscal Effects of the McCleary School Finance Equalization Reform in Washington
Supplemental material, sj-docx-1-pfr-10.1177_10911421251393120 for Ample Funding for All: Fiscal Effects of the McCleary School Finance Equalization Reform in Washington by Olha Krupa and Eugenia Gorina in Public Finance Review
Footnotes
Acknowledgments
The authors are thankful to the Lincoln Institute of Land Policy for supporting this research. We also extend our gratitude to Daphne Kenyon, Joan Youngman, Andrew Reschowsky, Christian Buerger, the PFR Editor, and reviewers for helpful feedback and encouragement throughout the preparation of this study. All errors remain our own.
Declaration of Conflicting Interests
The author(s) declared no potential conflicts of interest with respect to the research, authorship, and/or publication of this article.
Funding
The author(s) disclosed receipt of the following financial support for the research, authorship, and/or publication of this article: Lincoln Institute of Land Policy, Lincoln Scholar in-Residence Fellow, 2019.
Supplemental Material
Supplemental material for this article is available online.
Notes
Author Biographies
References
Supplementary Material
Please find the following supplemental material available below.
For Open Access articles published under a Creative Commons License, all supplemental material carries the same license as the article it is associated with.
For non-Open Access articles published, all supplemental material carries a non-exclusive license, and permission requests for re-use of supplemental material or any part of supplemental material shall be sent directly to the copyright owner as specified in the copyright notice associated with the article.