
Abstract
Complement-dependent cytotoxicity (CDC) is critical for tumor cell proliferation. Previous work has revealed that epalrestat (EPA), an inhibitor of aldose reductase, plays a crucial role in tumor cell proliferation. However, whether CDC is involved in EPA-mediated inhibition of cancer cell proliferation remains unclear. This study evaluates reactive oxygen species (ROS) levels, 5-ethynyl-2'-deoxyuridine (EdU) incorporation, and Cell Counting Kit-8 assay to determine the effect of EPA on cell proliferation in colorectal cancer cells. Quantitative real-time PCR, immunoblotting, rescue experiments combined with luciferase reporter assay, and chromatin immunoprecipitation (ChIP) assay were performed to explore the mechanism of EPA on CDC. In the present study, we observed that EPA significantly downregulates cell proliferation characterized by enhanced ROS levels and reduced EdU+ positive cells, which was attributed to the decreased CD46 expression. Ectopic CD46 expression reversed the above EPA-induced phenomenon. Mechanistically, EPA treatment suppressed protein kinase D (PKD)/signal transducer and activator of transcription 3 (STAT3) phosphorylation, leading to reduce the binding ability of STAT3 to the CD46 promoter, further attenuating CD46 transactivation. Activation of PKD by phorbol 12-myristate 13-acetate largely blocked the effect of EPA-mediated CD46 transactivation. Together, the current findings revealed a novel mechanism whereby EPA modulates CDC to inhibit the proliferation of cancer cells, broadening the pharmacological functions of EPA in anti-tumor therapy.
Introduction
Epalrestat (EPA), an inhibitor of aldose reductase (AR), the rate-limiting enzyme of the polyol pathway, is used to treat diabetic peripheral neuropathy in patients with diabetes.1,2 The pharmacological functions of EPA have been gradually recognized in various other diseases. For instance, EPA and its derivative NARI-29 alleviate pulmonary fibrosis through the modulation of transforming growth factor-beta/Smad signaling3,4 and suppression of the inflammatory response.5,6 Furthermore, EPA has been shown to improve doxorubicin-induced cardiotoxicity through calcium/calmodulin-dependent protein kinase II signaling cascades and the nuclear factor kappa B pathway.7,8 Moreover, EPA elicited strong growth-inhibitory effects in drug-resistant hepatocellular carcinoma cells 9 and lung cancer cells, 10 as well as inhibiting the invasion/migration and proliferation of cervical cancer cells. 11 In addition, EPA was reported to be an inhibitor of AKR1B1 9 and found to suppress protein kinase c (PKC) activation, 12 leading to inhibit protein kinase D (PKD)-dependent or -independent signaling. However, the mechanisms underlying the pharmacological functions of EPA in cancer have not been completely elucidated.
Complement regulatory proteins (CRPs), including membrane cofactor protein (MCP, CD46), decay-accelerating factor (DAF, CD55), and membrane inhibitor of reactive lysis (MIRL, CD59), are enriched in the cancer stem cell niche of multiple tumors and can be induced by chemotherapeutics and hypoxic microenvironments. 13 For instance, CD55-initiated intracellular signaling promotes malignant transformation, cancer progression, cell survival, angiogenesis, and inhibits apoptosis. 13 Furthermore, complement activation can significantly inhibit cell proliferation, while the overexpression of CD55 in colorectal cancer cells significantly enhanced tumor growth and migration ability. 14 In addition, soluble CD55, lacking the C-terminal glycosylphosphatidylinositol anchor domain, can bind to its receptor CD97, which is highly expressed in many cancers, to trigger downstream signaling and promote cancer progression. CD46 can inhibit C3b/C4b to suppress membrane attack complex (MAC) formation, thereby protecting cancer cells from complement-dependent cytotoxicity (CDC) and antibody-dependent cellular cytotoxicity. However, it remains unknown whether CRP-mediated CDC is involved in EPA-mediated tumor growth inhibition.
Despite significant efforts to improve the effectiveness of treatment, colorectal cancer remains one of the most prevalent malignancies worldwide, with a high incidence and significant mortality rate. 15 Seeking therapeutic strategies to interfere with tumor progression has become a major challenge in clinical research. Recently, tumor cells were found to enhance CRP expression to escape CDCs and survive in bladder cancer.16-18 Moreover, CD46 was found to remodel the tumor microenvironment to favor tumor progression, suggesting that the complement cascade could exert a driving influence on adaptive T-cell responses during anti-tumor immune responses. 19
In this study, we revealed the novel role of EPA in the proliferation of colorectal cancer cells through modulation of CDC, as assessed by Cell Counting Kit-8 (CCK-8), quantitative real-time PCR (qPCR), luciferase assay, and chromatin immunoprecipitation (ChIP) assay, which provides a therapeutic strategy of targeting the complement system combined with EPA.
Materials and Methods
Chemical Reagents
Dulbecco’s Modified Eagle’s Medium (DMEM; C11995500BT) and fetal bovine serum (FBS), Premium Plus (A5669701), were purchased from GIBCO (Thermo Fisher Scientific, Inc., Waltham, MA, USA). EPA (HY-66009, CAS No. 82159-09-9, 99.62%) and phorbol 12-myristate 13-acetate (PMA; HY-18739, CAS No. 16561-29-8, 99.80%) were purchased from MedChemExpress (Shanghai, China). TRIzol Reagent (15596-026CN) was purchased from Invitrogen (Carlsbad, CA, USA). Super RT III All-in-one RT mix with gDNA remover (BL1020B) and SYBR green qPCR mix (BL698A), enhanced cell counting kit-8 (BL1055B), enhanced BCA protein assay kit (BL1054B), cell lysis buffer for western blotting and IP (BL509A), reactive oxygen species (ROS) assay kit (BL714B), and dual-luciferase reporter gene assay kit (BL555B) were purchased from Biosharp (Beijing, China). BeyoClick™ EdU Cell Proliferation Kit with AF555 was purchased from Beyotimes (Shanghai, China). Phospho-protein kinase D (PKD)/protein kinase c (PKC) mu (Ser744/748) antibody (2054) and SimpleChIP® Plus Enzymatic Chromatin IP Kit (Magnetic Beads, 9005) were purchased from Cell Signaling Technology (Danvers, MA, USA). CD46 polyclonal antibody (12494-1-AP), AKR1B1 monoclonal antibody (67498-1-Ig), STAT3 monoclonal antibody (60199-1-Ig), Phospho-STAT3 (Ser727) recombinant antibody (80199-2-RR), and PRKD2 polyclonal antibody (11623-1-AP) were purchased from Proteintech (Wuhan, China). α-tubulin (MG17) mouse monoclonal antibody (RM2007), GAPDH (MC4) mouse monoclonal antibody (RM2002), goat anti-mouse IgG (H+L)-HRP (RM3001), and goat anti-rabbit IgG (H+L)-HRP (RM3002) were purchased from Ray Antibody Biotech (Beijing, China). Plasmids were purchased from Youbio (Changsha, China). Other reagents were purchased from Biosharp (Beijing, China).
Cell Culture, Treatment, and Transfection
Colorectal cancer cells, including HT29 and CaCO-2 cells, purchased from Shanghai Zhong Qian Xin Zhou Biotechnology Co, Ltd (Shanghai, China) and HEK293 cells, purchased from Procell system (Wuhan, China),were cultured in DMEM supplemented with 10% FBS and 1% penicillin-streptomycin at 37°C in a humidified incubator with 5% CO2. A concentration of 50 uM EPA was used in the experiment according to the IC50 value and previous report by Yu et al. 20 Plasmids constructed by Youbio were transfected into the cells using Lipo8000™ transfection reagent (C0533) (Beyotimes, Shanghai, China).
CCK-8 Analysis
Briefly, after digestion, cells were centrifuged to remove the supernatant and subsequently resuspended at a density of 105 cells/mL before being reseeded into a 96-well plate overnight. The following day, cells were treated with EPA at various indicated time points. Cell viability was determined by measuring absorbance at 450 nm after incubation with fresh medium containing 10% CCK-8 solution, according to the manufacturer’s instruction.
qPCR Analysis
As described by Han et al., 21 total RNA was extracted from the indicated groups using TRIzol reagent according to the manufacturer’s instruction. Reverse transcription was performed to generate complementary DNA using super RT III All-in-One RT mix according to the manufacturer’s protocol. Real-time PCR was conducted to analyze the expression of indicated genes using SYBR Green qPCR Mix (Biosharp (Beijing, China). The following primers were used in this study22-24: CD46 forward: 5‘-AGCGGTAAGCCCCCAATATG-3‘; reverse: 5’-TCCAGGTGCAGGATCACAAC-3’; CD55 forward: 5‘-TTCCAGTCGGTACTGTTGTGG-3‘; reverse: 5’- CCCGGATTAGGGCATGATTTCT-3’; CD59 forward: 5‘-CTAACCCAACTGCGACTG-3‘; reverse: 5’- CTGATAAGGATGTCCCACC-3’; GAPDH forward: 5‘-CCATGAGAAGTATGACAACAGCC-3‘; and reverse: 5’- GGGTGCTAAGCAGTTGGTG-3’.
ROS Level
Briefly, cells were seeded into a 12-well plate and incubated overnight, followed by treatment with or without EPA for 48 h. Intracellular ROS levels were determined according to the manufacturer’s instructions. The medium was replaced with fresh medium containing 10 uM H2DCFDA and incubated for an additional 30 min at 37°C. Following two washes with DMEM, cells were imaged using a fluorescence microscope and the resulting fluorescence intensity was quantified using ImageJ 1.54 g (NIH, Bethesda, Maryland, USA).
Immunoblotting Analysis
Immunoblotting analysis was performed as described by Liang et al. 25 Briefly, total protein was extracted using cell lysis buffer and quantified using an enhanced BCA protein assay kit according to the manufacturer’s instructions. Equal amounts of protein were loaded and subjected to SDS-PAGE for separation, followed by transfer onto a nitrocellulose membrane. The membrane was subsequently blocked with 5% milk for 1 h at 25°C. The membrane was incubated with indicated primary antibodies overnight at 4°C. The following day, after washing 3 times with phosphate-buffered saline with Tween-20 for 15 min, the secondary antibodies were applied and incubated for 1 h at 25°C. Protein expression was visualized using BeyoECL Plus.
5-Ethynyl-2'-Deoxyuridine Analysis
Cells were digested and reseeded overnight, followed by treatment with or without EPA for 48 h. The medium was then replaced with fresh medium containing EdU working solution to incubate for another 2 h at 37°C. After removing the supernatant, the cells were fixed in 4% paraformaldehyde for 15 min at 25°C, then treated with 0.3% Triton X-100 for 15 min at 25°C. Further incubation was conducted with a click reaction cocktail for 30 min under dark conditions at 25°C. Following 3 washes with phosphate-buffered saline, nuclei were counterstained with Hoechst 33342, and cells were imaged using a fluorescence microscope.
Luciferase Analysis
Briefly, a CD46 promoter reporter plasmid and a Renilla plasmid were co-transfected into HEK293 cells in the presence or absence of a STAT3 expression plasmid for 24 h, followed by stimulation with or without EPA for another 24 h. Relative light units (RLUs) were measured and expressed as the ratio of firefly luciferase to Renilla luciferase activity, in accordance with the manufacturer’s instruction.
Chromatin Immunoprecipitation
As described by Zhao et al., 26 cells were subjected to serum-free starvation for 24 h, followed by treatment with or without EPA for 1 h, and ChIP was subsequently performed according to the manufacturer’s instructions. After fixation with 1.5% formaldehyde for 20 min and permeabilization with glycine for 5 min at 25°C, the cells were scraped, collected by centrifugation at 500g for 5 min at 4°C to remove the supernatant, and lysed to isolate nuclei. The chromatin was digested with micrococcal nuclease and immunoprecipitated overnight with anti-STAT3 or IgG, followed by washing and elution. The cross-links were reversed, and the DNA was purified for real-time PCR analysis using specific primers to evaluate the effect of EPA on the binding of STAT3 to the CD46 promoter. The primer sequences were as follows: CD46 forward: 5‘-GAGGCCAAGCACCTGACTTA-3‘; reverse: 5’- CGCTCGGTTGTCTGAGATTT-3’.
Database Analysis
Gene expression profiling interactive analysis (GEPIA) was used to perform gene expression, correlation, and survival analyses.
Statistical Analysis
GraphPad Software (Version 10; Boston, MA, USA) was used for statistical analysis. Each experiment was performed at least 3 times. A one-sample t test was performed to analyze the differences in mRNA expression levels. One-way analysis of variance (ANOVA) followed by Dunnett’s multiple comparisons test was performed for statistical analysis of the rescue experiment. Two-way ANOVA with multiple comparisons followed by the Bonferroni post hoc test was used to assess differences in the luciferase and ChIP experiments. P value <0.05 was considered statistically significant.
Results
EPA Suppresses Cell Proliferation
EPA is widely recognized for its role in the activation of ferroptosis and chemosensitization in various tumors. Cell viability assays demonstrated that the IC50 value of EPA was 107 uM (Figure 1A). In addition, CCK-8 analysis showed that treatment with 50 uM EPA suppressed cell proliferation in colorectal cancer cells at both 24 and 48 h (Figure 1B). Intracellular ROS levels were enhanced in HT29 cells after 48 h of EPA stimulation compared with that of the control group (Figure 1C). Furthermore, EdU assays, together with quantitative analysis, indicated that cell proliferation was inhibited in HT29 cells following EPA treatment (Figure 1D). Collectively, EPA exerts an inhibitory effect on cell proliferation. EPA suppressed cell proliferation. (A) Cell viability assays were conducted to determine IC50 in HT29 cells treated with various EPA concentrations for 48 h. (B) HT29 (left panel) and CaCO-2 (right panel) cells were digested, reseeded into 96-well plates, and cultured overnight, followed by treatment with or without EPA treatment for the indicated time points. CCK-8 analysis of cell proliferation was conducted according to the manufacturer’s instructions. Data are presented as the mean ± SD of 3 independent experiments and quantified by a two-sample t test; n = 3, *P < 0.001, **P < 0.05, ***P < 0.001. (C) HT29 cells were seeded into a 12-well plate and allowed to adhere overnight, followed by treatment with or without EPA for another 48 h. The ROS level was determined, and the mean fluorescence intensity (MFI) was measured to determine the difference. Data are presented as the mean ± SD of independent experiments and quantified by a two-sample t test; n = 5, ****P < 0.0001. (D) Experiment was performed as described in (B), and cell proliferation was analyzed using EdU incorporation assays. The proportion of EdU-positive cells was analyzed using a two-sample t test. Data are presented as the mean ± SD of independent experiments; n = 7, ****P < 0.0001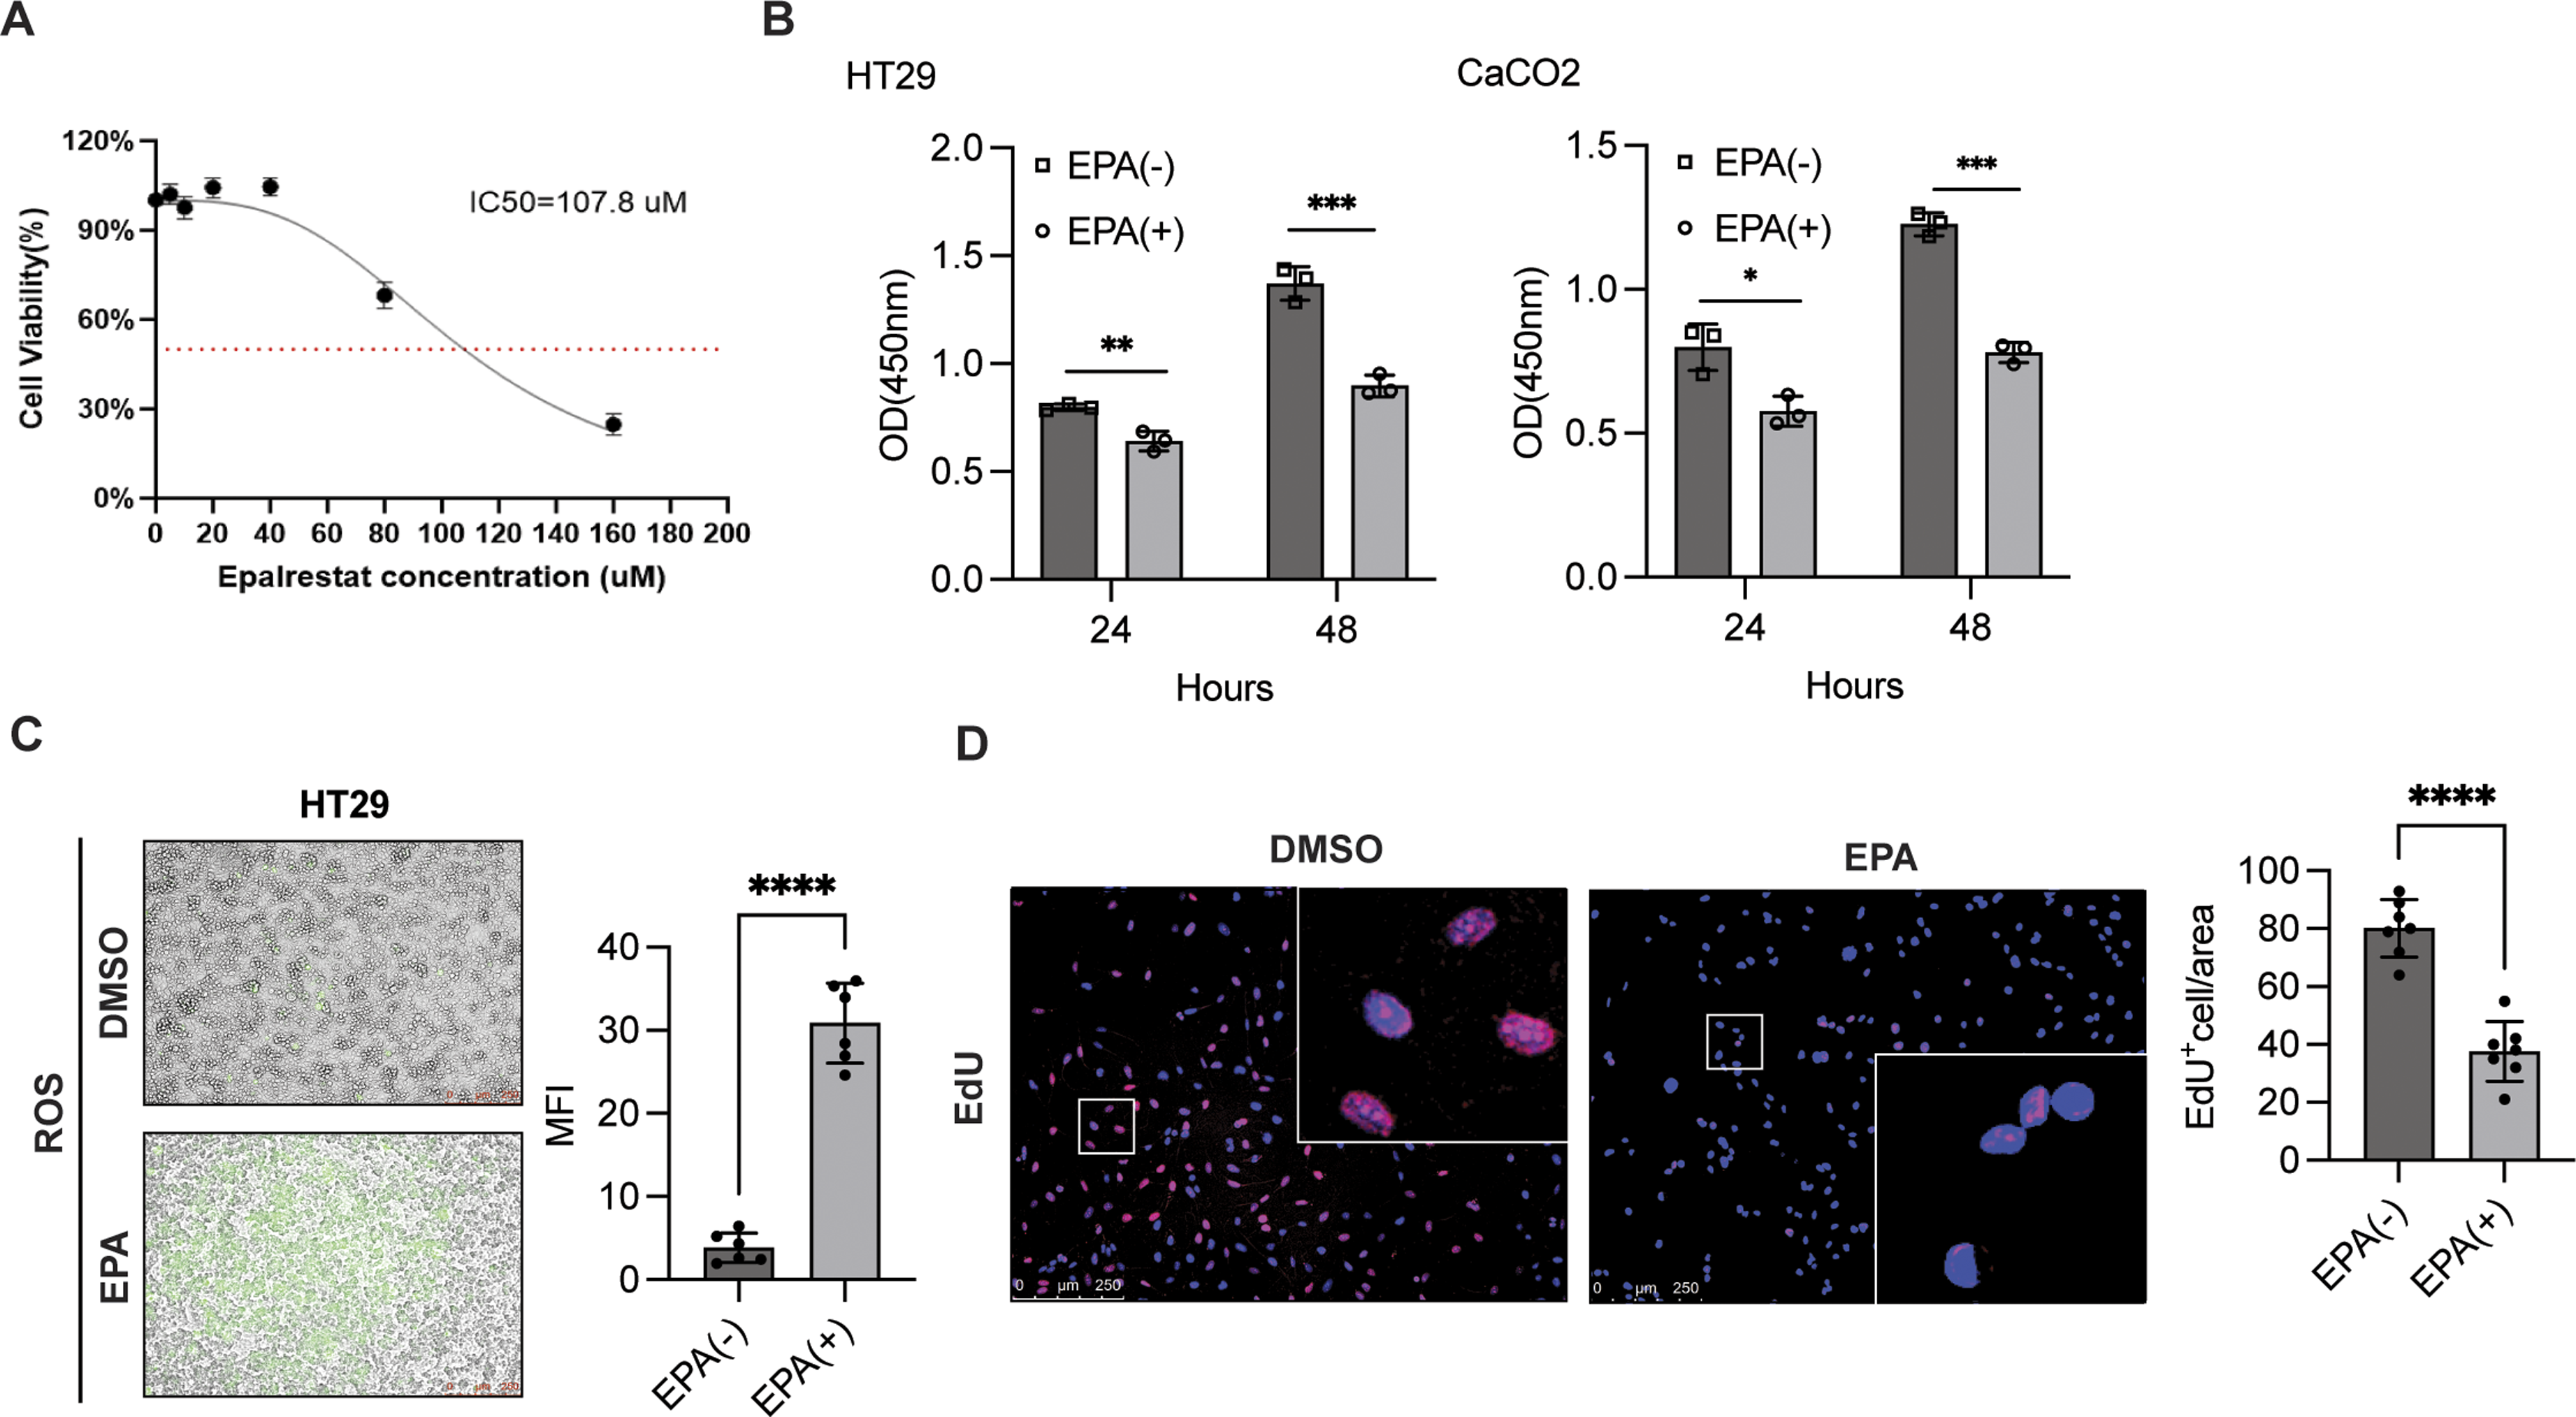
EPA Inhibits Proliferation Through CD46
Previous work has revealed that CD46 is a membrane-bound complement regulatory protein that protects cells from non-specific CDC.16,17 However, it is unknown whether EPA inhibits cell proliferation independent of CD46. QPCR and western blotting analyses were performed to determine the effect of EPA on CD46 expression. As shown in Figure 2A, the expressions of CD46 and CD55, not CD59, were reduced in colorectal cancer. Moreover, the mRNA levels of CD46, CD55, and CD59 significantly decreased after EPA stimulation in HT29 cells, and immunoblotting analysis further confirmed that EPA treatment downregulated CD46, CD55, and CD59 protein expression (Figure 2B and C) expression, indicating that EPA may participate in the regulation of CRP–CDC. In addition, the overexpression of CD46 in HT29 cells attenuated the influence of EPA-mediated cell proliferation as evidenced by the CCK-8 assay (Figure 2D). This is consistent with previous studies reporting that CD46 is instrumental in regulating cell proliferation.27,28 Taken together, EPA suppresses CD46 expression to inhibit cell proliferation. EPA modulated CRP expression. (A) Analysis of CD46/CD55/CD59 expression in colon adenocarcinoma and the control group from GEPIA (https://gepia.cancer-pku.cn/index.html); *P < 0.05. (B) qPCR analysis of CD46/CD55/CD59 mRNA expression level in HT29 cells with or without EPA treatment for 48 h. Data are presented as the mean ± SD from 3 independent experiments and were analyzed using a one-sample t test; ***P < 0.001. (C) CD46/CD55/CD59 protein expression was determined through immunoblotting analysis in HT29 cells treated with or without EPA for 48 h. Band intensity was measured and analyzed by one-way analysis of variance (ANOVA) followed by Dunnett’s multiple comparisons test. Data are presented as the mean ± SD from 3 independent experiments; *P < 0.05, **P < 0.01. (D) CCK-8 analysis was conducted to assess cell proliferation in HT29 cells with or without EPA treatment in combination with CD46 overexpression. Data are presented as the mean ± SD and were analyzed by one-way ANOVA followed by Dunnett’s multiple comparisons test; **P < 0.01, ****P < 0.0001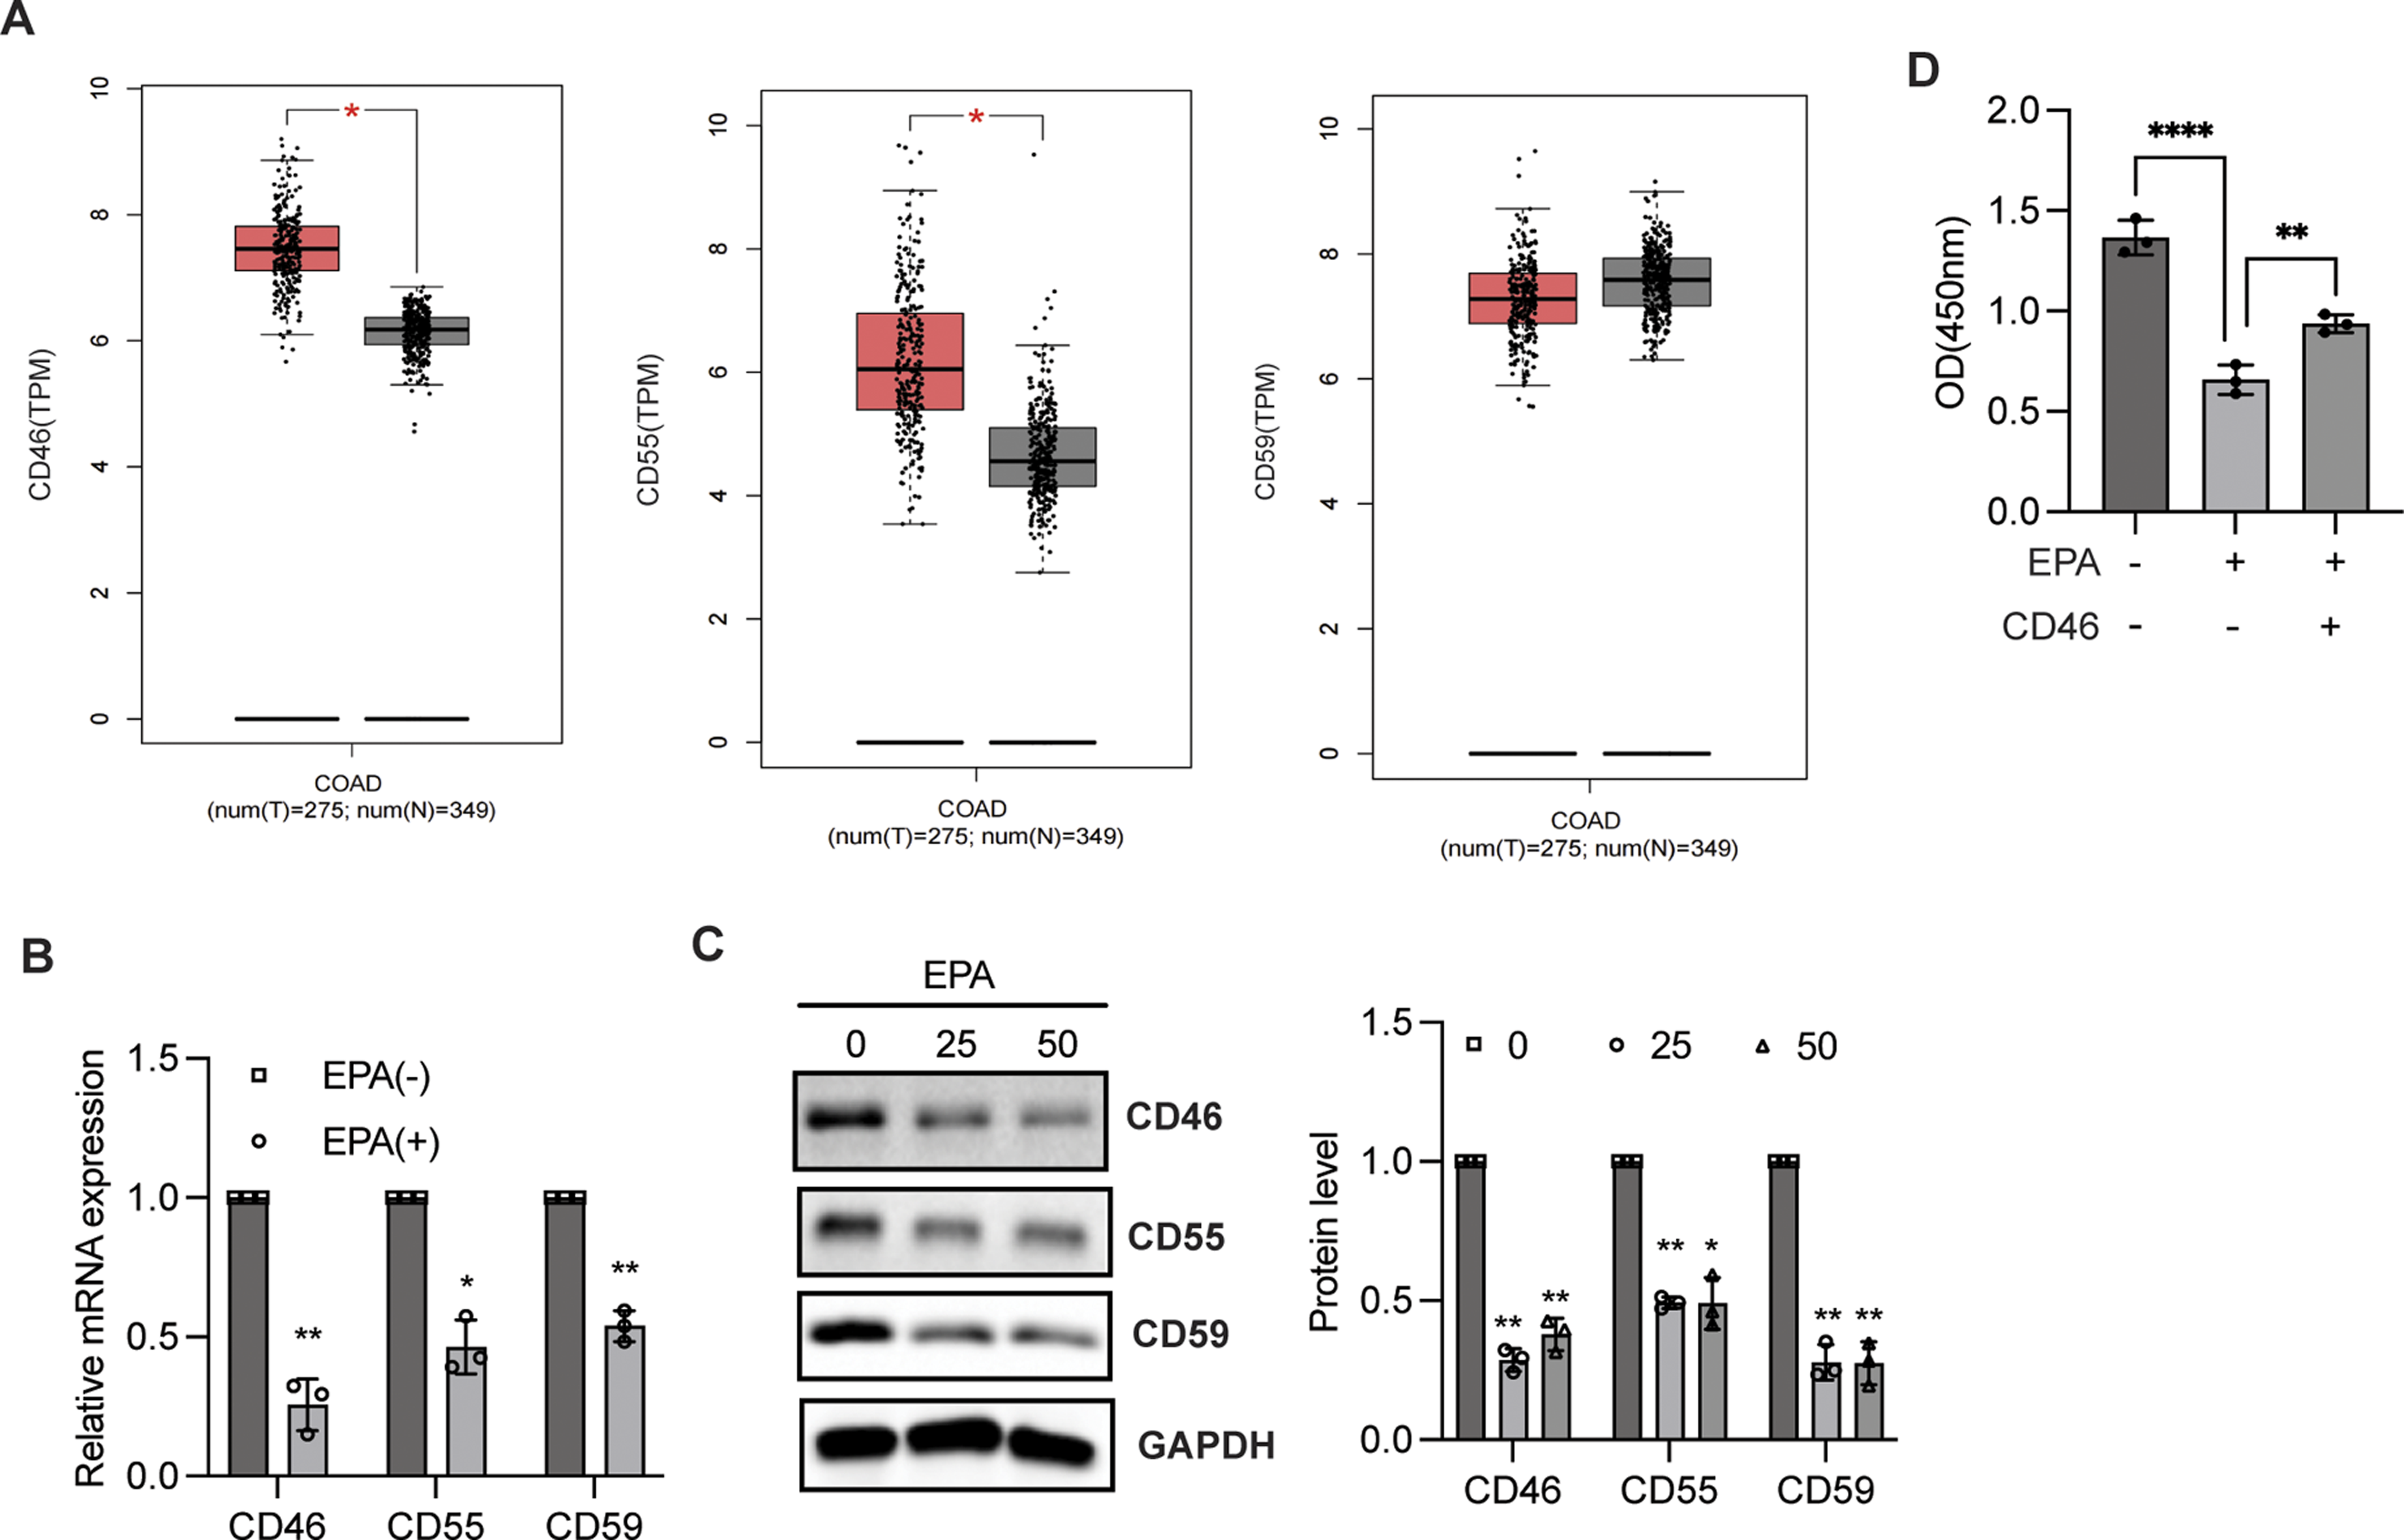
EPA Downregulates CD46 Through STAT3
Next, we sought to elucidate the mechanism underlying EPA-mediated CD46 expression. Previous work by Zhang et al. showed that STAT3 directly initiates CD46 transactivation.17,29 We therefore hypothesized that EPA inhibits CD46 expression through STAT3. A dual-luciferase reporter assay was conducted to test this hypothesis. We found that EPA suppressed CD46 transactivation, and this effect was reversed by ectopic expression of STAT3 (Figure 3A). Moreover, ChIP analysis with anti-STAT3 indicated that EPA reduced the binding ability of STAT3 to the CD46 promoter (Figure 3B and C), indicating that STAT3 is critical for EPA-mediated CD46 expression. In addition, STAT3 overexpression largely attenuated the inhibitory effect of EPA on CD46 expression (Figure 3D). Collectively, EPA suppresses CD46 expression through STAT3. STAT3 was required for EPA-mediated CD46 expression. (A) A luciferase experiment was conducted in HEK293 cells treated with or without EPA for 24 h after transfection with pCDNA 3.1 or STAT3 together with the CD46 promoter and Renilla. RLU was presented as the mean ± SD and quantified by two-way analysis of variance (ANOVA) with multiple comparisons followed by Bonferroni post hoc test; *P < 0.05, **P < 0.01. (B) Analysis of the binding site of STAT3 (in red) in the promoter of CD46 using UCSC software and Jaspar analysis. (C) ChIP combined with qPCR analysis of the binding of STAT3 to CD46 promoter in HT29 cells in response to EPA stimulation for 1 h. Two-way ANOVA with multiple comparisons followed by Bonferroni post hoc test was employed to determine significance; n = 3, **P < 0.01. (D) Immunoblotting analysis of indicated protein expression in HT29 cells treated with or without EPA combined with CD46 overexpression. Band intensity was measured and quantified by one-way ANOVA followed by Dunnett’s multiple comparisons test. Data are presented as the mean ± SD of 3 independent experiments. ****P < 0.0001, **P < 0.01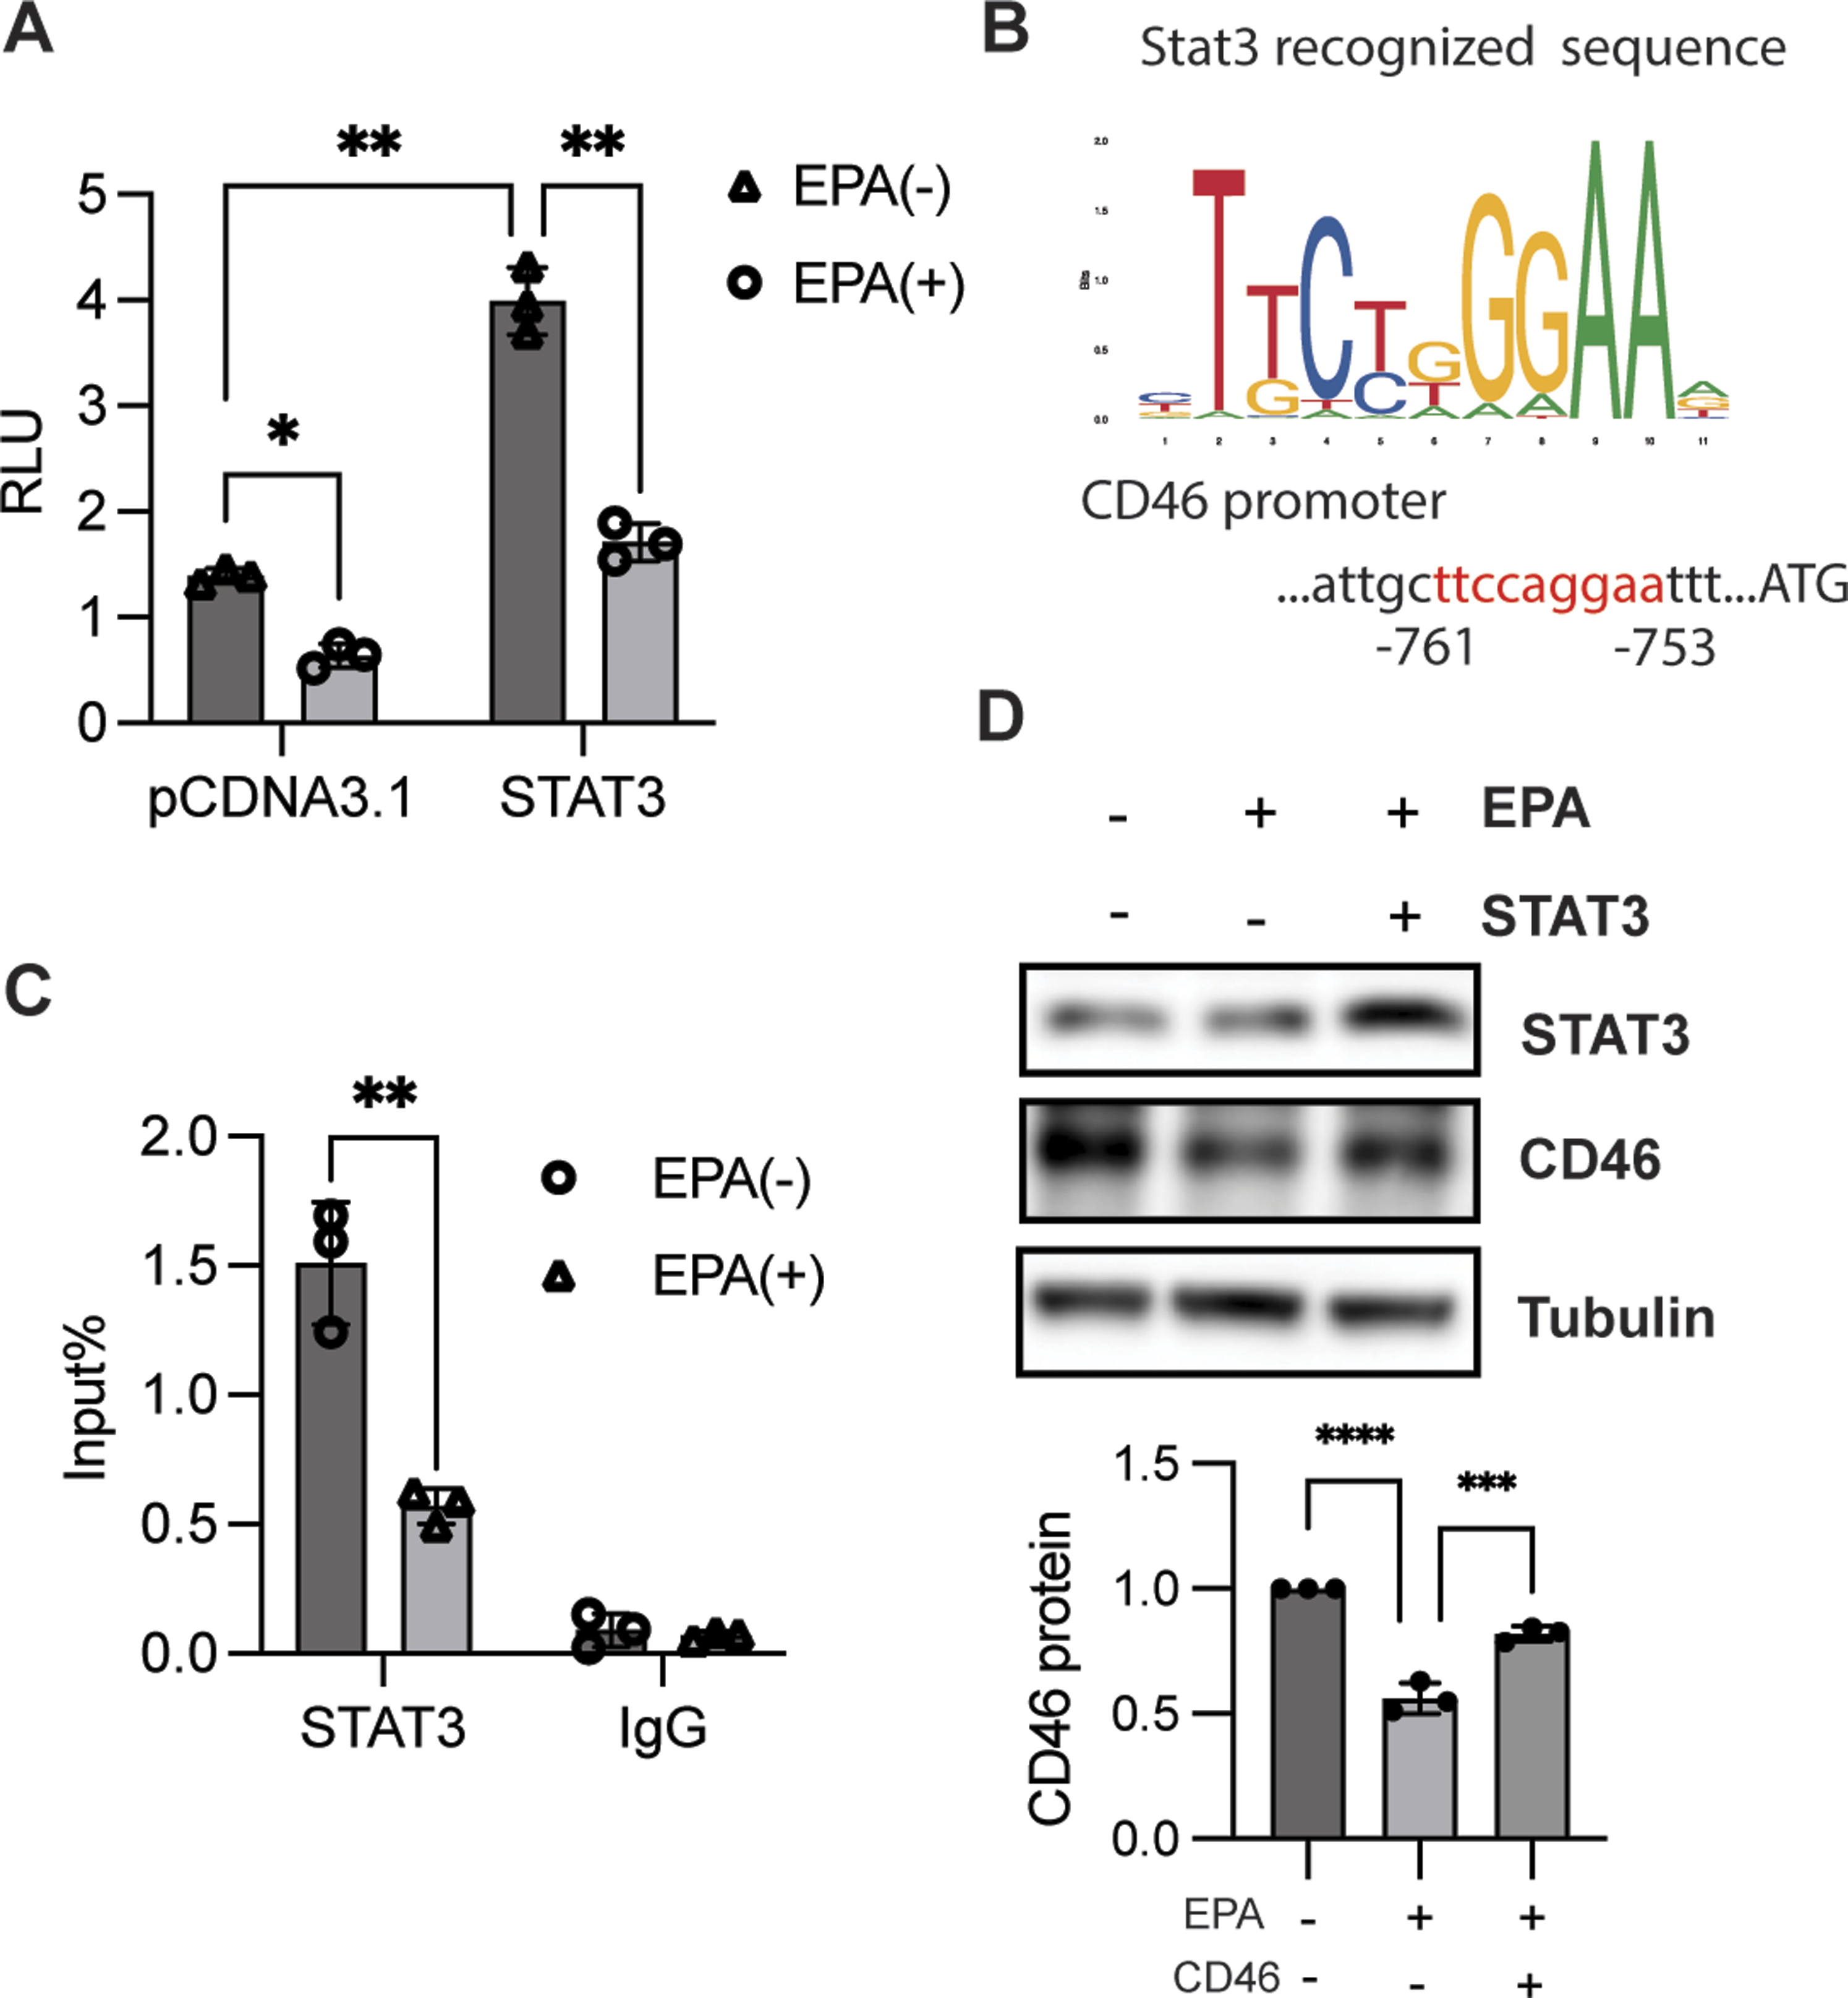
EPA Suppresses PKD/STAT3 Signaling
Previous studies have revealed that AKR1B1 inhibition could prevent PKC activation.12,30 In addition to studies showing that AKR1B1 interacts with STAT3 to activate STAT3 phosphorylation,31,32 STAT3 is a downstream transcription factor of the PKC/PKD family that regulates target gene transactivation. These observations prompted us to explore the potential mechanism whereby EPA modulates STAT3 phosphorylation. We found that PKD3 expression was positively correlated with STAT3 expression based on analysis of colon adenocarcinoma from GEPIA (Figure 4A). Multiple studies have revealed that PKD3/STAT3 is critical for tumor development,
33
which prompted us to evaluate the influence of EPA on PKD/STAT3 signaling. In comparison with the control group, EPA treatment in colorectal cancer cells decreased PKD phosphorylation and STAT3 activation. No significant difference was observed in basal PKD3 and STAT3 expression, respectively (Figure 4B), indicating that EPA suppressed PKD3/STAT3 signaling. Moreover, activation of PKD by PMA largely blocked the reduced CD46 transactivation caused by EPA (Figure 4C). Taken together, EPA downregulates PKD3/STAT3-dependent CD46 transactivation. EPA suppressed STAT3 phosphorylation through PKD. (A) Analysis of the relationship between PKD3 and STAT3 in colon adenocarcinoma from GEPIA. (B) Immunoblotting was performed to assess the expression of indicated proteins in HT29 cells in the presence or absence of EPA for 1 h. Band intensity was quantified and analyzed using a one-sample t test. Data are presented as the mean ± SD from 3 independent experiments; **P < 0.01. (C) Luciferase assay in HT29 cells was conducted to determine PKD activation by PMA combined with stimulation with or without EPA for 48 h. Data are presented as the mean ± SD from 3 independent experiments and analyzed using a two-sample t test; n = 3, ***P < 0.001, ****P < 0.0001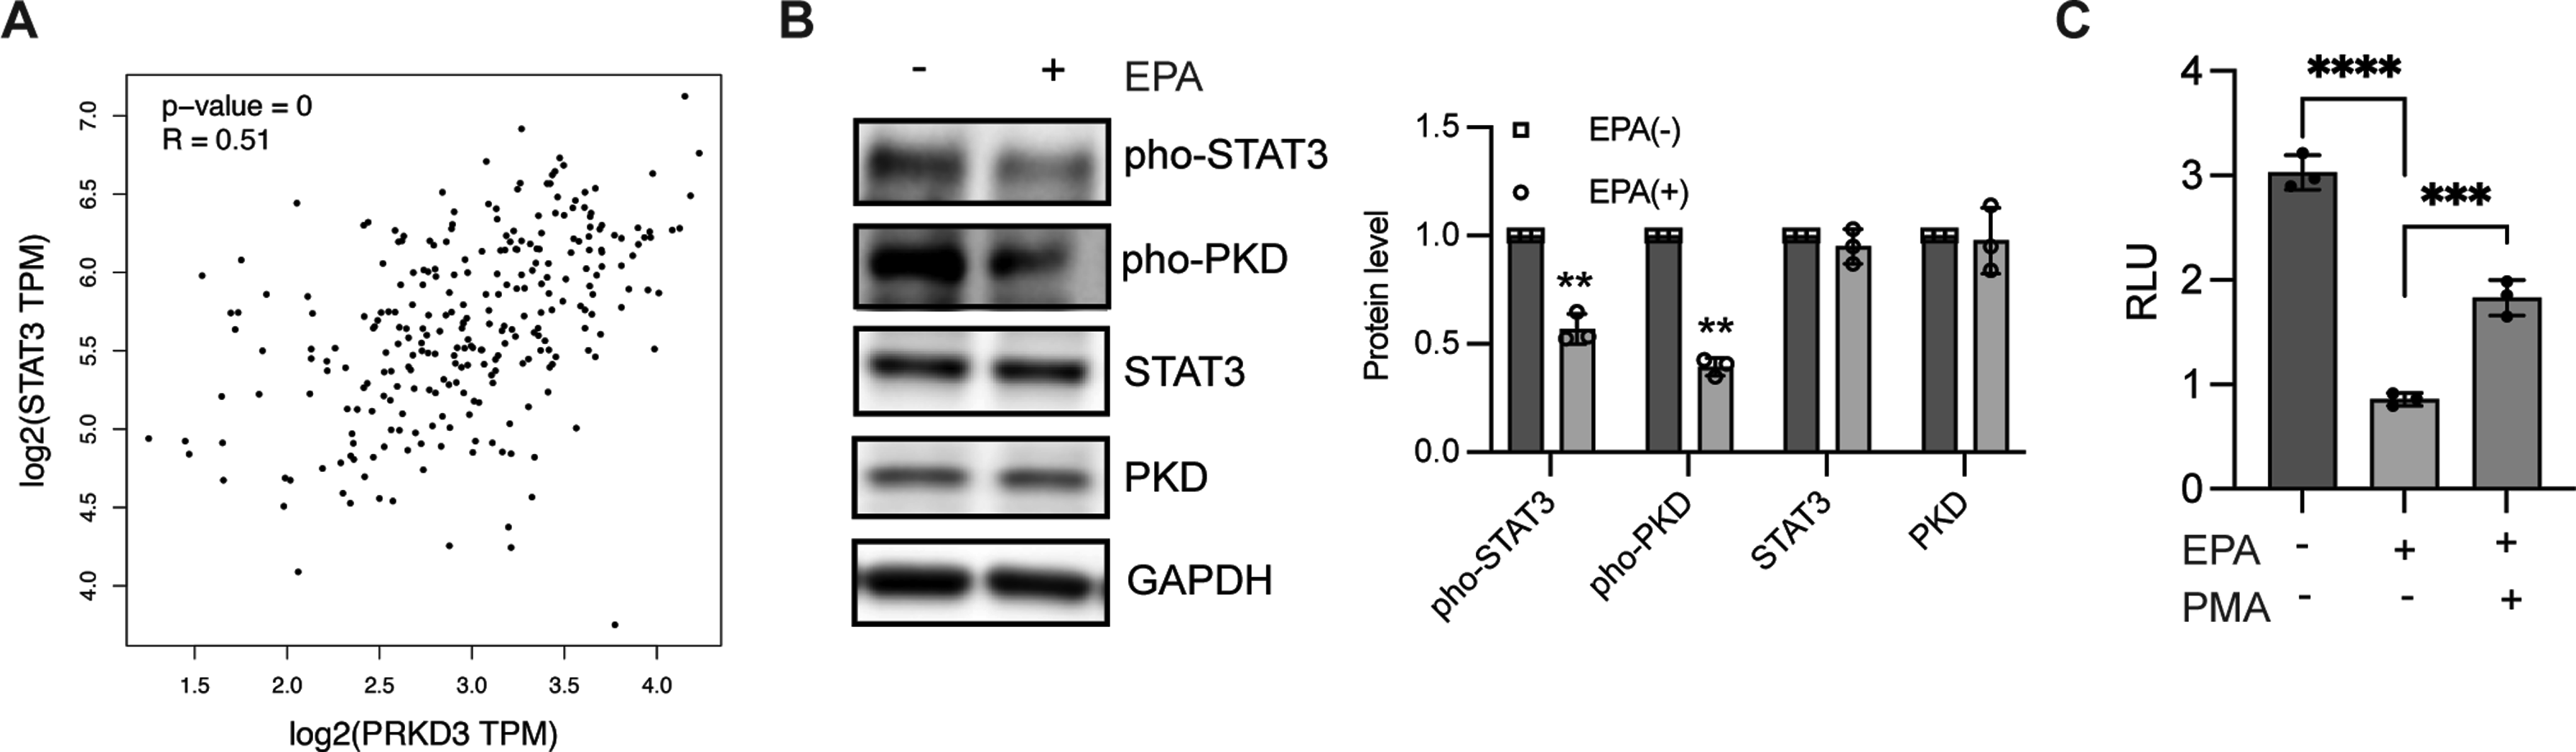
Discussion
In addition to its role in improving diabetic peripheral neuropathy, 34 EPA significantly inhibits tumor progression, endotoxemia, sepsis, and inflammatory diseases through various mechanisms.35-38 Previous work has revealed that AKR1B1 knockout, frequently observed in many types of cancers, inhibits cell proliferation, migration, and invasion. 11 In this study, we further demonstrated a novel pharmacological role of EPA in suppressing cell proliferation in tumor cells through CDC, which is associated with the reduced expression of CD46/CD55/CD59. This study expands functional understanding of EPA and provides novel insights supporting its anti-tumor potential.
Avoidance of CDC is critical for tumor cell survival and immune escape, especially in malignant tumors. The present results demonstrate that CD46, CD55, and CD59 expression is reduced in colorectal cancer cells after EPA stimulation, contributing to the suppression of tumor cell proliferation. The present results demonstrate that CD46 can activate PI3K/AKT/mTOR to promote glycolysis, 39 anti-apoptosis, 40 and autophagy. 41 CD55, enhanced in various cancers, 13 was shown to remodel the immunosuppressive microenvironment through regulation of T-cell immunity. 42 Moreover, to inhibit MAC formation, CD59 was found to induce M2 macrophages and suppress cytotoxic T-cell activity. 43 Thus, EPA suppresses colorectal cancer cell proliferation through CRP-mediated CDC or non-complement-dependent pathways. However, further investigation is required to clarify the potential role of EPA in tumor cell-cycle regulation and its effect on tumor cell survival and resistance to chemotherapy or radiotherapy.
EPA has been shown to bind KEAP1 and promote the activation of the Nrf2 signaling pathway, 44 while STAT3 45 has been confirmed to regulate CD46 and SLC7A11 expression. Notably, we found that EPA inhibits PKD/STAT3 signaling to reduce CD46 transactivation. However, further analysis is required to identify which PKD isoform mediates EPA-induced STAT3 phosphorylation and to explore how EPA modulates PKD phosphorylation, including whether PKC-dependent or -independent mechanisms are involved in EPA-regulated PKD activation. Moreover, the effect of EPA on PKD/STAT3 remains to be demonstrated in future work. In conclusion, this study presents a novel mechanism of EPA-mediated CDC leading to inhibition of cell proliferation through the PKD/STAT3 pathway. This further supports the anti-tumor effects of EPA and provides a more comprehensive understanding of its pharmacological function in complement-related diseases.
Footnotes
Author Contributions
DXP contributed to conception and design, data analysis and interpretation, drafting of the manuscript, and critical revision of the manuscript. YDC contributed to data acquisition, data analysis and interpretation, drafting of the manuscript, and the critical revision of the manuscript. YXX, ZSY, NZ, and LPZ contributed to data acquisition and analysis and critically revised the manuscript. ZCH contributed to the conception and design of the study, data interpretation, drafting of the manuscript, and critical revision of the manuscript. All authors provided final approval and agree to be accountable for all aspects of the work.
Funding
The authors disclosed receipt of the following financial support for the research, authorship, and/or publication of this article: This study is supported by Guangdong Province Medical Science and Technology Research Fund Project (No. B2022039).
Declaration of Conflicting Interests
The authors declared no potential conflicts of interest with respect to the research, authorship, and/or publication of this article.
Data Availability Statement
The data generated in the present study are included in the figures and/or tables of this article.