
Abstract
Background
Ulcerative colitis (UC) is a chronic inflammatory disease of the large intestine. There are different studies about the role and the diagnostic utility of Galectin-1 (Gal-1) and Netrin-1 (Net-1) in multiple diseases such as diabetes, liver and heart diseases as well as brain and colonic cancer where they used to highlight the relationship between the inflammatory process and the disease pathogenesis. The present study aimed to evaluate their role as biomarkers for UC.
Methods
This case-control study included a total of 90 subjects where 60 UC patients including newly diagnosed and previously diagnosed cases were gathered and compared to 30 healthy controls, the sample collection done at the Gastroenterology and Hepatology Hospital in Basrah, Iraq. Serum levels of Gal-1 and Net-1 were measured via ELISA kits, and diagnostic accuracy was assessed using one-way ANOVA and Receiver Operating Characteristic (ROC) curve analysis.
Results
The mean levels of Gal-1 and Net-1 were significantly elevated in the newly diagnosed UC group compared to the previously diagnosed group and healthy controls. ROC analysis demonstrated excellent diagnostic accuracy for both biomarkers, with area under the curve (AUC) values of 0.90 for Gal-1 and 0.96 for Net-1. Optimal cut-off points for distinguishing UC patients from healthy controls were 2.850 ng/mL for Gal-1 and 903.5 pg/mL for Net-1.
Conclusion
Serum Gal-1 and Net-1 exhibit high diagnostic accuracy in differentiating UC patients from healthy individuals, suggesting their potential as promising biomarkers for UC diagnosis. Further studies are needed to validate these findings and explore their clinical applicability.
Introduction
Ulcerative colitis (UC) is a chronic, idiopathic inflammatory disease of the colon, classified by the World Health Organization (WHO) as an intractable disease due to its persistent and uncontrolled nature. The disease typically begins in the rectum and may extend proximally to involve the entire colon, sparing the small intestine. 1 Although no definitive cure exists for UC, the primary goal of disease management is to control inflammation and reduce the risk of complications. 2 The clinical presentation of UC is characterized by fluctuating symptoms, including abdominal pain, fever, increased frequency of bloody stools, and poor response to treatment, which may ultimately necessitate surgical intervention, such as colectomy. 3
Disease activity in UC is commonly assessed using various scoring systems, among which the Simple Clinical Colitis Activity Index (SCCAI) is widely utilized due to its simplicity, reliance on patient-reported questionnaires, and lack of requirement for laboratory parameters. 4 In addition to clinical scoring systems, inflammatory biomarkers such as elevated C-reactive protein (CRP), erythrocyte sedimentation rate (ESR), low hemoglobin (Hb), and low serum albumin levels are frequently used to evaluate disease activity. However, there is ongoing research to identify more specific and reliable biomarkers for UC. 5
Galectin-1 (Gal-1) is known for its anti-inflammatory and antioxidant involvement especially in in UC pathogenesis, it is upregulated by regulatory T cells (CD4+CD25+) 6 and exhibits anti-inflammatory properties that lead to the induction of T-cell apoptosis (particularly Th1 and Th17 cells) and the suppression of pro-inflammatory cytokines such as interleukin-1 beta (IL-1β), IL-12, and tumor necrosis factor-alpha (TNF-α). 7 Studies have shown that Gal-1 expression is significantly upregulated in inflamed tissues compared to normal tissues, suggesting its role in mitigating inflammation and promoting the epithelial cell proliferation that facilitate colonic mucosal healing. 8 In dextrose sulfate sodium (DSS)- induced colitis models in animals the studies reported a reduction in the disease activity index (DAI), and lower levels of TNF-α, and less oxidative stress markers while the level of anti-inflammatory IL-10 seemed to be higher, all these results made galectins as potential therapeutic targets.6,9
In humans, the netrin family includes Netrin-1, -2, -3, -4, and Netrin G-1 and G-2 initially identified for their role in axonal guidance and cell migration during neuronal development. 10 Beyond the nervous system, Net-1 plays critical roles in tissue morphogenesis, angiogenesis, and tumorigenesis, where it acts as an anti-apoptotic survival factor. In the gastrointestinal tract, Net-1 maintains mucosal integrity and facilitates tissue renewal where low levels are associated with increased apoptosis and cell shedding. 11 In the experimental colitis, the animals with Net-1 deficiency reported more sever disease and less mucosal integrity. 12 Some studies reported that low-doses of Net-1 may suppresses neutrophil migration leading to control colonic inflammation. 13
The aim of this study was to investigate the diagnostic potential of serum Gal-1 and Net-1 as biomarkers for UC, through measuring their levels in UC patients (both newly and previously diagnosed individuals) and comparing the levels with healthy controls. Additionally, in order to evaluate the diagnostic accuracy of these biomarkers in distinguishing UC patients from healthy subjects, a receiver operating characteristic (ROC) analysis was used. This study fills critical gaps in UC biomarker research by validating novel serum markers (Gal-1 and Net-1) with high diagnostic accuracy, providing population-specific data, and offering mechanistic insights. These findings pave the way for non-invasive, regionally adaptable diagnostic tools, addressing unmet needs in global IBD management.
Methods
A case-control study was conducted at the Gastroenterology and Hepatology Hospital in Basrah, Iraq, following ethical approval of the study protocol by the College of Dentistry at the University of Baghdad. A total of 90 participants were voluntarily enrolled in the study between May 2022 and November 2022. Participants were divided into divided into two groups; control group (30 subjects) and patients’ group, then Patients group was divided into two subgroups: 30 previously diagnosed UC patients who were under treatment with azathioprine (Imuran, 50–150 mg/day) and mesalazine (Pentasa, 1–3 g/day), as prescribed by a specialized gastroenterologist; and 30 newly diagnosed UC patients confirmed by colonoscopy prior to initiating therapy.
Inclusion criteria for the study comprised patients aged 18 years or older (as the distinctive age for accomplishing authorized adulthood in most countries is 18) who were either previously diagnosed with UC by a gastroenterologist and on treatment or newly diagnosed patients with confirmed UC based on colonoscopy findings. Exclusion criteria included individuals under 18 years of age (due to distinguished variances in the diagnosis and treatment approaches of UC between adults and pediatric patients, primarily in disease extent and severity), pregnant women, those diagnosed with other autoimmune diseases or any type of cancer, and individuals with known systemic inflammatory or infectious diseases.
After obtaining informed consent from all participants, a detailed medical history was collected, and the Simple Clinical Colitis Activity Index (SCCAI) was administered and scored for the 60 UC patients. Six milliliters of venous blood were drawn from each participant. Two milliliters were immediately transferred to Westergren-Katz tubes for erythrocyte sedimentation rate (ESR) testing, with results recorded after one hour. The remaining four milliliters were collected in gel tubes, centrifuged, and divided into two aliquots. One aliquot was used for biochemical analysis of C-reactive protein (CRP) and albumin levels on the same day of collection using a COBAS Integra 400 plus analyzer (Roche, Germany). The second aliquot was stored at −20°C for up to five months for subsequent measurement of serum Galectin-1 (Gal-1) and Netrin-1 (Net-1) levels using enzyme-linked immunosorbent assay (ELISA) kits (BT Lab, China; Cat. no. E2989Hu for Gal-1 and Cat. no. E1277Hu for Net-1).
Statistical analysis
The Kolmogorov-Smirnov test was employed to confirm that the distribution of the studied variables followed a normal distribution, as indicated by probability levels (P-values) greater than 0.05. Descriptive statistics, including mean, standard deviation, standard error, and 95% confidence intervals, were calculated for all variables. Inferential statistical analyses were performed using Levene's test for equality of variances and Games Howell test to compare mean values across the three independent groups. Additionally, Receiver Operating Characteristic (ROC) curve analysis was conducted to determine the optimal cut-off values for Gal-1 and Net-1 and to assess their diagnostic accuracy in distinguishing UC patients from healthy controls.
Results
General characteristics of participants
Table 1 displays the general characteristics (age and gender) of the patients and controls. In the newly diagnosed (ND) group, males slightly outnumbered females. A larger proportion of patients in both the previously diagnosed (PD) and ND groups were young, with 36.7% and 30% of participants aged 20–29 years, respectively. The distribution of participants across groups showed no statistically significant differences (P > 0.05).
Demographic characteristic among all study groups.
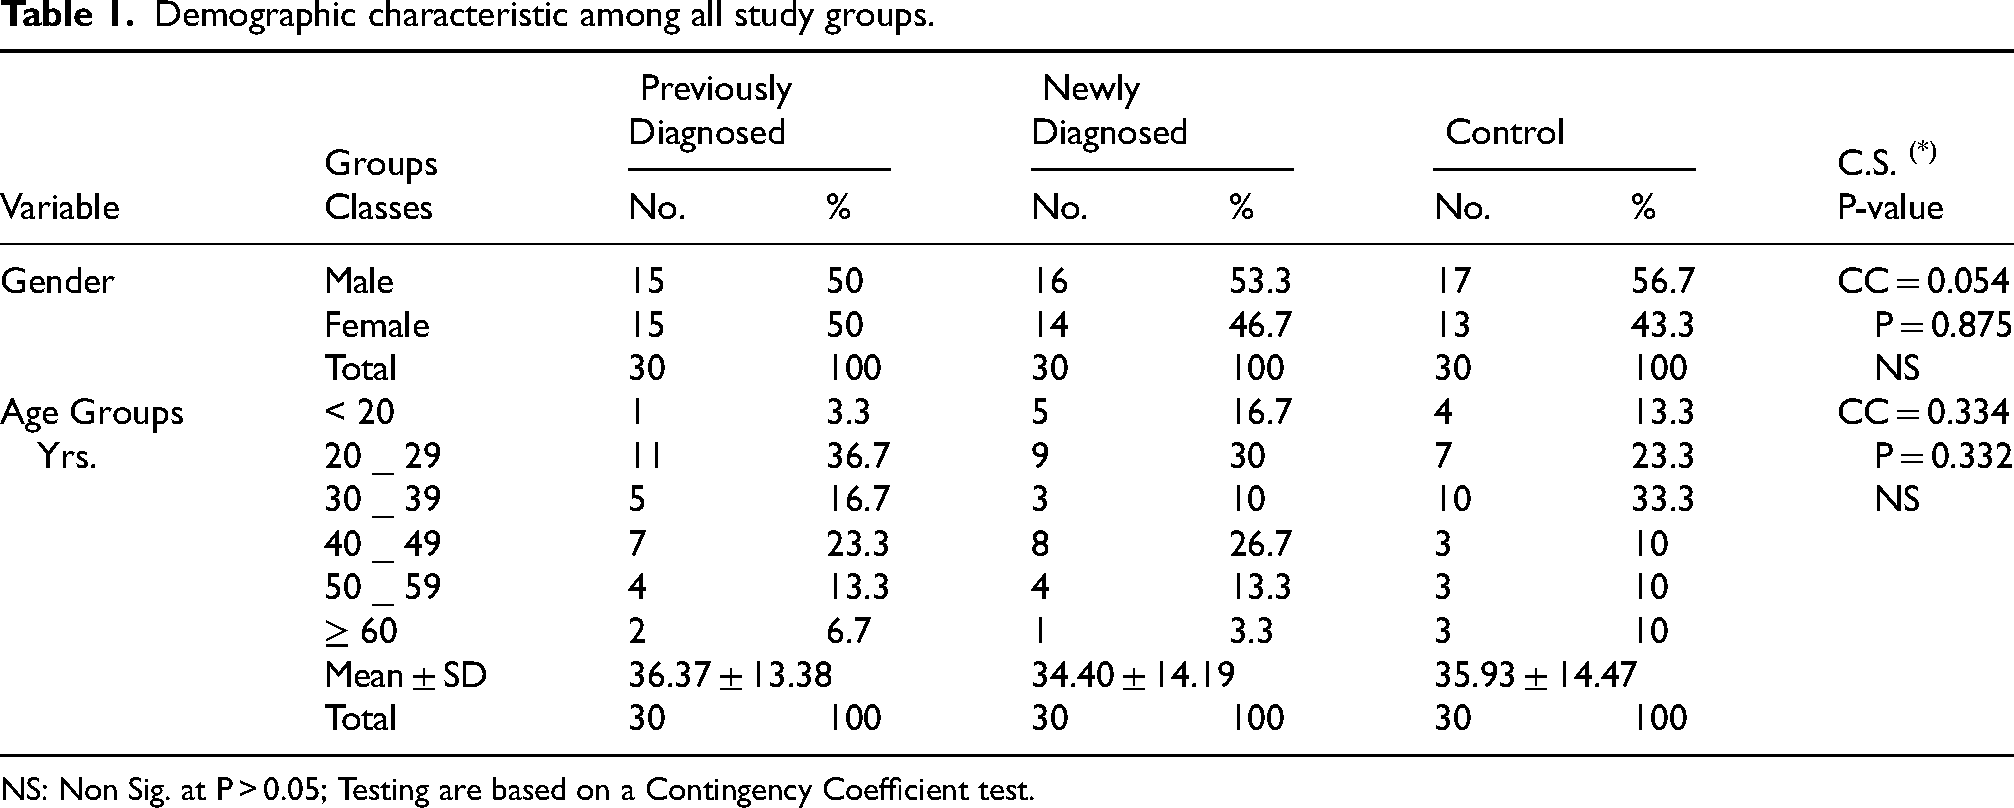
NS: Non Sig. at P > 0.05; Testing are based on a Contingency Coefficient test.
Descriptive summary of study markers
Table 2 presents the descriptive summary of the study markers. The readings for erythrocyte sedimentation rate (ESR), C-reactive protein (CRP), CRP/albumin ratio (CRP/Album%), Galectin-1 (Gal-1), and Netrin-1 (Net-1) were higher in the ND group compared to the controls and the PD group. Conversely, albumin levels were lowest in the ND group and hemoglobin (Hb) was the lowest in those previously diagnosed.
Summary statistics of laboratory markers distributed in different groups.
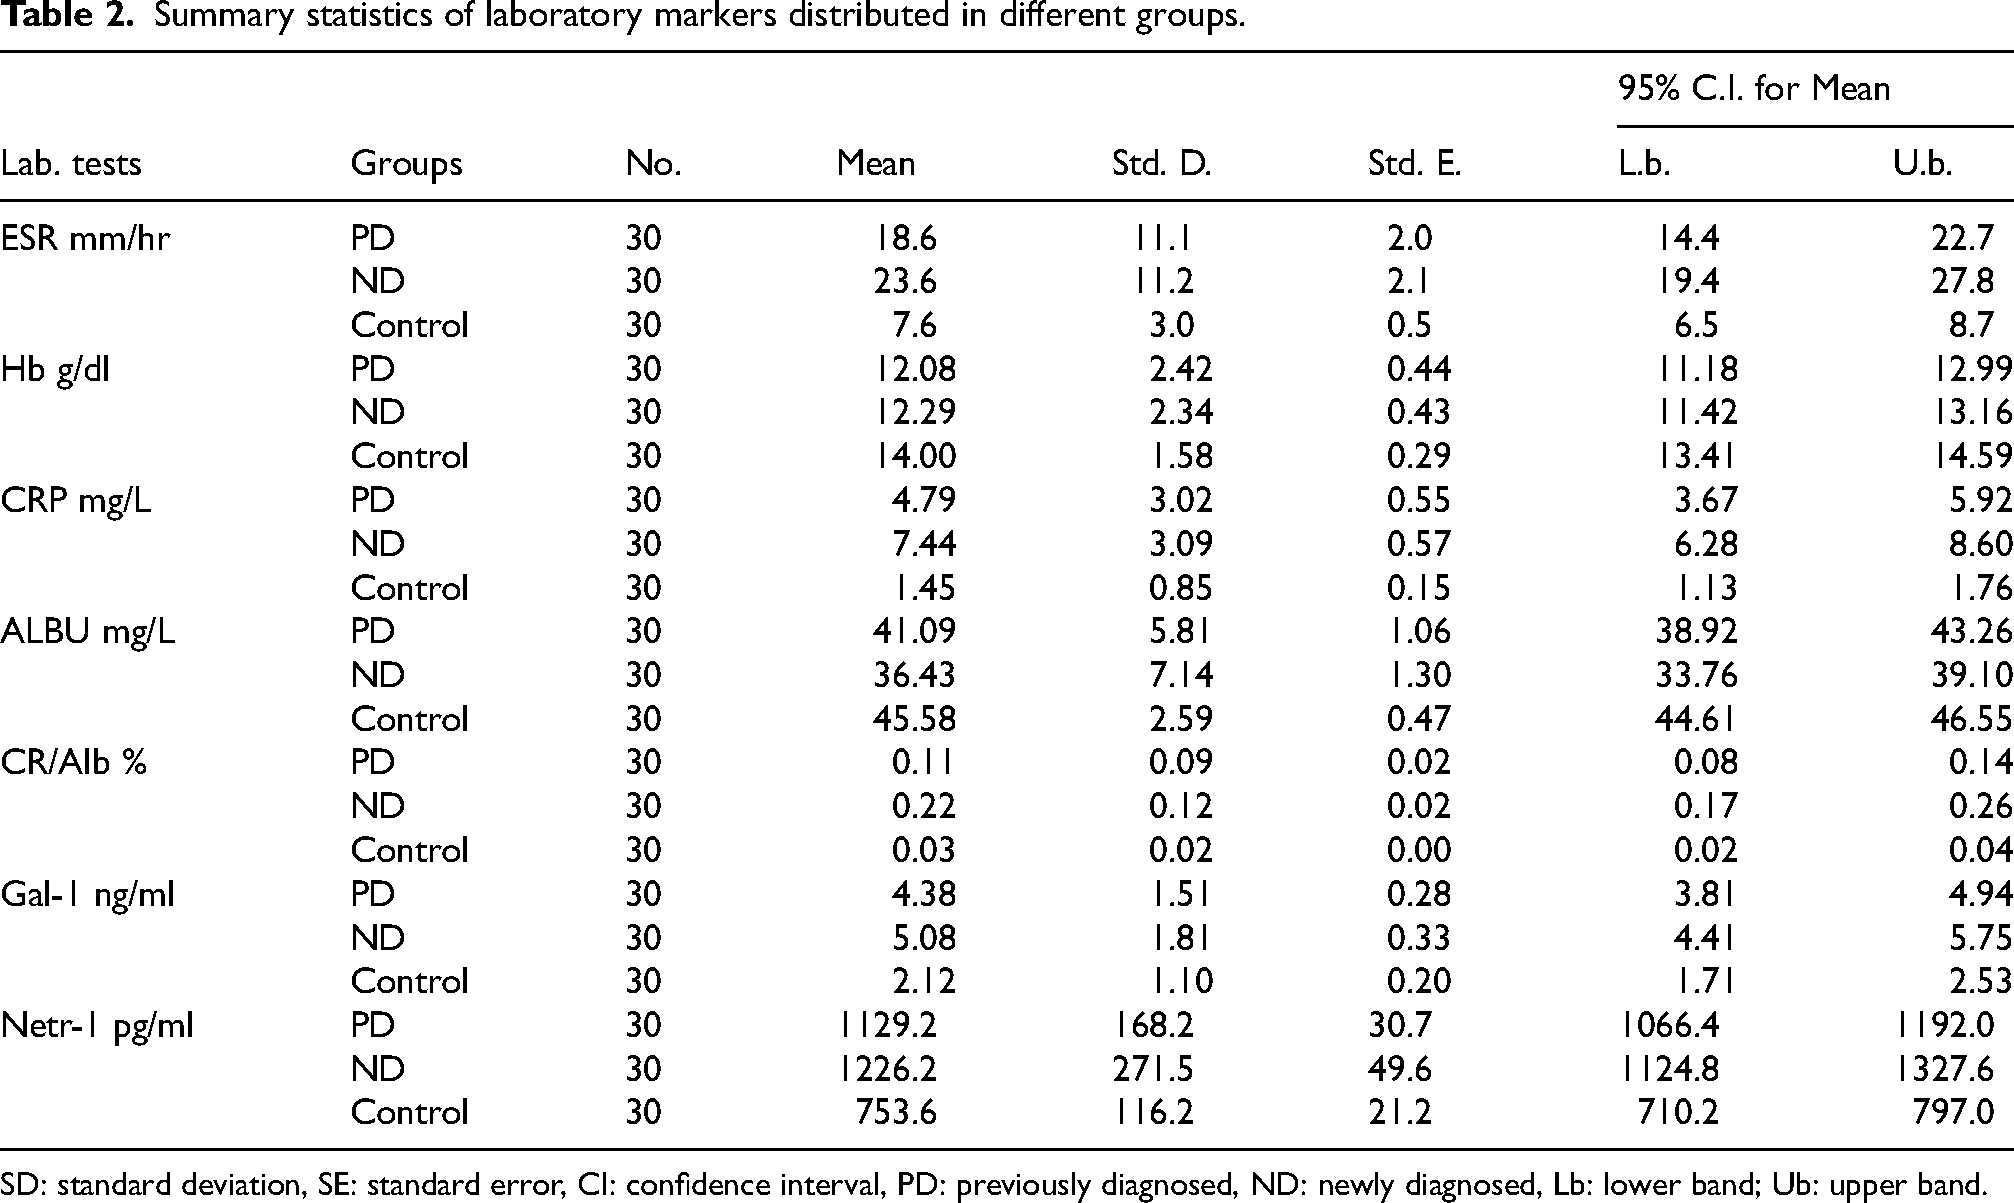
SD: standard deviation, SE: standard error, CI: confidence interval, PD: previously diagnosed, ND: newly diagnosed, Lb: lower band; Ub: upper band.
Statistical comparisons of markers
Table 3 highlights the results of pairwise comparisons for all markers. Significant and highly significant differences were observed among most pairwise comparisons, except for ESR, Gal-1, and Net-1 levels in the PD group compared to controls, which showed no statistical differences (P > 0.05) despite being higher than in healthy controls. Similarly, Hb levels were lower in the PD group compared to controls but did not reach statistical significance (P > 0.05).
Games-Howell pairwise comparisons among studied groups.
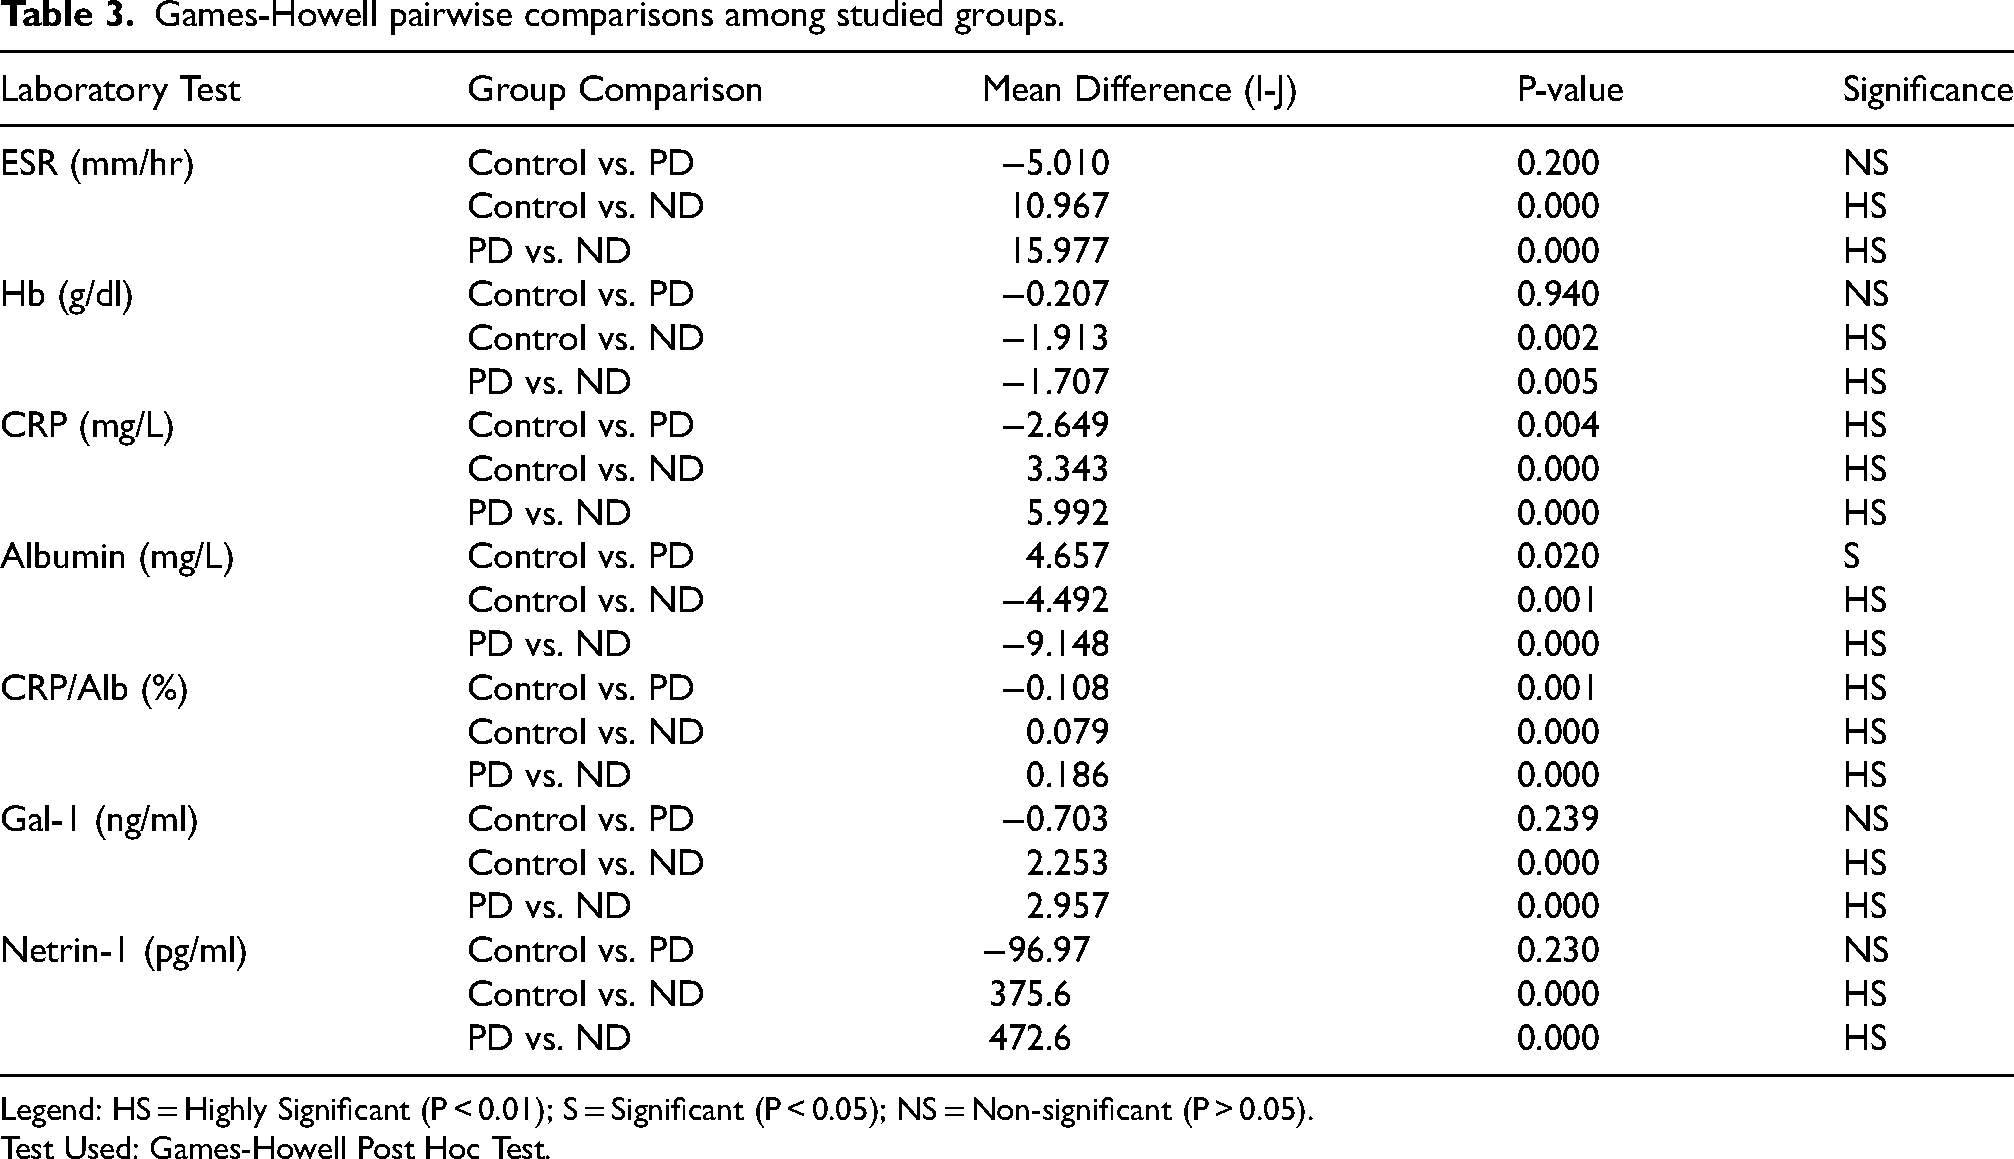
Legend: HS = Highly Significant (P < 0.01); S = Significant (P < 0.05); NS = Non-significant (P > 0.05).
Test Used: Games-Howell Post Hoc Test.
Receiver operating characteristic analysis
The Receiver Operating Characteristic (ROC) analysis is a valuable tool in clinical epidemiology for assessing the accuracy and validity of diagnostic tests and determining optimal cut-off values. 14 The area under the curve (AUC) is used to measure sensitivity and specificity, with values ranging from 0.5 (no discriminative ability) to 1 (perfect discriminative ability). AUC values are interpreted as follows: 50–60% = fail; 60–70% = poor; 70–80% = fair; 80–90% = good; 90–100% = excellent (El-Solh et al., 2020).
ROC analysis results
As shown in Table 4 and Figure 1, the diagnostic performance of the markers was ranked in descending order based on their ability to distinguish healthy individuals from PD or ND patients (i.e., larger AUC values). The ranking was as follows: Net-1, CRP, Gal-1, CRP/Album%, ESR, albumin, and Hb. Net-1, CRP, and Gal-1 demonstrated excellent diagnostic accuracy (AUC > 0.9), while Hb showed poor discriminative ability (AUC < 0.7). The CRP/albumin ratio exhibited excellent diagnostic performance compared to albumin alone, which showed only fair ability.
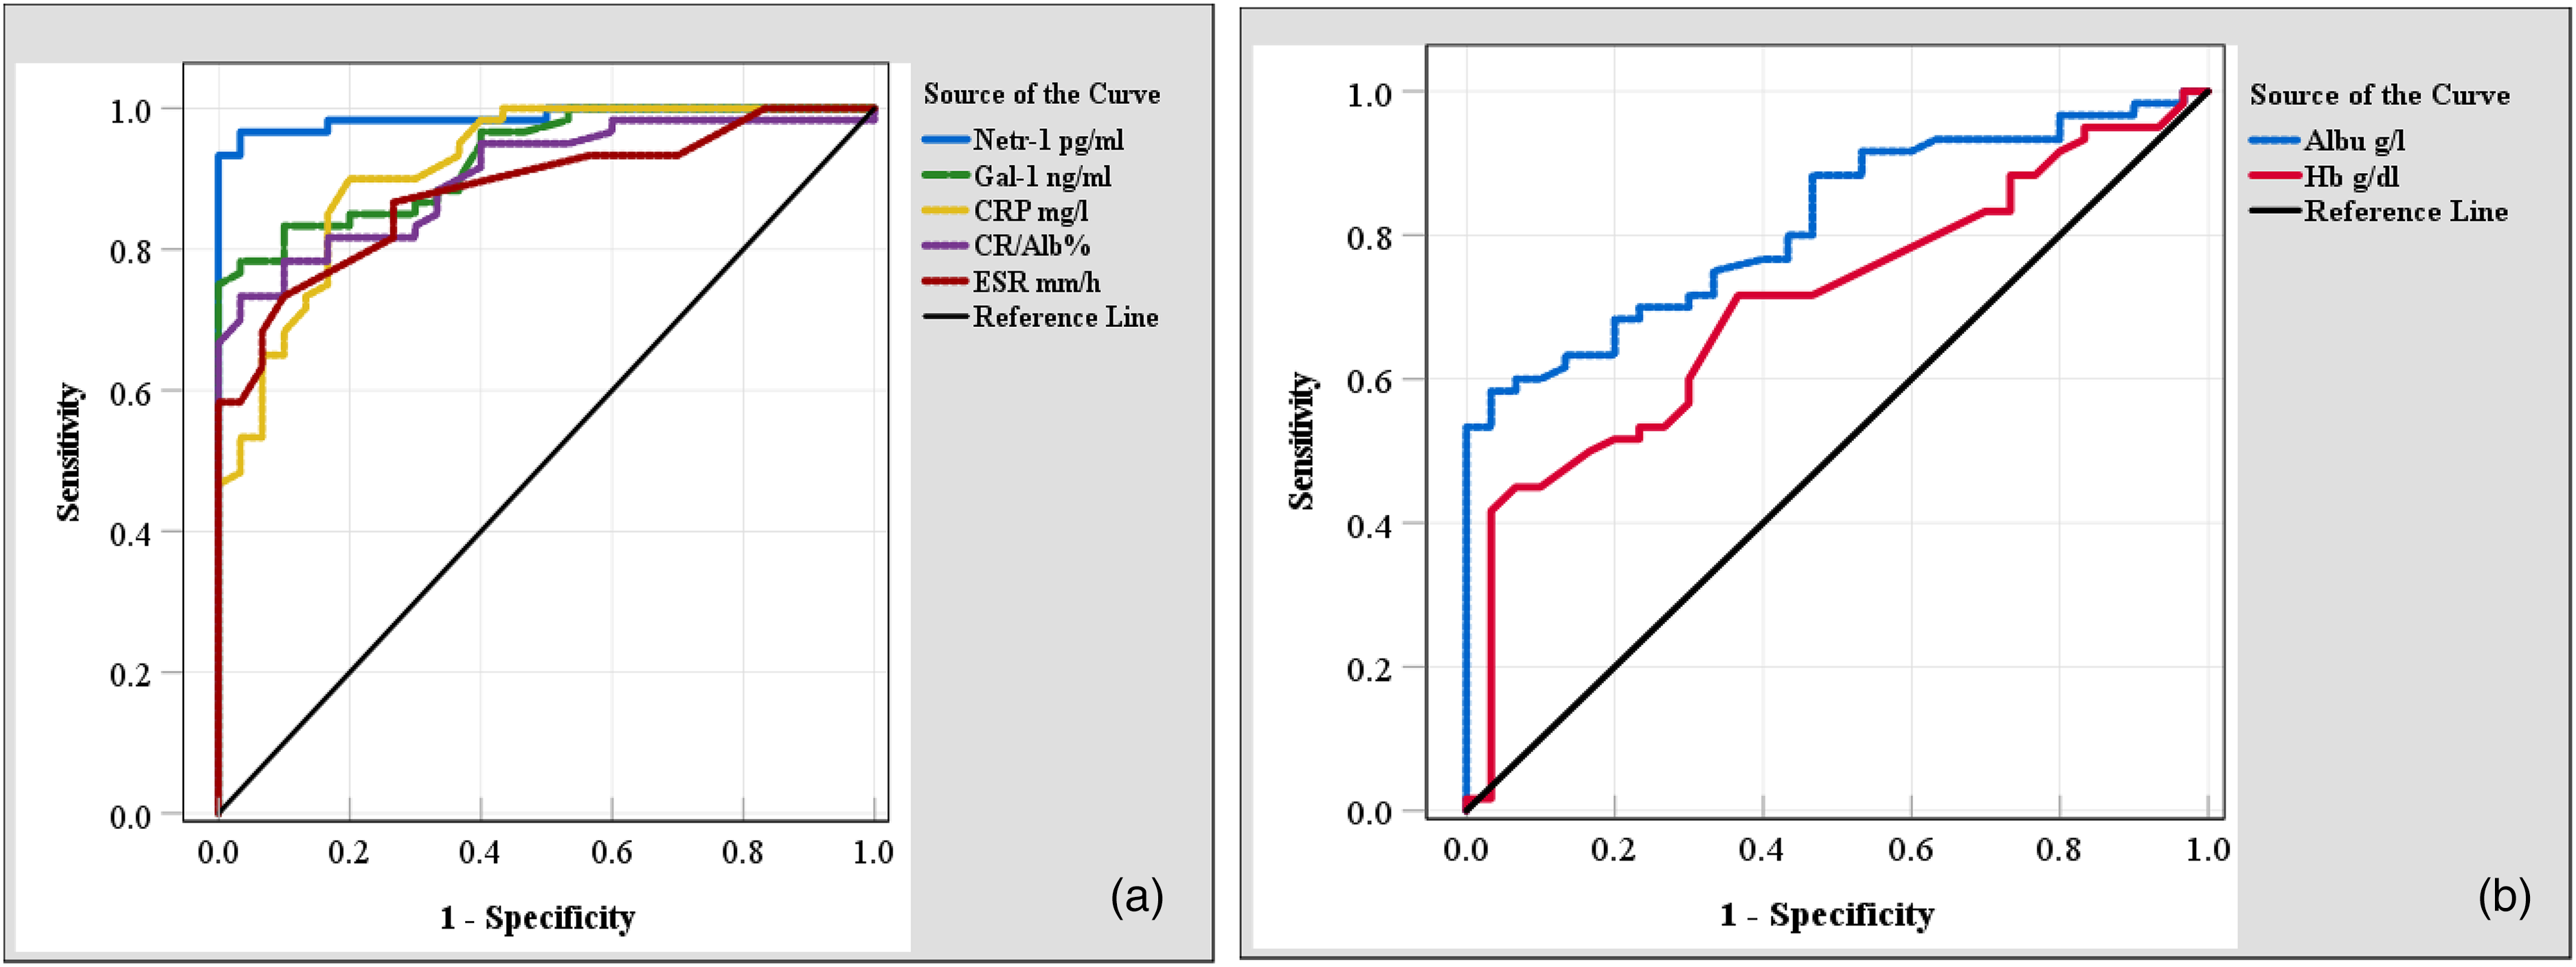
(a)-ROC curveplots for the markers that represent disease status in their larger readings (higher than normal), (b)- ROC curve plots for the markers that represent disease status in their smaller readings (lower than the normal).
ROC curve results for the studied laboratory markers between patients and controls.
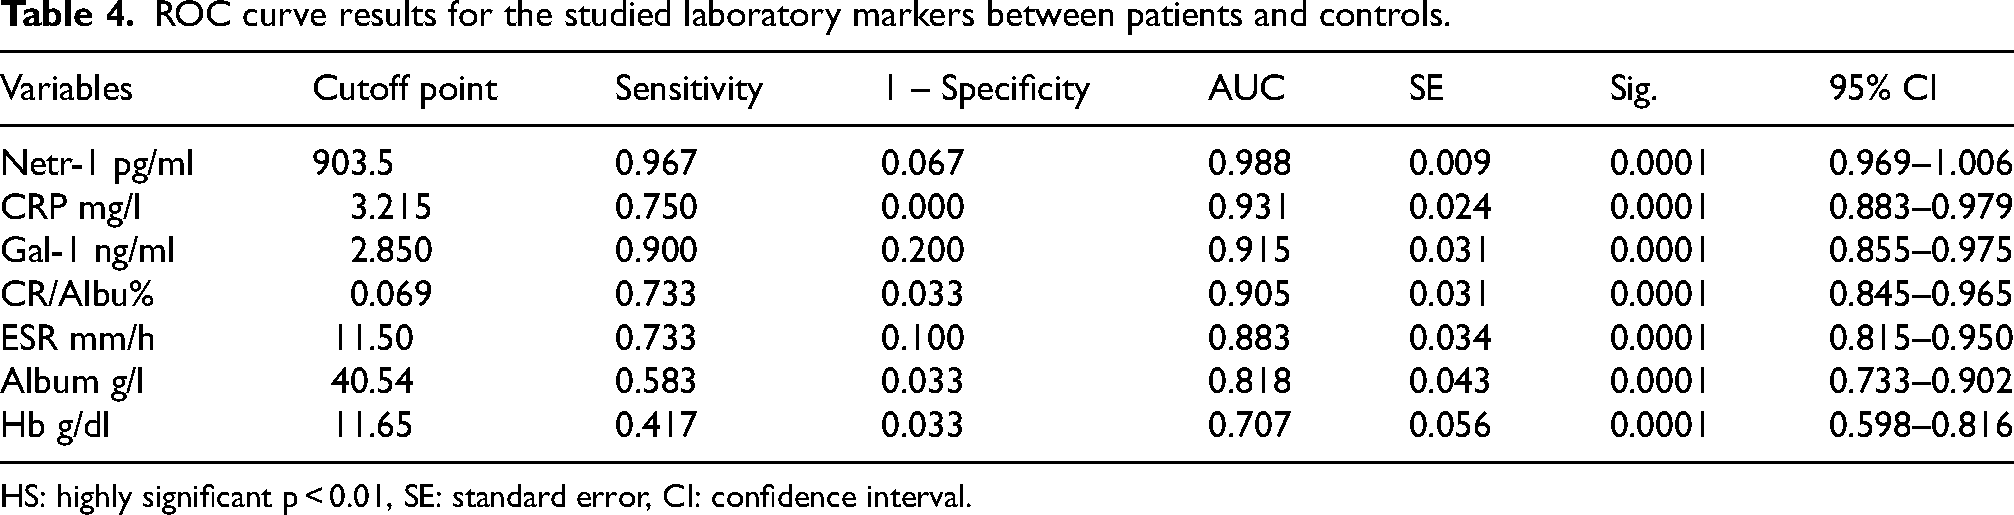
HS: highly significant p < 0.01, SE: standard error, CI: confidence interval.
Table 4 also provides the optimal cut-off values for each marker, representing the point that balances true positive identification with minimal false positives. The cut-off values were as follows:
Net-1: 903.5 pg/mL CRP: 3.215 mg/L Gal-1: 2.850 ng/mL CRP/Album%: 0.069 ESR: 11.50 mm/h Albumin: 40.54 g/L Hb: 11.65 g/dL
Differentiation between pd and nd states
Table 5 and Figure 2 illustrate the ability of the markers to differentiate between PD and ND states. The CRP/albumin ratio and CRP demonstrated fair discriminative ability (AUC < 0.8, lower sensitivity rates). In contrast, albumin, ESR, and Gal-1 showed poor ability to distinguish between the two groups. Net-1 and Hb were found to be ineffective in differentiating PD from ND states, this highlights the efficiency of the biomarkers under study to discriminate between patients and controls (more diagnostic ability) than in between the patients’ subgroups.
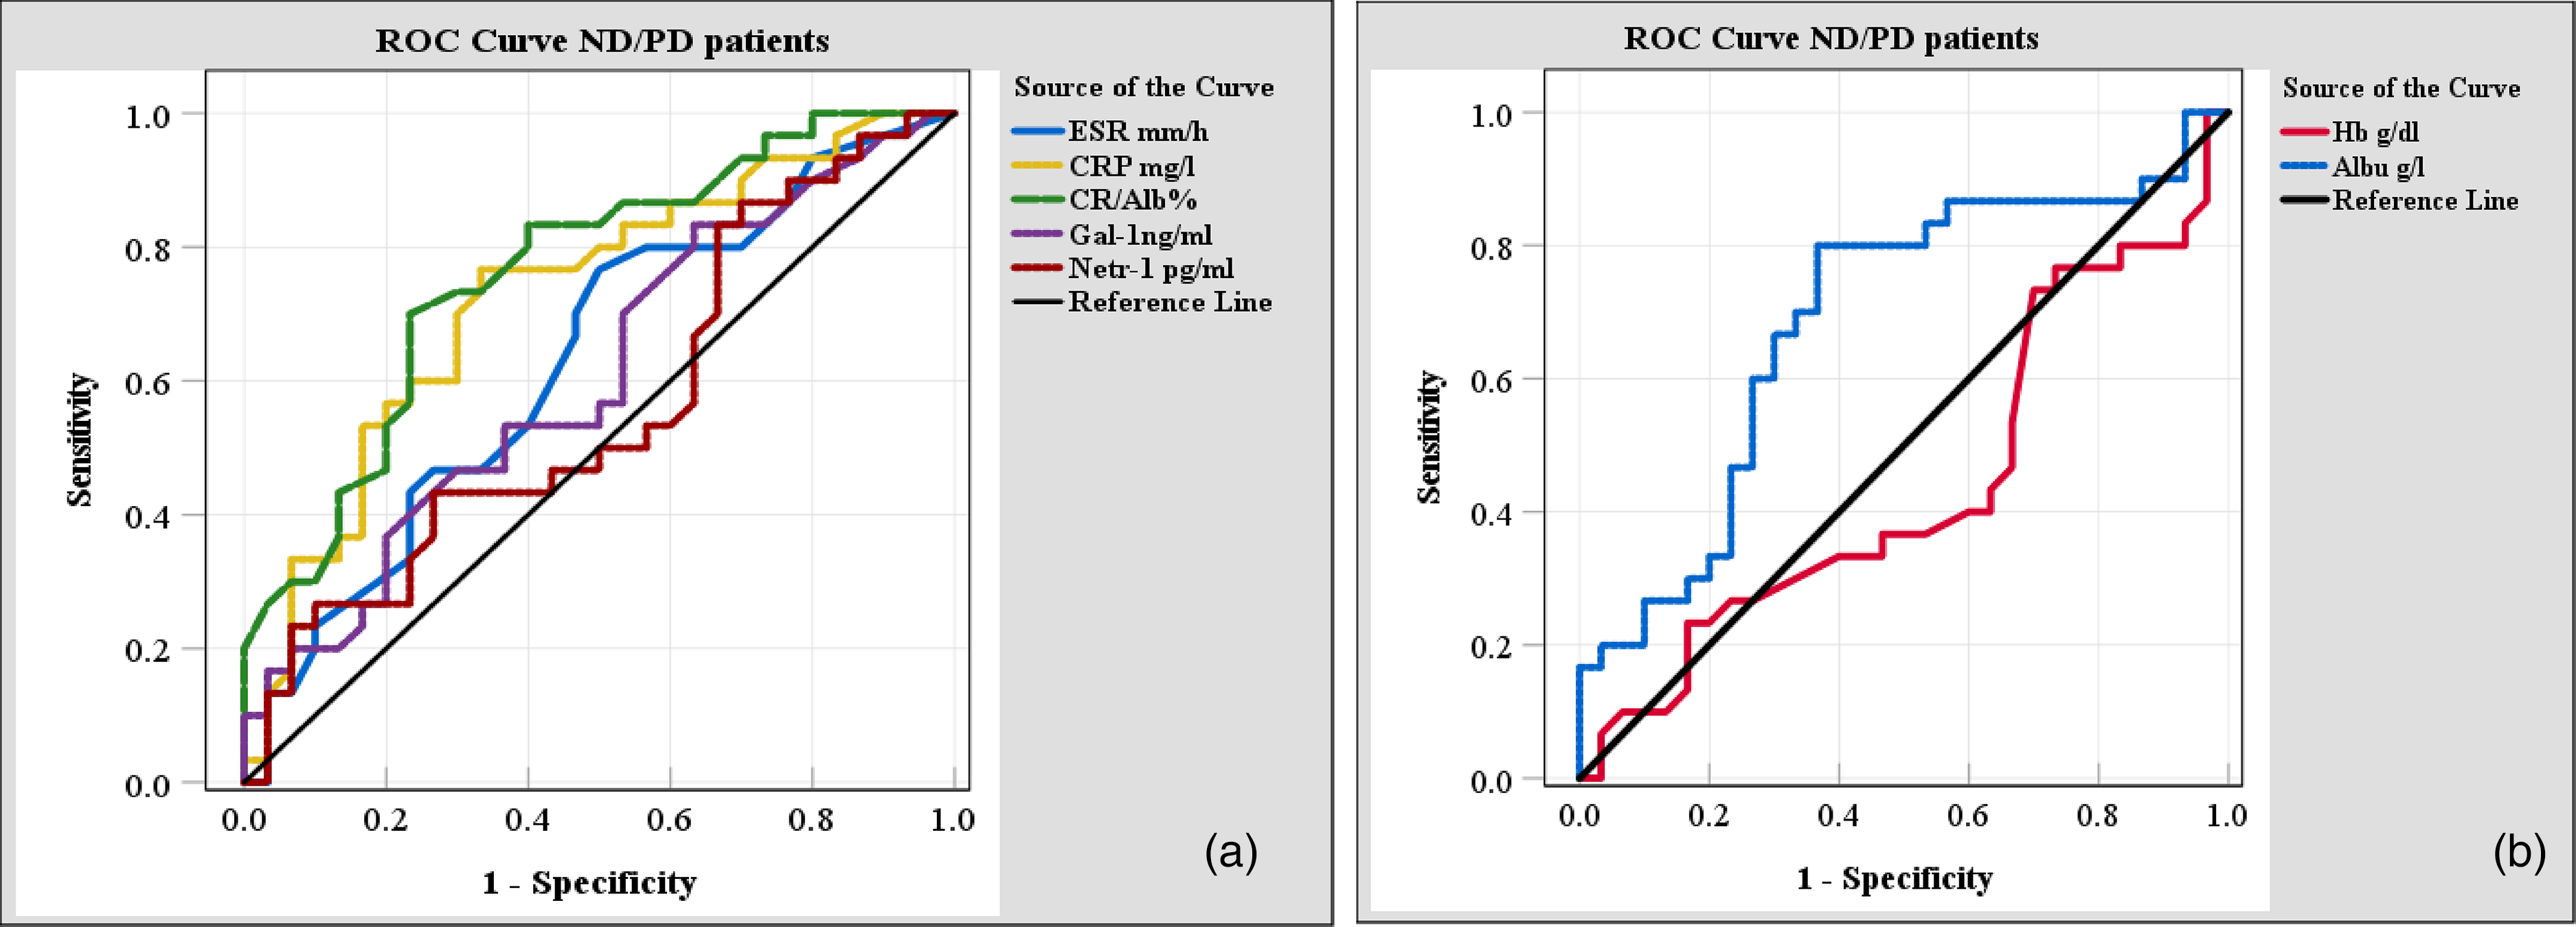
(a)-ROC curve plots for the markers that represent truly positive patients in their larger readings (Y-axis), (b)- ROC curve plots for the markers that represent truly positive patients in their smaller readings (Y-axis).
ROC curve results for the studied laboratory markers between the two groups of patients.
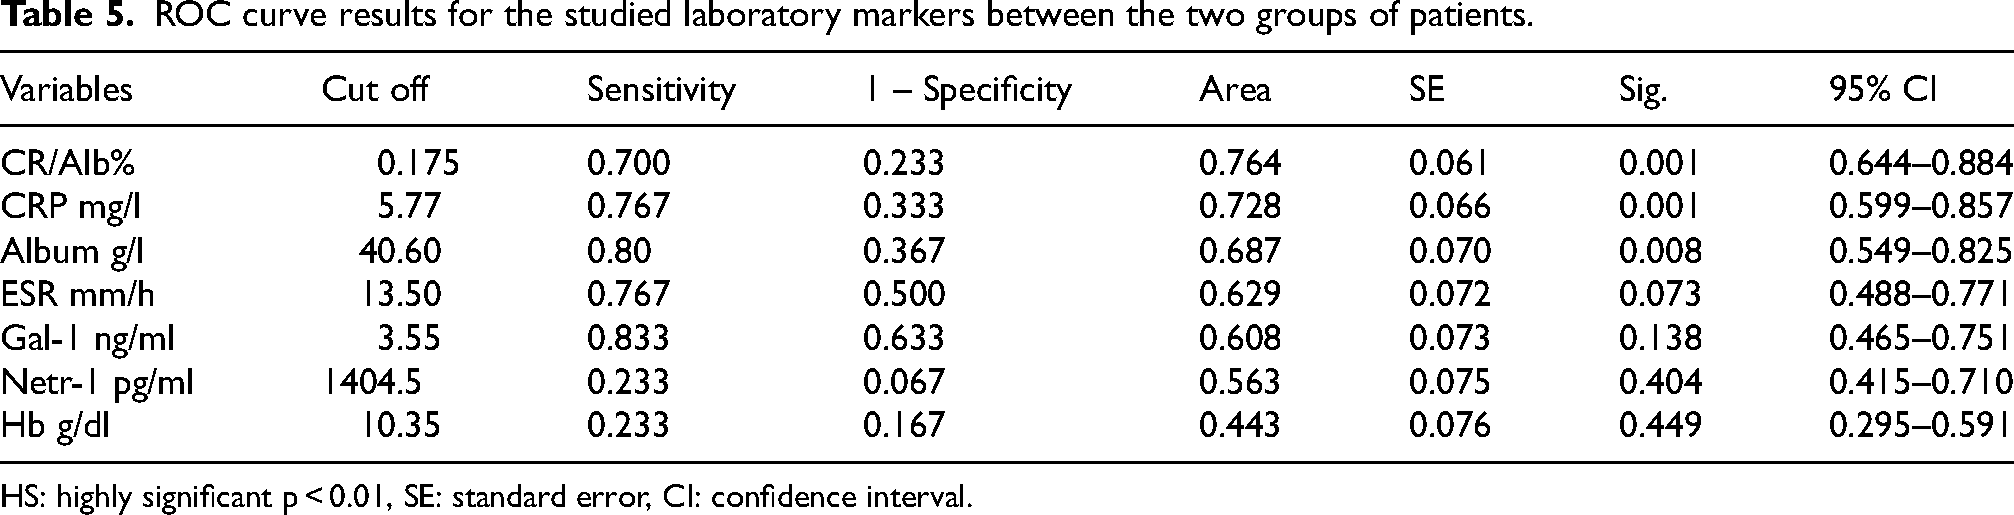
HS: highly significant p < 0.01, SE: standard error, CI: confidence interval.
Discussion
In this study, 60 patients with UC were compared to 30 healthy controls. The male-to-female ratio in the previously diagnosed (PD) group was 50%, while in the newly diagnosed (ND) group, it was 53%. Although there was a slight increase in the proportion of males in the ND group, this difference was not statistically significant. These findings align with a 2023 study by Hayyawi, which reported a higher prevalence of inflammatory bowel disease (IBD) among males in the Iraqi population. 15 The mean age of the patients in Basrah, Iraq, was 35.3 years, which is consistent with the findings of Al-Khaqani et al. (2022), who reported a mean age of 31.60 years in the same region. 16
Most participants exhibited moderate disease severity at the time of diagnosis. In the ND group, 73.3% of patients had moderate disease severity, likely due to the absence of treatment initiation. In contrast, 36.7% of the PD group showed moderate severity, which may be attributed to poor patient compliance or inadequate access to therapeutic interventions. The mean severity score in the ND group was 7.3, with fewer patients presenting mild disease activity. These findings are consistent with a meta-analysis by Mosli et al., which reported that the majority of Arab patients with UC present with mild to moderate disease severity at diagnosis. 17
Among the noninvasive markers used to assess mucosal disease activity in UC, C-reactive protein (CRP), erythrocyte sedimentation rate (ESR), and albumin levels are commonly employed despite their nonspecific nature and association with various inflammatory conditions. The CRP/albumin ratio has recently gained attention as a marker of inflammatory burden, with higher values indicating more severe disease and poorer outcomes. 18 this study is the only study in Iraq that investigate Galectin-1 (Gal-1) and Netrin-1 (Net-1) levels in UC patients and to our knowledge, this is the first study that determine the cutoff value of Net-1 in diagnosing the UC patients.
The results revealed that ESR and CRP levels were significantly higher in UC patients compared to healthy controls, with the highest levels observed in the ND group. This is consistent with the findings of Rodrigues et al. (2020) 19 and Akpinar et al. (2018), 20 who demonstrated the utility of ESR and CRP in predicting endoscopic activity and identifying patients requiring treatment for active mucosal disease. Hemoglobin (Hb) levels were lower in UC patients compared to controls, with the lowest levels observed in the PD group. This may be attributed to chronic bleeding, malnutrition, malabsorption, or medication-induced anemia, as highlighted by Patel et al. (2018). 21
Serum albumin levels were significantly lower in the ND group compared to the PD group and controls, reflecting higher inflammatory activity in untreated patients. This aligns with the findings of Khan et al. (2017), who reported that low albumin levels at diagnosis are associated with severe disease and necessitate closer follow-up and aggressive treatment. 22 The CRP/albumin ratio, which reflects both systemic inflammation and nutritional status, was significantly higher in the ND group. This finding is consistent with Sayar et al. (2020), who demonstrated the utility of this ratio in predicting UC severity. 23
Gal-1 was significantly elevated in UC patients compared to controls, with the highest levels observed in the ND group, this suggests an initial compensatory mechanism to modulate inflammatory responses (that could be less effective with the disease chronicity) 24 this may also reveal the role of Gal-1 in tissue repair, potentially through the induction of T-cell apoptosis, expansion of regulatory T cells (Tregs), 25 and modulation of neutrophil, monocyte, and macrophage activity. 26
Similarly, Net-1, which plays a role in both neuronal development and inflammation, was significantly elevated in UC patients, particularly in the ND group. This aligns with Aherne et al. 2013 and Yebra et al., 2003, 27 who reported increased Net-1 secretion during acute phase of colitis that characterized by an epithelial injury, and in line with Park et al., 2018 who reported Net-1 role in the neuro-immune interactions within the pathogenicity of inflamed colon. 28
Receiver operating characteristic analysis
ROC analysis is a valuable tool for evaluating the diagnostic accuracy of medical tests and determining optimal cut-off values. 14 In this study, Net-1, CRP, Gal-1, and the CRP/albumin ratio demonstrated the highest diagnostic accuracy. CRP results were consistent with Jusué et al. (2018), who reported an AUC of 0.7 for distinguishing UC patients. 29 The CRP/albumin ratio showed excellent diagnostic performance, albeit lower than the AUC of 0.82 reported by Liu et al. (2021) for differentiating IBD patients from healthy controls. 30 To our knowledge, this is the first Iraqi study to evaluate the diagnostic potential of Gal-1 and Net-1 in UC. Both markers demonstrated excellent discriminative ability, with AUC values exceeding 0.9.
The diagnostic performance of Gal-1 aligns with findings from studies on IBD, 31 pancreatic cancer, 31 rheumatoid arthritis, 32 and polycystic ovary syndrome. 33 Similarly, the diagnostic utility of Net-1 has been reported in type-2 diabetes 34 and colorectal cancer. 35
Cut-off values
The optimal cut-off values for the most accurate markers were as: Net-1: 903.5 pg/mL, CRP: 3.215 mg/L, Gal-1: 2.850 ng/mL, CRP/albumin ratio: 0.069. These values are consistent with previous studies. For example, the CRP cut-off value closely aligns with Hanafy et al. (2018) 36 and Jusué et al. (2018). 29 The CRP/albumin ratio cut-off is consistent with Liu et al. (2021) 30 but lower than that reported by Chen et al. (2020). 37 The Gal-1 cut-off value in this study was lower than those reported for IBD 31 and pancreatic cancer. 38 No established cut-off values for Net-1 in gastrointestinal diseases were available for comparison, highlighting the novelty of this finding.
Conclusion
Serum levels of Gal-1 and Net-1 were significantly elevated in patients with UC compared to healthy controls. Both biomarkers demonstrated excellent diagnostic accuracy, as evidenced by high area under the curve (AUC) values in receiver operating characteristic (ROC) analysis. These findings suggest that Gal-1 and Net-1 hold promise as reliable diagnostic biomarkers for UC, capable of effectively distinguishing diseased individuals from healthy subjects. Further studies are warranted to validate these results and explore their potential clinical applications in the management of UC.
Limitation of study
While the study identifies Gal-1 and Net-1 as promising UC biomarkers, these limitations highlight the need for larger, multi-center validation cohorts, mechanistic studies, and integration with existing diagnostic tools. Addressing these gaps will clarify the clinical utility of these biomarkers and refine their role in UC management.
Footnotes
Author contributions
Atika Alahmed. and Eaman Al-Rubaee. conceived of the presented idea. Atika Alahmed. performed the computations. Atika Alahmed. and Eaman Al-Rubaee verified the analytical methods.
Funding
The authors received no financial support for the research, authorship, and/or publication of this article.
Declaration of conflicting interests
The authors declared no potential conflicts of interest with respect to the research, authorship, and/or publication of this article.