
Abstract
Background
Neuroblastoma (NB) is among the most common cancers in children. A highly aggressive form of cancer, NB relies on cells in the microenvironment for dissemination particularly cancer associated fibroblast (CAFs). CAFs synthesise the extracellular matrix to create a scaffold for tumor growth thus enabling the carcinogenesis of NB, Collagen, an abundant scaffold protein produced by CAFs, has been implicated in the creation of an optimal tumor microenvironment, however, the expression profile of collagen within NB is not yet known.
Methods
We characterised collagen expression within the tumor-stroma boundary by microarray and confirmed by qRT-PCR and immunohistochemistry.
Results
The collagen marker, COL11A1, was also upregulated in NB CD45+ cells and SMA+ CAFs. Furthermore, SMA+ CAFs led to neuroblastoma cell invasion in an in vitro co-culture system which was subsequently attenuated by gene silencing COL11A1. Immunohistochemical staining of clinical tumor samples revealed that high COL11A1 expression in the stroma adjacent to tumour site, significantly associated with advanced cancer stages, age ≥18 months, undifferentiated tumor status, relapse and poor overall survival.
Conclusion
Collectively, these results suggest that a COL11A1 signature in the NB microenvironment could represent a novel target for therapeutic intervention.
Introduction
NB is an aggressive solid cancer in children, with a 5-year survival rate below 50% for unfavorable NB despite improved multimodal therapies. 1 Half of NB cases also develop resistance to therapeutics thus new strategies are required. 2 NB progression is intimately linked to the tumor microenvironment 3 and particularly to cancer-associated fibroblasts 4 and immune cell alterations, both of which contribute to therapeutic resistance. 5 It is vital to better understand the biological network within this microenvironment to identify potential drug targets.
Extracellular collagens are key players in tumor behavior driving cancer progression, recurrence and poor outcome. 6 The collagen family is composed of 28 members exhibiting a high degree of structural triple helix similarity yet with non-redundant functions. 7 Collagen functions to create a fiber- or network-platform supporting cell movement in the extracellular matrix, 8 proliferation, angiogenesis, and immune-crosstalk. While defects in collagen is indicated in various inherited disorders, its overexpression contributes to cancer invasion. COL1A1/2, COL4A1, and COL13A1 overexpression induces oncogenic signaling in many cancers.9,10 COL11A1, the α1 chain of collagen, is upregulated in number of cancers including ovarian tumors. 11 Herein, we describe a systemic profiling of collagens in NB tumor-stroma interaction, and characterize the role of COL11A1 in CAFs driving cancer dissemination.
Materials and Methods
Patient Samples
NB samples were obtained from our NB cohort 12 in which clinical, biological and survival data has been collected for 5 years. 13 This study was approved by the Ethics Institutional Review Board of the University of Medicine and Pharmacy in Ho Chi Minh City, Vietnam (N0.UMP-2013). In order to screen the expression profile, we separated the pilot cohort (N = 14) that frozen NB samples were laser micro-dissected into 3 sections; intratumor (IT), peripheral stroma (PS), and tumor-stroma (TS) boundary. RNA was isolated from all samples. The validation cohort 1 (n = 40) contained formalin-fixed and paraffin-embedded sections were further examined by immunohistochemistry. The validated cohort 2 (n = 45) to examine the COL11A1 expression upon survival time of NB patients by Kaplan-Meier analysis. The clincopathological data of each cohort is shown in Supplementary Table 2.
Microarray Analysis
Total RNA was extracted from primary NB tumors and human dorsal-root ganglion (DRG; Clontech, USA) using the RNeasy Mini Kit (Qiagen, USA). RNA was quantified from the optical density at 260 and 280 nm, respectively then subjected to 2 rounds of T7-based amplified RNA (aRNA) and labelling by Aminoallyle Kit (Ambion, USA). aRNA was coupled with Cy5-neuroblastoma cells and cy3-normal human DRG, then mixed and hybridized with a customized collagen panel (210 probe sets; IDT, Korea). Hybridization was assessed using GSI Lumonics ScanArray 4000 (PerkinElmer, Germany) and results quantitatively analyzed using QuantArray software (GSI Lumonics, Germany). Data from each microarray were normalized using LOWESS normalization as previously reported. 14 Each signal was log2 transform and subsequently QC’d with the normalized DRG control. Publicly available COL11A1 expression microarray from Versteeg cohort data 15 as well as overall survival was obtained from the R2 Genomics Analysis and Visualization Platform (http://r2.amc.nl).
qRT-PCR
Total RNA was reverse transcribed to cDNA using the PrimeScript™ RT reagent Kit (Takara, Japan) following manufacturer’s instructions. qRT-PCR was performed in triplicate in a 10 µL reaction mixture containing 5 µL of SYBR™ Green master mix (Thermo Fisher Scientific), 0.5 µM of each of the primers and 10 ng cDNA. The reaction mixture without template was run as a control. COL11A1, COL1A1, COL4A2, COL17A1, COL12A2 and GAPDH transcript levels were determined using specific primers (Supplementary Table 1). Relative quantification was conducted using the 2−ΔΔCt method after normalizing to endogenous reference gene GAPDH.
Cell Viability, Proliferation and Invasion Assays
SH-S5Y5 NB cells were maintained in DMEM supplemented with 10% fetal bovine serum (FBS), 2 mM L-glutamine, 100 U/mL penicillin/streptomycin. For transient knockdown experiments, validated shRNA COL11A1 16 and control shRNA were obtained from Nippon Gene (Japan). The empty vector pcDNA3.1, and pcDNA3.1-COL11A1 were purchased from Addgene (USA). shRNAs and plasmid DNAs was transfected using Oligofectamine-2000 (Invitrogen) following manufacturer’s instructions. Cells were seeded onto 96-well-U-shaped-bottom microplates and co-cultured with sorted cells from NB tissue for 24 h. Cells were then incubated with 1 mg/mL 3-(4,5-dimethylthazol-2-yl)-2,5-diphenyltetrazolium bromide (MTT). Cell viability was analyzed at 570 nm by a microplate reader. Cell proliferation was examined in the same 96-well co-culture plates. Cells were fixed with 4% paraformaldehyde and stained with Ki67 (Zymed) and counterstained with DAPI (Sigma-Aldrich). Proliferation analysis was based on Ki67-positive numbers per total DAPI-positive cells. In vitro matrigel (Becton Dickinson, NJ, USA) invasion assays were assessed in 6.5-mm Costar transwell chambers (Costar Inc., CA, USA). Transwell filters were coated with Matrigel, and cells seeded onto the Matrigel. After incubation, the filter was removed from the chamber, and cells that had invaded the Matrigel were fixed with 100% methanol and stained with 0.3% crystal violet solution. Cells were counted under a light microscope (Olympus, Japan).
Immunoblot
Cells were washed in PBS and lysed using SDS/Nonidet P-40 lysis buffer [1% SDS, 1%Nonidet P-40, and cOmplete™, EDTA-free Protease Inhibitor Cocktail]. Protein extracts were quantified by Bradford assay then 30 µg/samples separated by SDS-PAGE and blotted onto nitrocellulose membranes (Immobilon, Ireland). Membranes were blocked with 5% non-fat milk powder for 30 minutes. Protein expression was assessed using anti-COL11A1 (#HPA052246, Sigma-Aldrich) and anti-GAPDH antibodies (#G9545, Sigma-Aldrich). Immuno-reactive bands were visualized by enhanced chemo-luminescence (ECL) using myECL imager (ThermoScientific). Densitometry analysis was assessed by ImageJ Software.
Cancer-Associated Fibroblast Cell Sorting and Flow Cytometry Analysis
NB sections were dissected to first remove necrotic areas before being processed using a tumor dissociation kit (Miltenyi, Germany). CAFs were isolated by negative selection using; (1) CD31+ endothelial cell microbeads (Miltenyi, Germany); (2) CD14+ monocyte microbeads (Miltenyi, Germany); and (3) CD45+ tumor microbeads (Miltenyi, Germany) following manufacturer’s instructions. Cell types were confirmed by FACS with appropriate markers CD14 (#82944, Cell Signaling), CD31 (3528, Cell Signaling), GD2 (#ab68456, Abcam), FAP (#66562, Cell Signaling), and SMA (#F3777, Sigma-Aldrich). Acquisition and data analysis were performed with FCS-Express V7.
Immunohistochemistry
Laser microdissection was carried out with LMD7 Leica (UV) (Leica Micro-systems Inc). Tissue sections were deparaffinized with xylene and then hydrated and immersed in peroxidase‐blocking solution (Dako) for 15 minutes. The sections were then treated with Bond Epitope‐retrieval Solution 2 (AR9640; Leica) for 30 minutes and then incubated overnight at 4°C with antibody (1:100 dilution) followed by rinsing with washing buffer. Sections were further incubated with Dako Real Envision/HRP, Rabbit/Mouse (Envision) detection reagent. Collagen staining was performed by using the NovaUltra™ Masson Trichrome Stain Kit (IHC World, Woodstock, MD). The images were captured using a Panoramic MIDI scanner. Each sample was scored and evaluated separately by 2 oncology pathologists. Immuno-scoring was used as per our previous study 12 to analyze both staining intensities and the proportion of anti‐COL11A1 (#HPA052246, Sigma‐Aldrich) and anti-Vimentin (SAB4503083, Sigma‐Aldrich) positive cells. Staining intensity was scored as 1 (weak), 2 (moderate), or 3 (strong). The proportion of positive cells were classified into 1 of the following 5 categories: 1 (<5%), 2 (5%–25%), 3 (26%–50%), 4 (51%–75%), or 5 (>75%). Values for both parameters were multiplied to generate a final immunohistochemistry score.
Statistical Analysis
Data visualization and correlation were performed with SPSS 17.0 (Chicago, IL) and Prism 7 (GraphPad Software Inc). Microarray Principal Component Analysis (PCA) plots and heatmaps were analysed by Clustvis. 17 Proliferation, cell viability, and invasion assay were analysed by non-parametric, Wilcoxon–Mann–Whitney exact tests. COL11A1 expression in correlation with clinical samples analyses were performed using 1‐way analysis of variance (ANOVA) followed by the Tukey post-hoc analysis. Other values were expressed as mean ± SEM, and P < 0.05 was deemed to be statistically significant.
Results
COL11A1 Is Overexpressed in the Tumor-Stroma Boundary of NB
To examine the signature of collagen expression in these regions, we first dissected primary NB into intra-tumor-site (IT), tumor-stroma boundary (TS) and peripheral stroma-site (PS) (Figure 1(A)) before running microarray analysis of 25 identified collagens. By PCA analysis, we confirmed 3 dimensions of collagen clusters according to IT, TS and PS regions (Figure 1(B)). For sub-clustering analysis, the median intensity of each single marker was illustrated and quantified by heat-map. We identified 4 different collagen signatures (CS); CS1 was highly expressed in TS but not PS nor IT areas; CS2 was ubiquitously expressed in all regions; CS3 was highly expressed in both PS and TS regions; and CS4 was highly expressed in PS only (Figure 1(C)). COL11A1 then was significantly overexpressed in TS but not in PS or IT by confirmed RT-PCR (Figure S1).
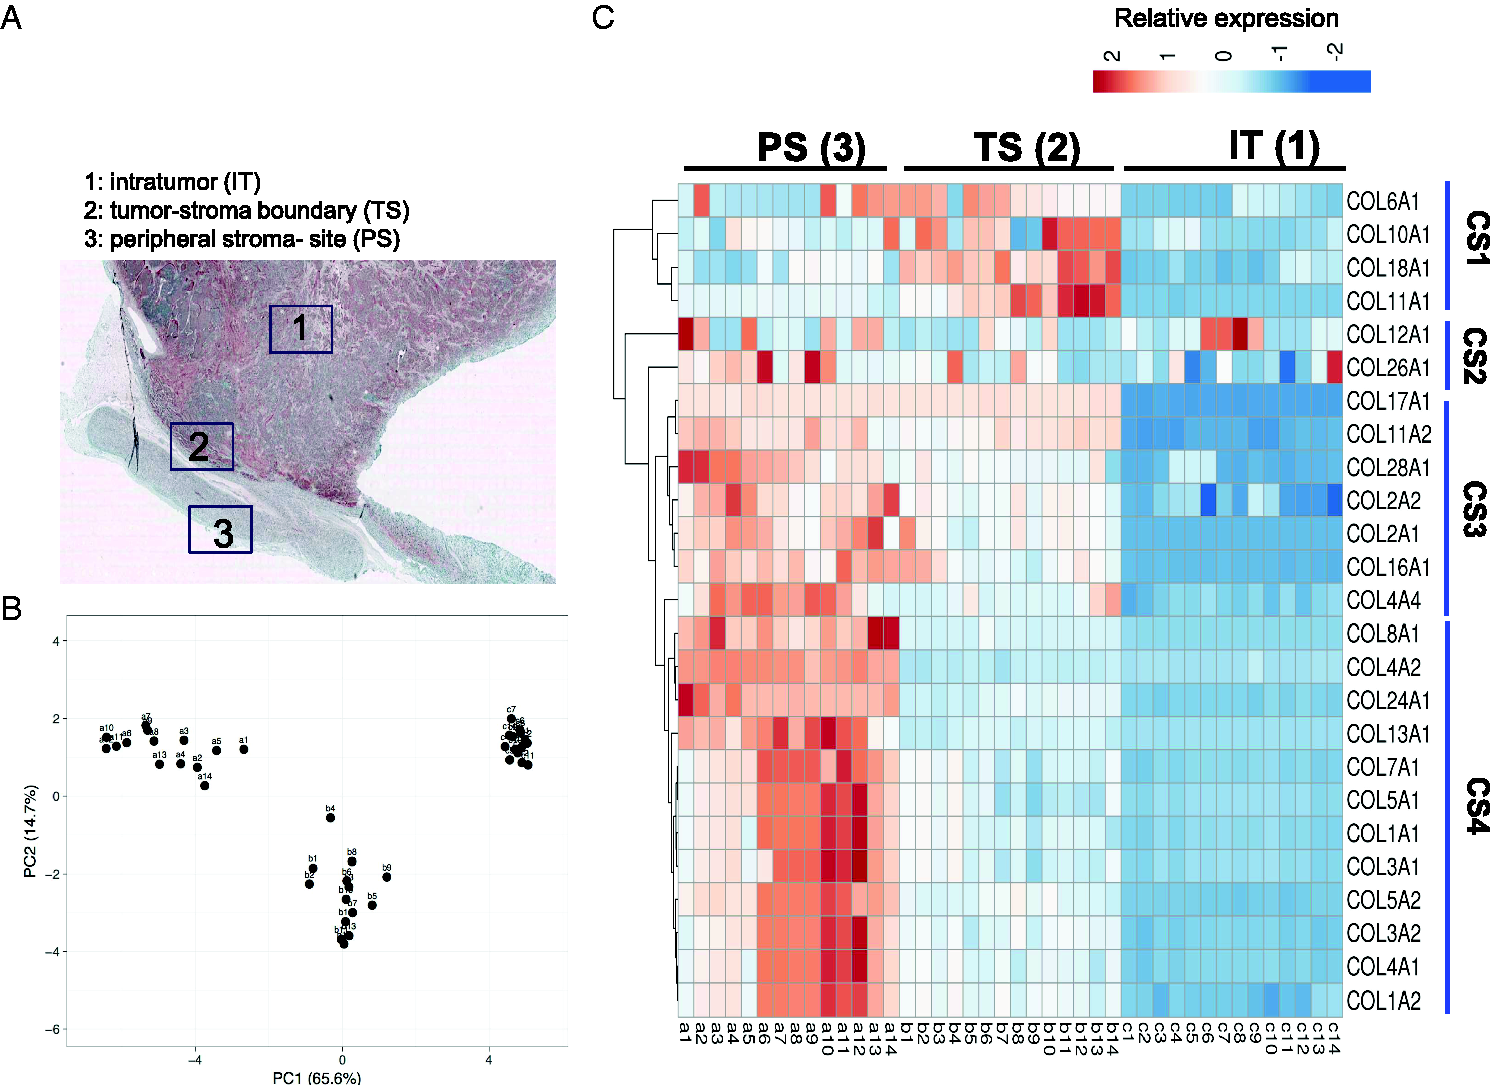
Gene expression of collagen markers in NB cohort (n = 14). A, Schematic of laser-capture microdissection at intra-tumor (IT), peripheral- (PS) and tumor-stroma (TS) boundary selected for microarray. B, Principle component analysis clustering the sorted PS, TS and IT cells. C, Heat map of 25 differentially expressed collagen genes for sorted PS, TS and IT cells.
COL11A1 Expression Is Enriched Within CAF and NB Cells
We next asked which cell types expressed COL11A1. Cell populations were separated by MACS. Cell groups were selected by leukocytes positive CD45+ beads, endothelial cells with CD31+ beads and monocytes with CD14+ beads. Negative selected cells expressed FAP+ and SMA+ marking them as cancer-associated fibroblasts (CAFs) (Figure 2(A)), the remain were NB cells that confirmed by anti-GD2. The purity of each cell group was confirmed by flow cytometry with appropriate markers (Figure 2(B)). Of note, COL11A1 expression was significant in NB and CAF cells but negligible in monocyte and endothelial cells (Figure 2(C)). Immunofluorescence confirmed that COL11A1 positive cells co-stained with the representative CAF-marker, SMA and were found in the cancer-fibroblast margin (Figure S2).
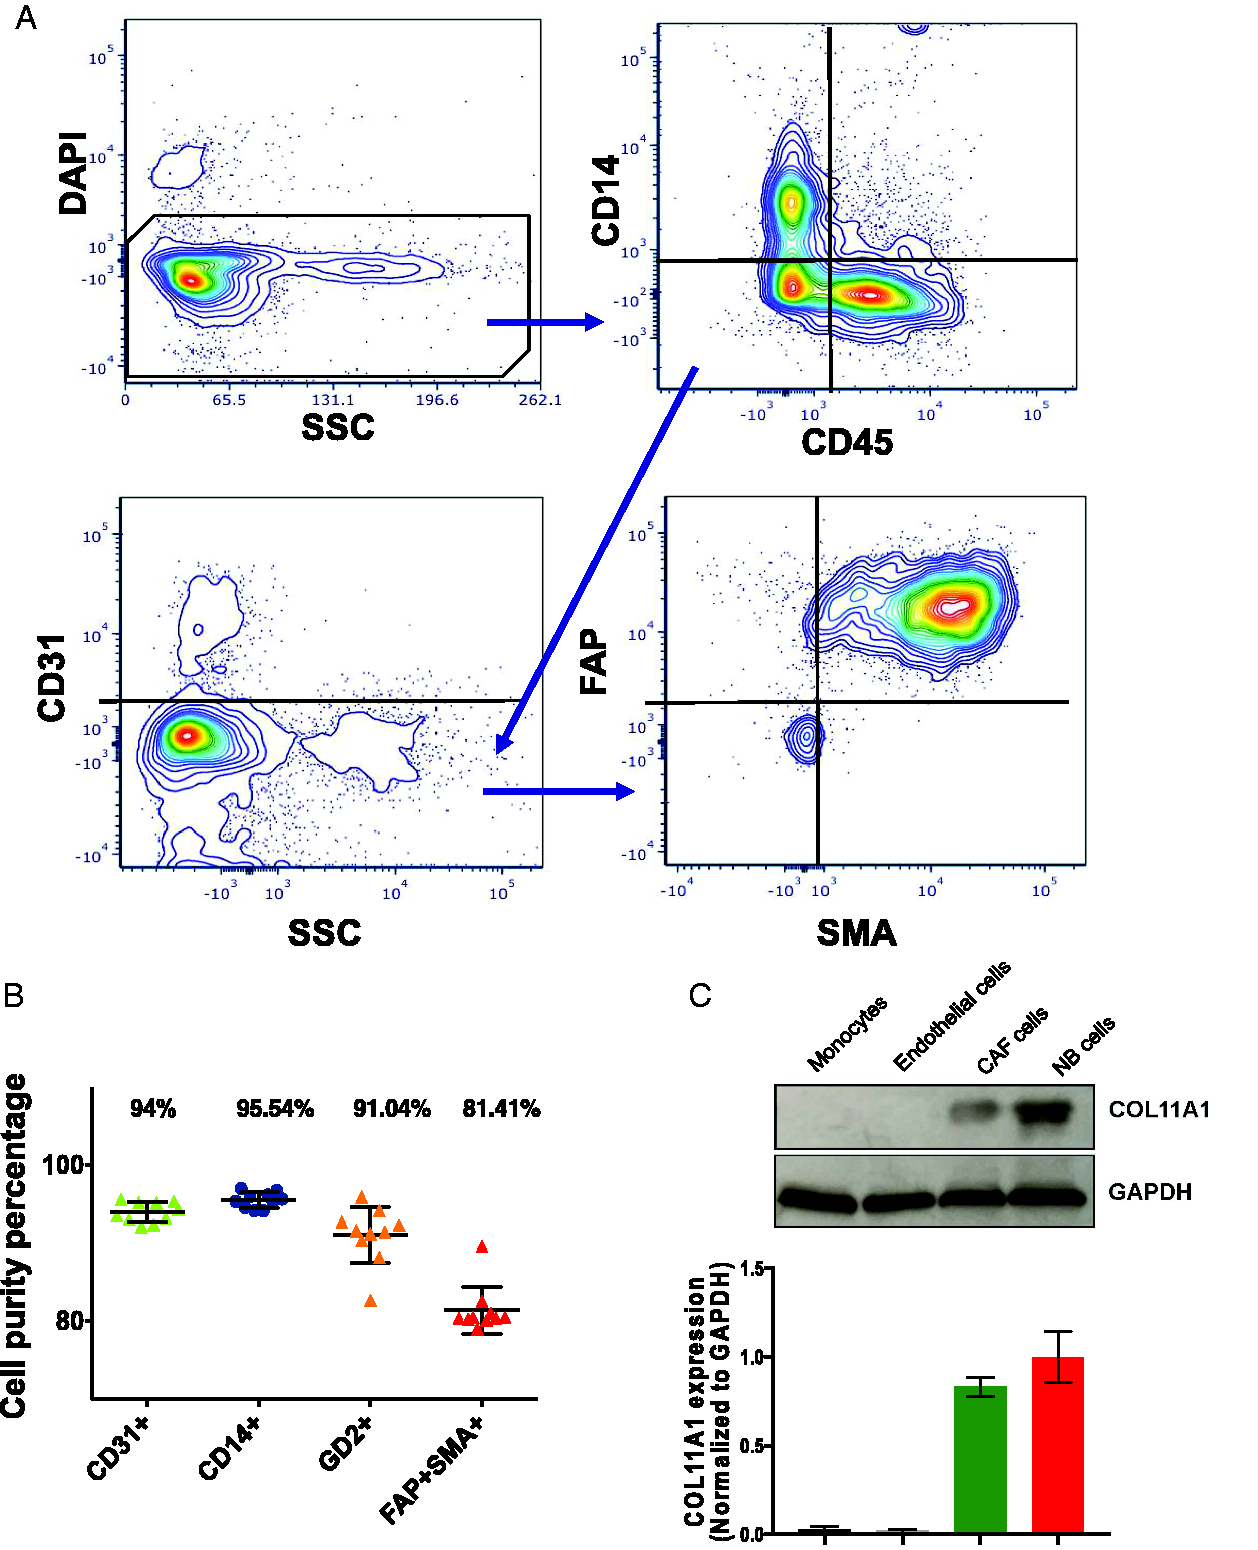
COL11A1 is expressed by CAF- and NB- cells. A, Representative flow-cytometry plots following magnetic-activated cell sorting (MACS) of dissected NB tissues. Live (DAPI-negative) cells were separated into CD31+ endothelial cells, CD14+CD45+ monocytes and FAP+SMA+ CAFs neuroblastoma respectively. B, Purity of each cell fraction as isolated by MACS. C, Immunoblot analysis of COL11A1 expression in each sub-population (above) and quantitative graph (below) normalized to GAPDH (n = 3). Error bar denotes mean ± SEM.
Co-Culture With COL11A1 Expressing CAFs Drives NB Invasion
To assess whether COL11A1 expressed by NB or CAFs could influence growth, and invasion of cancer cells, we set up an invasion assay to expose CAFs to the NB cancer cell line, SH-SY5Y. As shown in Figure 3(A), SH-SY5Y cells co-cultured with CAFs induced invasion up to 4.3-fold compared with control cells (P < 0.001, Figure 3(B)). Silencing COL11A1 by shRNA in CAF cells inhibited this invasion (Figure 3(C)). In contrast, ectopic COL11A1 expression significantly induced 6-fold higher invasion in SH-SY5Y cells (Figure 3(D)). Knockdown and ectopic expression of COL11A1 were both confirmed by immunoblot (Figure 3(E)). However, COL11A1 knockdown or overexpression in CAF cells had no effect on NB cell proliferation or viability (Figure S3). Together, these results indicate that COL11A1 expression in CAFs drive NB cell invasion.
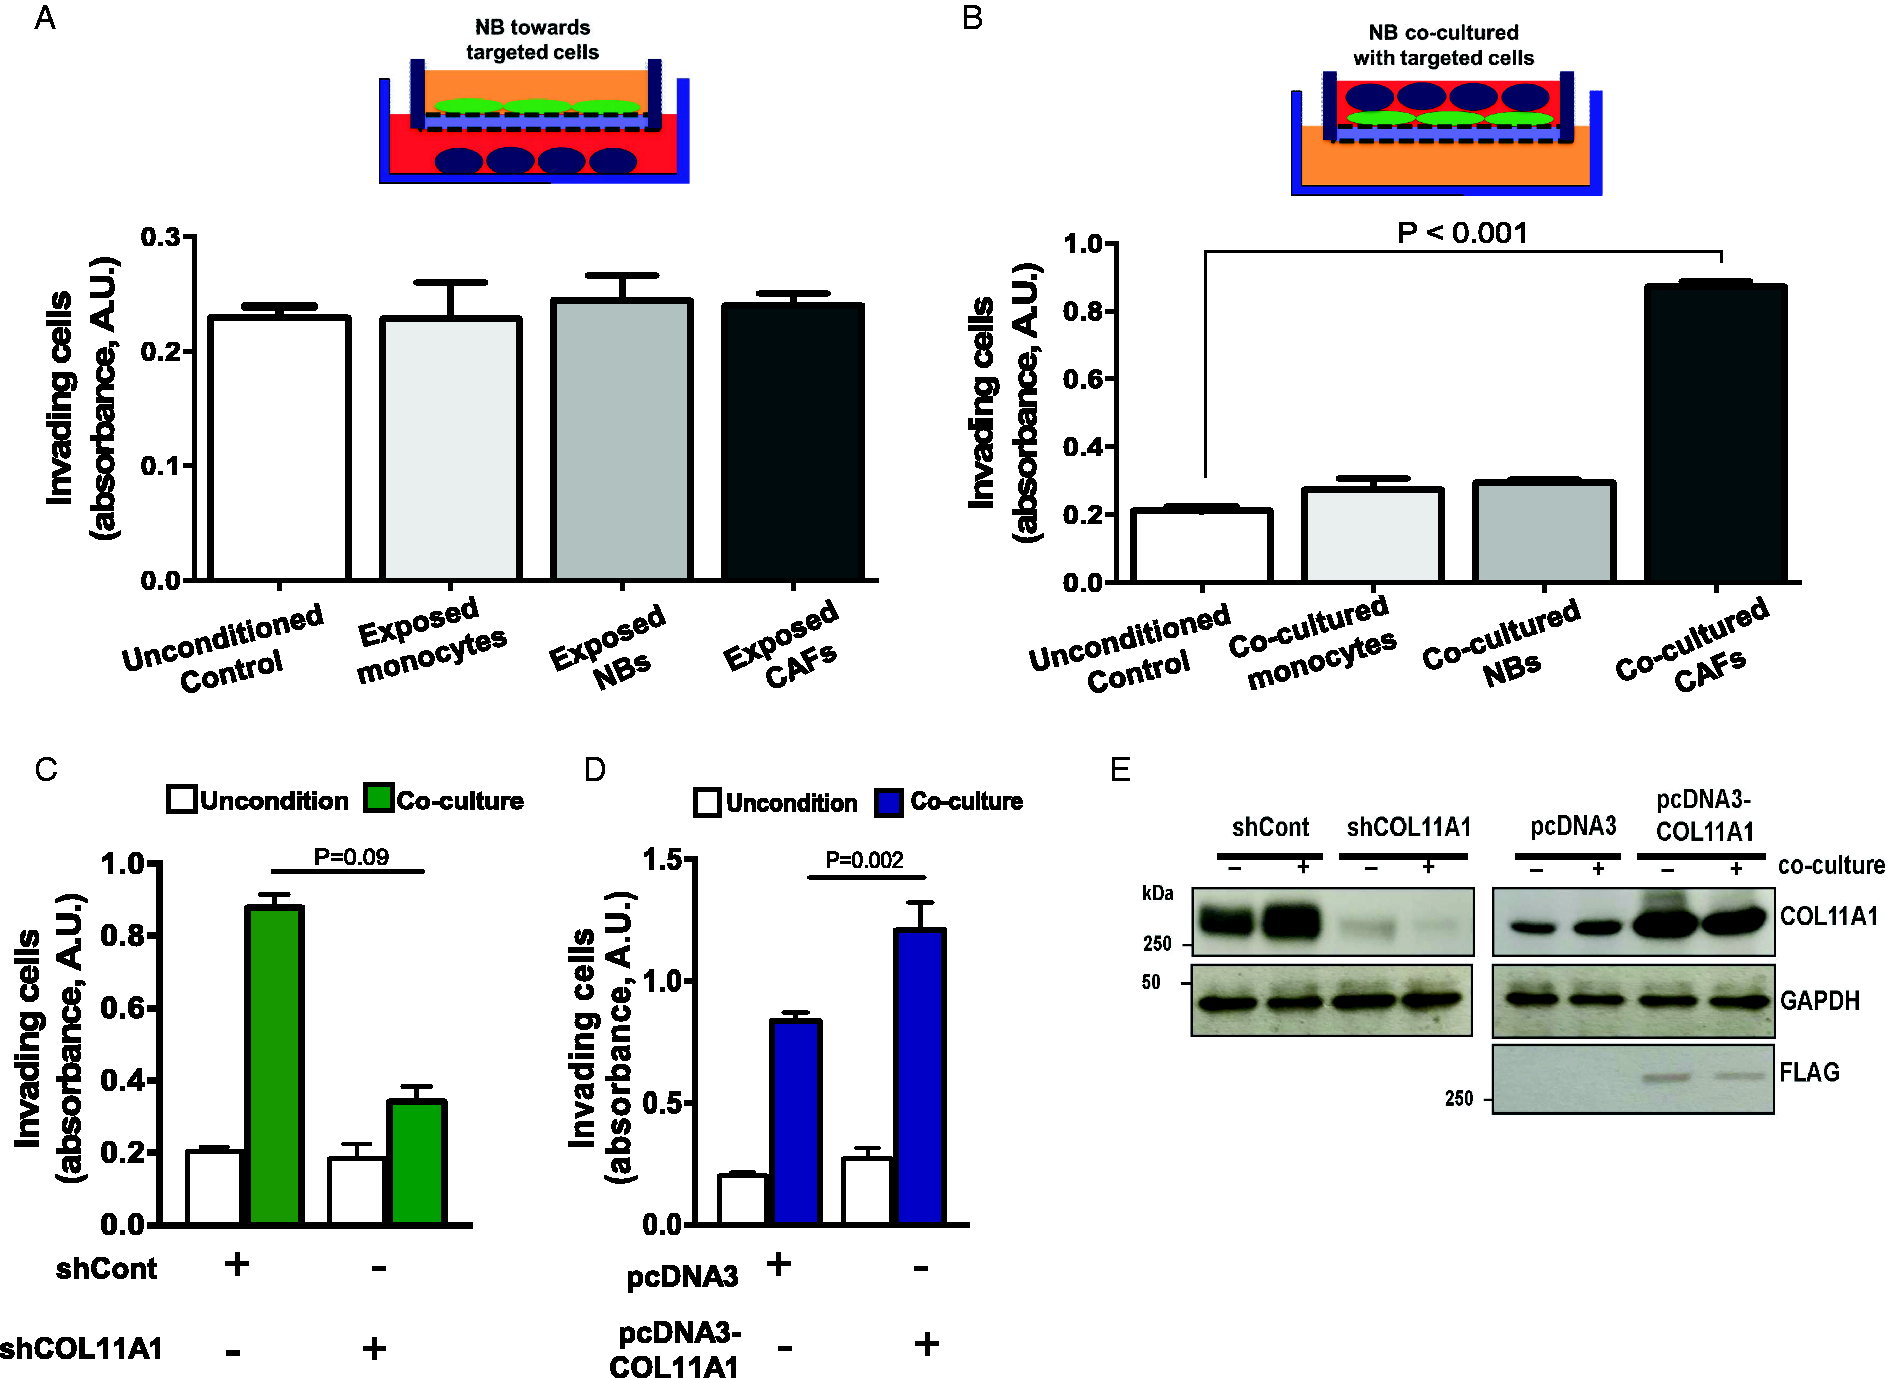
Upregulated COL11A1 in CAFs drives SH-SY5Y invasion in a co-culture system. A and B, Bar graph of SH-SY5Y cell invasion when co-cultured with monocytes, NBs or CAFs for 24 h. Bar graph of SH-SY5Y cell invasion on co-culture with sh-COL11A1 (C) or ectopic expressed COL11A1 (D). E, Immunoblot of sh-COL11A1 knockdown and pcDNA3-COL11A1 ectopic expression in CAFs. Error bar denotes mean ± SEM.
COL11A1 Expression in NB Patients
To determine whether COL11A1 expression is related to clinical outcome of NB, we examined immunostaining of COL11A1 in NB samples from patient cohorts. Immunohistochemical analysis revealed that COL11A1 expression was profound in the tumor-stroma boundary compared to peripheral stroma (Figure 4(A)). High COL11A1 expression was significantly associated with patients ≥18 months-old (P = 0.004), Stage 3 or 4 NB status (P < 0.001), poorly differentiated tumor status (P = 0.002), and relapse (P < 0.0001). There was no significant correlation between COL11A1 expression and MYCN amplification status (Figure 4(B)). There was significant correlation between high COL11A1 with overall survival in our NB cohort (P = 0.059, Figure 4(C)) and similarity was obtained in the NB Versteeg cohort dataset (P < 0.001, Figure 4(D)).
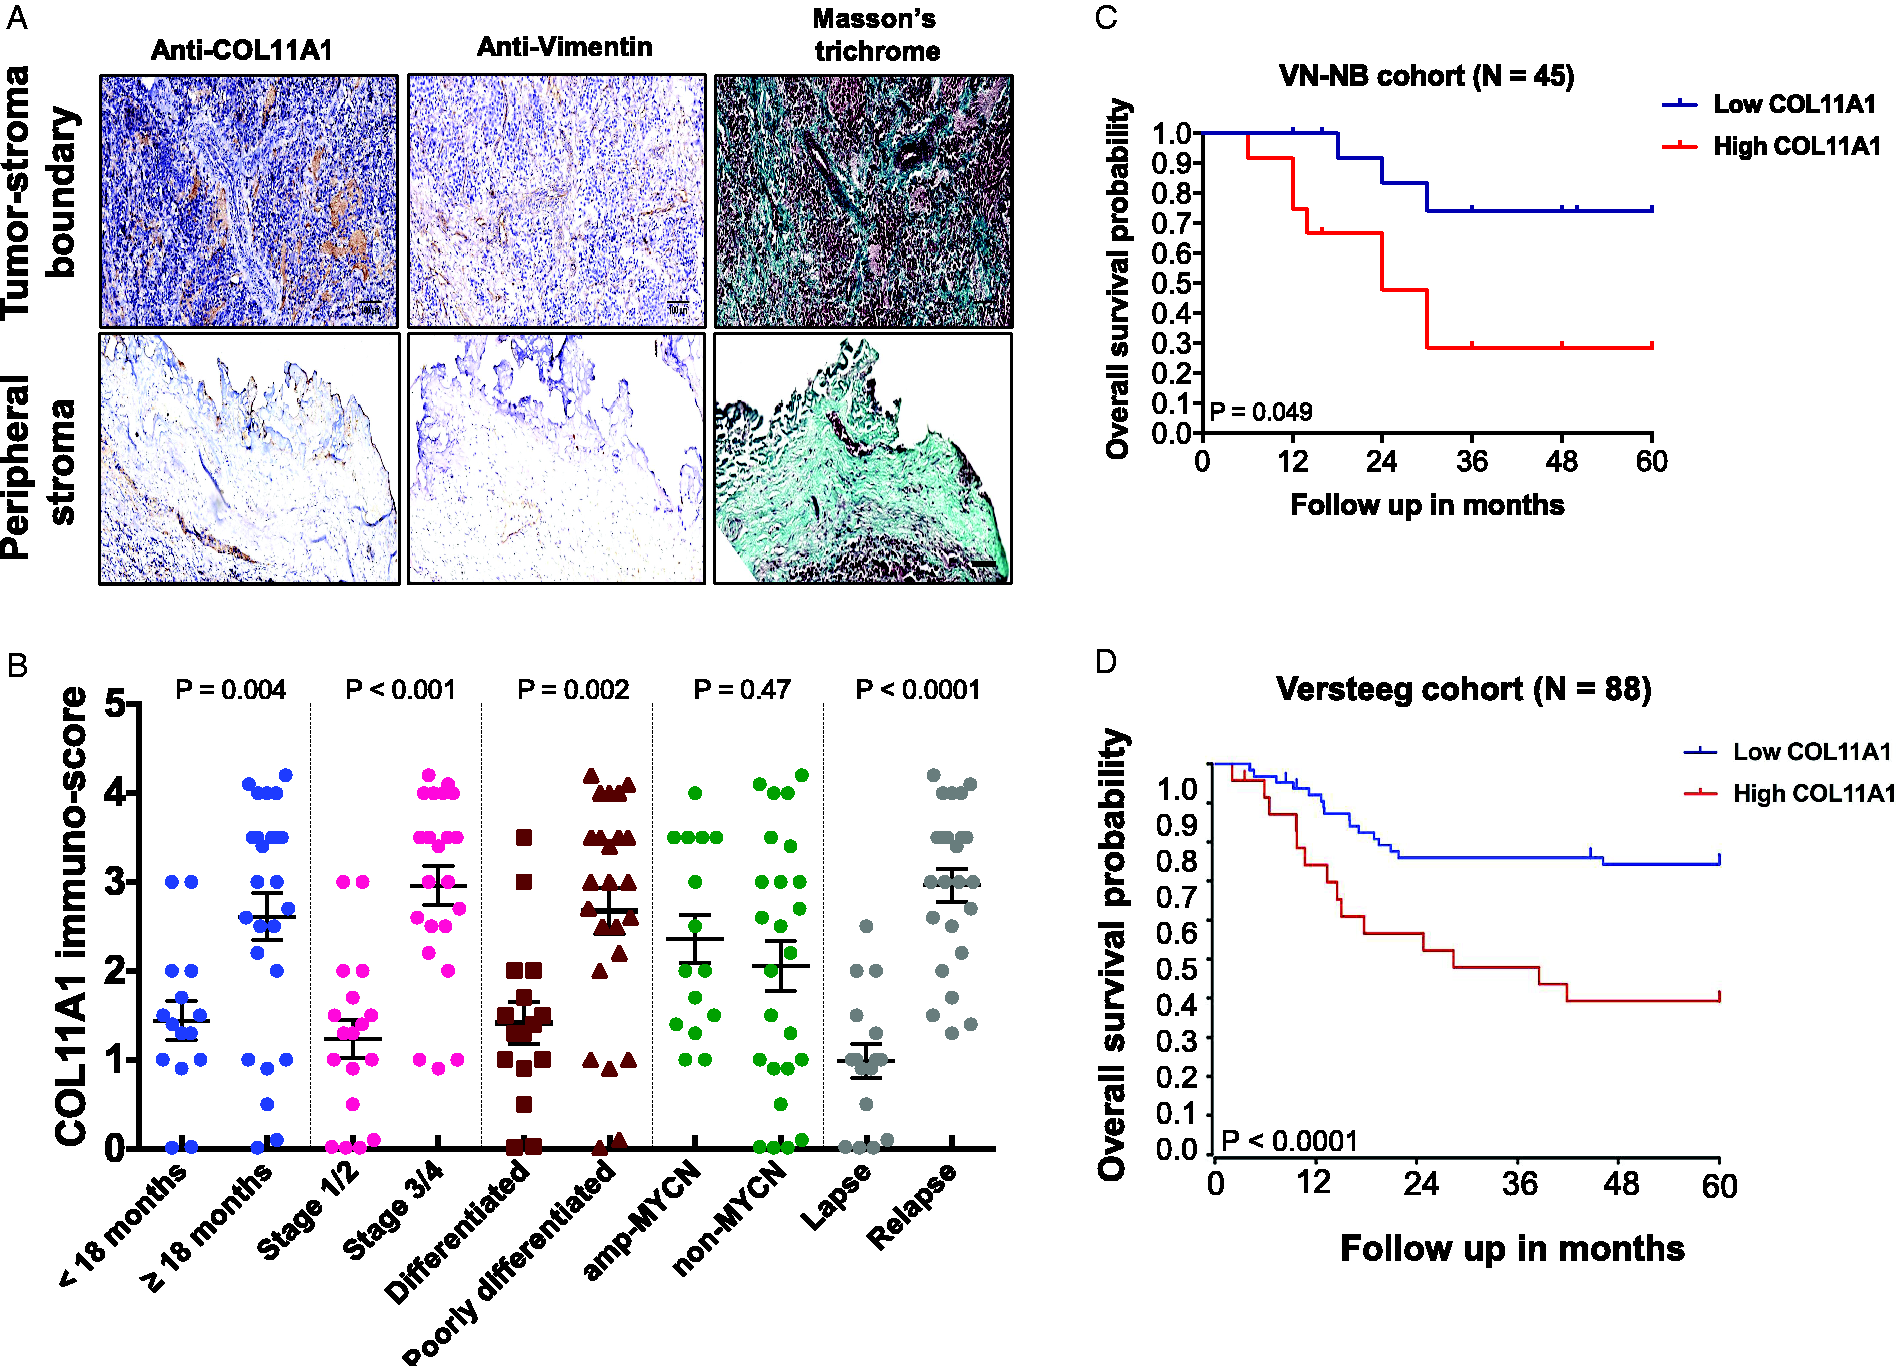
COL11A1 expression and overall survival in NB patients. A, Immunohistochemical staining of NB tumor-stroma boundary and peripheral stroma with COL11A1 and Vimentin (stroma marker) and co-stained with Masson’s trichrome (collagen marker). Scale bars, 20 μm. B, Scatter dot plot of COL11A1 immune‐score vs age group, tumor stage, tumor differentiation, MYCN amplification, and relapse status (N = 40). C and D, Kaplan-Meier curves of overall survival of VN-NB cohort (N = 45) and Versteeg cohort (N = 88) which analysed by public database R2 (http://r2.amc.nl), respectively. Subgroup analyses of low and high mRNA COL11A1 expression were grouped. Error bar denotes mean ± SEM.
Discussion
The high incidence of metastasis in NB remains a key challenge in the effective treatment of patients. We investigated the tumor-stroma microenvironment in NB to deduce whether modelling of the extracellular matrix, namely the production of collagen, could be involved in driving cancer invasiveness. We first characterized the expression profile of collagen in the tumor-stroma boundary and identified significant overexpression of COL11A1 in NB cells and CAFs. Furthermore, we demonstrated that attenuated expression of CAF-derived COL11A1 prevented NB invasion in vitro. Finally, we determined a significant inverse correlation between the expression of COL11A1 and overall survival in NB patients within our cohort and public datasets.
Growing evidence indicates that collagen plays an important role during cancer progression. In particular, overexpression of COL11A1 is frequently identified in several cancers and linked with proliferation, 18 migration, 19 metabolism, 20 and drug resistance. 21 COL11A1, is upregulated in ovarian cancers, 11 activated fibroblasts 22 and correlates with poor survival outcome. 18 In agreement with previous findings, we show that COL11A1 is highly involved in tumor invasion and cancer progression, but does not drive NB proliferation. In particular we identify a subset of CAFs expressing COL11A1 responsible for driving the spread of NB cells. While CAFs are identified in our study as a key source of COL11A1, Galván et al shows that COL11A1 is expressed by cancer associated stromal cells in human colon adenocarcinoma. 23 Here, we provide evidence that COL11A1+ CAFs have an active role in NB pathogenesis, but we cannot exclude the possibility that the profound number of immune cells, such as tumor-associated macrophages, or mesenchymal stromal cells in the tumor microenvironment could promote NB progression. 24 Further studies are needed to reveal the metastatic roles of other cell types in the tumor-stroma region.
NB with abundant schwannian stroma is associated with tumor differentiation, lower vascularity, and a favorable prognosis. 25 In this study, we did not specifically examine COL11A1 expression within the intratumoral Schwannian stroma of differentiating peripheral neuroblastic tumors. Further study should examine the COL11A1 expression in Schwannian or ganglioneuroma, to support the complex heterogeneity relationships and interactions likely exist between cells in the tumor associated stroma. Further studies could use a neuroblastoma xenograft model to investigate collagen expression and cross-talk between Schwann cells and CAFs. 26
Overall, this study supports the hypothesis that the NB tumor environment plays a key role in cancer progression via COL11A1 production by CAFs. COL11A1 expression thus represents a useful prognostic marker for cancer progression. Furthermore, the COL11A1 production pathway, as well as potential upstream regulatory mechanisms, could be targets for adjunct NB cancer therapy.
Supplemental Material
sj-pdf-1-pdp-10.1177_10935266211039200 - Supplemental material for Collagen XI Alpha 1 (COL11A1) Expression in the Tumor Microenvironment Drives Neuroblastoma Dissemination
Supplemental material, sj-pdf-1-pdp-10.1177_10935266211039200 for Collagen XI Alpha 1 (COL11A1) Expression in the Tumor Microenvironment Drives Neuroblastoma Dissemination by Dinh Quang Truong, Ban Tran Ho, Gia-Cac Chau, Dinh Khai Truong, Thuy Thi Thanh Pham, Akira Nakagawara and Chi-Bao Bui in Pediatric and Developmental Pathology
Footnotes
Acknowledgements
We would like to thank Drs Izumi Hideki, Li Yuanyuan, and Michio Yasunami at Saga Medical Centre Koseikan, Japan, for supplying the protocols and NB cell lines. We also thank Dr. Leigh Ann Jones of ImmunoTechniques for assistance in preparing the manuscript.
Declaration of Conflicting Interests
The author(s) declared no potential conflicts of interest with respect to the research, authorship, and/or publication of this article.
Funding
The author(s) disclosed receipt of the following financial support for the research, authorship, and/or publication of this article: The study is mainly supported by the Vietnam National University Ho Chi Minh City grant (#CC2021-44-03), the Vietnamese Nafosted grant (#106‐YS.06‐2014.48), and the UICC fellowship (#YY2/16/315742).
Supplemental Material
Supplementary material for this article is available online.
References
Supplementary Material
Please find the following supplemental material available below.
For Open Access articles published under a Creative Commons License, all supplemental material carries the same license as the article it is associated with.
For non-Open Access articles published, all supplemental material carries a non-exclusive license, and permission requests for re-use of supplemental material or any part of supplemental material shall be sent directly to the copyright owner as specified in the copyright notice associated with the article.