
Abstract
Computational science is well established as the third pillar of scientific discovery and is on par with experimentation and theory. However, as we move closer toward the ability to execute exascale calculations and process the ensuing extreme-scale amounts of data produced by both experiments and computations alike, the complexity of managing the compute and data analysis tasks has grown beyond the capabilities of domain scientists. Thus, workflow management systems are absolutely necessary to ensure current and future scientific discoveries. A key research question for these workflow management systems concerns the performance optimization of complex calculation and data analysis tasks. The central contribution of this article is a description of the PANORAMA approach for modeling and diagnosing the run-time performance of complex scientific workflows. This approach integrates extreme-scale systems testbed experimentation, structured analytical modeling, and parallel systems simulation into a comprehensive workflow framework called Pegasus for understanding and improving the overall performance of complex scientific workflows.
1 Introduction
Modern science often requires the processing and analysis of vast amounts of data in search of postulated phenomena and the validation of core principles through the simulation of complex system behaviors and interactions. Not surprisingly, this trait is common in fields as diverse as astronomy, bioinformatics, physics, and ocean and ice sheet modeling.
In order to support the computational and data needs of today’s science, new knowledge must be gained about how to deliver the growing, distributed and high-performance computing (HPC) capabilities to the scientist’s desktop in an accessible, reliable and scalable way. As applications and infrastructure are growing in scale and complexity, our understanding of application behavior is not keeping up with technological and algorithmic advances. As a result, it is difficult for scientists and infrastructure providers to determine the expected and realistic behavior of a complex scientific workflow. Furthermore, when failures or performance anomalies are encountered, it is extremely difficult to pinpoint the root cause of the problem, and to correct or mitigate the issue.
Many science applications today are composed of custom scripts that tie several community or custom codes together. These scripts are frequently edited by hand to suit each new computational platform or to expand the parameter and data sets they operate on. The computing infrastructure that these applications run on is very complex and diverse. It includes NSF-funded systems, such as Open Science Grid, 1 XSEDE, 2 and cloud-based infrastructures, 3 DOE computing facilities at Oak Ridge National Laboratory, Lawrence Berkeley National Laboratory, and others. Input, output, and intermediate data are transferred over high-speed national and regional transit networks such as Internet2 4 ESnet. 5
Given the complexity of applications and infrastructures, modeling their behavior is very tedious and sometimes infeasible. Part of the solution for understanding the behavior of the applications is to formalize their structure in the form of a workflow. Workflows are able to declaratively express complex applications that are composed of several individual codes with data and control dependencies. A workflow management system can take this application description and manage and optimize its execution on a variety of computational platforms.
Tools can be created that analyze the workflow and that develop models of expected behavior given a particular computing environment, such as an HPC system, clusters distributed over wide area networks, or clouds. Having a coupled model of the application and execution environment, decisions can be made about resource provisioning, application task scheduling, data management within the application, etc. As the application is executing, correlated real-time monitoring of the application and infrastructure can be used to verify the application behavior, to detect and diagnose faults, and to support adaptivity.
This paper describes the PANORAMA 6 project that aims to further our understanding of the behavior of scientific workflows as they are executing in heterogeneous environments. The central contribution of this article is a description of the PANORAMA approach for modeling and diagnosing the run-time performance of complex scientific workflows. This approach integrates extreme-scale systems testbed experimentation, structured analytical modeling and parallel systems simulation into a comprehensive workflow framework called Pegasus (Deelman et al., 2005, 2015) for understanding and improving the overall performance of complex scientific workflows on today’s and future-generation architectures.
The paper is organized as follows. Section 2 describes applications that are motivating our work. Section 3 describes the Pegasus workflow management system that manages the application execution. Section 4 describes the tools and techniques we use to capture and profile the observed behavior of workflows. Section 5 shows our approach to analytical workflow modeling. Section 6 describes our approach to correlating the real-time application and infrastructure monitoring data, while Section 7 explores anomaly detection based on that data. Section 5.3 describes how analytical models can be augmented with detailed simulations. Section 9 describes related work. Section 10 presents the work ahead and concludes the paper.
2 Motivating examples
We have identified two important application use-cases involving advanced workflows that are the initial focus of our modeling efforts: parameter refinement workflows for the Spallation Neutron Source (SNS) and climate simulation automation for the Accelerated Climate Modeling for Energy (ACME) project.
2.1 SNS
The SNS (Mason et al., 2006) is a DOE research facility at Oak Ridge National Laboratory that provides pulsed neutron beams for scientific and industrial research. SNS uses a particle accelerator to impact a mercury-filled target with short proton pulses to produce neutrons by the process of spallation. A wide variety of experiment instruments provide different capabilities for researchers across a broad range of disciplines, including: physics, chemistry, materials science, and biology.
SNS hosts hundreds of researchers every year who conduct experiments within short reservations of a few days to a few weeks. Providing these researchers with efficient, user-friendly and highly configurable workflows that reduce the turnaround time from data collection to analysis and back is essential to the success of SNS. Figure 1 shows the data flow for a typical SNS instrument, in this case NOMAD. Neutron events scattered from the scientific sample under investigation are collected by an array of detectors. These raw events are processed into a representation familiar to the domain scientist depending on the type of experiment. For NOMAD, the reduced form is a powder diffraction pattern. This reduced data is then analyzed and compared with materials simulations to extract scientific information.
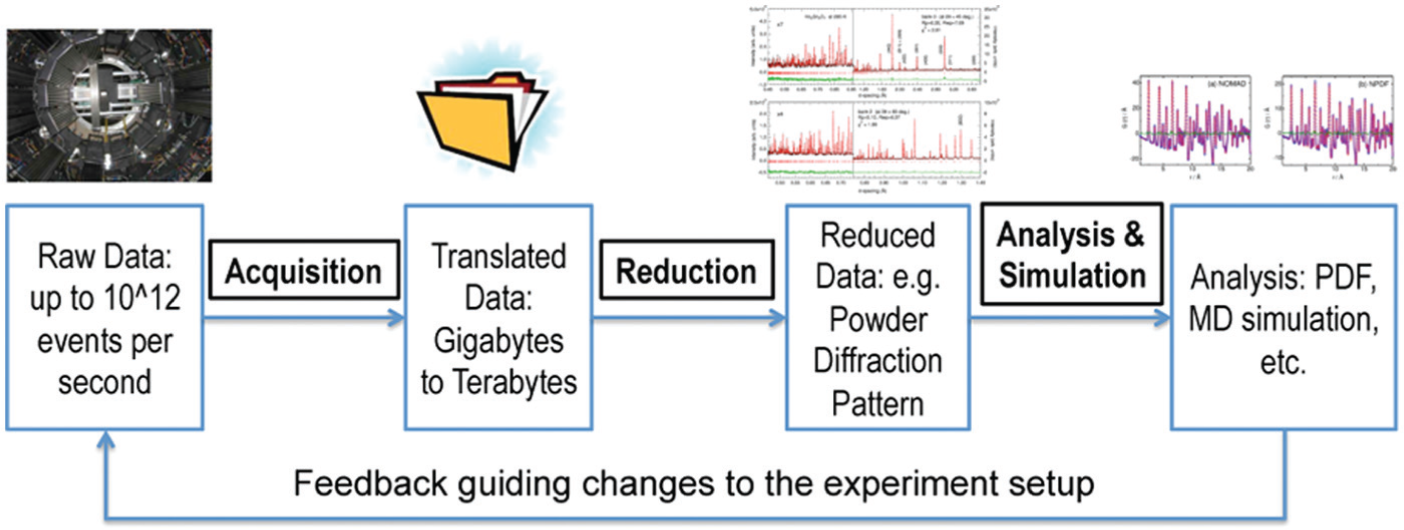
SNS example workflow.
In addition to workflows for processing data from SNS experiments, there are also workflows for data analysis and simulation to support and guide SNS experiments, and to validate computer models against experimental data. These workflows automate tedious manual processes to reduce time to solution and improve researcher productivity. In collaboration with the Center for Accelerating Materials Modeling (CAMM) of SNS data, we are adapting a workflow that executes simulations to support experimental design and the validation of molecular models as a use case for the PANORAMA project. The workflow executes an ensemble of molecular dynamics and neutron scattering simulations to optimize a model parameter value. This workflow is being used to investigate temperature and hydrogen charge parameters for models of water molecules. The results are compared with data from QENS experiments using the BASIS instrument at SNS.
An illustration of this parameter refinement workflow is shown in Figure 2. The workflow executes one batch job to unpack the database along with five jobs for each set of parameters. First, each set of parameters is fed into a series of parallel molecular dynamics simulations using NAMD (Phillips et al., 2005). The first simulation calculates an equilibrium and the second inputs that equilibrium and calculates the production dynamics. Each NAMD simulation runs on 288 cores for 1–6 hours. The output from the MD simulations has the global translation and rotation removed using AMBER’s (Case et al., 2015) ptraj utility 7 and is passed into Sassena (Lindner and Smith, 2012) for the calculation of coherent and incoherent neutron scattering intensities from the trajectories. Each Sassena simulation runs on 144 cores for up to 6 hours. The final outputs of the workflow are transferred to the user’s desktop and loaded into Mantid (Arnold et al., 2014) for analysis and visualization.
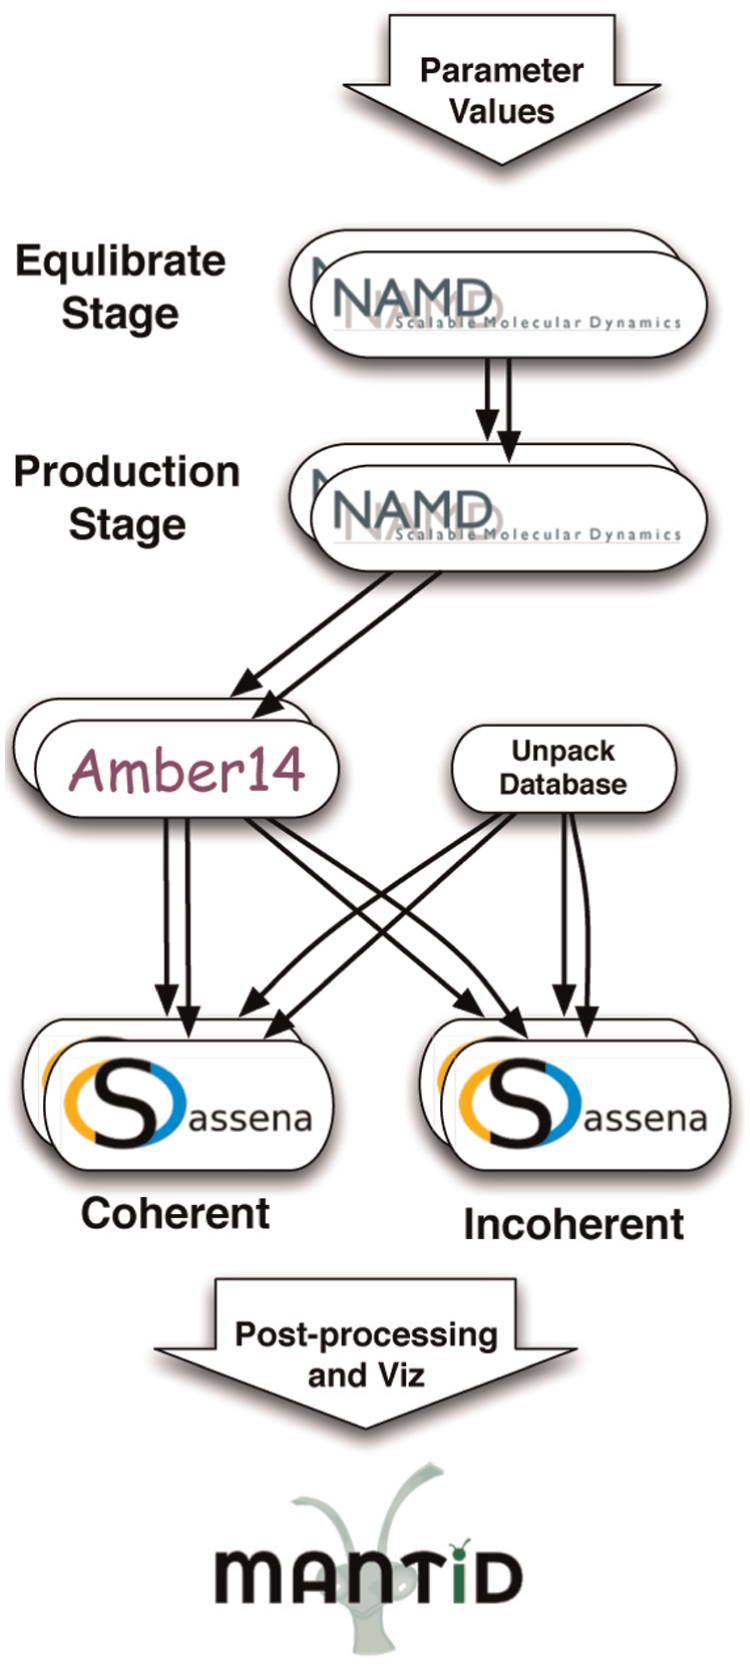
The SNS refinement workflow executes a parameter sweep of molecular dynamics and neutron scattering simulations to optimize the value for a target parameter to fit experimental data.
2.2 ACME
The ACME project is using coupled models of ocean, land, atmosphere and ice to study the complex interaction between climate change and societal energy requirements. One of the flagship workflows of this effort is the fully-coupled climate model running at high resolution.
The complete workflow for ACME is illustrated in Figure 3. The ACME climate modeling effort involves the interaction of many different software and hardware components distributed across computing resources at several DOE laboratories. As part of the ACME project, many of the workflow activities that were previously done manually are being automated. The goal is to have an automated, end-to-end workflow that provides full data provenance.
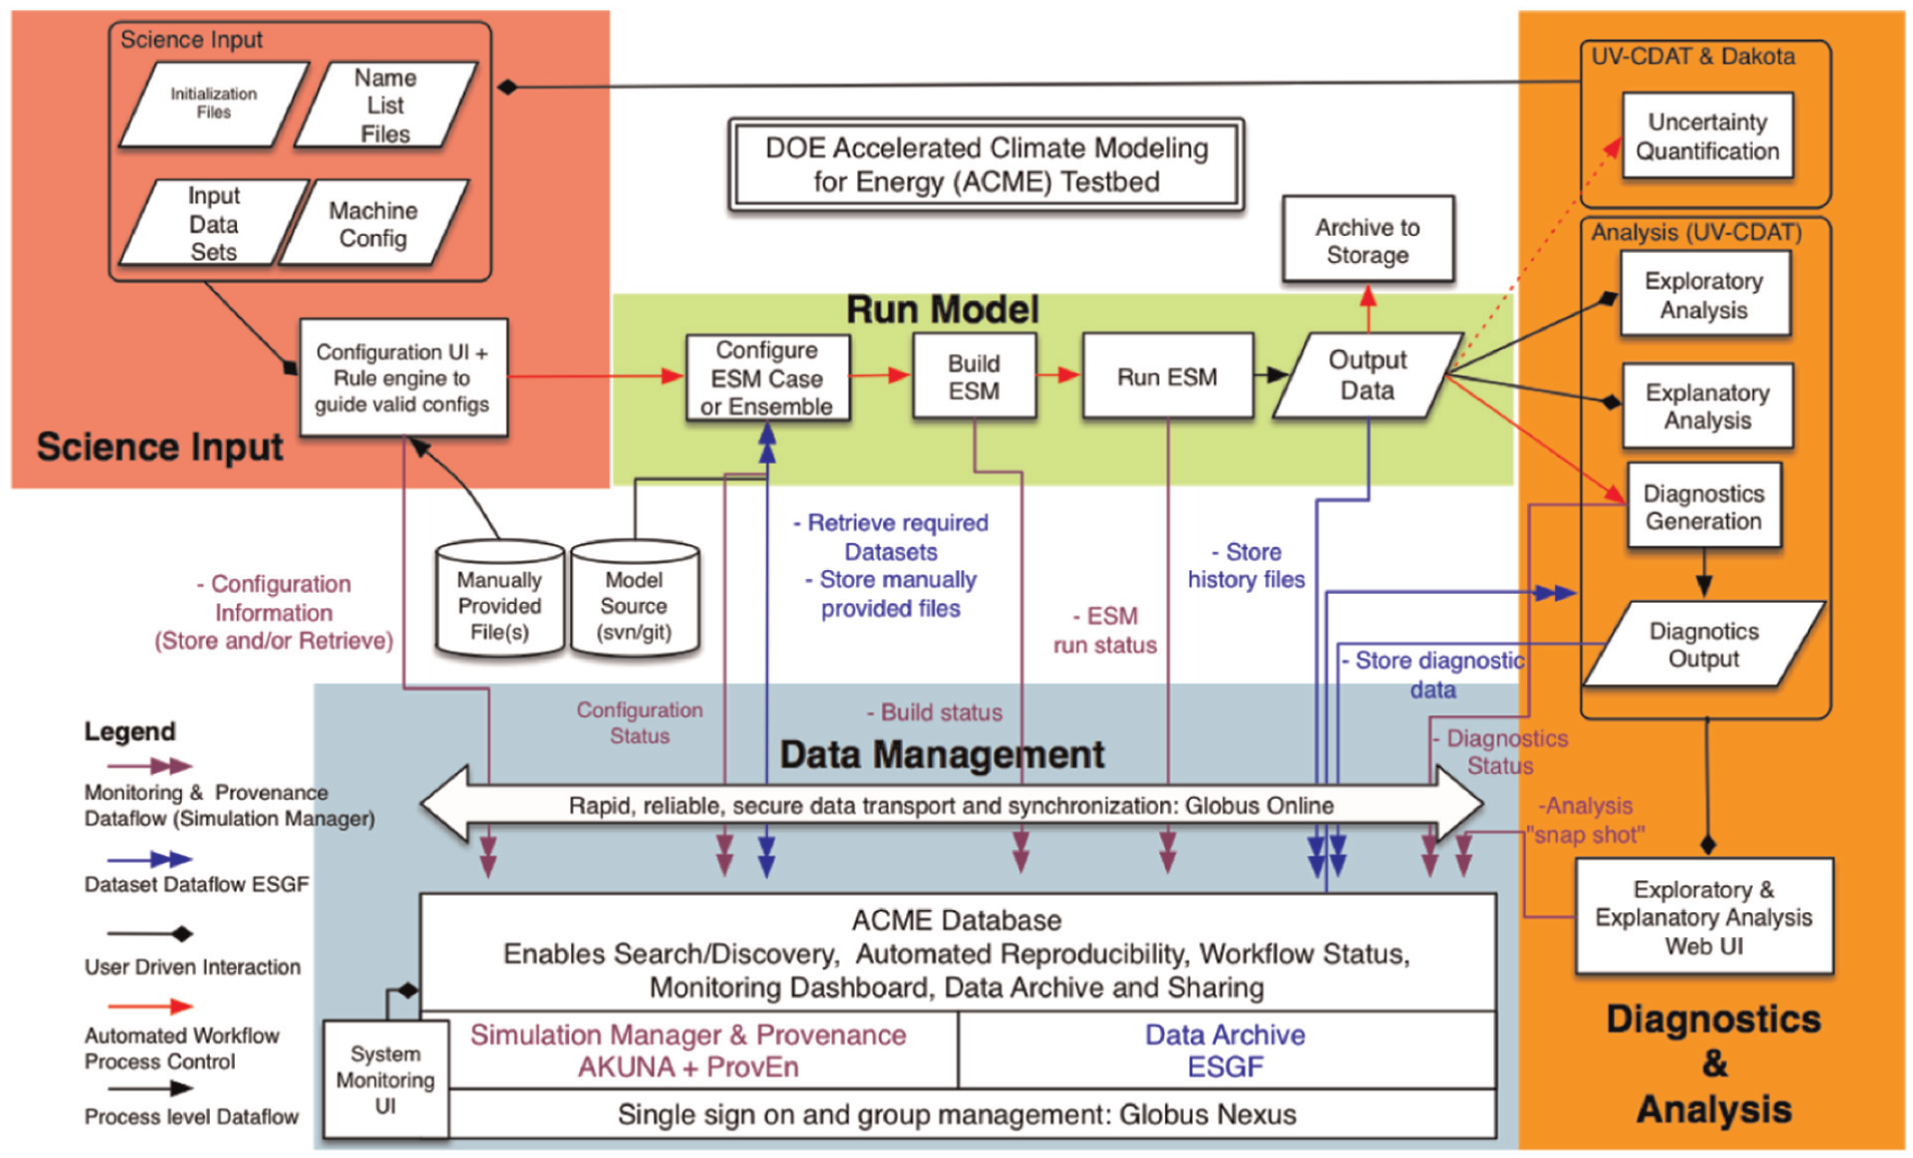
The complete Accelerated Climate Modeling for Energy (ACME) includes many interacting components distributed across DOE labs.
One important step towards that goal is to automate the small portion of the full workflow that involves running the ACME climate model. The PANORAMA project is developing a workflow that automates the manual effort involved in monitoring and resubmitting the model code in case of failures, and provides periodic reporting for validation of science outputs. The workflow, illustrated in Figure 4, divides a large climate simulation into several stages. Each stage completes a portion of the total target simulation time. For example, a 40-year simulation may be divided into eight 5-year stages. This enables each stage of the workflow to be completed within the maximum walltime permitted for batch jobs on the target DOE leadership class computing system. Restart files generated at the end of each stage are used as input to the next stage in order to continue the simulation. Each stage also produces history files, which are used by the workflow to automatically compute summary data called climatologies. This climatology data can be reviewed periodically by project scientists to ensure that the simulation is progressing as expected, so that problems can be identified, and corrections made, before computing resources are wasted. Both the history files and the climatologies are transferred to HPSS and CADES (open infrastructure) for long-term storage and future analysis.
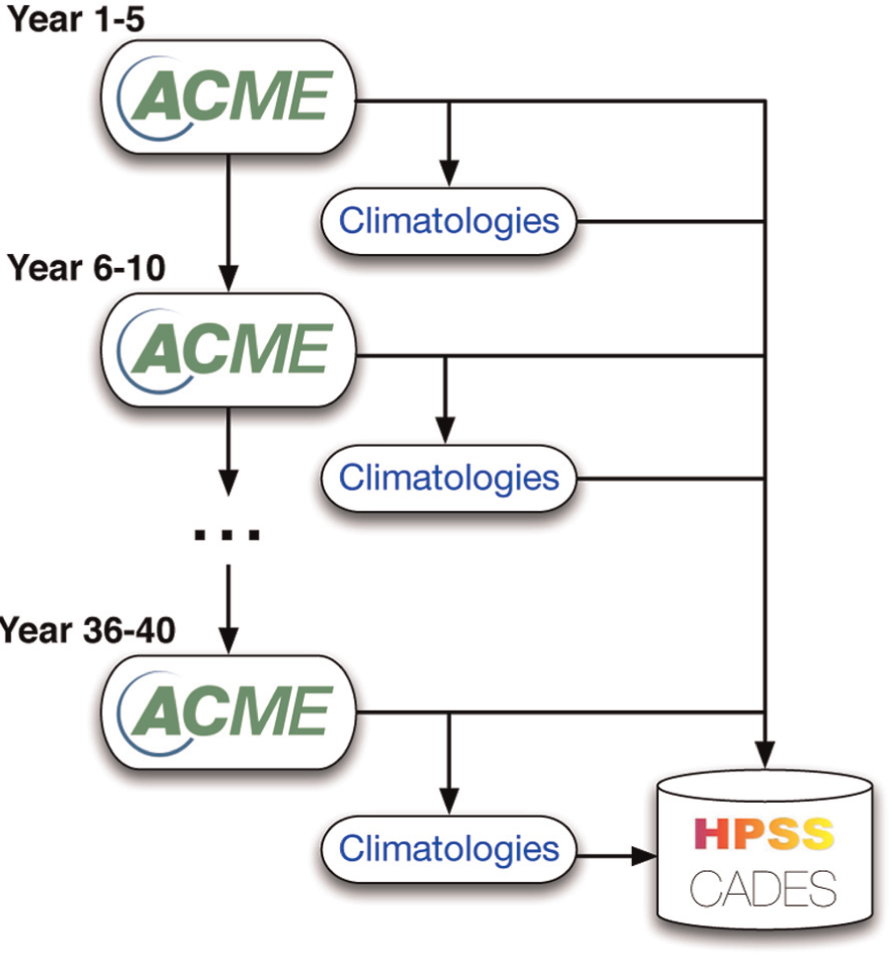
The ACME workflow runs one climate simulation in several stages. The output of each stage is used to compute climatologies for validation. All outputs are stored in HPSS and CADES for archiving and further analysis.
3 Workflow execution
In order to facilitate workflow creation, scientists need to be able to formulate the workflows in a way that is meaningful to them, in a resource-independent way, using high-level abstractions to specify the structure of the analysis and the data to be operated on (via a visual or textual representation). This abstract workflow (or workflow instance) is important because it uniquely identifies the analysis to be conducted at the application level, without including operational details of the execution environment. The workflow instance can be published along with the results of a computation to describe how a particular data product was obtained. This approach supports reproducibility, a cornerstone of the scientific method. In order to support the use of abstract workflow specifications, planning technologies are needed to automatically interpret and map user-defined, abstract workflows onto the available resources.
Workflow technologies have been demonstrated to be very effective in exploiting coarse-grain parallelism in applications running on distributed infrastructures such as grids and clouds (Deelman et al., 2009). Our system, Pegasus (Deelman et al., 2015), focuses on scalable, reliable and efficient workflow execution on a wide range of systems, from user’s desktops to leadership class machines (Deelman et al., 2006; Vahi et al., 2013b). The cornerstone of our approach is the separation of the workflow description from the description of the execution environment, which results in: (1) workflows that are portable across execution environments; and (2) the ability for the workflow management system to make performance- and reliability-focused decisions at “compile time” and/or at “runtime”. Pegasus pioneered the use of planning in scientific workflow systems (Deelman et al., 2002). It takes a resource-independent, or abstract, workflow description, automatically locates the input data and computational resources necessary for workflow execution, maps/plans this description onto the available execution resources, then reliably executes the plan. When errors occur, Pegasus tries to recover when possible by retrying tasks, by retrying the entire workflow, by providing workflow and task-level checkpointing, by re-planning portions of the workflow, by trying alternative data sources for staging data, and, when all else fails, by providing a rescue workflow containing a description of only the work that remains to be done. A Pegasus workflow can process millions of tasks and terabytes of data, so storage management is important. Pegasus has a sophisticated model for reasoning about and optimizing data transfers and it cleans up storage as the workflow is executed so that data-intensive workflows have enough space to execute on storage-constrained resources (Srinivasan et al., 2014).
4 Characterizing workflows
Workflow behavior modeling and analysis methods need accurate execution event traces and monitoring information to build models of system behavior and conduct anomaly detection and diagnosis. Here, we describe some of the tools and techniques we are using in PANORAMA.
4.1 Workflow monitoring
Workflow-level monitoring collects information about events in the execution of a workflow that are critical to understanding its behavior. The STAMPEDE (Gunter et al., 2011; Samak et al., 2011a, b; Vahi et al., 2013a) framework collects monitoring data by parsing and correlating log files that are generated by the workflow management system. These logs contain information about the submit time of the jobs, the time when the jobs are sent to the remote system for execution, and the time when they are reported finished or failed. The logs also have information about the progress of the workflow through time, for example, when the data dependencies have been satisfied. This data can be used to compute runtimes, queue delays, and other important performance metrics.
4.2 Task monitoring and profiling
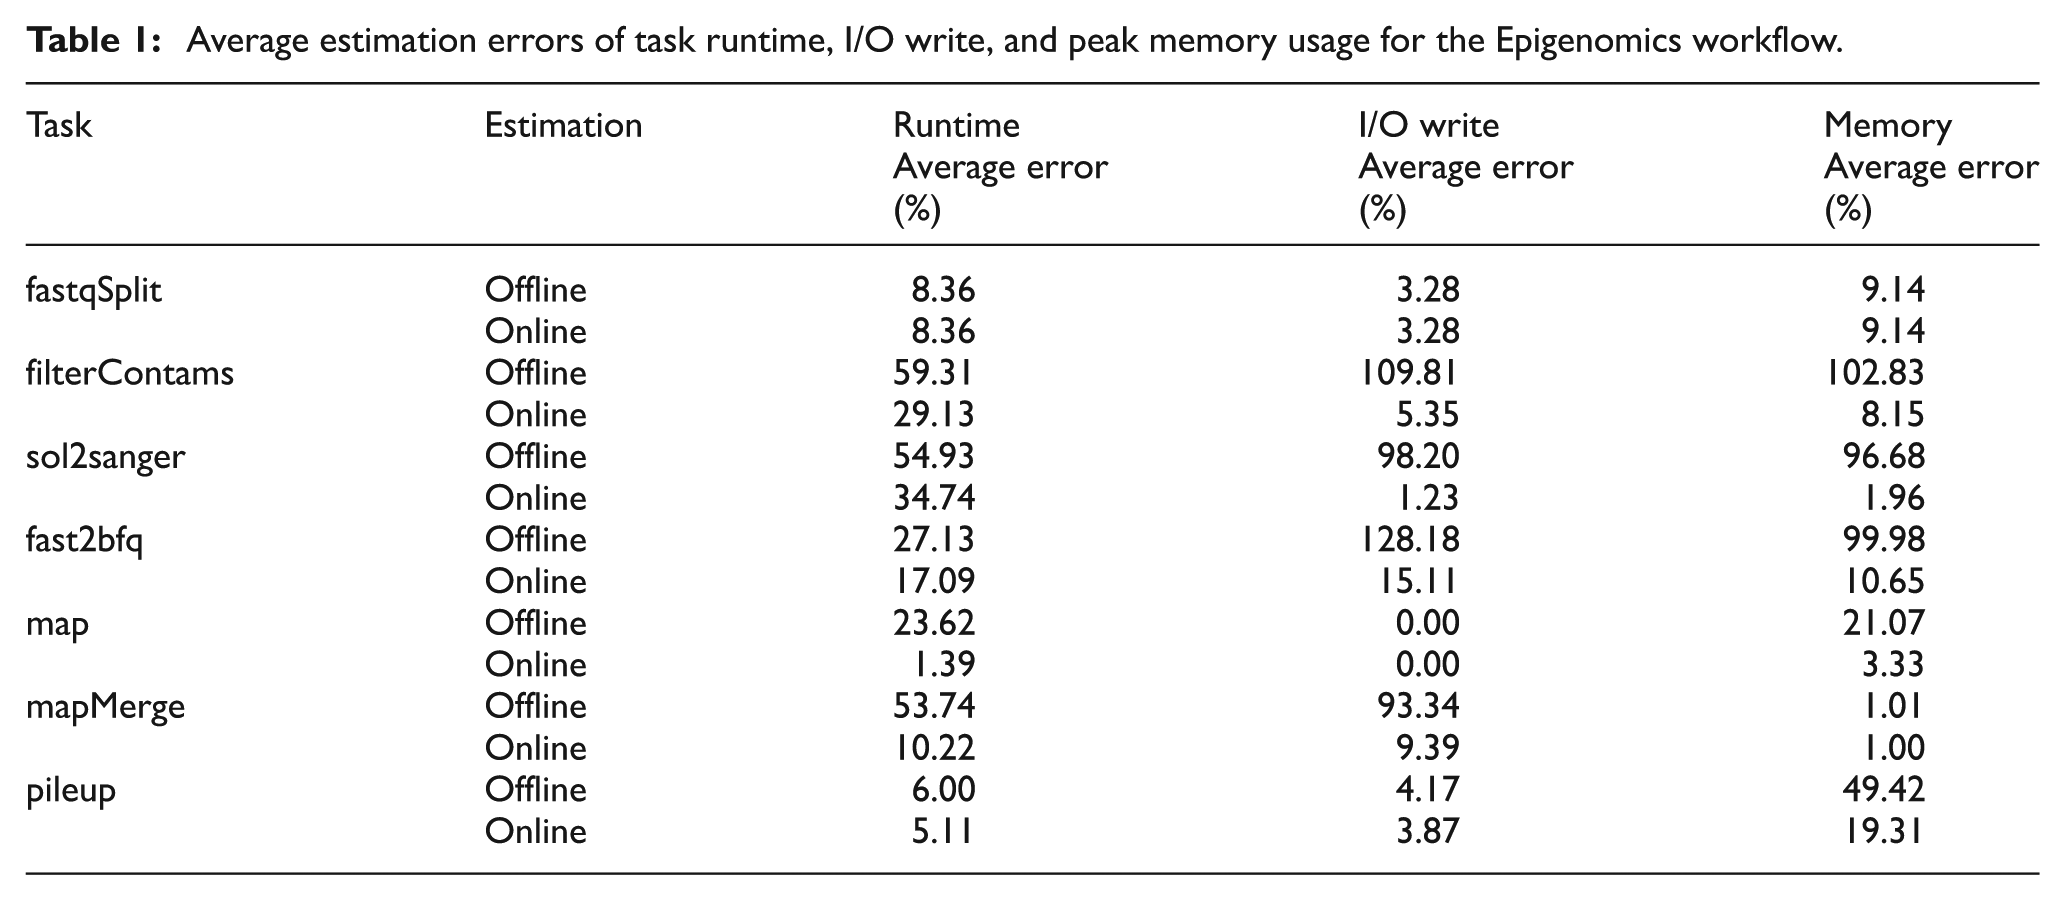
Task-level monitoring can be used to measure and predict the resource requirements of workflows. In addition to workflow-level data, the STAMPEDE framework also collects information about the execution of workflow tasks on remote resources using Kickstart (Vöeckler et al., 2006), a monitoring tool launched along with the computation and data management tasks to collect information about the behavior of the tasks and their execution environment. As part of the DOE dV/dt project 8 we added functionality to Kickstart to automatically capture resource usage metrics of workflow tasks (Juve et al., 2014). This functionality uses operating system monitoring facilities as well as system call and library call interposition to collect fine-grained profile data that includes process I/O, file accesses, runtime, memory usage, and CPU utilization. Using this information, we developed techniques based on machine learning algorithms for automatically modeling and predicting the resource usage of workflow tasks (Ferreira da Silva et al., 2013b, 2015), such as runtime, disk usage and memory consumption. This approach combined with a Monitor Analyze Plan Execute (MAPE-K) autonomic computing loop (Kephart and Chess, 2003), is used for online estimation of task needs as the workflow executes. Experimental results show that this online process produces more accurate estimates than a comparable offline method. Table 1 shows an example of using this approach for a bioinformatics application (Epigenomics) and quantifies the prediction errors.
Average estimation errors of task runtime, I/O write, and peak memory usage for the Epigenomics workflow.
4.3 Application monitoring
As part of the PANORAMA project we will develop the capability to capture monitoring data that is generated by application tasks. Unlike task-level monitoring data, which is collected using operating system facilities, application-level monitoring data cannot be computed by tools outside the application because it requires access to the application’s internal state. This includes progress information such as the percent of the task that has been completed, performance metrics such as the number of timesteps being completed per hour, and diagnostic information such as error messages. We will provide an interface for application code to easily export this data in a structured format. This interface will also enable us to collect application metadata that is only known at runtime.
4.4 Infrastructure monitoring
The previous monitoring techniques are not sufficient for modeling the behavior of scientific workflows. Additional information about the infrastructure is also required to understand the observed performance of workflows. Network performance monitoring using tools such as perfSONAR (Tierney et al., 2009), for example, is crucial to discover “soft failures” in the network, where the network seems to be up, but is performing at just a fraction of it’s peak efficiency, which translates to poor performance for data-intensive workflows. perfSONAR instances can run continuous checks for latency changes and packet loss, and run periodic throughput tests using a suite of already available tools such as BWCTL, OWAMP, and NDT. There are currently around 1200 perfSONAR instances worldwide, providing us with critical network performance information.
5 Analytical models
5.1 Performance modeling with Aspen
Our
Aspen’s DSL approach to analytical performance modeling provides several advantages over traditional approaches. For instance, Aspen’s kernel construct helps to fully capture control flow, and preserves more algorithmic information than traditional frameworks (Spafford and Vetter, 2012). Aspen’s model also captures the important concepts of data capacities and data movement in very explicit terms. Similarly, the abstract machine model is more expressive than frameworks that reduce machine specifications to a small set of parameters. The formal language specification forces scientists to construct models that can be syntactically checked and consumed by analysis tools. This formal specification also facilitates collaboration between domain experts and computer scientists, and enables scientists to include application specific parameters in their model definitions, which would otherwise be difficult to infer. Finally, Aspen is modular, and therefore it is easy to compose, reuse, and extend performance models. With these features, Aspen can help answer important application-specific questions.
Aspen is complementary to other performance prediction techniques including simulation (Janssen et al., 2011; Rodrigues et al., 2011), emulation, or measurement on early hardware prototypes. Compared to these techniques, Aspen’s analytical model is machine-independent, has fewer prerequisites (e.g. architectural descriptions, application source code), and can be computed very efficiently.
5.1.1 Performance modeling of workflows
Many workflow systems have been integrated with performance monitoring and analysis tools (da Cruz et al., 2008; Ostermann et al., 2009; Truong and Fahringer, 2004). These systems typically collect only coarse-grained information, such as task runtime and data size. Using Kickstart (Section 4) enables us to collect fine-grained profiles including I/O, memory, CPU usage, and runtime data for use in performance modeling.
In most workflow models, the focus is on performance prediction of individual computational tasks. Data transfer and management tasks that are present in workflows are either not modeled, or are modeled very simplistically. Thus, existing performance predictions are not realistic and not detailed enough to help scientists and infrastructure providers estimate application performance, and pinpoint and diagnose issues, and schedule resources dynamically.
Profiling data, which is automatically collected during workflow execution and includes detailed runtime and resource usage statistics, can be used to create a historical performance model of the workflow, which is able to generate these estimates. In addition, profiling data can be used to guide resource provisioning algorithms that require estimates of resource usage (Mao and Humphrey, 2011; Ostermann et al., 2010; Singh et al., 2006)
Aspen (Spafford and Vetter, 2012) was originally designed with the capability to model large scale scientific applications running on traditional HPC systems (e.g. Titan, with hybrid CPU/GPU architecture, or Mira with the Blue Gene/Q architecture). Current Aspen constructs model low-level resources such as cores, memory access patterns, MPI communication, and memory capacity. We have been extending Aspen to include application features and resources necessary for workflows, and, in particular, the following.
5.2 Automatic generation of Aspen performance models from Pegasus descriptions
One major benefit to our approach is symmetry in representations of Pegasus workflows and Aspen performance models. In fact, we can use the structured Pegasus framework to generate Aspen performance models automatically. Because Aspen is a structured language that mirrors concepts (e.g. subroutines, loops) in traditional languages such as C and Java, it is straightforward to generate performance models from other structured representations (Lee et al., 2015).
We have started the implementation of a post-processing phase during the Pegasus compilation that will use the Pegasus intermediate abstract workflow representation (i.e. DAX) to construct an Aspen model, which maps the dependencies in the workflow to an Aspen control flow sequence. (The infrastructure model is different from the workflow model, and is developed in a later time.)
Figure 2 shows an example DAX developed for an SNS workflow. It contains two sequences with different parameter values within a single workflow. Listing 1 shows the results as an Aspen kernel, with three major steps. The first step runs a pair of sequential equilibrium and production dynamics NAMD calculations. The second step unpacks the database in parallel with the two AMBER ptraj tasks. The final step runs the two Sassena tasks in parallel with each other.
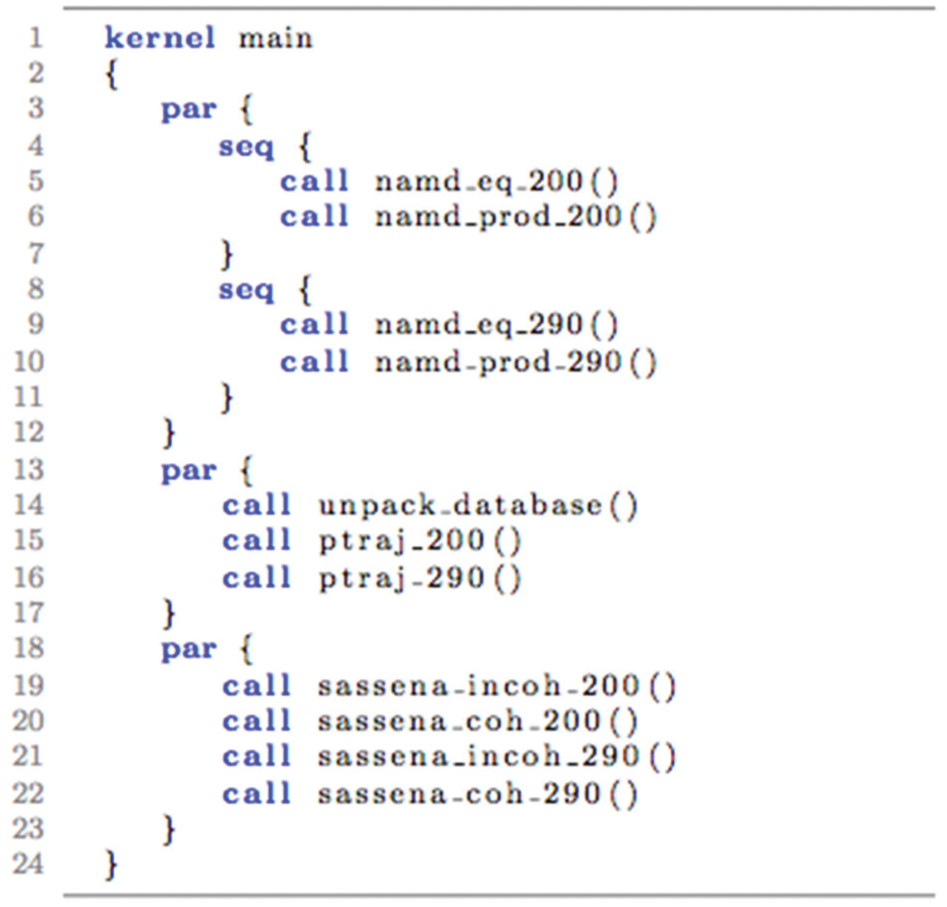
Automatically generated Aspen model for example SNS workflow.
In Aspen, statements within a par clause execute independently, i.e. with task parallelism, and statements within a seq clause must be executed in order, i.e. they have sequential dependencies. Our initial scheduler performed a wavefront-like algorithm, grouping each set of tasks with completed dependencies into a par clause, repeating within one master sequential region until all tasks completed. Because Pegasus operates at the level of individual tasks, however, this schedule was only accurate if all tasks within a group took the same amount of time. As such, we implemented an advanced scheduler, which is a more direct translation of the dependencies and more accurately matches Pegasus scheduling behavior.
5.3 Evaluating the use of analytical models
Validation of any general performance model is a difficult task. The most obvious validation step would be to use the model to generate a performance prediction, and compare the performance against a measured value. This strategy has weaknesses, generally stemming from one important fact: performance is machine-dependent, and so cannot effectively disambiguate the correctness of our generated application/workflow models from that of the machine model. This means that we must generate multiple predictions and measurements in an attempt to disambiguate not only across machines, but across scales, and across scaling rates.
In the case of Aspen, two facets work in our favor. First, Aspen models are not based on runtime, but on resource usage. This means we can query the Aspen models to derive, for example, counts of floating point operations or messages. While these values might vary based on compiler or library, they are far more machine-independent and can be measured with tools such as hardware counters and MPI library interposition to give a ground truth against which we can judge our application models. Second, Aspen is an analytical tool, and can output not simply values for runtime and resource usage, but also symbolic equations. In some cases, this makes validation possible against algorithmic expectations. For example, we can use Aspen to validate that the number of floating point operations in a matrix multiplication is equal to
As Section 5.1 points out, the context of workflows adds complexity. However, extending the MPI measurement to TCP/IP communication, and adding I/O measurement can give us additional metrics for validating our workflow models. Sections 6 and 7 also describe additional monitoring which can aid this process, and we note that anomaly detection is not only more useful with a performance model in hand, but can assist in validating that same performance model.
6 Correlating monitoring of workflows and infrastructure
An accurate attribution of the anomalies to the observed workflow performance is critical for fixing the problem, or adapting the system. In some cases the observed anomaly may have complex causes. For example, poor task performance can be caused by a slow CPU, by poor cache performance, by a slow disk, etc. Low task throughput within a workflow execution can be attributed to bottlenecks in the workflow engine, a lack of computational resources, or application errors. The end-to-end performance of data-intensive workflows is even more complex as it often depends on efficiently moving large data sets. This can be accomplished using bandwidth provisioned high-speed networks, however, performance in such networks is affected by a large number of factors, including: congestion, packet loss, end-host network and I/O performance, and end-host network tuning, among others. Thus, to diagnose these complex problems, we need to correlate observed performance with monitoring information coming from a number of systems (CPU, network, I/O, storage, etc.), and determine which of these systems is the most likely cause of the problem.
Using a combination of system monitoring utilities like the sysstat suite, nethogs, iotop, and the multi-domain networking monitoring tool, perfSONAR, we are conducting a parametric study of data transfer performance for workflows in a controlled and isolated environment using a testbed called ExoGENI (Baldin et al., 2012). We are exploring different workflow configurations based on throttling of data volumes, different data transfer modes (sharedfs, nonsharedfs/pegasus-lite, nonsharedfs-condorio) (Deelman et al., 2015), and multiple distributed domains. This will enable us to define baseline expected data-transfer performance and the monitoring manifestations of different performance profiles. We plan to combine this with other monitoring and profiling tools described in Section 4. We will use this monitoring information and the output of analytical performance models from Aspen to conduct a thorough evaluation of these different kinds of correlations. This will help in detecting anomalies in an online fashion.
7 Anomaly detection and diagnosis
Anomalies should be detected when there is a deviation of observed workflow performance from the end-to-end performance model. At the same time, for accurate diagnosis, the observed performance deviations need to be traced to anomalies at the application, workflow, and infrastructure levels. A combination of offline and online strategies needs to be developed for detecting performance anomalies during workflow execution, and for diagnosing the root causes of the observed problems.
7.1 Offline anomaly classification
Our initial approach is to classify the different types of anomalies that can cause problems with end-to-end workflow performance, and use offline methods to determine the severity of the anomalies. Infrastructure anomalies contribute to a number of issues with application performance. Among them are: resource unavailability (Russell et al., 2006) poor I/O performance (Mandal et al., 2013), disk failure, file system corruption, violations of disk quotas (Deelman and Chervenak, 2008), poor network performance due to congestion and packet loss (Mathis et al., 1997), firewalls (which often drop packets in flows over 1 Gbps), limitations in LAN switches (which may not have enough buffering to handle multiple simultaneous flows), bad optical fiber, and others. Typical application anomalies seen during workflow execution include: input data unavailability, application execution errors (Ferreira da Silva et al., 2013a), and poor performance for tasks with very short execution times (Chen et al., 2014; Ferreira da Silva et al., 2014b). Workflow-level anomalies are deviations in workflow-level performance metrics, such as: low task throughput, which may indicate problems with resource availability; high task error rates, or significant changes in task error rates; slow end-to-end data transfers; data sets that are larger or smaller than expected; long queue wait times, which may indicate low resource availability or fairness and priority issues; and low resource utilization, which may be caused by resource failures, over-provisioning, or misconfiguration.
We need to quantify anomaly severity in discrete anomaly levels so that different sets of actions can be triggered to address different levels of the diagnosed anomaly. For example, some anomalies may be critical to workflow performance, such as input data unavailability, while others may only reduce application performance, such as long queue wait times. Anomaly levels can be determined based on thresholds that are derived by clustering performance metrics into groups. The threshold value of an anomaly level will be determined from execution traces collected and published in the workflow archive developed as part of the DOE dV/dt project (Ferreira da Silva et al., 2014a), 9 for which different thresholding approaches can be used. Anomaly levels and thresholds will, initially, be determined offline; thus they will not add any overhead to the workflow execution.
7.2 Real-time anomaly detection
We developed a persistent query agent (PQA) (Mandal et al., 2014) that enables persistent queries on data federated from different sources, including multi-domain infrastructure monitoring data, and workflow and application performance data. Using this agent, it is possible to run continuous queries on disparate data sources and get asynchronous, real-time notifications when relevant performance events occur. We will leverage the PQA framework to combine offline anomaly analysis, Aspen performance model evaluations, and multi-domain monitoring data for online, real-time detection and scalable distribution of the triggers to the appropriate stakeholders.
It is important to define, ahead of time, which metrics are important for particular application use cases by benchmarking executions of individual applications. It is also imperative to register the application-level metrics, workflow-level metrics, and infrastructure metrics with the system so that persistent queries can refer to these metrics while constructing event conditions that might result in anomaly triggers. This will make it possible to use a unified mechanism to understand anomalies in multi-domain infrastructure, anomalies in the application, and anomalies in the application’s view of the infrastructure. The Aspen analytical performance models will also help in identifying critical metrics, and hence aid in the design of the persistent queries. Predictions from the analytical models will also be pushed as events into the PQA making it possible to do “continuous diffs” of observed metric values with values predicted from the end-to-end models. Initially, our anomaly detection algorithms will follow a threshold-based approach, which not only considers deviations from performance models, but also employs a complex event processing engine to pull together relevant monitoring events from disparate sources to generate anomaly triggers. In the future, we will extend this real-time, event-based approach, which is purely based on discrete events (no/minimal history), to an approach that constructs temporal signatures from time-series data and compares them with known anomaly signatures.
Another advantage of the persistent query mechanism is that the anomaly triggers immediately identify the corresponding persistent query, and hence the precise event condition that led to the trigger. Since persistent queries are constructed using well-defined metrics, an analysis of associated metrics for each query that got triggered due to an anomaly condition would help identify or narrow down the root cause of performance deviations. The triggers are also distributed in a scalable fashion using a publish-subscribe framework, which makes it possible to inform only the interested stakeholders. For instance, different persistent queries will be relevant for different stakeholders. Since all of these queries can co-exist in the system, and triggers are associated with queries, only the stakeholders who are interested in the anomaly event condition will be notified. Hence, the design of persistent queries will take into account the different possible use cases: scientist use cases, workflow management system use cases, infrastructure adaptation use cases, resource provisioning use cases, and infrastructure operator use cases.
8 Hybrid modeling: interleaving simulation with analytical modeling
Workflow models will undoubtedly have many components and interactions among those components. We will use simulation to help understand workflow components for which analytical models are not sufficiently accurate. The two simulation components are described below.
Rensselaer’s Optimistic Simulation System (ROSS) (network simulation) is a framework for developing parallel discrete event simulations. ROSS has demonstrated highly scalable, massively parallel event processing capability for both conservative and optimistic synchronization approaches (Barnes et al., 2013; Bauer Jr. et al., 2009; Carothers and Perumalla, 2010; Liu et al., 2012; Mubarak et al., 2012). ROSS mitigates Time Warp state-saving overheads via reverse computation (Carothers et al., 1999). In this approach, rollback is realized by performing the inverse of the individual operations that were executed in the event computation. This eliminates the need to explicitly store prior logical process (LP) state, which represents a distinct component of the model state, leading to much more efficient memory utilization. We have leveraged reverse computation to demonstrate massively parallel performance of the ROSS simulation engine (Bauer Jr. et al., 2009) in several models. Most recently, ROSS optimistic event processing has demonstrated super-linear performance for the PHOLD benchmark using nearly 2 million Blue Gene/Q cores on the 120 rack Sequoia supercomputer system located at LLNL (Barnes et al., 2013).
CODES storage simulation: we also developed the CODES simulation framework (based on ROSS), which combines models of storage devices, high-performance networks, I/O forwarding infrastructure, and storage software into a unified parallel discrete event simulation model. CODES can simulate complete, large-scale storage systems all the way from individual application processes to individual storage device accesses.
Traditionally, users are required to create a simulation structure for the component of interest, and the interactions with those components. Since we already have the high-level structured analytical model of the target workflow in Aspen, we intend to use this Aspen model to drive the ROSS/CODES simulation of the component under consideration, and the external interactions that it expects (analytically). For example, in this combined framework, we will be able to use an Aspen model for the entire workflow (e.g. Climate model simulation), and then use the CODES simulator to simulate a component of the workflow (e.g. HPSS storage system) in great detail. The Aspen model will generate the I/O requests and transfers to the components (e.g. HPSS) in the simulator, and use analytical models for the remainder.
9 Related work
There have been several previous efforts to characterize the workloads of distributed systems (Hart, 2011; Iosup and Epema, 2011; Mahambre et al., 2012; Ren et al., 2012). For instance, Iosup and Epema (2011) and Hart (2011) presented analyses of Grid and HPC workload characteristics including system usage, user population, application characteristics, and characteristics of grid-specific application types. Analysis of MapReduce job characteristics such as CPU utilization, memory usage, slots allocation, I/O operations, and network transfers was presented in Ren et al. (2012). Cloud workload patterns (periodicity, threshold, relationship, variability, and image similarity) were identified in Mahambre et al. (2012). These studies typically use data provided by Grid and HPC workload archives (Germain-Renaud et al., 2011; Iosup et al., 2008; Kondo et al., 2010). 10 These workloads mainly capture information about task executions, but lack critical information about scientific workflow executions such as task dependencies, task clustering, etc.
In the area of characterization and profiling, some efforts have been made to collect and publish traces and performance statistics for real scientific workflows, such as workflow-based workload traces from the Austrian grid (Ostermann et al., 2008a, b), provenance-based workloads from a workflow management system (Madougou et al., 2013), a survey of workflow characteristics from several research domains including bioinformatics, medical informatics, weather and ocean modeling, and astronomy (Ramakrishnan and Gannon, 2008), and workflow-based workloads from a science gateway (Ferreira da Silva and Glatard, 2013). We have characterized and profiled scientific workflows to understand and predict their resource requirements (Bharathi et al., 2008; Ferreira da Silva et al., 2013b, 2015; Juve et al., 2013), and recently, we published traces for a few workflows executed using Pegasus (Ferreira da Silva et al., 2014a), and synthetic workflows based on statistics from real applications for use in simulations (Ferreira da Silva et al., 2014a). 11
Performance modeling spans a large range of techniques, from analytical modeling to simulation. In analytical modeling, predictions can be obtained without directly using the application source code. These modeling methods range from ad-hoc, hand-written models to more structured methods such as BSP (Valiant, 1990) and LogP (Alexandrov et al., 1995; Culler et al., 1993). The strength of analytical approaches when evaluating far-future architectures is shown in the HPC space in two examples considering fast Fourier transform (FFT) for exascale systems in Gahvari and Gropp (2010) and Czechowski et al. (2012). Aspen extends these analytical modeling concepts to a formal DSL and adds extensibility and flexibility to analytical techniques; see Spafford and Vetter (2012) for a treatment of FFT on HPC architectures. Aspen is under active development and investigation for a variety of performance modeling contexts; see Spafford et al. (2013) for a more recent example of the use of Aspen in the HPC space.
10 Future work
In addition to real workflows we will also develop synthetic workflows that emulate the behavior of the real applications, but allow us to easily vary parameters such as the input data size and the task runtimes. This will be supported by profiling the applications using our workflow profiling tools, which will be extended to support parallel applications and to collect additional metrics that characterize application behavior.
We will also identify and develop mechanisms for collecting and correlating infrastructure, workflow, and application monitoring data. This will involve developing new tools and enhancing existing tools to extract monitoring data and transport it to a central location for correlation and analysis. We plan to use the empirical monitoring data to validate the Aspen performance models for the different workflow use-cases. We will also validate the models using the ExoGENI and ESnet testbeds.
We plan to develop offline techniques for clustering and classifying anomalies based on thresholds and time-series data. We will extend our persistent query tool to use both Aspen performance models and monitoring data, and design new persistent queries for real-time detection and diagnosis of anomalies. To evaluate the accuracy of our anomaly detection approach we plan on using a combination of fault and load injection.
We will extend the Aspen analytical models and integrate them further with ROSS/CODES to facilitate detailed simulations, where analytical models lack the necessary insights.
We will also explore and implement adaptation techniques, which will be automatically triggered when anomalies and failures are detected.
Figure 5 shows how all of these components will fit together. Pegasus will call Aspen tools to generate estimates of workflow and task performance based on application parameters and workflow, task and machine models. These tools will be constructed as libraries that can be called directly by Pegasus. Aspen, in turn, will call ROSS/CODES to simulate complex infrastructure components such as the network or storage system. As the workflow is executing, Kickstart will collect task- and application-level monitoring data in real time and report it back to Pegasus through a REST interface. The monitoring data, performance estimates, and workflow state information will be stored in a relational database. Infrastructure monitoring components will track the performance of network, storage, and computing systems and report that information to an InfluxDBSee http://influxdb.com time series database. Infrastructure and application monitoring data will be correlated by the persistent query agent, which will query data from the workflow and infrastructure monitoring databases. The correlated data will be examined to identify anomalies, which will be reported to users through a web-based dashboard, and sent back to Pegasus through the REST interface to guide workflow adaptation.
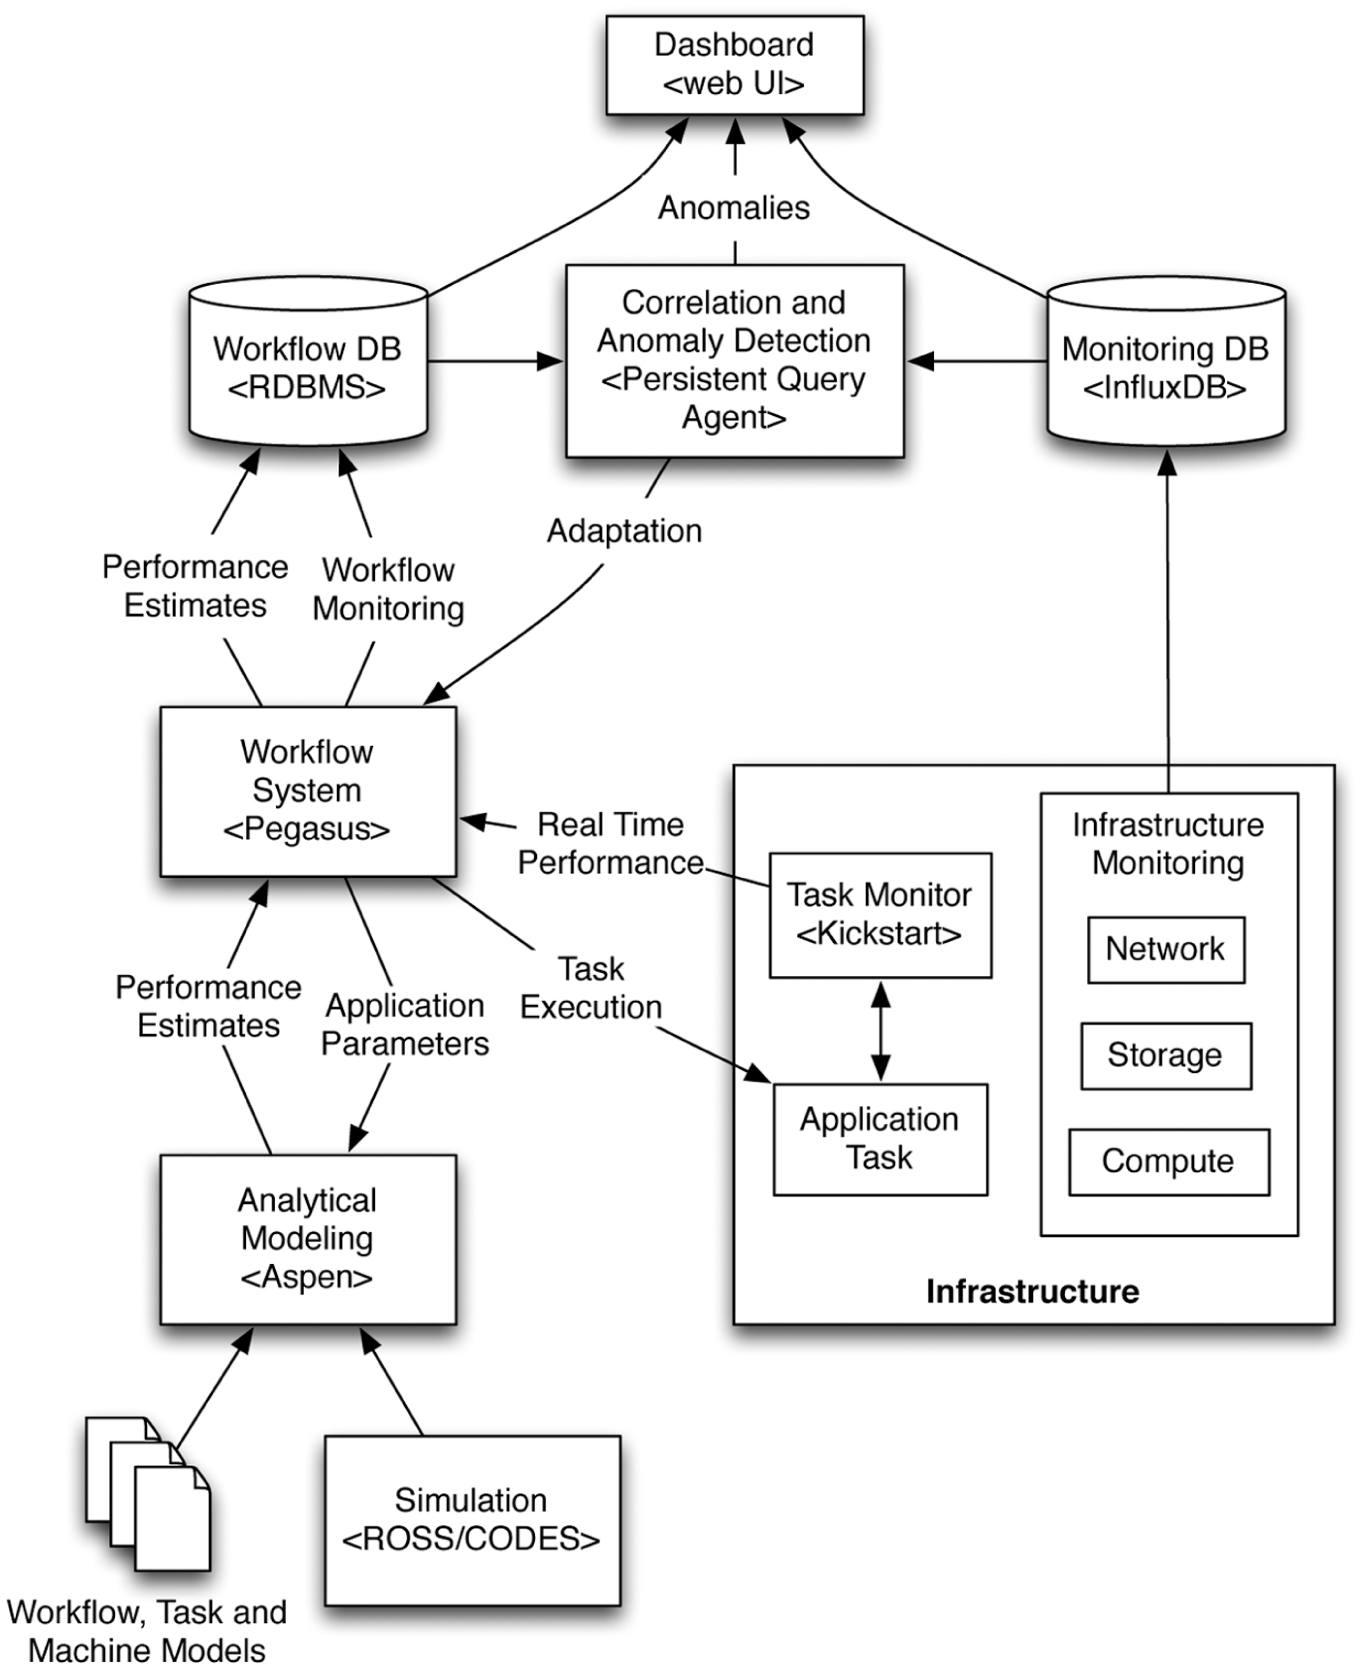
PANORAMA architecture.
Footnotes
Funding
This work was funded by the DOE (contract number DE-SC0012636, “Panorama - Predictive Modeling and Diagnostic Monitoring of Extreme Science Workflows”). The development of the neutron scattering simulation workflow was supported by the US Department of Energy (DOE), Office of Science, Basic Energy Sciences, Materials Sciences and Engineering Division. The use of Oak Ridge National Laboratory’s Spallation Neutron was sponsored by the Scientific User Facilities Division, Office of Basic Energy Sciences. This manuscript has been authored, in part, by Oak Ridge National Laboratory, which is managed bb UT-Battelle, LLC under Contract No. DE-AC05-00OR22725 with the US Department of Energy. The United States Government retains and the publisher, by accepting the article for publication, acknowledges that the United States Government retains a non-exclusive, paid-up, irrevocable, world-wide license to publish or reproduce the published form of this manuscript, or allow others to do so, for United States Government purposes. The Department of Energy will provide public access to these results of federally sponsored research in accordance with the DOE Public Access Plan (![]() ). This research is sponsored by the Office of Advanced Scientific Computing Research in the US Department of Energy.
). This research is sponsored by the Office of Advanced Scientific Computing Research in the US Department of Energy.