
Abstract
Gene network expansion is a task of the foremost importance in computational biology. Gene network expansion aims at finding new genes to expand a given known gene network. To this end, we developed gene@home, a BOINC-based project that finds candidate genes that expand known local gene networks using NESRA. In this paper, we present NES2RA, a novel approach that extends and improves NESRA by modeling, using a probability vector, the confidence of the presence of the genes belonging to the local gene network. NES2RA adopts intensive variable-subsetting strategies, enabled by the computational power provided by gene@home volunteers. In particular, we use the
1 Introduction
Biological processes are often regulated at the transcriptional level, via gene regulatory networks (GRNs) (Hasty et al., 2001) comprising regulatory genes, known as transcription factors, and regulated genes. So far, in most cases, only a small fraction of the genes involved in a GRN are known, and usually collected in local gene networks (LGNs) that are subsets of genes known to be causally connected. These genes are discovered through ad hoc experiments testing in vivo the hypothesis that a given gene participates in a specific biological process. Thus, there is an urgent need to fill this knowledge gap in order to have a better picture of most biological processes and translate biology into medical, biotechnological, and agricultural applications. A major contribution in this field has come from the new sequencing technologies, which dramatically increased the sequence output capacity and equally decreased the cost per sequenced base. 1
Nowadays, we are witnessing an exponential increase of sequencing data and gene expression data in public databases. The collection and integration of these data sets has offered new opportunities and challenges to the field of computational biology. In particular, the analysis of the huge amount of available gene expression data can lead to the discovery of causal relationships between the genes of an organism and link them to a specific biological process. However, to date these causal relationships are not yet well known, even when considering the most studied model organisms. It is very common in biological research, when studying a particular process, to start taking into account the prior available knowledge such as the genes participating in that process. In this scenario, methods that can suggest new candidate genes, which are potentially playing a role within a given gene network, are of essential importance for biologists. In particular, the gene network expansion (GNE) task starts with a LGN of an organism and can be defined as: given a LGN, find other candidate genes that regulate or are regulated by genes belonging to the LGN.
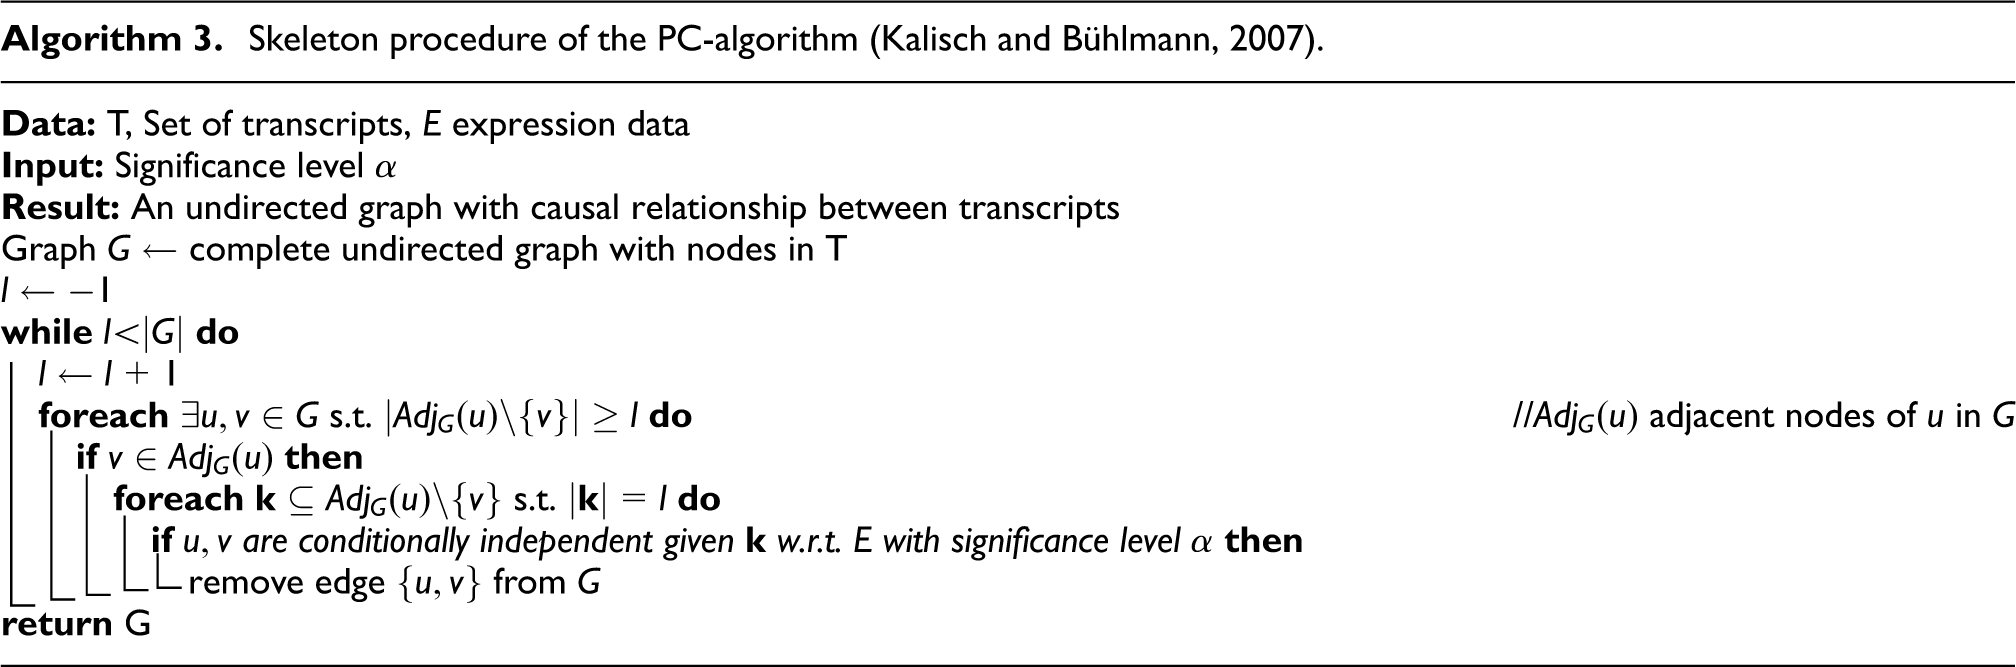
The PC-algorithm (Spirtes and Glymour, 1991) discovers causal relationships among variables by systematically testing the conditional independence of two nodes given subsets of their adjacent nodes. The computational cost of the PC-algorithm is exponential in the number of nodes, but it behaves reasonably in the case of sparse, scale-free networks (Maathuis et al., 2010), like biological networks (Barabási, 2003). The PC-algorithm has been comprehensively presented and evaluated by Kalisch and Bühlmann (2007) and applied to gene network reconstruction (Maathuis et al., 2010). The PC-algorithm has also been successfully employed in other network inference approaches (Tan et al., 2008, 2011; Wang et al., 2010; Zhang et al., 2012). The results of the PC-algorithm depend on the order of the nodes in the input file; the order-independent version is called PC-stable (Colombo and Maathuis, 2012).
At the time of writing, other popular methods for network inference (NI) are the Bayesian Network Inference with Java Objects (BANJO (Hartemink, 2005)), network inference by reverse-engineering (NIR (Gardner et al., 2003)), and the Algorithm for the Reconstruction of Accurate Cellular Networks (ARACNE (Margolin et al., 2006a,b)). The last one has been empirically proved to be the state of the art NI method (Allen et al., 2012). The available reconstruction methods applied to genome wide data are computationally demanding due to the huge size of the solution space (Kalisch and Bühlmann, 2007). Moreover, as we will see here, these methods are not accurate enough to use the results to perform a network expansion (Marbach et al., 2012).
In this paper, we explicitly define the task of finding candidates for gene network expansion. Then we propose a method called Network Expansion by Stratified Subsetting and Ranking Aggregation (NES2RA ) to solve it. NES2RA generalizes our previous proposal NESRA (Asnicar et al., 2015a) with the main difference being that it is now possible to model with a probability the presence of the genes of the network to be expanded in the subsets, namely the sampling is stratified. Both NESRA and NES2RA are based on the PC-algorithm that we run on our gene@home project (Asnicar et al., 2015b), developed on the Berkeley Open Infrastructure for Network Computing (BOINC) platform (Anderson, 2004). We evaluate NES2RA on real data on model organisms (Arabidopsis thaliana and Escherichia coli), and compare it against NESRA and ARACNE.
The paper is organized as follows. Section 2 introduces and defines the task accomplished by NES2RA . Section 3 presents the NES2RA algorithm. Section 4 details the development of NES2RA exploiting the gene@home BOINC project, based on volunteer distributed computing. Section 5 presents an extensive evaluation of NES2RA performed on two different data sets. Finally, Section 6 draws some conclusions providing future insights for the gene@home project and the proposed methods.
2 Gene network expansion
In this paper, we consider the task of discovering candidate genes for the gene network expansion. We report here the definition of the task, as already introduced by Asnicar et al. (2015a). Given a set 𝒮 of gene transcripts whose level of expression has been measured p times in different conditions, such that for each
The choice of facing the gene network expansion task is motivated by the fact that the biological research is often guided by incomplete prior knowledge about the relevance of some genes, in particular biological processes. Considering the current validation methods that involve a complex mix of analytical and wet-lab techniques, the ability to provide a high-quality list of candidate genes is of essential importance for a biologist. The NES2RA approach is particularly suitable in this context, since it introduces the possibility of modeling the confidence of biologists about each gene belonging to the LGN.
NI methods can be used to solve the task of finding candidates for GNE. Indeed, a perfect solution for the NI task would also perfectly solve the GNE task and consequently the task of finding candidate genes. However, the considered NI methods are far from perfect and computationally very demanding due to the enormous size of the solution space. For instance, in the PC-algorithm the solution space is super-exponential in the number of nodes (Kalisch and Buhlmann, 2007). Even the task of finding candidates for gene network expansion is computationally demanding. Indeed, there exists
3 NES2RA
NES2RA is an improved and generalized version of NESRA (Asnicar et al., 2015a), which considers as input data the LGN and the probability of each gene of the LGN to be included in the subsets, the set of parameters to be used, and the gene expression levels for the considered organisms. The inclusion of the LGN in the subsetting step improves the quality of the results (as we will see in Section 5), because the composition of each subset is influenced by the LGN nodes added. The vector of probabilities is a representation of the knowledge of the user (e.g. a biologist) about the presence of specific genes in the network. Probability 1 means that the gene is definitely in the network, whereas probability 0 means that there is no knowledge about the presence of the gene in the network. Depending on the probabilities, the genes will be included in the data for the run of the PC-algorithm. If all the probabilities are zero NES2RA coincides with its previous version NESRA (Asnicar et al., 2015a). The high-level structure of NES2RA is described in Figure 1 and Algorithm 1.
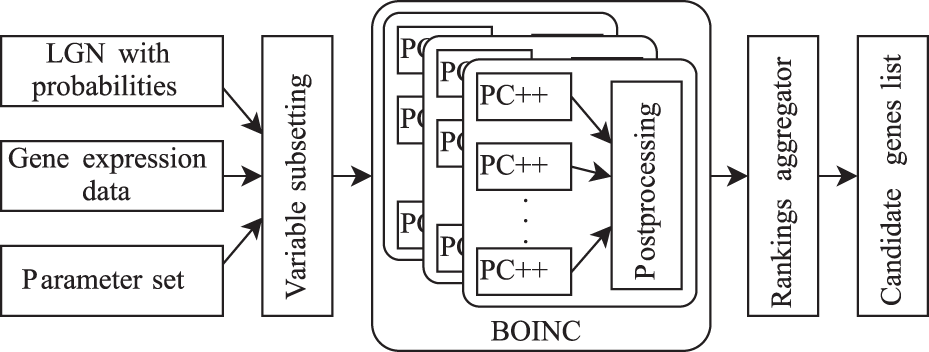
NES2RA workflow.
Pseudo-code of NES2RA.
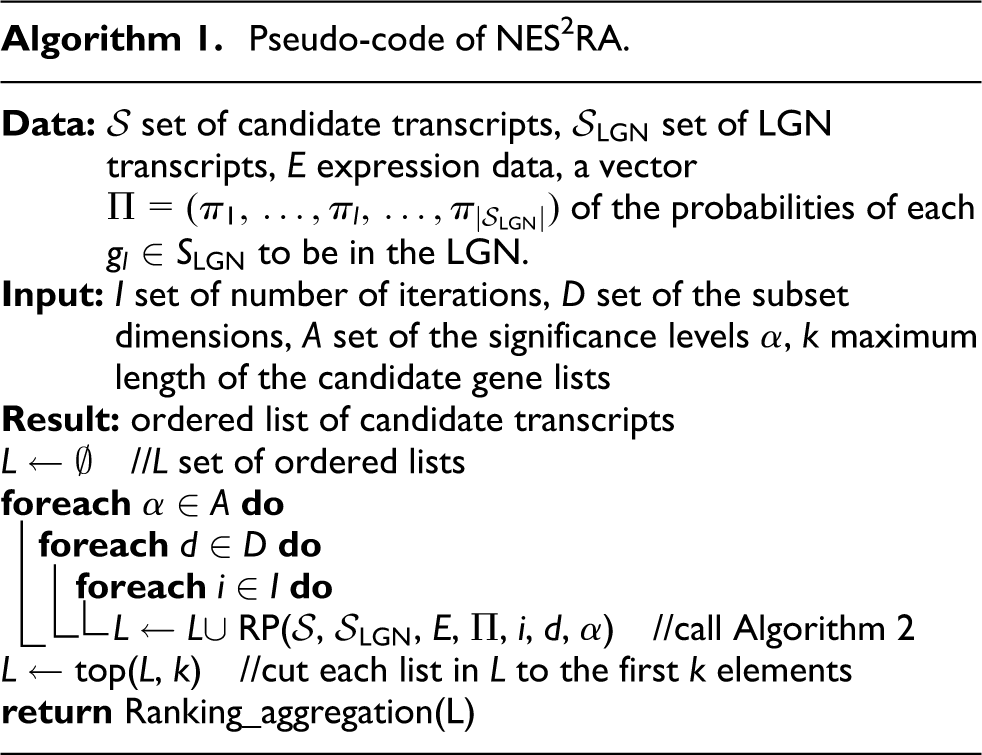
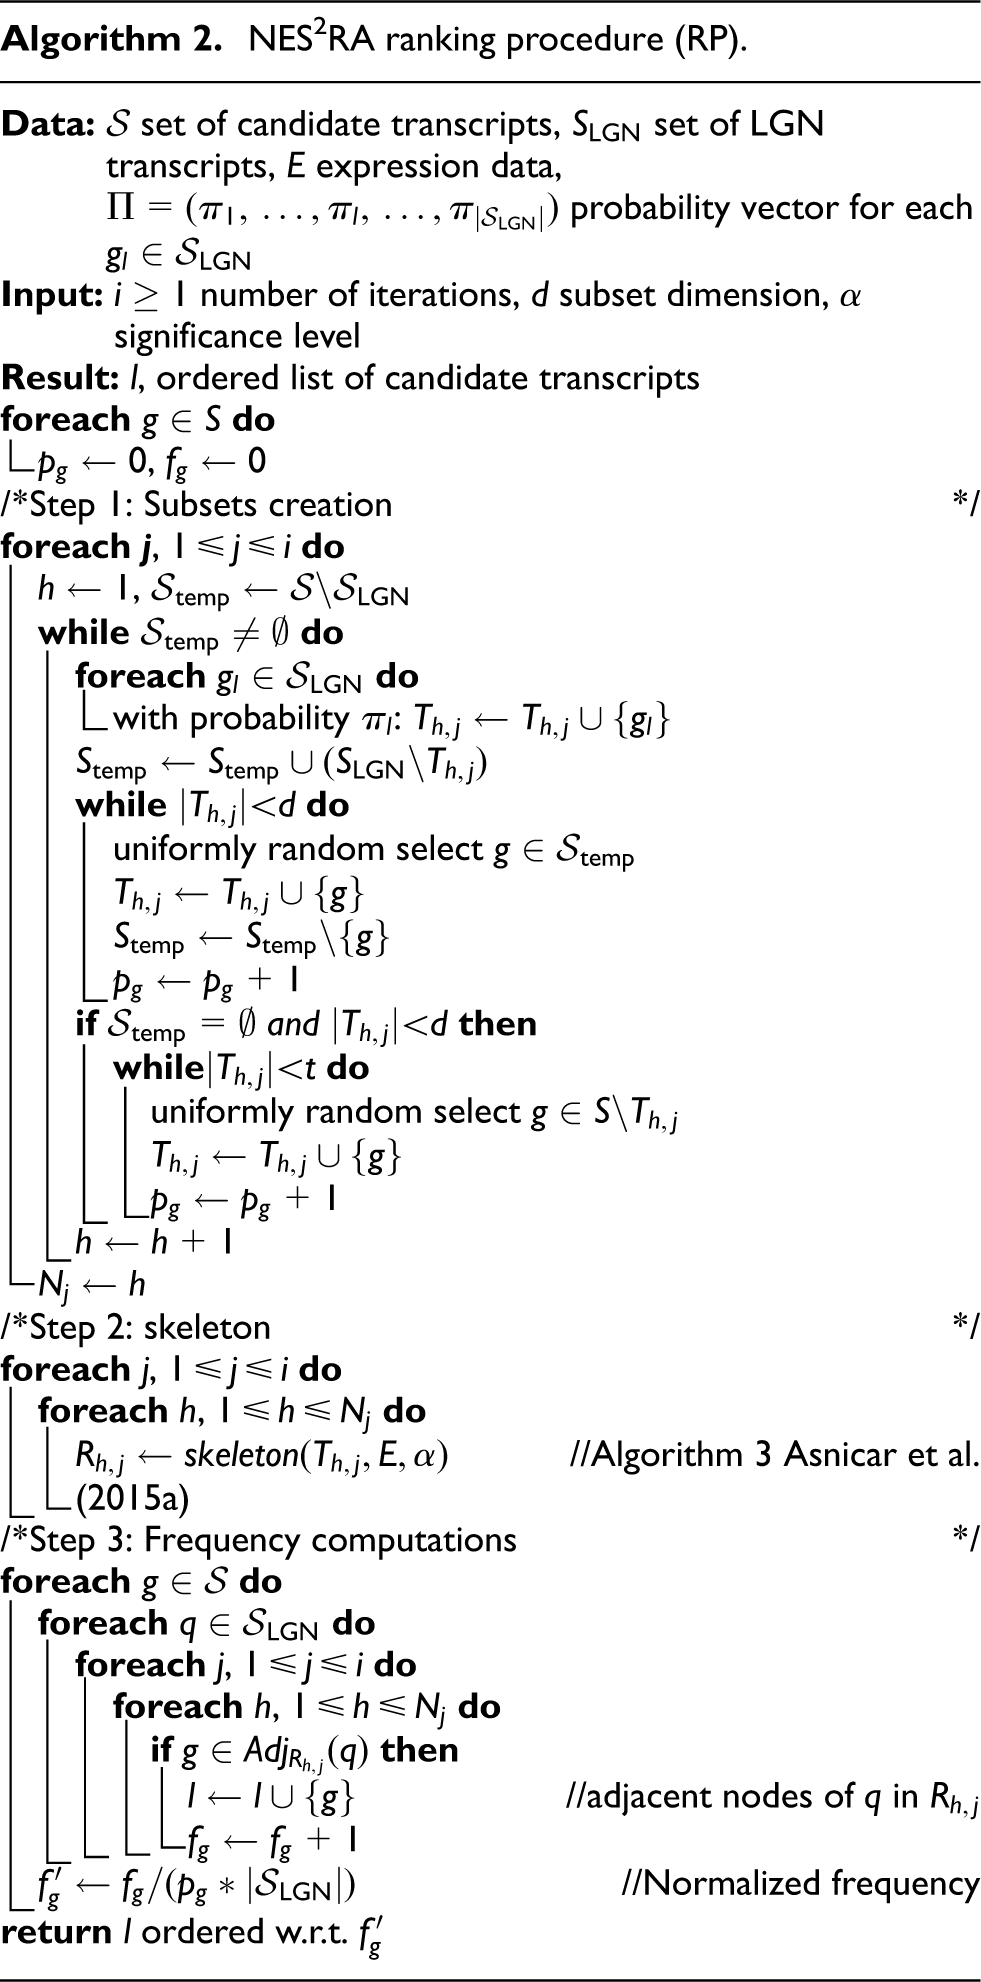
The ranking procedure (RP) presented in Algorithm 2 is composed of three main steps, which respectively: create the subsets; execute several calls of the
NES2RA ranking procedure (RP).
Skeleton procedure of the PC-algorithm (Kalisch and Bühlmann, 2007).
The RP takes as parameters the number of iterations i, the dimension of the subset d, the significance level α for the
NES2RA systematically and iteratively applies subsetting on the whole data set in order to randomly select genes that will be processed with the
Finally, NES2RA produces the list of candidate genes by applying different ranking aggregation methods on the ranked lists. These methods comprise a base technique, i.e. the number of appearances, and more sophisticated methods, namely Borda Count (Borda, 1781) and MC4 heuristic (Lin, 2010). The method we considered as baseline is the number of appearances, which counts how many rankings a certain gene has, i.e. the more a gene is present, the higher its position in the aggregated rank is. The Borda Count method consists of constructing a matrix
Both NESRA and NES2RA exploit the gene@home project for computing the first two steps of ranking procedure.
4 NES2RA on the gene@home BOINC project
Nowadays, the literature reports several successful research projects that exploit the power of volunteer grid computing in order to achieve their goals (Anderson et al., 2002; Das et al., 2007). BOINC, for instance, is an open-source framework particularly convenient for projects that require a large amount of computation, but do not have access to suitable resources. NES2RA requires
Every BOINC project is composed of several components, such as the work generator and the validator. The aim of the former is to create the workunits that will be then distributed to the volunteers, while the latter validates the results of the finished workunits. The validator performs a bitwise comparison of two workunits that have been computed by two different machines. This step is required to ensure the consistency of the results. We designed and developed our custom work generator using the Python language and two C++ wrappers to interface the work generator and the Python scripts with the BOINC framework. The subsets creation (step 1 of Algorithm 2) is implemented in the work generator. Each workunit corresponds to many runs of the
The core of gene@home is the client application. To date, it is available for both 32 and 64 bit architectures, for three operating systems: Linux, Windows, and Mac OS X. The original implementation of the
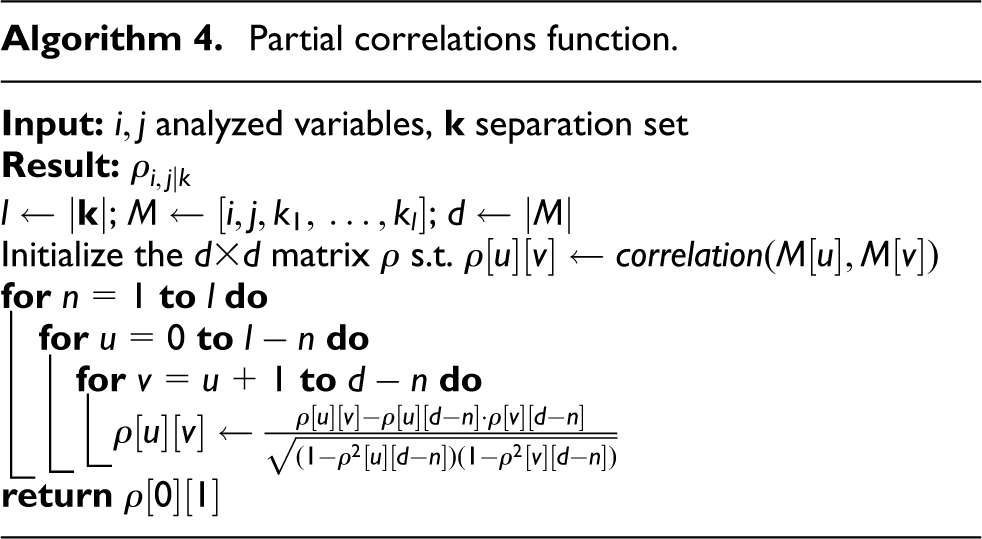
Partial correlations function.
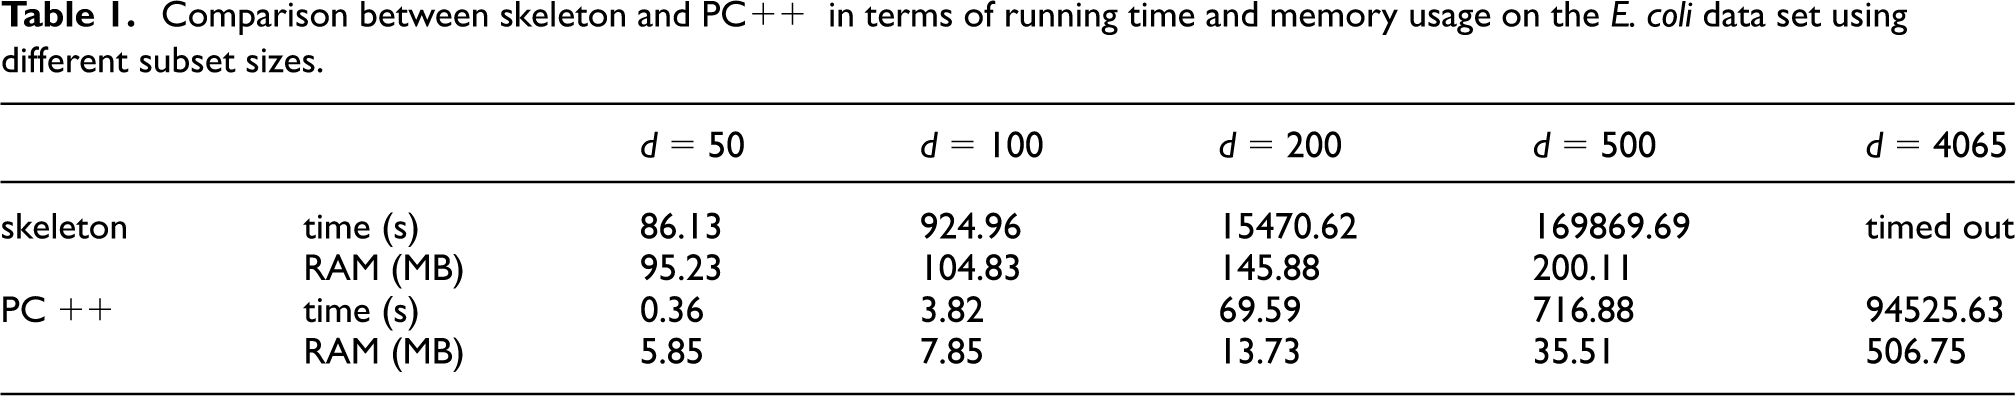
In Table 1 we report the detailed comparison between the PC++ and the
Comparison between skeleton and PC++ in terms of running time and memory usage on the E. coli data set using different subset sizes.
The post-processing phase in NES2RA consists of a two-step pipeline. The workunits results are firstly combined on the volunteers’ local machines by the client applications, in order to reduce the size of the data to be uploaded. Lastly, the partially aggregated results are aggregated on the server.
5 Evaluation
In this section we report the results of three different experiments that assess the performance of NES2RA . The aim of the first experiment is to biologically evaluate the results of NES2RA in comparison with NESRA, ARACNE, and the PC-algorithm. The second experiment has the goal of analyzing the impact of the probability vector Π on the final expansion list. Finally, we analyze the computational aspects of NES2RA executed by the gene@home project.
The data set considered in the first experiment is composed of gene expression hybridizations for the A. thaliana plant model organism, namely microarray expression values publicly available in the Plex database (Dash et al., 2012). The data set comprises 393 hybridization experiments of the GeneChip Arabidopsis ATH1 Genome Array that encompass 22,810 probe sets. The LGN that we used for A. thaliana is the Flower Organ Specification Gene Regulatory Network (FOS). The FOS gene network has been characterized and validated in vivo by the use of specific mutants (Espinosa-Soto et al., 2004), and is composed of 15 genes connected by 54 causal relationships (Sanchez-Corrales et al., 2010). In this case the presence of the genes in the network is certain and so the vector Π of NES2RA has all its components set to 1.
The second experiment has been conducted on the bacterial model organism E. coli. The data set contains 4065 genes for 2470 hybridizations and it is publicly available in the COLOMBOS (Meysman et al., 2014) database. The LGN considered is a transcription factor network called gadW collected from the EcoCyc (Keseler et al., 2013) database. The gadW LGN is composed of 13 nodes connected by 12 edges, and it is involved in the acid resistance system of E. coli. In this experiment we compared the results of NES2RA using two probability vectors:
We assessed the biological validity of the results by performing a bibliographic research, classifying genes in four different classes, as follows.
When we found a gene belonging to Class 1 or Class 2 we considered it to be a true positive, while a gene falling in Class 3 or Class 4 was considered a false positive. The precision of the genes in the candidate output list is the ratio between the number of true positives and the sum of true positives and false positives. Other measures, like F1 and Recall, can not be computed on real organisms’ data sets because no complete ground truth is available. We can only exploit the manually curated classification that we have performed for the resulting genes provided by the methods considered.
Table 2 reports an example of the candidate genes list for the FOS LGN of A. thaliana, produced by NES2RA . The list has a precision value of 80% and it has been obtained by aggregating 60 different ranked lists using the MC4 method with the parameter
Candidate genes list of the FOS LGN of A. thaliana produced by NES2RA .
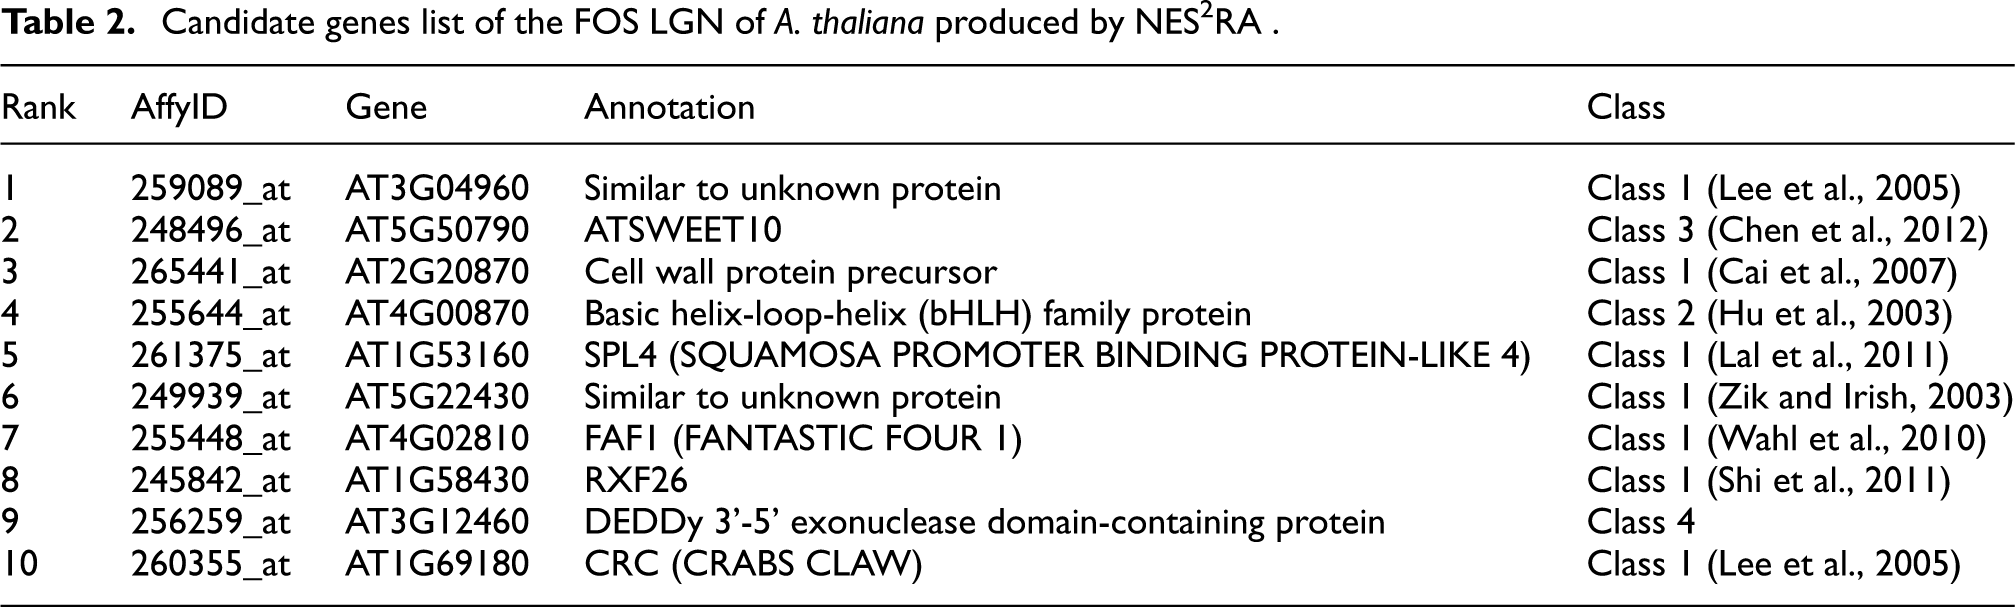
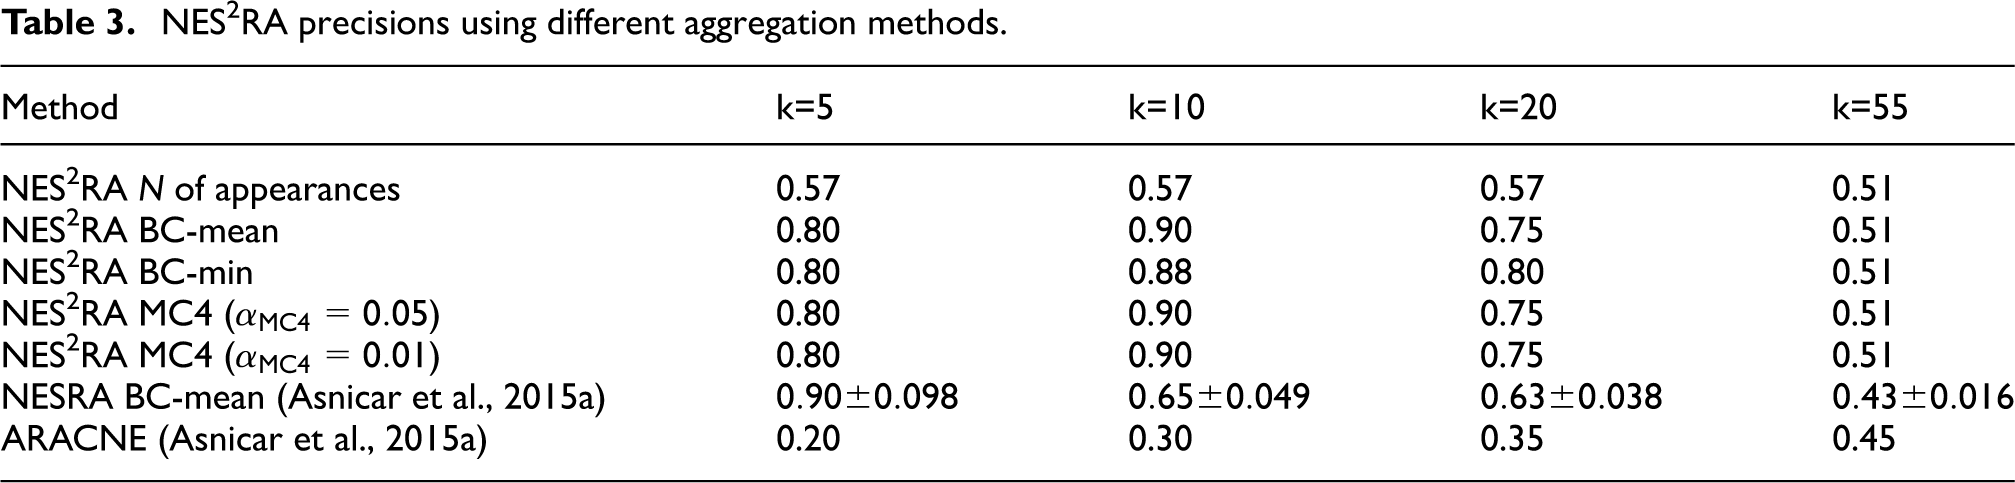
Table 3 shows the precision values of NES2RA using the same set of experiments presented in Table 4 by Asnicar et al. (2015a). Using the very same set of parameters for NES2RA we aggregated only the six rankings that have the same values as in NESRA (Asnicar et al., 2015a): iterations
NES2RA precisions using different aggregation methods.
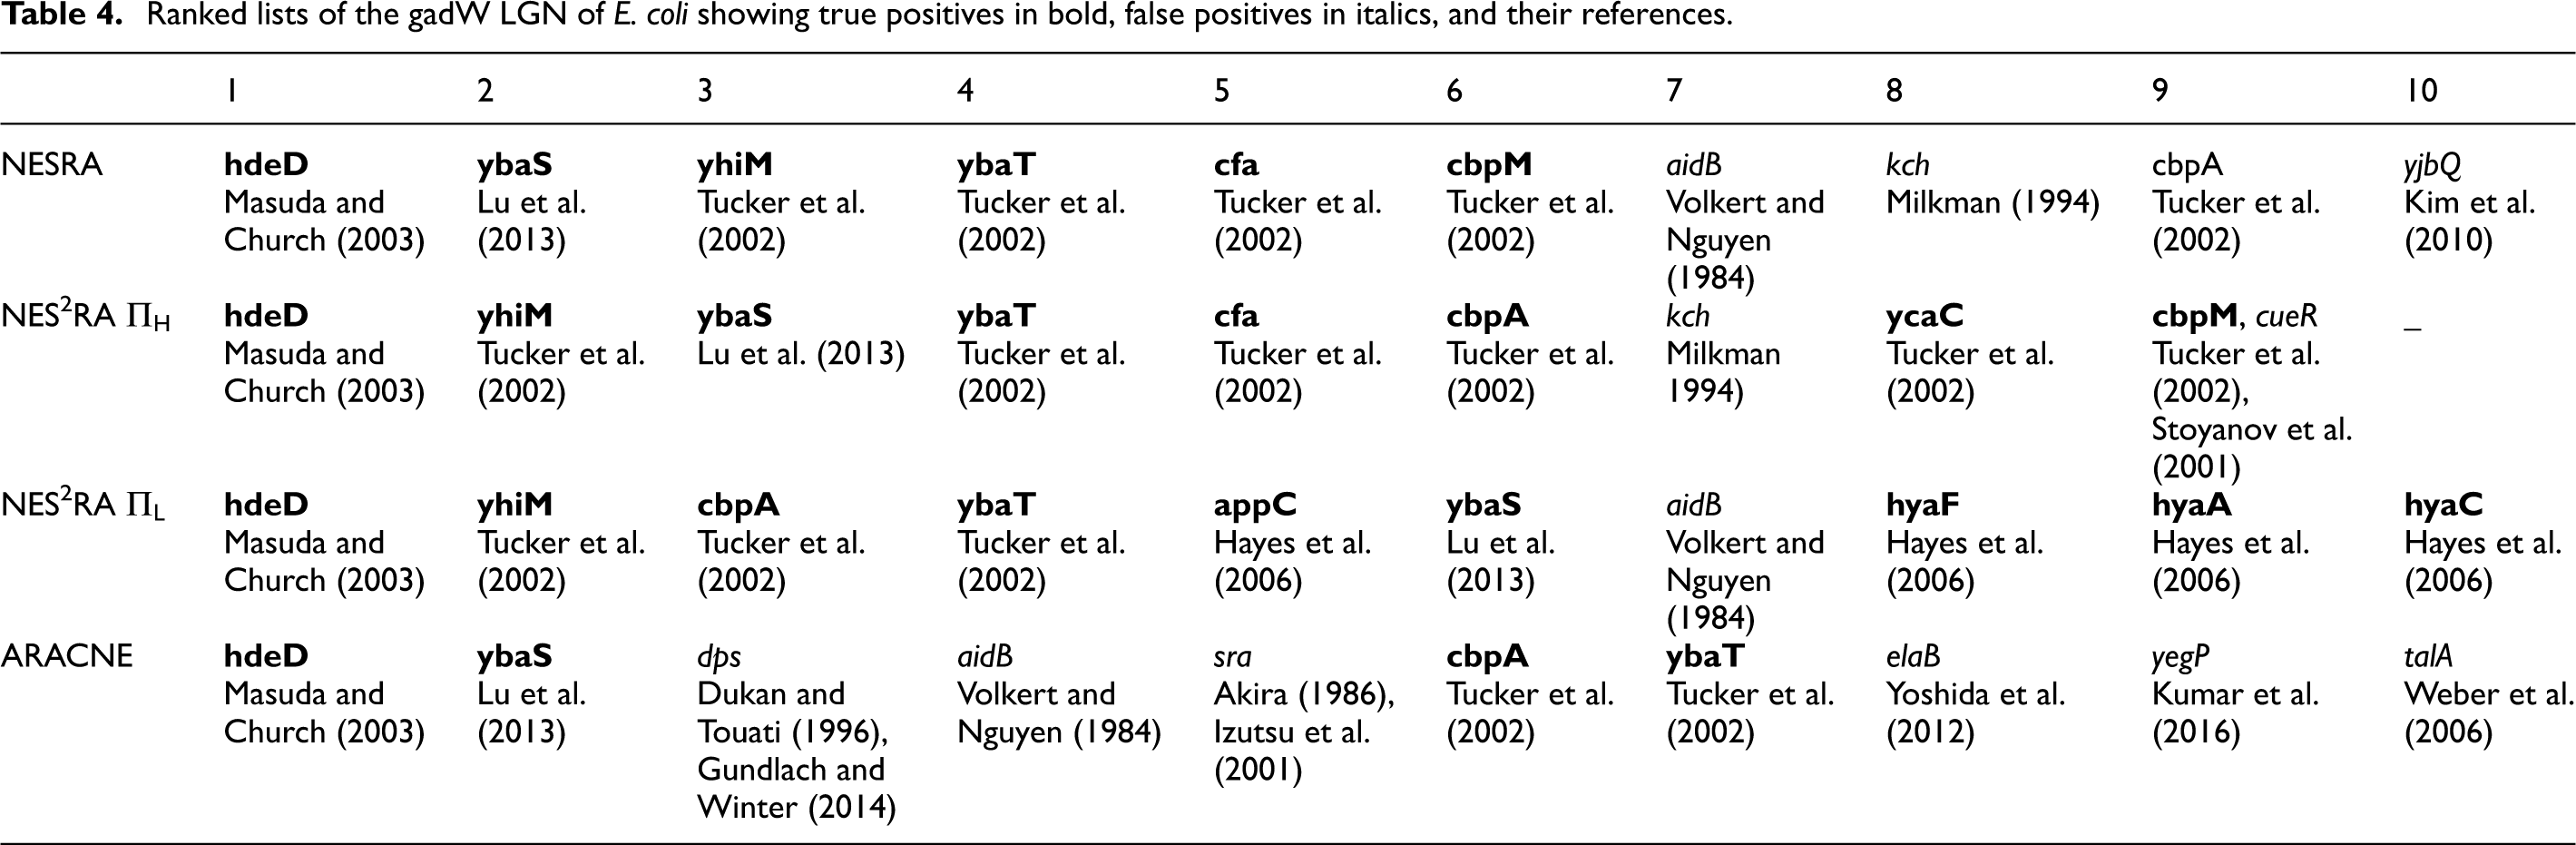
Ranked lists of the gadW LGN of E. coli showing true positives in bold, false positives in italics, and their references.
Although the PC-algorithm, PC-stable, and ARACNE are used for a NI task, here we compared them to a GNE approach. In order to do such a comparison, we obtained a pseudo-expansion list by running each method on the whole data set of A. thaliana. Their results were then filtered with respect to the FOS LGN, selecting only the edges connected with at least a node in the LGN. Then, when possible, the results were sorted according to the p-value provided by the methods.
Table 4 reports the results obtained with different probability vectors to expand the gadW LGN of E. coli with parameters
Figure 2 shows the trend of the computational power expressed by the gene@home project in a time span of 40 days. BOINC is a volunteer-based distributed computing system, and the statistics are computed on the basis of the daily credits generated by the system and assigned to the volunteers. 5 Despite no guarantee of a continuous influx of computational power, we can notice that the overall throughput of the system is always over the 500 GigaFLOPS with an average of 967.41 GigaFLOPS, shown with a dotted line in Figure 2. This is the result of at least 80 active users providing more than 400 active hosts. 6
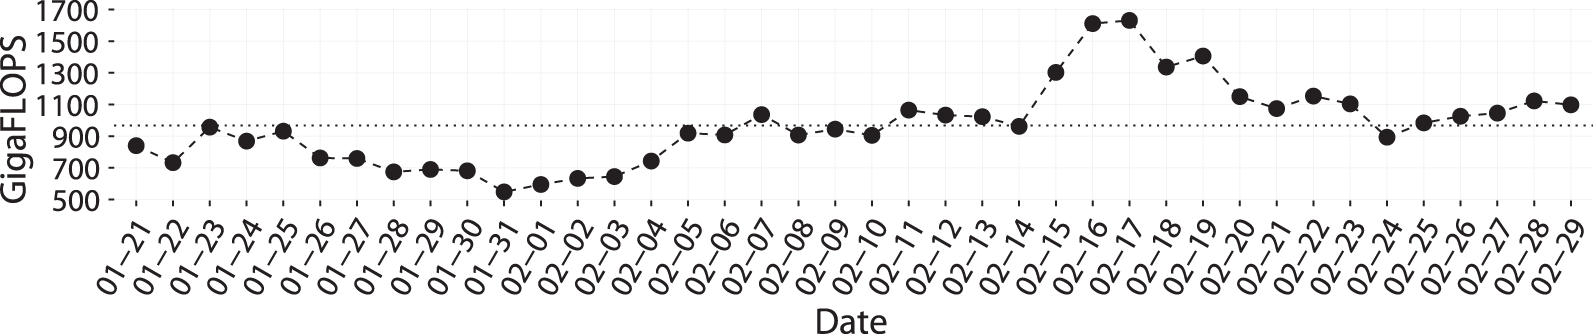
gene@home GigaFLOPS in the timespan of 40 days. The dotted line shows the average.
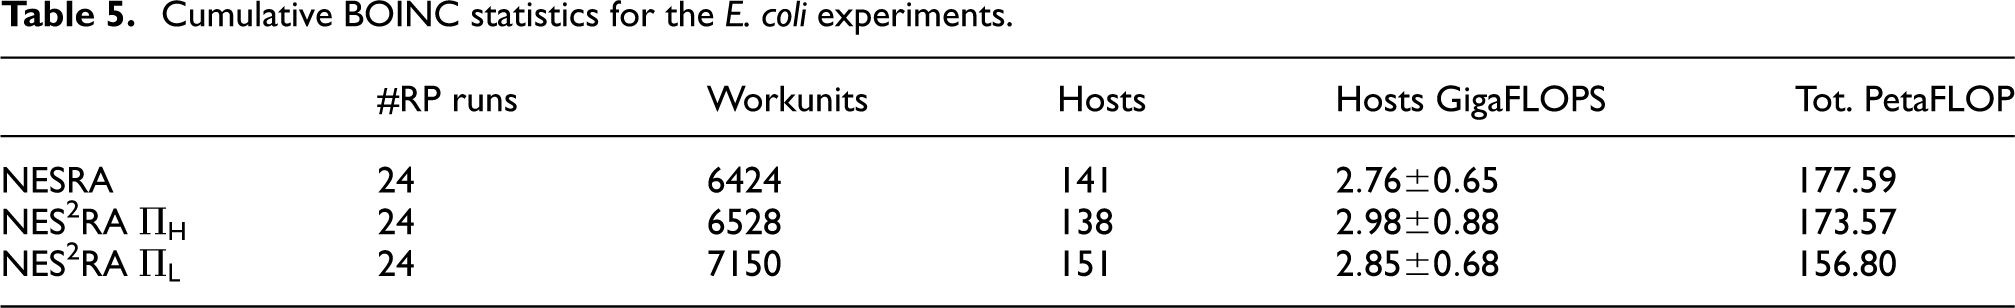
Tables 5
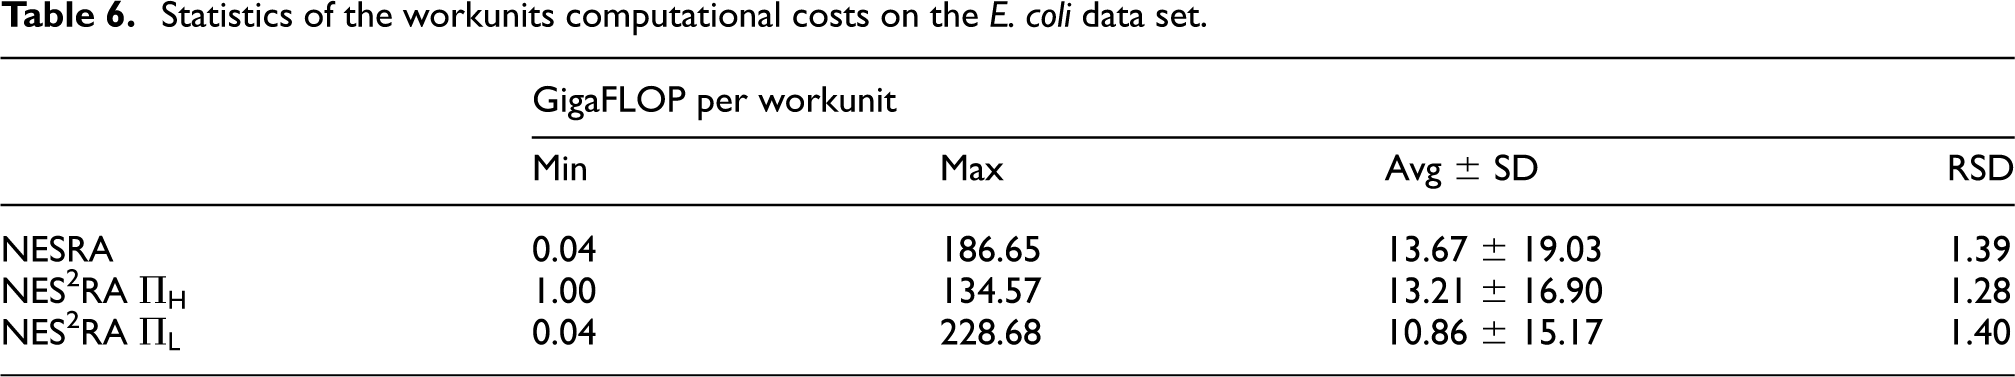
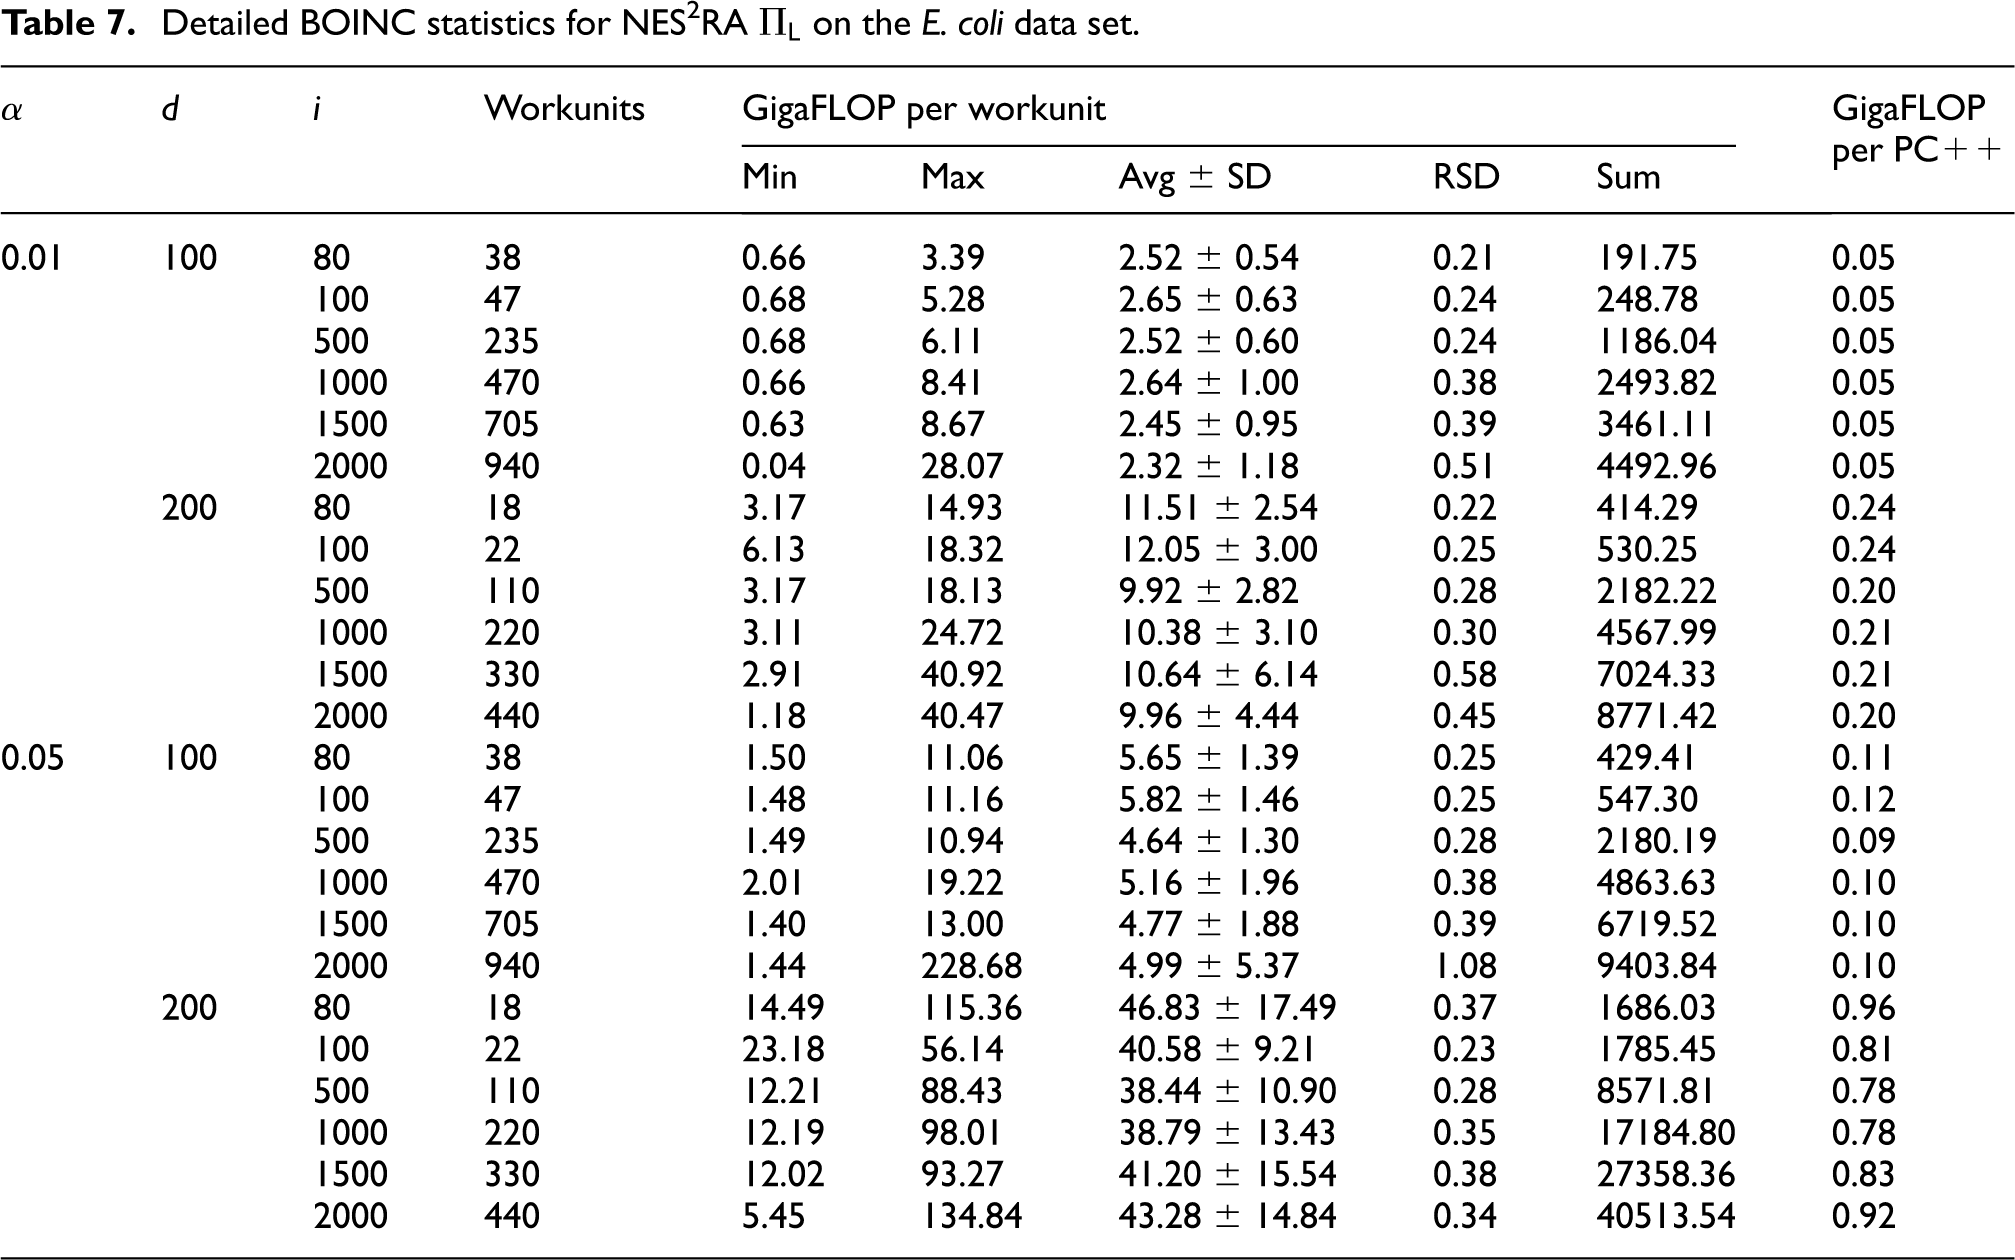
to 7 report the BOINC statistics regarding the experiments conducted on the E. coli data set. The FLOPs for the workunits have been computed on the basis of the computation time and the FLOPS of the hosts machines, determined by BOINC running a Whetstone benchmark (Curnow and Wichmann, 1976). In the gene@home project, each workunit is computed twice in order to be able to validate the results, as explained in Section 4. Thus, the actual FLOPs required for a NES2RA experiment would be half of the ones reported in Table 5. By comparing the average throughput of gene@home and the FLOPs required for executing NES2RA we see that, by exploiting the volunteer computational power, we could execute a NES2RA experiment in about 2.5 days. The real execution time, however, may vary depending on several factors, such as the number of different experiments running at the same time on gene@home. Moreover, the double validation required by the gene@home project can increase the completion time of an experiment. Table 6 reports a summary of the workunit computational costs for the experiments conducted on E. coli. Table 7 presents the details of the computational effort requested by a run of NES2RA, for each combination of the parameters A, D, and I. The number of the workunits is
Cumulative BOINC statistics for the E. coli experiments.
Statistics of the workunits computational costs on the E. coli data set.
Detailed BOINC statistics for NES2RA
6 Conclusions
We presented NES2RA, our novel approach for generating ranked candidate genes lists, which expands known LGNs starting from gene expression data. It exploits iterated variable subsetting and ranking aggregation, as our previous proposal NESRA (Asnicar et al., 2015a), allowing the user to integrate the available prior knowledge on the network that has to be expanded. This makes it possible to model the biologists’ knowledge about the presence of certain genes in the LGN that is translated into a higher probability of presence of these genes in the variable subsets generated. The injection of such prior knowledge shows encouraging results. NES2RA relies on the computational power provided by the gene@home BOINC project, hosted by the TN-Grid platform (Asnicar et al., 2015b). We exploit the gene@home project for extensive executions of the PC++ algorithm, while all the post-processing, ranking, and aggregation analyses are performed off-line. The parallel nature of our approach together with the efficient implementation of the PC-algorithm (namely, PC++), allow us to easily distribute the computational work using the gene@home project. We evaluated the performances of NES2RA on the FOS LGN of the model plant A. thaliana. NES2RA outperforms both ARACNE, which has been proven to be a state of the art NI method (Allen et al., 2012), and our previous proposal NESRA (Asnicar et al., 2015a). The runs on the gadW network of E. coli confirmed the good results and permitted the assessment of the computational load of our application. Considering the performances of NES2RA, its ability to scale with respect to the size of the input data, and the quality of the results, we plan to perform an extensive evaluation using different types of data that encompass several organisms, which include the bacterial model organism Escherichia coli and the eukaryote organism Vitis vinifera.
Footnotes
Declaration of conflicting interests
The author(s) declared no potential conflicts of interest with respect to the research, authorship, and/or publication of this article.
Funding
The author(s) received no financial support for the research, authorship, and/or publication of this article.
Notes
Appendix
The overall effect of the probability vector Π in Algorithm 2 is such that the probability of a gene g to be present in the hth subset of genes
where 𝒮 is the set of candidate genes,
The probability of a gene
namely the same probability of a gene that is not in the LGN. The probability of equation (1) can be written as
Setting πl permits modulation of the probability of the presence of each gene gl in the subsets. In the case
The number of executions of the