
Abstract
The full-understanding of the dynamics of molecular systems at the atomic scale is of great relevance in the fields of chemistry, physics, materials science, and drug discovery just to name a few. Molecular dynamics (MD) is a widely used computer tool for simulating the dynamical behavior of molecules. However, the computational horsepower required by MD simulations is too high to obtain conclusive results in real-world scenarios. This is mainly motivated by two factors: (1) the long execution time required by each MD simulation (usually in the nanoseconds and microseconds scale, and beyond) and (2) the large number of simulations required in drug discovery to study the interactions between a large library of compounds and a given protein target. To deal with the former, graphics processing units (GPUs) have come up into the scene. The latter has been traditionally approached by launching large amounts of simulations in computing clusters that may contain several GPUs on each node. However, GPUs are targeted as a single node that only runs one MD instance at a time, which translates into low GPU occupancy ratios and therefore low throughput. In this work, we propose a strategy to increase the overall throughput of MD simulations by increasing the GPU occupancy through virtualized GPUs. We use the remote CUDA (rCUDA) middleware as a tool to decouple GPUs from CPUs, and thus enabling multi-tenancy of the virtual GPUs. As a working test in the drug discovery field, we studied the binding process of a novel flavonol to DNA with the GROningen MAchine for Chemical Simulations (GROMACS) MD package. Our results show that the use of rCUDA provides with a 1.21× speed-up factor compared to the CUDA counterpart version while requiring a similar power budget.
1. Introduction
Molecular dynamics (MD) has been consolidated as a popular tool in theoretical studies in molecular sciences. MD tools solve Newton’s equations of motion for a given molecular system, which sample atomic motions usually in the nanoseconds to microseconds and milliseconds scale. These simulations are becoming more accurate along with the development of improved force fields, making it possible to accurately study processes such as protein folding (Shaw et al., 2010). An MD simulation starts with a molecular configuration and a physical model, which includes details about how atomic interactions are modeled. After the simulation is carried out, the user obtains insightful conclusions studying and analyzing the trajectory. The computational horsepower required by MD simulations is overwhelming as they assess millions of interactions of particles during many time steps (Abraham et al., 2015). Indeed, the accuracy or realism of the result is directly related to the amount of sampling.
There are many software packages for developing MD simulations such as GROningen MAchine for Chemical Simulations (GROMACS) (Hess et al., 2008), AMBER (Case et al., 2005), or NAMD (Phillips et al., 2005) just to mention a few. Indeed, the development of all of these standardized tools has democratized the use of MD, even for those who are not specialists in simulator development. Of particular interest to us is GROMACS, which is an open-source MD tool extensively used in chemistry, mainly (although not limited to) for the simulation of biomolecules. GROMACS has as a primary goal to achieve the highest simulation efficiency by offering several parallelization approaches at different levels; vectorization, multithreading, and CPU–GPU (i.e. graphics processing unit). Some previous works have been carried out to improve the performance of a single GROMACS execution using these parallel techniques (Abraham et al., 2015; Hess et al., 2008; Patra et al., 2007; Poghosyan et al., 2013; Pronk et al., 2013).
However, the use of MD simulations for answering real scientific problems, such as the discovery of new drugs, typically involves a large number of independent simulations that are executed in a large computing cluster using a resource manager, or job scheduler, such as Slurm (Yoo et al., 2003). These resource managers allow a collection of heterogeneous resources to be shared among the jobs that are executed in the cluster. However, these resource managers are not designed to fully leverage GPUs because they do not allow the shared access (i.e. multi-tenancy) to them from different processes (Iserte et al., 2016).
In this article, we make use of a multi-tenant virtual GPU strategy for increasing the throughput of a batch of independent GROMACS simulations. To that end, we use the remote CUDA (rCUDA) middleware (Reaño et al., 2015), which enables remote concurrent use of CUDA-compatible GPUs. This middleware decouples GPUs from CPUs thus enabling virtual CUDA-compatible devices on machines without local GPUs, still delivering an acceptable performance. Moreover, the physical GPUs are concurrently shared among several GPU processes, and therefore, the GPU occupancy can be improved by running several different GPU processes at the same time (Iserte et al., 2016). In addition to leverage virtual GPU multi-tenancy to increase overall throughput of a batch of independent MD simulations, we also leverage CPU-based MD simulations concurrently executed with the virtual GPU-based simulations to further increase overall throughput. In this regard, we show that by properly tuning the amount of resources used by each MD simulation, overall throughput of a batch of MD simulations can be noticeably increased with respect to the use of traditional CPU-based or GPU-based approaches. A complementary, and preliminary, study to the work presented in this article was already presented in the study by Prades et al. (2018). Contrary to that preliminary work, in this article, we provide a more mature analysis of the multi-tenant virtual GPU strategy when applied to a bunch of independent GROMACS simulations by following a different approach. Additionally, a new molecular system is studied in this article. In this regard, we also provide an insight to the problem from a purely biological perspective.
The rest of the article is structured as follows. Next section provides the required background about MD. It also briefly describes the rCUDA middleware. Afterward, our strategy to improve the throughput of MD simulations in large heterogeneous clusters is thoroughly introduced. Next, the bioinformatics problem addressed in this article is described, followed by the experimental results that show how system throughput can be increased by making use of virtual GPU multi-tenancy. Next, analysis of MD results from the biological side and its validation is commented. The last section summarizes the conclusions of this study and provides some directions for future work.
2. Background
This section provides the necessary background on MD simulations as well as on the rCUDA remote GPU virtualization middleware.
2.1. MD in drug discovery
We draw on our description of virtual screening (VS) methods for drug discovery, which was previously given in the study by Sánchez-Linares et al. (2012), Imbernón et al. (2017), and Banegas-Luna et al. (2018). VS methods are computational techniques used in several scientific areas, such as catalysts and energy materials (Franco, 2013), and mainly drug discovery (Kitchen et al., 2004), where experimental techniques can benefit from computational simulation.
VS methods search within libraries of small molecules that can potentially bind to a drug target, typically a protein receptor or enzyme, with high affinity. In some cases, they actually “dock” small molecules into the structures of macromolecular targets. Moreover, they look for (i.e. score) the optimal binding sites by providing a ranking of chemical compounds according to the estimated affinity or scoring (Lagarde et al., 2015). In general, VS methods optimize scoring functions, which are mathematical models used to predict the strength of the non-covalent interaction between two molecules after docking (Jain, 2006). Indeed, these candidate molecules will continue the drug discovery process road map that goes from in vitro studies to animal investigations and, eventually, to human trials (Csermely et al., 2013).
Although VS methods have been used for many years and have identified several compounds to be used as approved drugs, VS has not yet fulfilled all its expectations. Neither the VS methods nor the scoring functions used are sufficiently accurate to identify high-affinity ligands reliably. To deal with large numbers of potential candidates (many databases comprise hundreds of thousands of ligands), VS methods must be very fast and still they would require a large amount of computing time for each ligand.
One recent approach to increase the accuracy of VS methods is to use several methods in the pipeline, starting from high-speed and low-accuracy methods such as molecular similarity, then post-filtering result using mid accuracy techniques such as molecular docking, and ending up with more accurate and informative structure-based techniques such as MD. In this work, we will focus our discussion in the execution of VS calculations with GROMACS.
2.2. Remote CUDA
Figure 1 depicts the architecture of the rCUDA middleware, which follows a client–server distributed approach. The client part of rCUDA is installed in the cluster node executing the application requesting GPU services, whereas the server side runs in the computer owning the actual GPU. The client side of the middleware offers the same application programming interface (API) as does the NVIDIA CUDA API. In this manner, the client receives a CUDA request from the accelerated application and appropriately processes and forwards it to the remote server. In the server node, the middleware receives the request and interprets and forwards it to the GPU, which completes the execution of the request and provides the execution results to the server middleware. In turn, the server sends back the results to the client middleware, which forwards them to the initial application, which is not aware that its request has been served by a remote GPU instead of a local one.
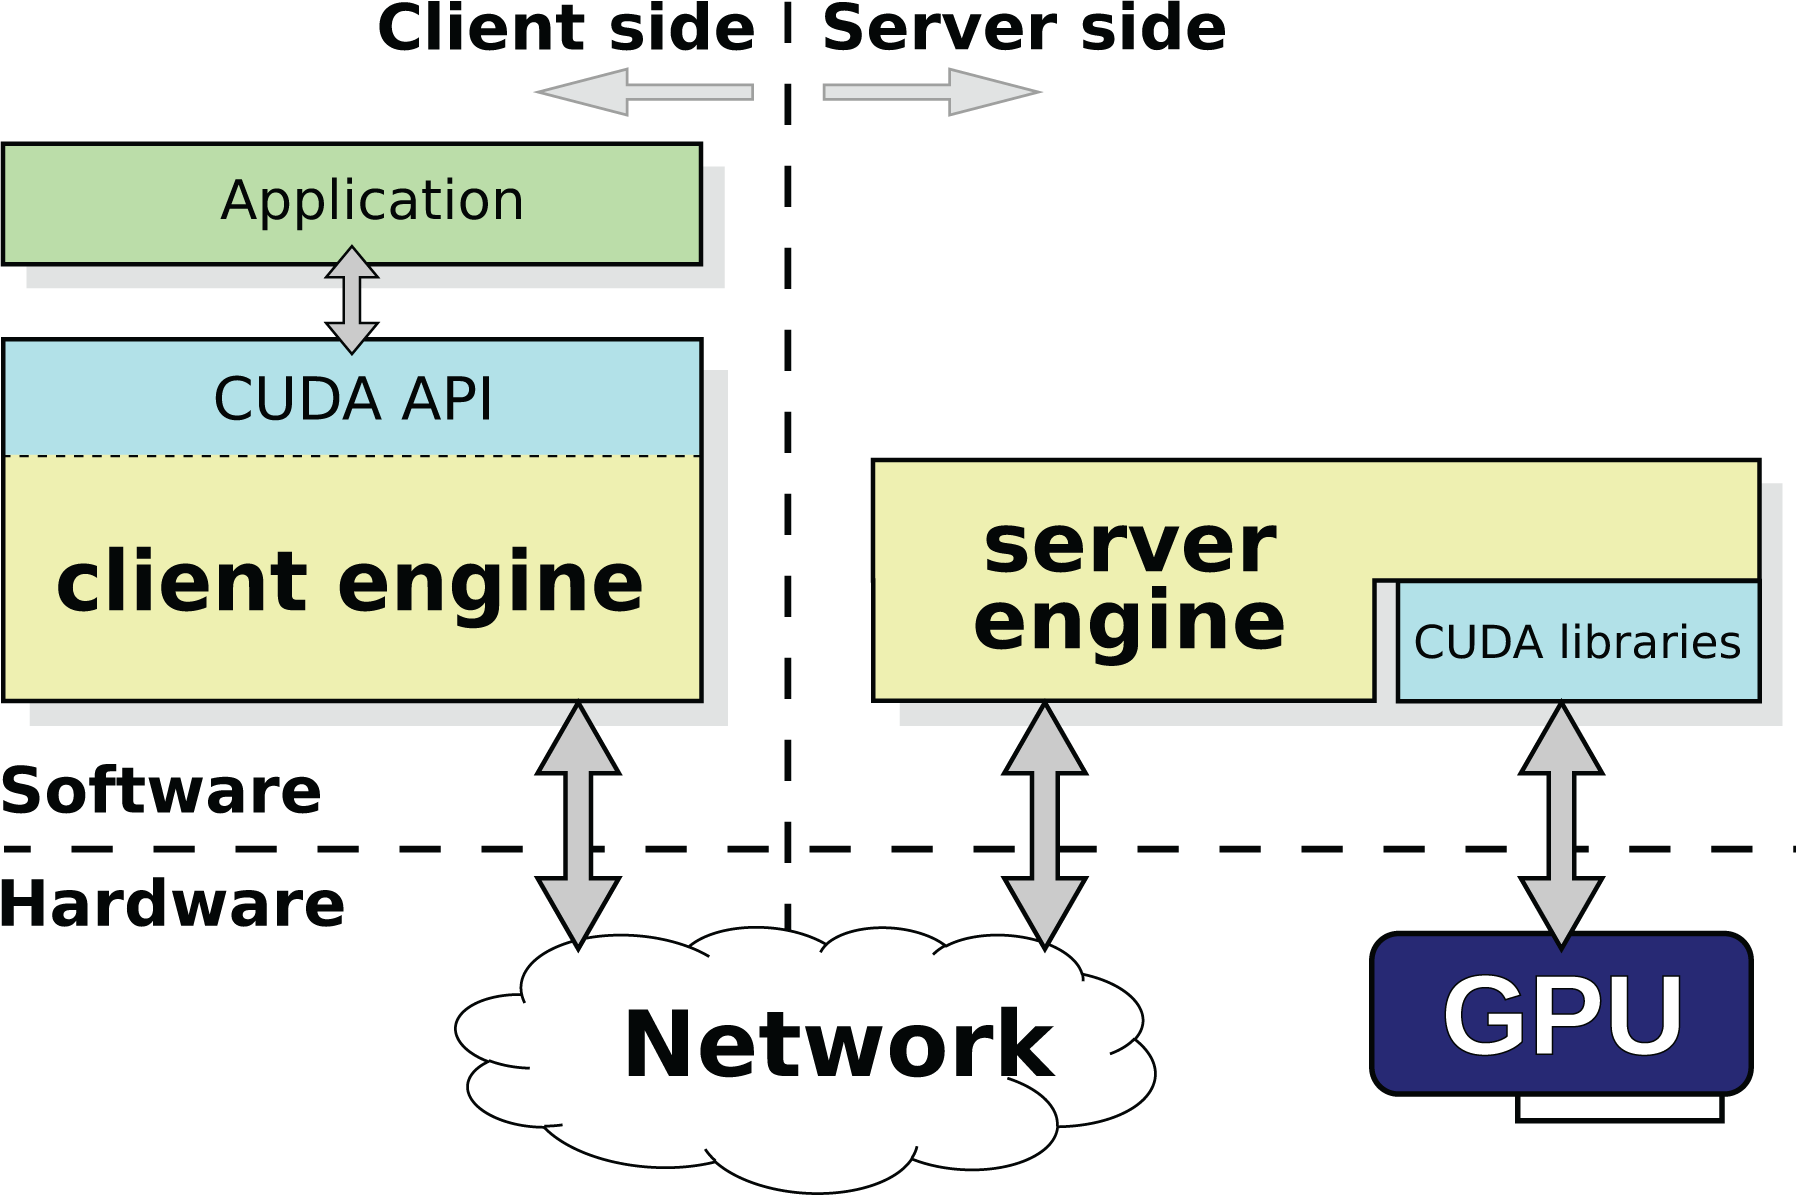
Architecture of the rCUDA middleware. rCUDA: remote CUDA.
rCUDA is binary compatible with CUDA 9.0 and implements the entire CUDA runtime and driver APIs (except for graphics functions). It also provides support for the libraries included within CUDA (cuDNN, cuBLAS, cuFFT, etc.). Additionally, it supports several underlying interconnection technologies by making use of a set of runtime-loadable, network-specific communication modules (currently transmission control protocol/internet protocol (TCP/IP), RDMA over converged ethernet (RoCE), and InfiniBand). The InfiniBand and RoCE communication modules are based on the use of the remote direct memory access (RDMA) feature present in these network fabrics. Independently of the exact network used, data exchange between rCUDA clients and servers is pipelined to attain high performance. Internal pipeline buffers within rCUDA use preallocated pinned memory, given the higher throughput of this type of memory, thus allowing that overall overhead of using a remote GPU is negligible when InfiniBand is used (Reaño et al., 2015). When compared to other publicly available remote GPU virtualization frameworks, rCUDA provides the best performance (Reaño and Silla, 2015).
3. System configurations for drug discovery
The computing power required by MD simulators is tremendous. This need for large computing power comes from two different aspects. On the one hand, a single MD simulation requires a huge amount of computations to be completed. In this way, depending on the exact set of molecules to be considered, a single simulation may require several days to be carried out. Besides, to perform a complete analysis when searching for new drugs, it is common that MD simulations are executed in batches composed of tens or hundreds of different simulations, each of them working on a different set of ligands.
The computing power required by MD simulators can be achieved in several ways. The most traditional one is based on the use of a large collection of nodes, each of them composed of one or more processor sockets. In particular, hardware configurations where each node leverages two processors are very common because of the good performance/cost ratio of these systems. In this scenario, a simulation may either be executed in the CPU cores of a single node or may span to several cluster nodes. Nevertheless, considering the cost of internode communications across the network fabric, it may be advisable to constrain an MD simulation to a single node if memory resources available in that node are enough for the problem size under execution. This decision may reduce the performance of individual simulations but would increase overall throughput, thus reducing total execution time of the batch of simulations.
Another possibility to provide the tremendous computing power required by MD simulators is using GPUs. These devices typically reduce total execution time by one or two orders of magnitude with respect to the use of CPUs. Unfortunately, using GPUs is not exempt from several concerns. For instance, GPUs are noticeably more expensive than CPUs. Also, a single MD simulation does not usually fully utilize the GPUs assigned to it. This non-100% utilization has several consequences: (1) some computing power is wasted at the same time that the bunch of simulations required for VS takes longer and (2) GPUs waste some amount of energy while not being 100% utilized. To address this concern, we may think about concurrently running several MD simulations in the same GPU. However, it must be noticed that clusters usually leverage a job scheduler, such as Slurm, to dispatch jobs to nodes, and these job schedulers are not able to provide the same GPU to more than one job. Therefore, when GPUs are used in the traditional way, their utilization cannot be easily increased unless the application is improved to generate a higher GPU utilization, which is not possible most of the times given that the very nature of the problem being addressed limits the modifications that can be applied to the application to achieve a higher GPU utilization.
To increase GPU utilization and thus make a better usage of available resources, it is possible to virtualize these accelerators and make use of the multi-tenancy approach by leveraging the rCUDA middleware. In this way, a single GPU would be shared among several MD simulations thus making that GPU utilization gets closer to 100%. In this configuration, it is possible to concurrently execute several MD simulations in nodes without GPUs while the GPUs located in a single server are shared among these simulations.
In this article, we analyze the three configurations mentioned earlier (CPU, GPU, and virtualized GPU with rCUDA) to find out which one of them best fits the tremendous computational needs of MD simulators. In this regard, although simulation performance is important, given that these simulations are often batched in tens or hundreds of instances, we put the focus of this study on overall throughput instead of individual simulation performance. To conduct this study, we consider the configurations depicted in Figure 2 as the basic case studies for each of the three scenarios presented earlier. Figure 2(a) displays the basic case study for the CPU-only configuration. In this case, we assume that MD simulations do not spread beyond a single node, as discussed earlier, and therefore, the basic case study is composed of a single node comprising a given amount of CPU cores. In this node, one or more concurrent simulations can be executed. The exact amount of concurrent simulations depends on several factors and must be investigated.
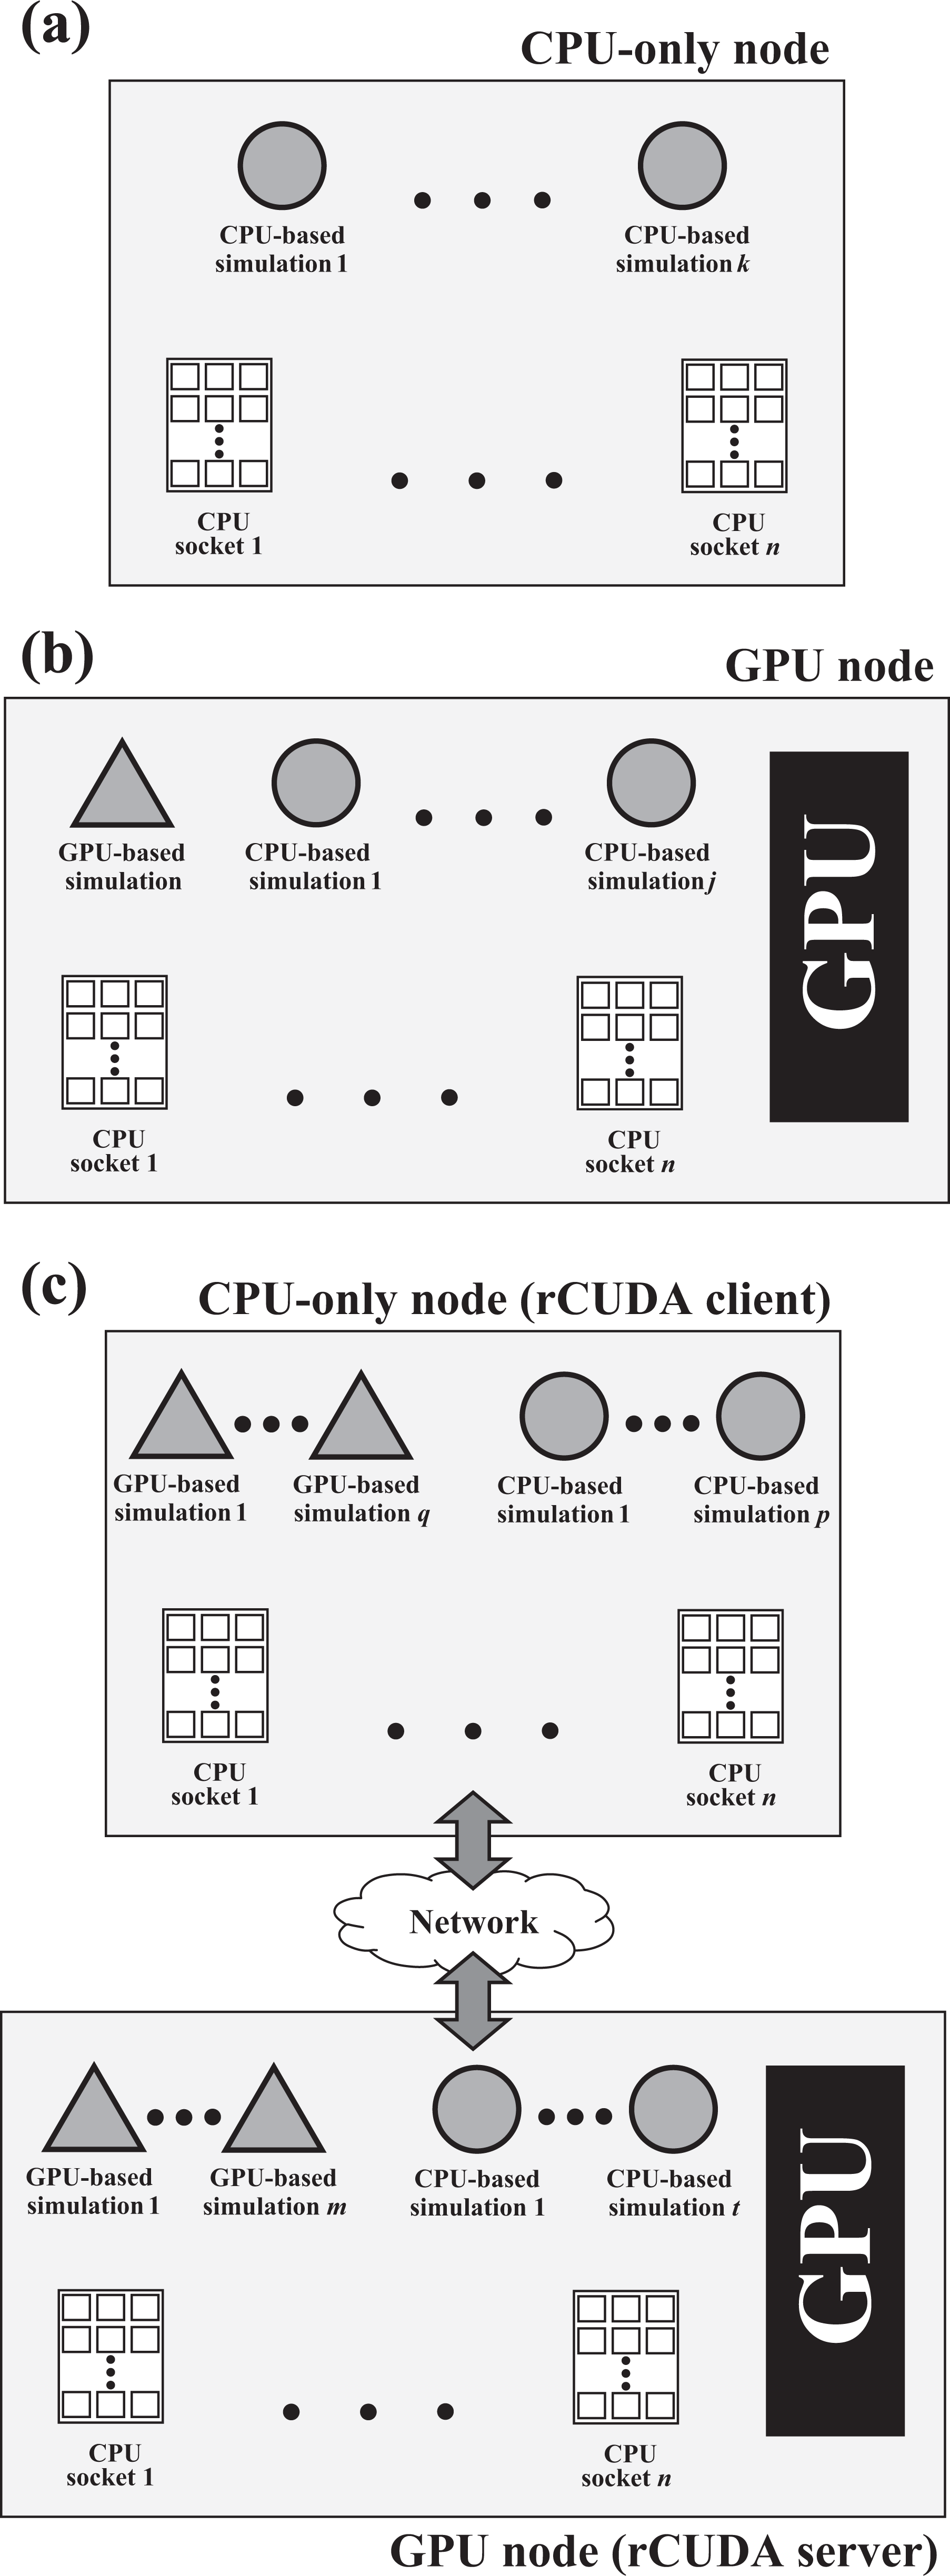
Hardware configurations for each of the baseline case studies considered in this article. (a) CPU-based configuration. k MD simulations are concurrently executed in the n processor sockets available in the node. (b) GPU-based configuration. One MD simulation is executed in the GPU, whereas j additional simulations are executed in the CPU cores not used by the GPU-based simulation. (c) rCUDA-based configuration. q + m GPU-based MD simulations share the available GPU, whereas p + t simulations are executed in the CPU cores not used by the GPU-based simulations. MD: molecular dynamics; GPU: graphics processing unit.
Figure 2(b) depicts the basic case study when GPUs are present in the cluster and are used in the traditional way (with job schedulers such as Slurm). As in the previous case, a single node is considered to avoid the overhead of internode communications when the simulation spreads over several cluster nodes. Notice, however, that the GPU-based MD simulation may not require all the CPU cores available in the node. In this case, it would be possible to execute one or more CPU-based simulations leveraging the cores not used by the GPU-based instance. This would increase overall throughput.
Finally, Figure 2(c) shows the basic case study when rCUDA is used to virtualize GPUs thus enabling multi-tenancy. It can be seen in Figure 2(c) that this basic case study is composed of two nodes: one of the nodes has the GPU and executes the rCUDA server, whereas the other node does not include GPUs and therefore executes the MD simulations using the remote GPU in the other node. Given that this scenario allows to concurrently run several MD simulations on the same GPU, the exact amount of simulations must be investigated. The exact number of simulations sharing the GPU will depend on the GPU characteristics. Additionally, this analysis should also include which is the amount of CPU cores provided to each of the simulations that reports the best performance. Moreover, the node running the rCUDA server could also be used to execute additional MD simulations in the GPU, also using rCUDA. Furthermore, it must be noticed that this analysis may conclude a configuration for the MD simulations where several CPU cores (either in the client node or in the server node) are not used. These cores might be used to run CPU-only simulations. In this regard, the obvious goal is to increase as much as possible the overall throughput when tens or hundreds of MD simulations must be executed. To that end, in the next sections, we will compare the throughput achieved by each of the configurations presented in Figure 2, obviously considering that the basic case study for rCUDA includes more resources than the other two basic case studies (it includes two nodes instead of one node).
However, before analyzing the performance and throughput of each of these configurations, we need to understand the bioinformatics problem that is addressed in this article. This is done in the next section.
4. Flavonoids as a working example
As discussed earlier, MD is now implemented in drug design work flows with a focus on improving the accuracy of docking predictions on protein–ligand systems, where the former is the targeted molecule associated with a health disorder. However, there is an increasing effort in the search of molecules able to bind DNA (Noroozi et al., 1998). Indeed, they might be used to either protect living cells from exogenous reactive species (i.e. reactive oxygen species able to initiate side biological degradation phenomena) or to specifically hall cell division machinery (i.e. anticancer molecules reacting with cancer cells). Herein, we decided to use a recent model system designed by Halder and Purkayastha (2018), who conducted a joint molecular docking and experimental study to propose a new molecule able to bind to the minor groove of DNA. According to these authors, a fisetin derivative labeled as DEPHBC (2-(3,4-diethoxyphenyl)-3-hydroxy-4H-benzo[h]chromen-4-one) strongly binds to the minor groove of DNA and in addition provides stabilization to the DNA helix architecture. That latter feature foresees a very promising application for developing enhanced drugs, and therefore make the system an ideal working example to test our computational strategy. For the records, the chemical structure and atomic charges of the isolated DEPHBC ligand were fully optimized at the B3LYP/6-31+G(d) level of theory using the Gaussian16 suite of quantum mechanical codes (Frisch et al., 2016), while the DNA model used in our study was directly provided by Halder and Purkayastha (2018). The resulting model system is subsequently parameterized using the well-known AMBER99SB force field (Hornak et al., 2006) and a TIP3P water model (Jorgensen et al., 1983). Although, other force field may be used, the major goal of this contribution is to show rather than conducting a large assessment/benchmark of MD parameters, lies beyond the scope of our contribution. However, such approach has been successfully used to mimic DNA-related system (Pezeshgi Modarres et al., 2015). In addition, it should be underlined that the use of rCUDA can be successfully used to produce long MD trajectories and therefore help to further force field benchmarking studies.
In short, the goal of the article is consequently to fill the gap between the earlier reported docking results and the experimental evidences by accounting for dynamical effects with the GROMACS analysis.
5. System performance and throughput
This section presents the experimental evaluation of this study, based on Intel CPUs and NVIDIA GPUs. First of all, we briefly introduce the hardware and software environment where the experiments are carried out. Afterward, the performance and throughput of GROMACS is analyzed using CPUs, using real GPUs and using virtual GPUs. In a later subsection, we present the overall throughput of the three system configurations discussed in previous sections.
5.1. Test bed: Hardware and software environment
Experiments have been carried out in a cluster based on two x86-based SYS1028GR-TR Supermicro nodes. Each of the nodes contains two 10-core Intel Xeon E5-2630 v4 processors and has a Mellanox ConnectX-4 VPI single-port InfiniBand adapter (EDR InfiniBand). The nodes are connected by a Mellanox switch with enhanced data rate (EDR) compatibility (a maximum rate of 100 Gb/s). One of the nodes is equipped with one Tesla P100 GPU owning 16-GB RAM. This node will be used to execute GROMACS using CUDA in the traditional way. This node will also be used to execute the rCUDA server. On the other hand, the other node will be used to execute GROMACS using CPU cores. This node will also be used as the rCUDA client; that is, it will execute GROMACS while remotely using the GPU in the other node.
The CentOS 7.3 operating system and the Mellanox OFED 4.4-2.0.7 were used along with the NVIDIA driver 390.59 and CUDA 8.0. The rCUDA version used is 18.12 beta, which is a development version containing all the functionality required to execute applications from any domain using remote GPUs although performance is not fully optimized yet. Regarding GROMACS, version 2016-1 has been used.
5.2. Performance characterization
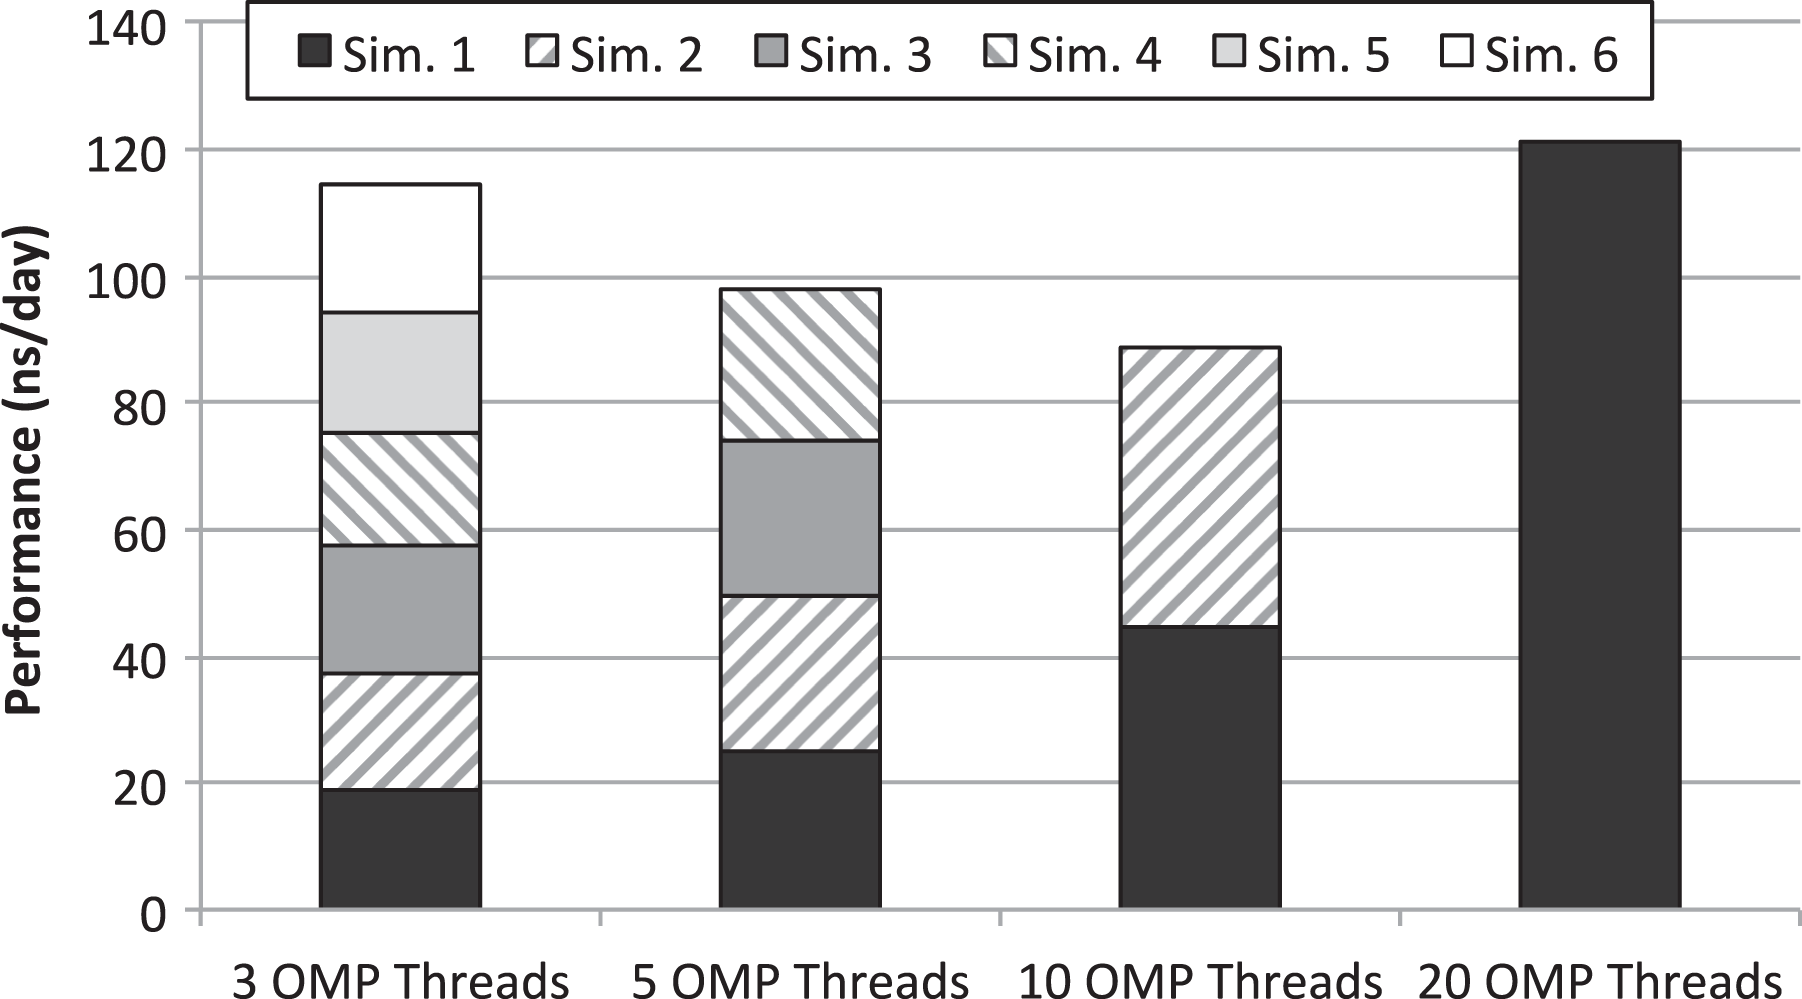
Although, in this article, we put the focus on overall system throughput, in this section, we begin the study by characterizing the performance of the GROMACS MD simulator in the three scenarios discussed in previous sections. Figure 3 depicts the performance attained by the MD simulator. CPU-only executions of GROMACS as well as executions using a single (real) GPU and executions using a remote virtual GPU across the EDR InfiniBand network are considered. For each of the scenarios, GROMACS has been configured to use 3, 5, 10, or 20 OpenMP (OMP) threads (simply threads from now on). Notice that it was not possible to configure GROMACS to use either one or two threads because of the nature of the simulations being carried out (GROMACS forced to 3 the minimum amount of threads to be used in the simulations).
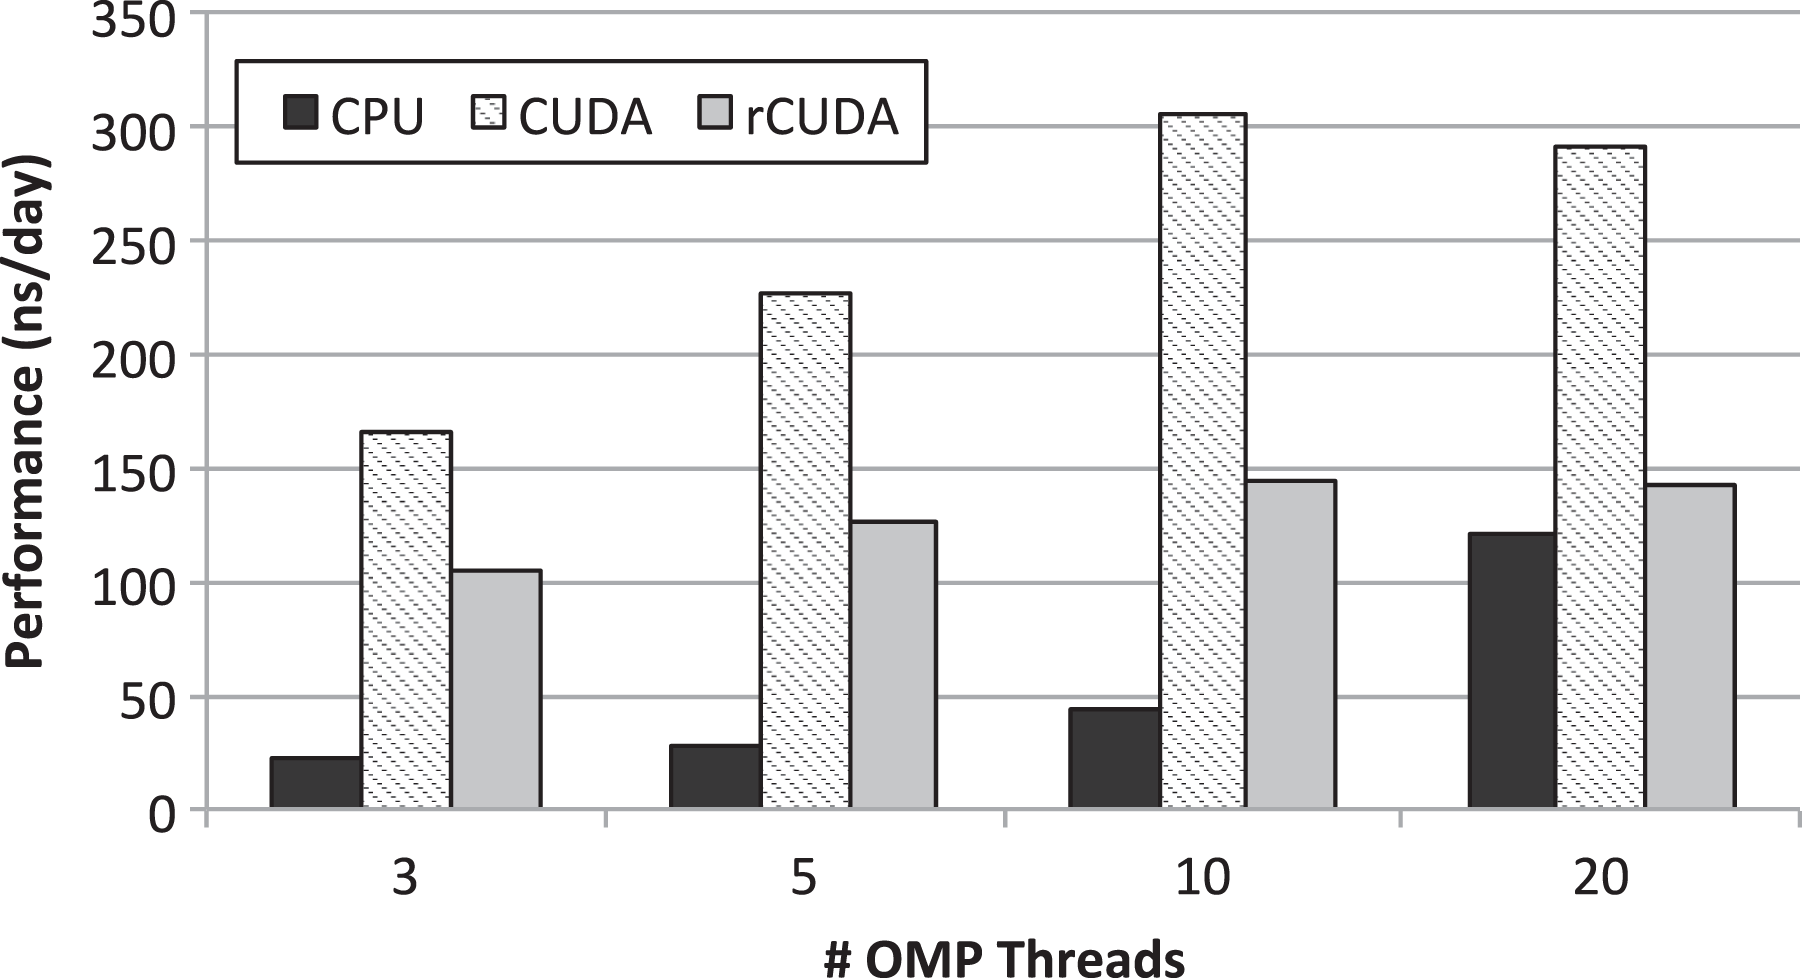
Performance of the MD simulations when 3, 5, 10, and 20 threads are leveraged. The three basic case studies are considered. MD: molecular dynamics.
Figure 3 shows that the best performance for the CPU-only simulations is achieved when all the cores in the node are devoted to the simulation. Actually, performance when 20 cores are used is much larger than twice the performance when GROMACS is configured to use 10 cores. Interestingly, performance when 3, 5, and 10 cores are used is proportional to the number of cores. Performance when 20 cores are used does not follow this trend.
When the local GPU is leveraged in the traditional way using CUDA (non-virtualized GPU), it can be seen that the performance of GROMACS greatly depends on the exact number of threads used during the simulation. This result is very interesting because it shows that performance not only depends on the use of the accelerator but also depends on how that accelerator is used. In the particular case of the molecules considered in this study, the best performance is achieved when GROMACS is configured to use 10 threads. In this regard, performance when 20 threads are used is slightly lower than that attained for 10 threads. This result is very important because it shows that a GPU-based facility where all the simulations are configured to use GPUs may easily waste resources: (a) in case the simulations are configured to use all the CPU cores, performance is not maximized; (b) in case simulations are properly configured to maximize performance, some cores at every cluster node will remain idle.
Figure 3 also displays the performance when GROMACS leverages a remote GPU (no GPU sharing in this case yet). It can be seen that the performance of a single simulation when rCUDA is used is noticeably lower than the performance when the local GPU is used with CUDA. This lower performance is due to the fact that a development version of rCUDA has been used in this study. This version of rCUDA, which is a major step forward with respect to previous rCUDA versions, contains all the functionality required to execute CUDA applications although its performance has not been optimized yet. This performance was optimized in previous versions of rCUDA (Reaño et al., 2015) although the functionality of those versions was limited and did not allow to execute some applications. It is expected that next releases of the rCUDA middleware will perform significantly better than the one used in this article, thus making the overhead of using remote GPUs negligible, as shown in the study by Reaño et al., 2015.
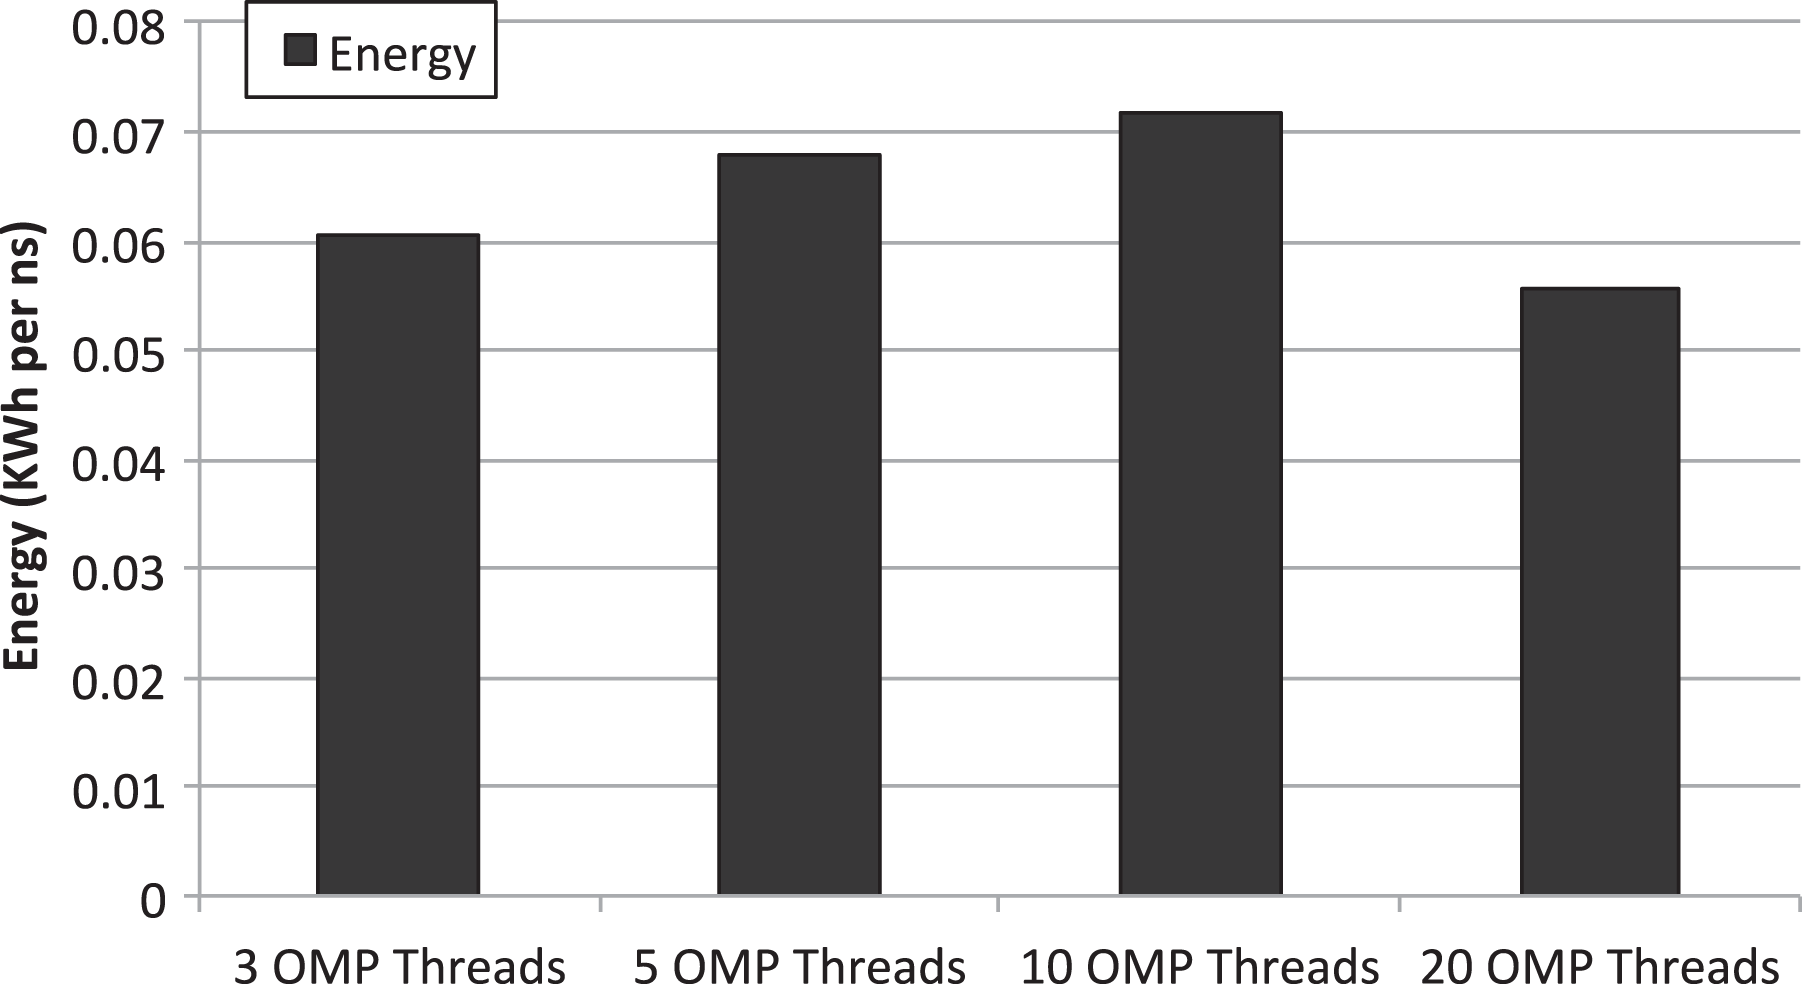
In addition to analyze the performance of GROMACS in each of the configurations depicted in Figure 2, taking a look at energy can provide a complementary perspective to the analysis. Figure 4 displays the energy required to perform the simulations in each of the hardware configurations considered. The metric used to show energy is relative to the simulated time: the nanosecond. System energy has been measured by polling once every second the power distribution unit (PDU) present in the cluster. Used unit is APC AP8653 PDU, which provides individual energy measurements for each of the servers connected to it. Therefore, energy measurements shown in Figure 4 refer to the entire node executing the MD simulator.
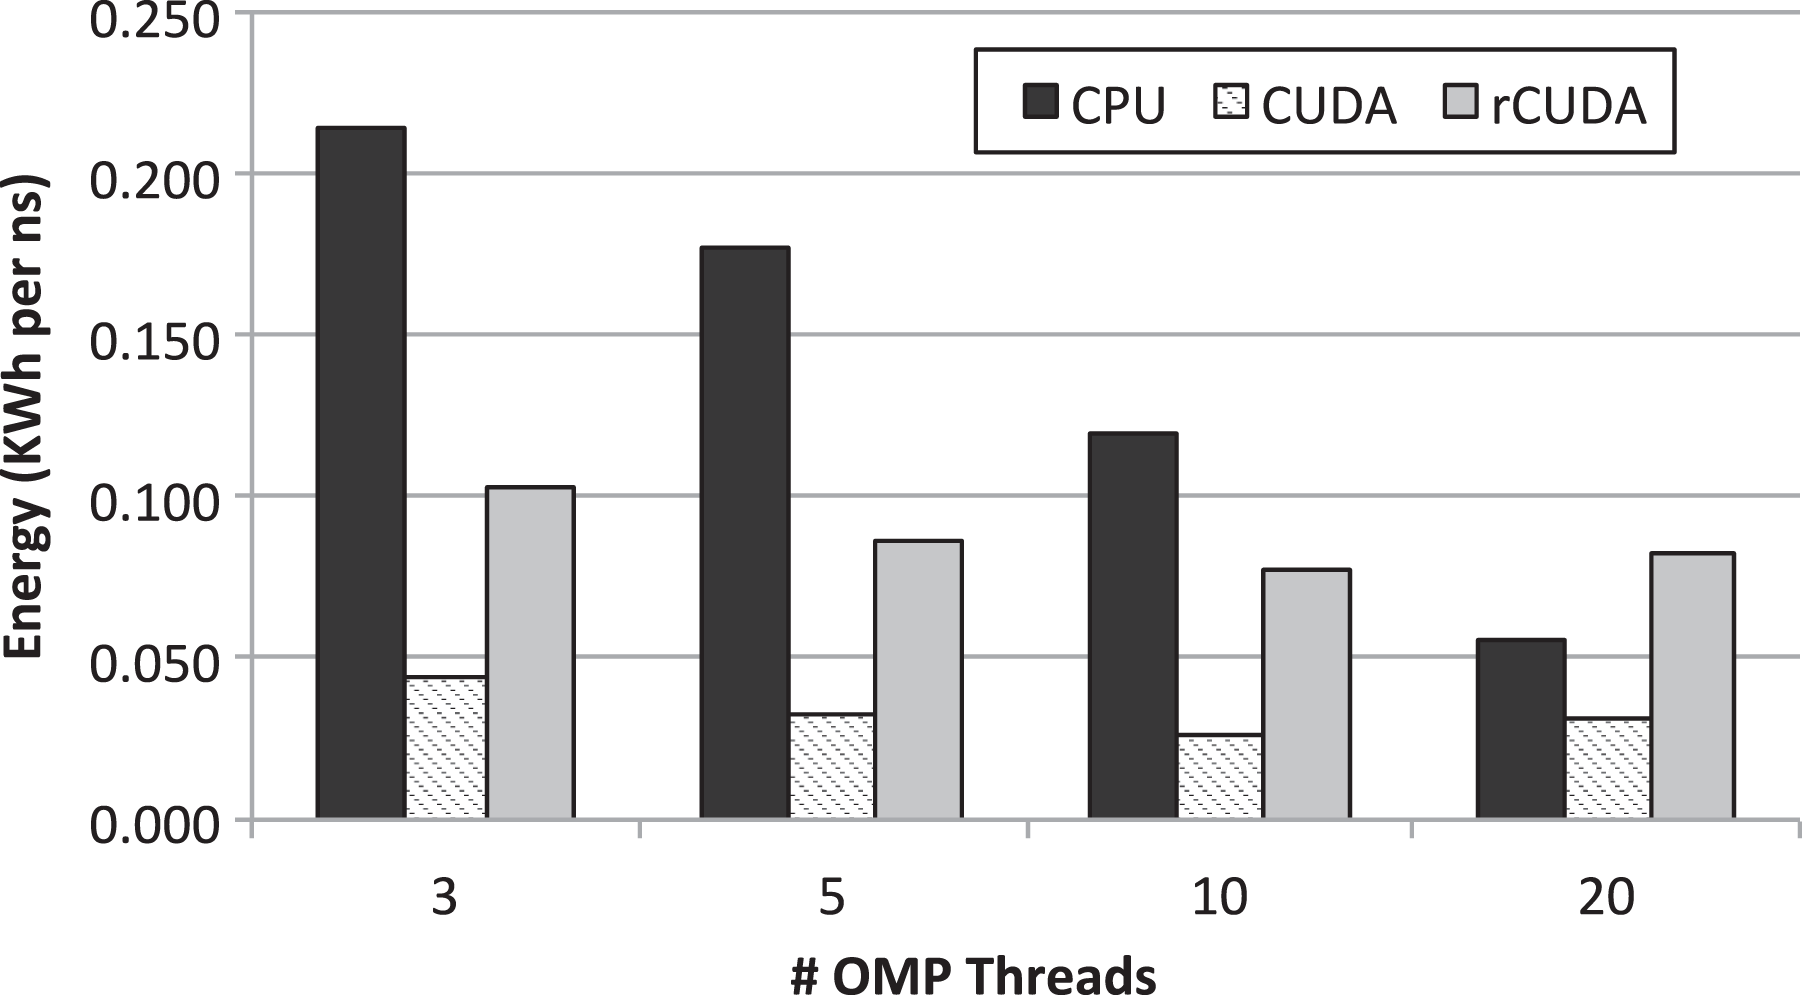
Energy per simulated nanosecond required by the MD simulations when 3, 5, 10, and 20 threads are leveraged. The three basic case studies are considered. MD: molecular dynamics.
Figure 4 shows that energy required in the CPU-only configuration decreases as the amount of threads involved in the execution of GROMACS increases. This result was expected given that, although the energy consumed by the node depends on the amount of active cores, the increment in energy for larger amounts of active cores is absorbed by the energy required by the rest of components of the node. Therefore, the reduction in execution time shown in Figure 3 for larger amounts of threads compensates the energy consumed by the additional cores used to run those threads. As a consequence, the faster the simulation is completed, the lower energy is required.
In the case of using the GPU in the traditional way with CUDA (scenario depicted in Figure 2(b)), Figure 4 shows that energy per nanosecond is also proportional to execution time. The reason is the same as for the CPU-only scenario: although using a larger amount of threads requires more CPU cores to be active, and thus more power consumption (see Figure 5), and additionally also causes a larger GPU utilization, the benefits in performance compensate for that increased power demand at the same time that the additional required energy is partially hidden by the power consumption of the rest of the components of the node. Furthermore, notice in Figure 4 that the energy required when 20 threads are leveraged by GROMACS is slightly larger than the one used when 10 threads are used. This higher energy consumption is aligned with the lower performance (larger execution time) shown in Figure 3 for the 20-thread CUDA case study.
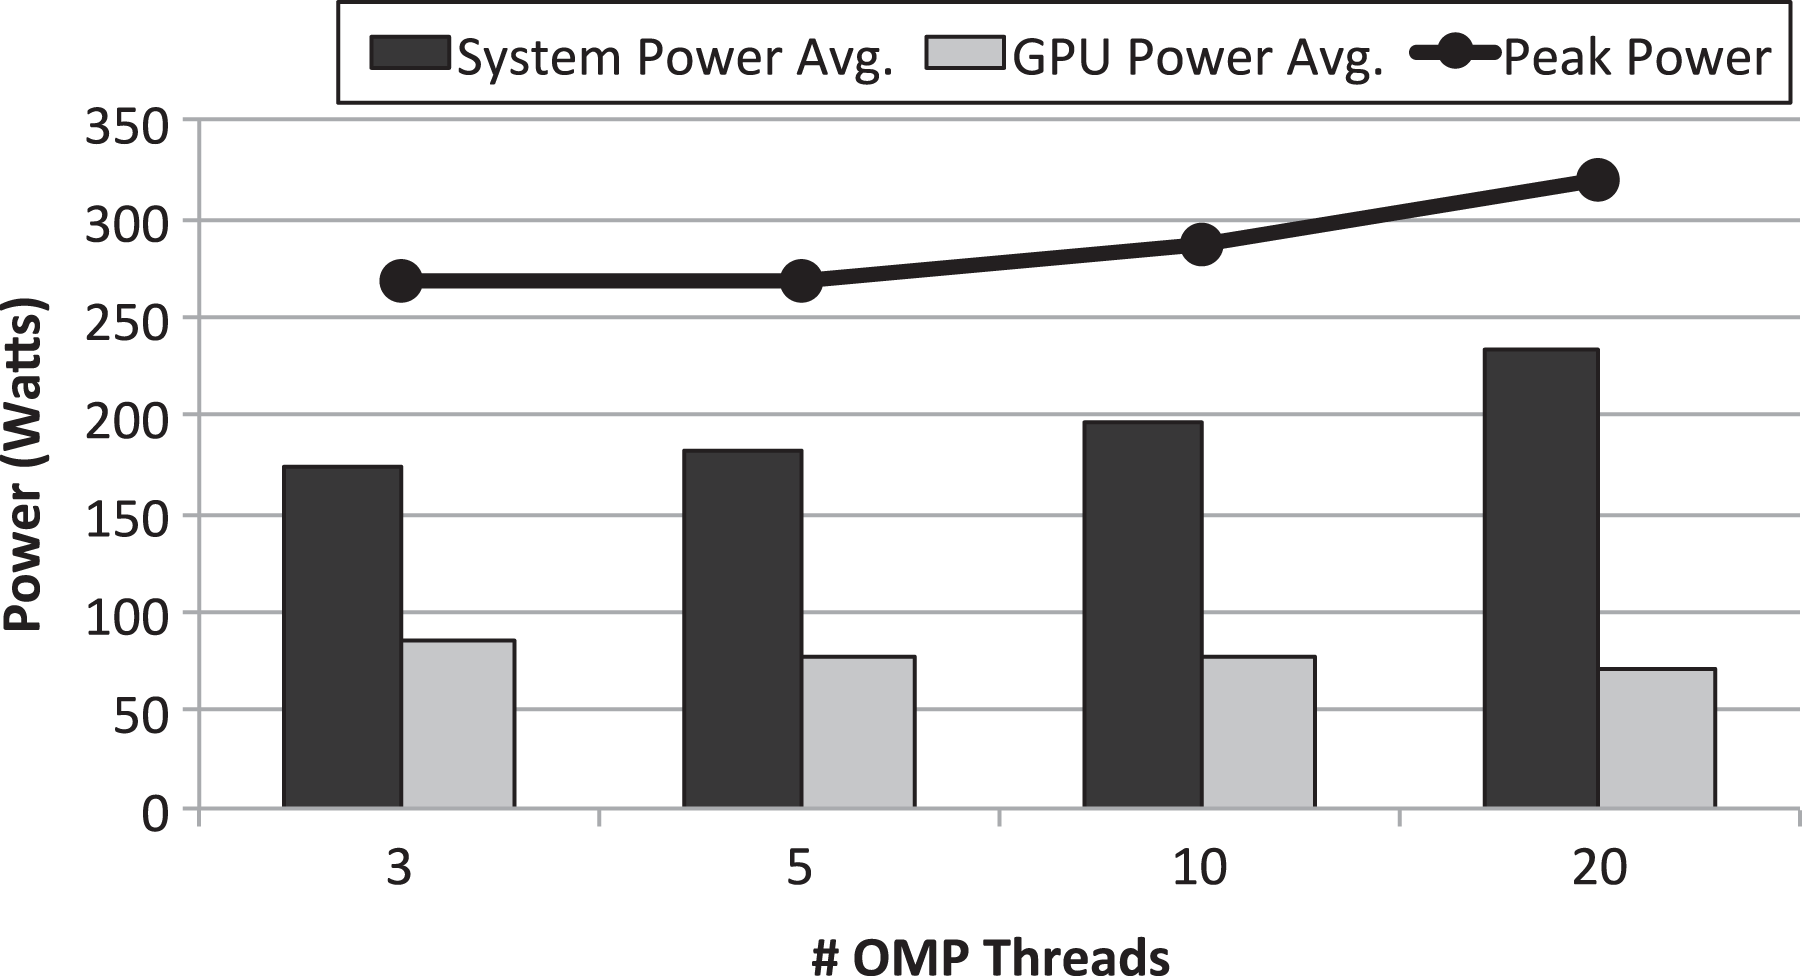
Average power required by the GPU and by the rest of the system in the CUDA scenario. Peak power required by the entire node also shown. Simulator configurations using either 3, 5, 10, or 20 threads are considered. GPU: graphics processing unit.
Finally, regarding the rCUDA configuration, it can be seen in Figure 4 that this scenario requires a much larger amount of energy than the CUDA configuration. Two are the reasons for this larger energy demand. On the one hand, in this case, we have considered the energy required by the two nodes involved in this scenario: the one executing the CPU part of GROMACS (client side) and the one executing the GPU part of the simulation (rCUDA server). On the other hand, as it was shown in Figure 3, performance in the rCUDA configuration is lower than in the CUDA case. This translates into a longer execution time thus causing that energy consumption is higher. Nevertheless, remember that in this work we aim at analyzing the benefits of using a multi-tenant virtual GPU strategy for increasing the throughput of independent GROMACS simulations. Therefore, although the results presented in Figure 4 regarding energy consumption for rCUDA are not promising, we should wait until the GPU is shared among several GROMACS instances before making conclusions.
5.3. Throughput for each case study
In the previous section, the performance of a single instance of GROMACS when executed without any concurrency with other instances has been shown. However, given that we are interested in overall system throughput when tens or hundreds of MD simulations are executed (typical VS workflow used in drug discovery), further experiments must be conducted to find out the performance of GROMACS simulations when they are concurrently executed with other MD simulations for each of the scenarios discussed earlier. In this section, we present those throughput results. Notice that in this section we do not mix yet different flavors of the GROMACS simulations. That is, in this section, we consider that all instances of GROMACS use either the CPU, the GPU with CUDA, or the GPU with rCUDA. In the next section, we will present throughput results when different GROMACS flavors are combined.
Figure 6 shows the overall throughput in the CPU-only scenario. Results in Figure 6 have been gathered by executing up to six concurrent GROMACS instances in the same node (remember that we have discarded the case study where a simulation spans over several cluster nodes). To run up to six GROMACS instances in the same node, the simulator has been configured to use 3, 5, 10, or 20 threads. Notice that GROMACS configurations with different amounts of threads have not been mixed. That is, when three threads are considered, all the instances of GROMACS make use of such an amount of threads. The same holds for 5- and 10-thread configurations of GROMACS.
Throughput of the CPU-only MD simulations when several instances are concurrently executed in the same node. Simulator configurations using either 3, 5, 10, or 20 threads are considered. MD: molecular dynamics.
It can be seen in Figure 6 that the best throughput is achieved when a single GROMACS instance is executed using all the available cores in the node (20 threads). This configuration achieves slightly better throughput than the second best option, which is interestingly composed of six 3-thread instances of GROMACS. It is shown in Figure 6 that aggregated throughput when six 3-thread instances of GROMACS are concurrently executed in a node is clearly larger than configurations with 5 or 10 threads, despite wasting two of the cores of the node (6 instances of 3-thread simulations require 18 cores instead of 20 cores). Notice that executions in Figure 6 have been launched by making use of the numactl command, which attaches processes to cores for all the execution of the application, so that data stored in the core caches do have to be migrated during application execution. In this manner, and given that resource managers not always make use of this feature, throughput of CPU-only executions in a real deployment might be slightly lower than that shown in Figure 6.
Figure 7 presents the energy required by the node concurrently executing the several instances shown in Figure 6. It can be seen that the best simulator configuration, attending to energy consumption, is using 20 threads (flooding the entire node with a single simulation). This result is consistent with the energy results previously shown in Figure 4 and points out that the additional energy required because of the activation of more cores in the node has a lower impact on the energy/performance ratio than the impact generated by the associated reduction in execution time.
Energy per simulated nanosecond required by GROMACS when several CPU-only instances are concurrently executed in the same node. Simulator configurations using either 3, 5, 10 or 20 threads are considered. GROMACS: GROningen MAchine for Chemical Simulations.
In the case of the CUDA scenario shown in Figure 2(b), and given that we are not considering yet mixing different flavors of GROMACS executions, only the case for one instance of the GPU-based simulator can be analyzed (mixing different flavors of GROMACS will be analyzed in the next section). In this case, as shown in Figure 3, maximum performance is attained when GROMACS is configured to use 10 threads. For this particular execution, Figure 8 displays the GPU memory usage and GPU utilization along execution time (GROMACS was configured to simulate 200 ns of the movements of the molecules). Data for GPU memory usage and GPU utilization have been gathered by polling the GPU in the node once every second. A homemade program based on the NVML NVIDIA library is used to that end.
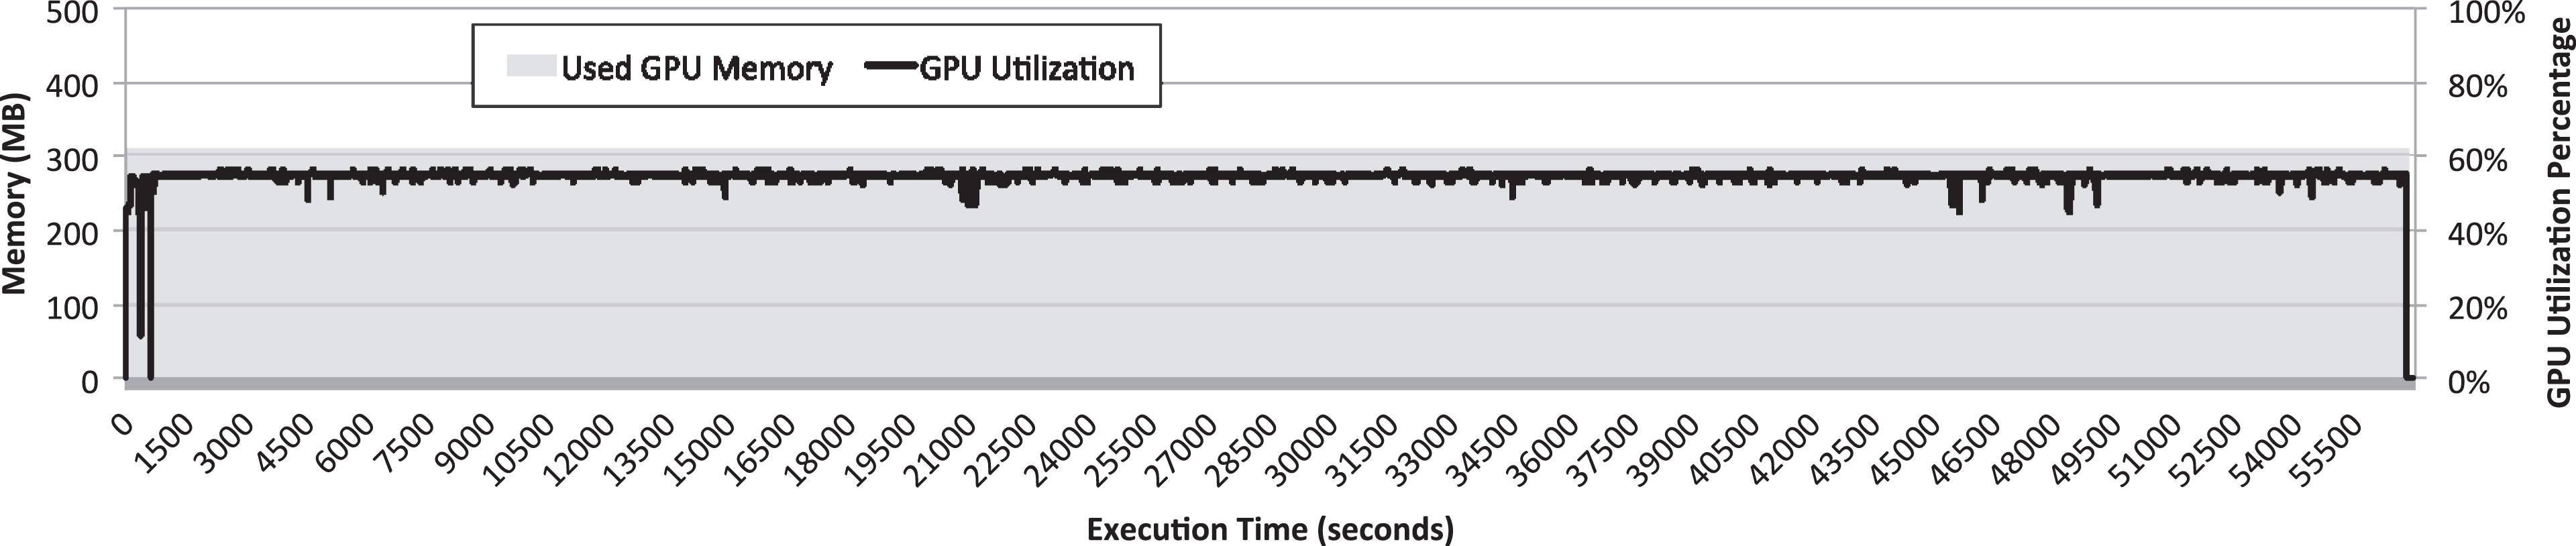
GPU memory and GPU utilization along the execution time of the GROMACS simulator configured to use 10 threads with the molecules under study. Simulation was configured to last 200 ns of simulated time. GPU: graphics processing unit; GROMACS: GROningen MAchine for Chemical Simulations.
It can be seen in Figure 8 that the GPU memory footprint of the MD simulation is about 300 MB. This memory footprint is quite small if compared to the memory available in the P100 GPU (16 GB). Furthermore, it can be seen in the figure that GPU utilization remains almost constant despite the large amount of small kernels executed. In this regard, the utilization of the GPU is never larger than 60%. This result is very important because it points out that GPU resources are clearly underutilized. Actually, it is expected that this underutilization is exacerbated in newer and more powerful GPU generations where the gap between the performance of the CPUs and the performance of the GPUs increases. The rationale for this statement is the following: for a simulation as the one depicted in Figure 8, the CPU part of the application will take approximately the same time to be executed given that newer processors will not noticeably improve performance per core but they are expected to be more power efficient, according to the trend followed during the last decades. However, the time required for executing the kernels in the GPU will be reduced in newer GPUs presenting a larger amount of cores which, additionally, are more efficient. In this way, given that MD simulations alternate CPU and GPU periods for their entire execution time, it is expected that the GPU periods become shorter due to a reduced execution time, whereas execution time of CPU periods remains almost constant. As a consequence, GPU utilization will be reduced.
Figure 9 shows the instant power and accumulated energy along the execution time of the simulation shown in Figure 8. Instant power is split into GPU power and system power. System power data were gathered by polling once every second the PDU present the cluster, as mentioned before. To split power data provided by the PDU into system power and GPU power, the homemade program based on the NVML library was used to collect, every second, the power required by the GPU. Thus, system power presented in Figure 9 is the difference between the power measurement provided by the PDU and the power numbers provided by the homemade NVML-based program. It can be seen in Figure 9 that power required by the system is around 200 W, whereas power required by the P100 GPU is around 75 W. Furthermore, it can be seen that power required by both the system and the GPU remains almost constant for all the execution time of the simulation. This result was expected from the GPU utilization numbers shown in Figure 8, which also remain almost constant for the entire execution of GROMACS. On the other hand, given that consumed energy is proportional to instant power and execution time, it can be seen in Figure 9 how total energy requirements for the execution of this simulation increase with execution time. This increment is linear because instant power remains constant during execution time.
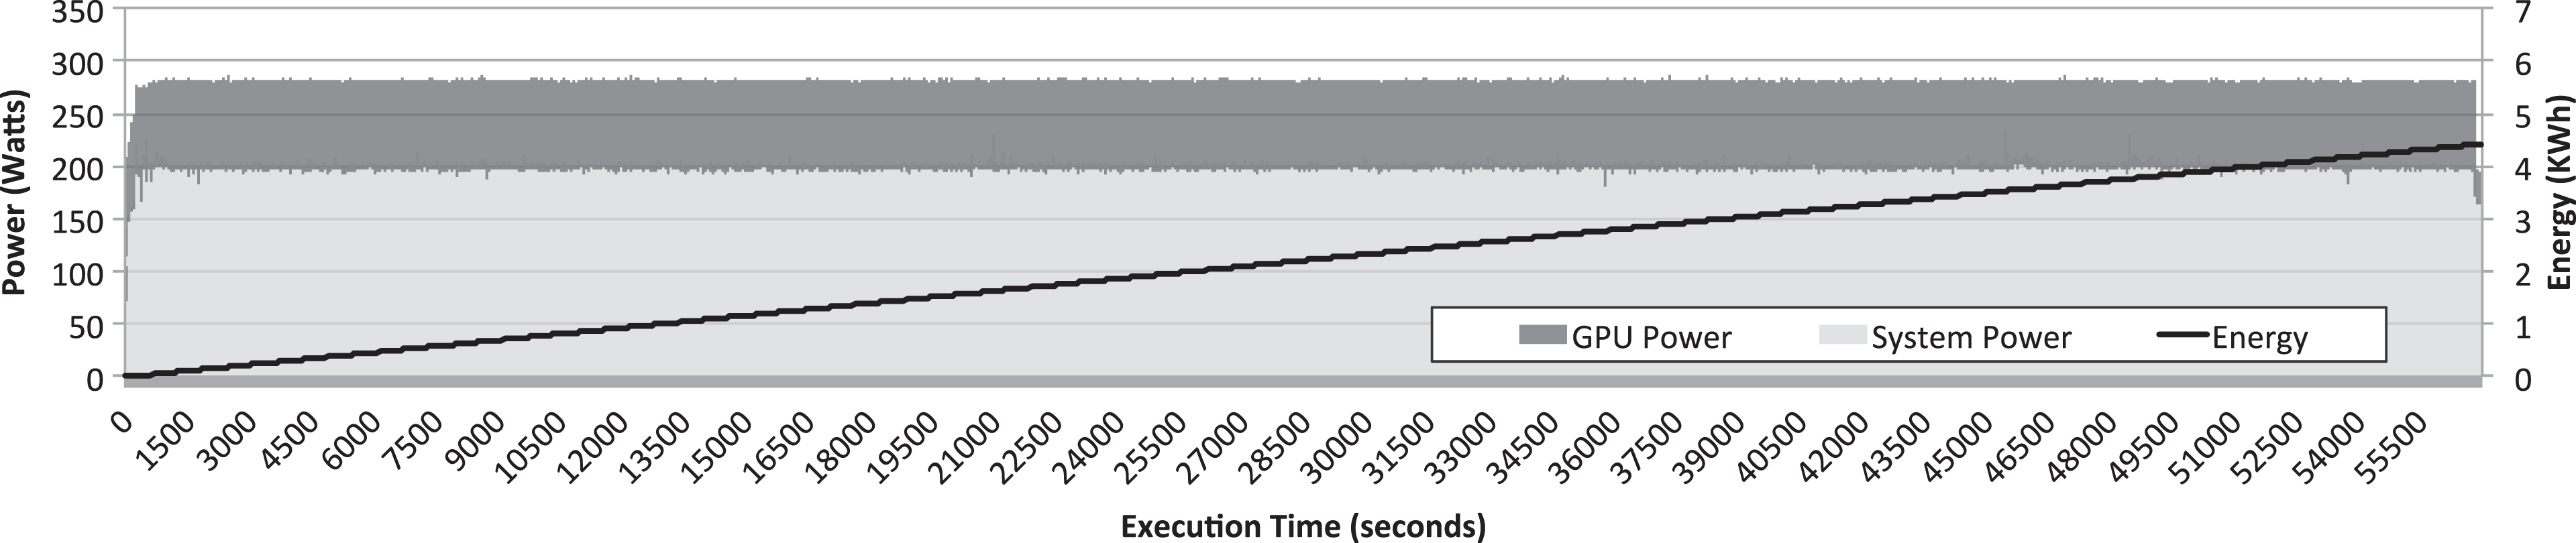
Instant power and accumulated energy along the execution time of the GROMACS simulator configured to use 10 threads with the molecules under study. Simulation was configured to last 200 ns of simulated time. Instant power is splitted into GPU power and system power. GPU: graphics processing unit; GROMACS: GROningen MAchine for Chemical Simulations.
Overall throughput in the rCUDA scenario is shown in Figure 10. Remember that this case study, contrary to the other two case studies, leverages two nodes instead of only one node. In this way, we can use both nodes to execute instances of GROMACS that will share the GPU located in one of the nodes thanks to rCUDA. Figure 10 depicts performance results when the GROMACS instances are configured to make use of 20, 10, 5, and 3 threads. In the first scenario, one GROMACS instance is executed in the node without GPU, whereas the other instance is executed in the node running the rCUDA server (GROMACS instances flood first the client node and then continue filling the server node). It can be seen in Figure 10 that aggregated performance when 20 threads are used is not increased when a second instance is executed in the node with the GPU. This is due to two different reasons. The first one is that the rCUDA server requires some CPU cores in the GPU server to be run and thus it competes with GROMACS in that node. More precisely, the rCUDA server requires a core per each application process it serves. In this way, given that it is serving two instances of GROMACS, it requires two cores in the GPU node, in addition to the 20 cores already used by the MD simulator. This oversubscription causes the reduction in performance shown in Figure 10. The second, although less important, reason for not increasing performance when a second 20-thread GROMACS instance is executed in the GPU server is that computations in all the 20 threads of a given GROMACS instance must be completed before the simulation can proceed with the next time step. Therefore, given that the rCUDA server process and the GROMACS instance in execution in that node are bothering each other, some threads get delayed thus causing that the entire application executes slower. That is, given the large granularity of the simulations, waiting time becomes the bottleneck. This can also be observed in the low GPU utilization reported in this configuration. In a similar way, although aggregated performance is noticeably increased when 10 threads are used by each GROMACS instance, when all the 40 available cores in the system are used by GROMACS, performance drops. The reason for this drop in performance is the same as in the previous case. Notice that in this case the rCUDA server makes use of four cores and therefore oversubscription is larger than in the previous case.
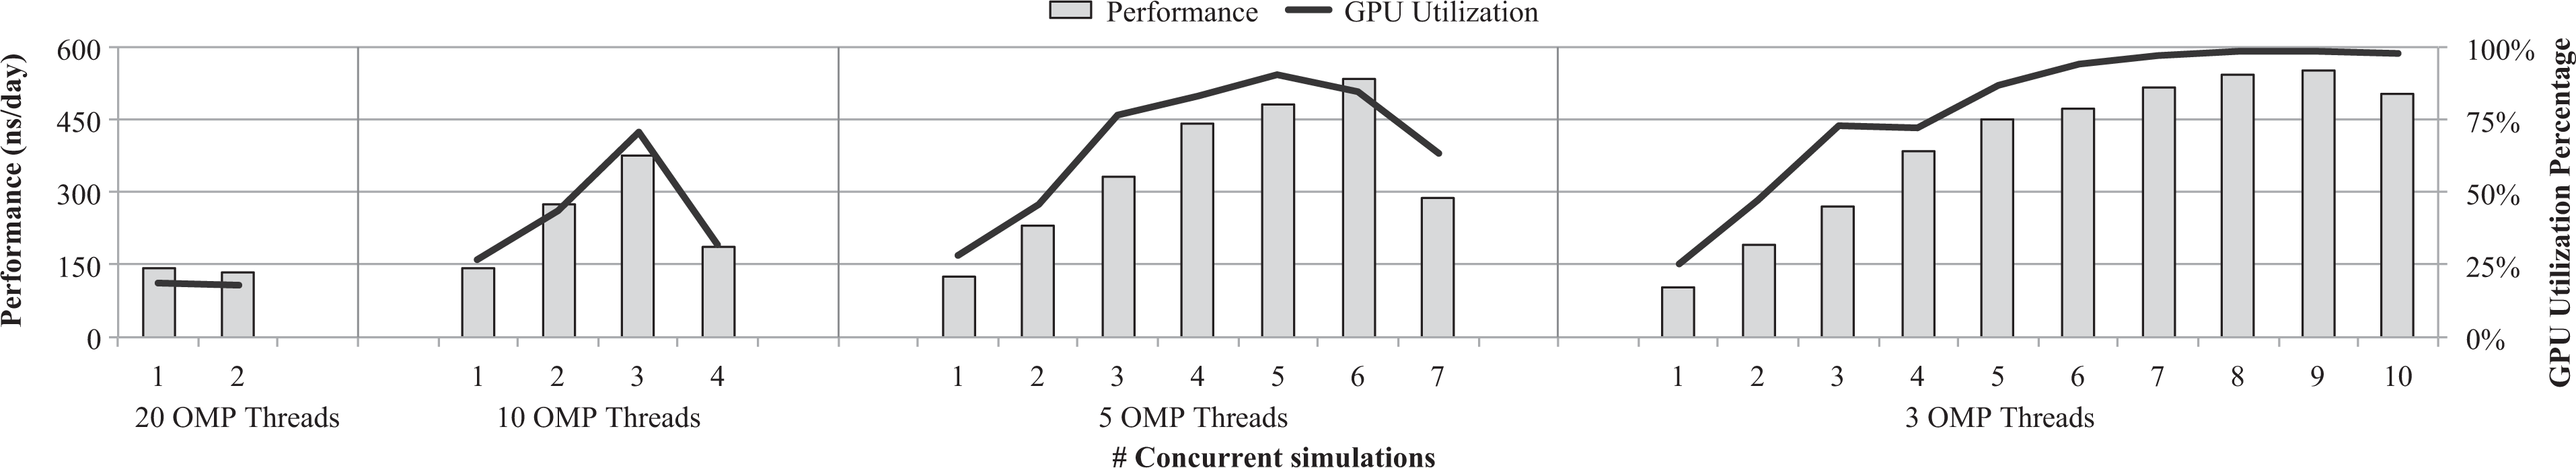
Throughput and GPU utilization when several instances of GROMACS share the GPU in the rCUDA server by leveraging the rCUDA middleware. Simulator configurations using either 20, 10, 5, or 3 threads are considered. rCUDA: remote CUDA; GPU: graphics processing unit; GROMACS: GROningen MAchine for Chemical Simulations.
GROMACS performance with configurations using five and three threads per instance is noticeably better, as shown in Figure 10. It can be seen that in the case of three-thread simulations (the smallest granularity considered in this study), GPU utilization is almost 100% beyond six instances. Moreover, aggregated performance is almost 600 ns/day when eight concurrent GROMACS instances share the GPU. Notice that this result is achieved with a version of rCUDA whose performance is not optimized yet. Throughput results with an optimized version of rCUDA are expected to be improved. Actually, with an improved version of rCUDA, it is expected that 100% GPU utilization is achieved with a smaller amount of instances (currently eight instances) thus allowing to use a larger amount of cores for additional CPU-only simulations. This would further increase overall throughput.
Figure 11 shows the energy point of view of the results shown in Figure 10. As shown in previous figures, the energy required for simulating a nanosecond is displayed. The energy required by both nodes (client and server sides) is considered in the figure. It can be seen that the more instances of the simulator are concurrently run, the better energy results are obtained. This rule is broken when the server system gets congested either at the GPU or at the CPU. In this regard, Figure 11 shows an increment in the energy trend for the second instance when 20 threads are used, for the fourth instance when GROMACS uses 10 threads, for the seventh instance in the case of using 5 threads per simulation and, finally, in the 10th instance when GROMACS is run using 3 threads per instance. Furthermore, as shown in the previous figures, energy is proportional to execution time (or performance). Additionally, if the energy per nanosecond required when running eight 3-thread GROMACS instances with rCUDA (Figure 11) is compared with the energy per nanosecond required when running one 10-thread simulator instance with CUDA (Figure 9), it can be seen that energy is similar in both cases.
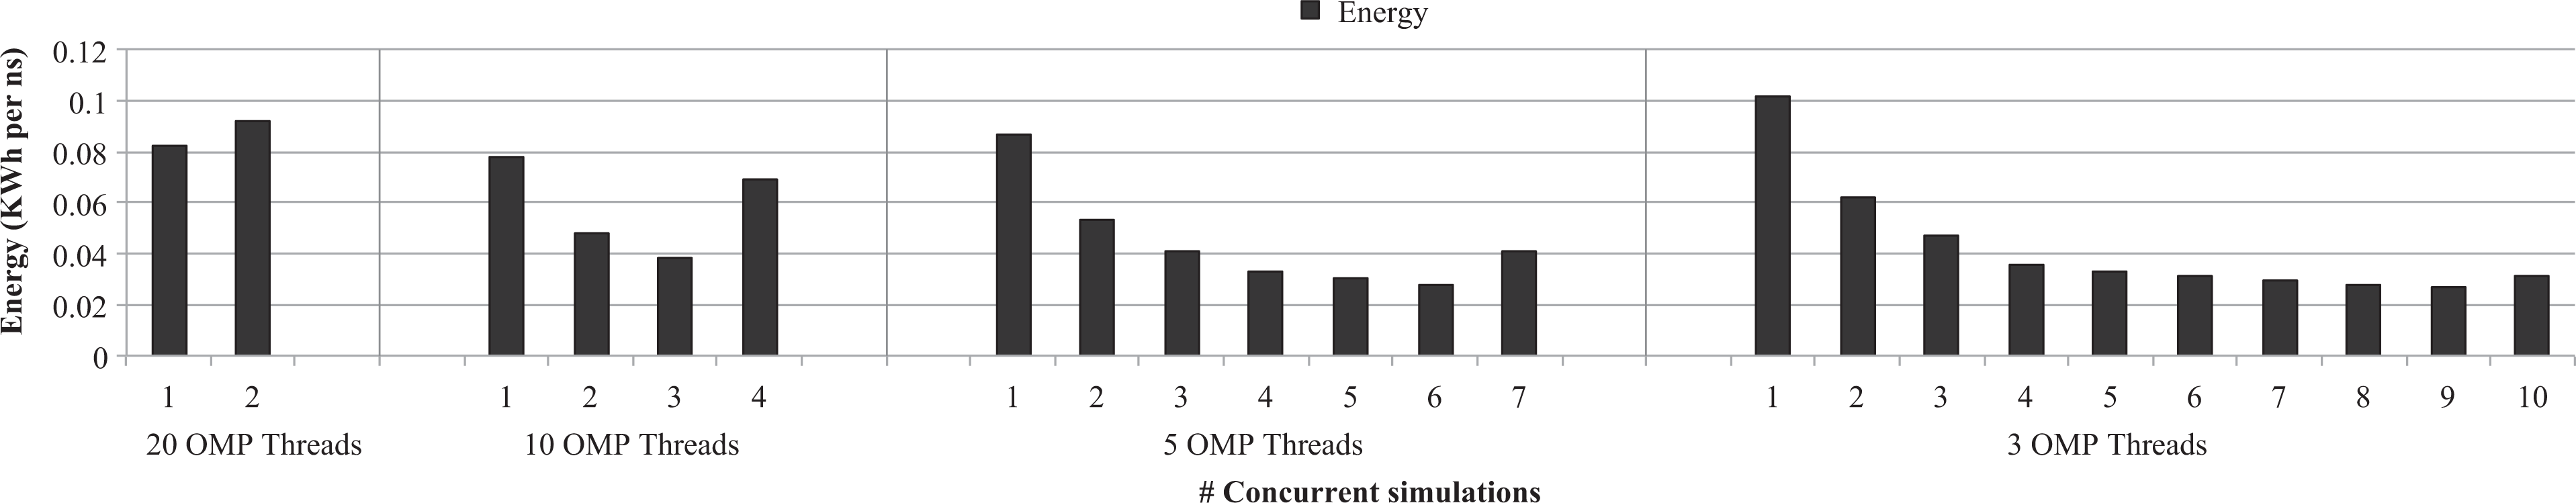
Energy per simulated nanosecond required by GROMACS when several simulator instances share the GPU in the rCUDA server by leveraging the rCUDA middleware. Simulator configurations using either 20, 10, 5, or 3 threads are considered. GPU: graphics processing unit; rCUDA: remote CUDA; GROMACS: GROningen MAchine for Chemical Simulations.
Finally, remember that overall throughput in the CUDA case was 300 ns/day per node (results in Figure 3 for 10-thread simulations). Notice, however, that the hardware used to achieve the performance in the CUDA and in the rCUDA cases is not the same. Although in both cases only one GPU is leveraged, in the rCUDA case, a second node has been used. Therefore, more CPU cores were available in the rCUDA scenario. To perform a fair comparison, in the next section, we analyze the throughput attained by each of the system configurations presented in Figure 2 when using a similar amount of hardware resources.
5.4. Overall system throughput
In the previous sections, we have first analyzed the performance of GROMACS in each of the scenarios depicted in Figure 2 when a single instance is run without sharing resources with other instances. Later, we have studied how performance was improved when several instances were concurrently run in each of the scenarios (except the GPU-based one, which does not allow several instances of GROMACS to share the GPU). However, it is also possible to mix the different flavors of GROMACS (CPU-based and GPU-based executions) to increase the overall throughput of the system. In this section, we perform such an analysis.
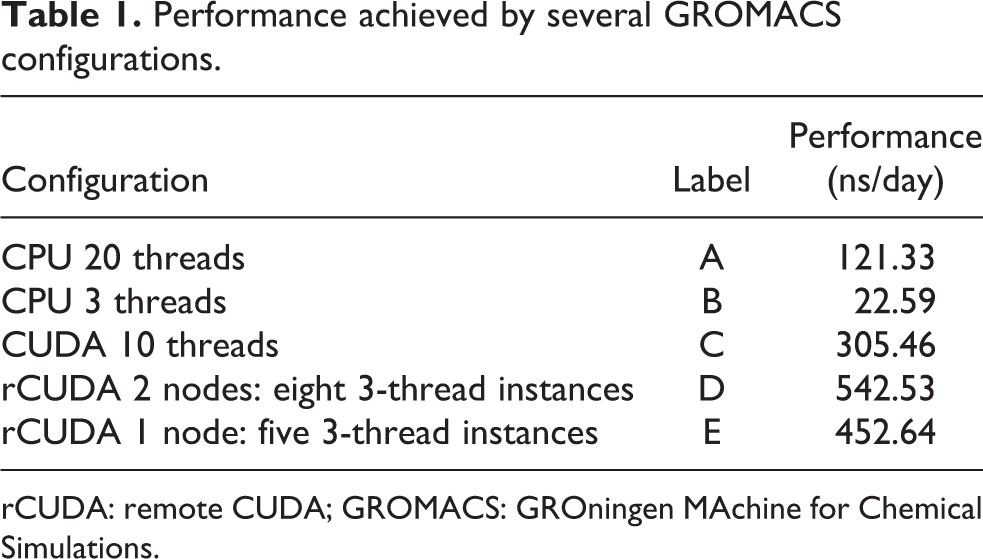
CPU and GPU-based flavors of GROMACS can be mixed in the CUDA (Figure 2(b)) and rCUDA (Figure 2(c)) scenarios (the CPU-based scenario only allows to run CPU instances of GROMACS). In these two scenarios, the CPU cores not devoted to GPU-based simulations can be used to execute additional instances of GROMACS using only the CPU cores. By making this kind of mixtures, it is expected to increase overall throughput. Using the performance data gathered in previous sections, we can make projections about overall system throughput in terms of aggregated nanosecond per day. To make such projections, we will use the performance data given in Table 1. This table shows that a single CPU-based simulation using 20 threads achieves a performance of 121.33 ns/day (this is the value already shown in Figure 3). Similarly, when only three threads are used, performance is lowered to 22.59 ns/day. If the GPU is used by a GROMACS simulation configured with 10 threads, attained performance is 305.46 ns/day. On the other hand, in the rCUDA scenario, when eight concurrent three-thread simulations share the GPU (using two different cluster nodes to run the CPU processes), aggregated performance is 542.53 ns/day. Furthermore, when rCUDA is used in a single node (all the GROMACS simulations being run in the node owning the GPU and running the rCUDA server), five concurrent three-thread simulations report an aggregated performance of 452.64 ns/day. Notice that in this latter configuration, all the 20 cores in the node are used because the GROMACS instances are using 15 cores, whereas rCUDA makes use of five additional cores to serve those five GROMACS instances.
Performance achieved by several GROMACS configurations.
rCUDA: remote CUDA; GROMACS: GROningen MAchine for Chemical Simulations.
With the data presented in Table 1, we can make two different projections to mix several GROMACS flavors. First, we can assume a cluster composed of n nodes where half of the nodes own a GPU and the other half do not own a GPU. In this cluster configuration, the non-GPU nodes would be used to execute CPU-based instances of GROMACS. For these CPU-based simulations, the best configuration is using 20 threads per instance as shown in Figure 3. In addition to the GROMACS executions run in the non-GPU nodes, each GPU node would execute one 10-thread simulation. This would leave 10 unused cores in the node, which could be used to run three 3-thread instances of GROMACS. This cluster configuration would therefore report an overall throughput equal to 494.56 ns/day per each couple of nodes (one node with GPU and one node without GPU). With this very same hardware resources (one non-GPU node and one GPU node), in the rCUDA case, it would be possible to execute eight 3-thread GPU instances of GROMACS with rCUDA and two 3-thread CPU instances in the spare cores. This would provide a throughput equal to 587.71 ns/day. This translates into a 1.19× speed-up when virtual GPUs are used. Notice that the same hardware resources are leveraged in both cases.
The second projection that can be made with the numbers in Table 1 is assuming a cluster where every node owns one GPU. In this scenario, we could use a single node to execute the rCUDA-based GROMACS simulations. In this case, that node would be able to run five 3-thread GROMACS instances, thus using all the 20 cores in the node and reporting a throughput equal to 452.64 ns/day. In the case of the CUDA executions, three 3-thread CPU-based instances of GROMACS could be run in addition to the 10-thread GPU-based one. That would report a total throughput equal to 373.23 ns/day. As can be seen, in this cluster configuration, speed-up of using multi-tenancy with virtual GPUs would be 1.21×. Again, same hardware resources would be used in both cases.
The above mentioned assumptions can be formalized using the following equations: For the hybrid cluster composed of nodes with one GPU and nodes without GPU For the homogeneous cluster where all the nodes own one GPU
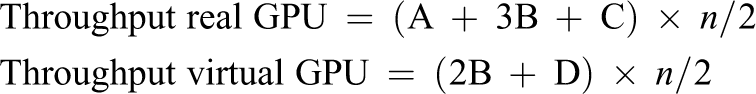
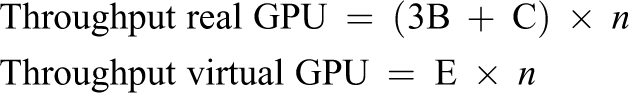
The above mentioned equations allow us to make a throughput estimation depending on the number of nodes in the cluster, which is referred to as n in the equations. Furthermore, labels “A,” “B,” “C,” “D,” and “E” refer to the values given in Table 1. Figures 12 and 13 present such estimations for the hybrid and homogeneous clusters, respectively. It can be seen in both figures that applying the multi-tenant virtual GPU strategy effectively increases the throughput of independent GROMACS simulations while using the same hardware as in the real GPU scenario.
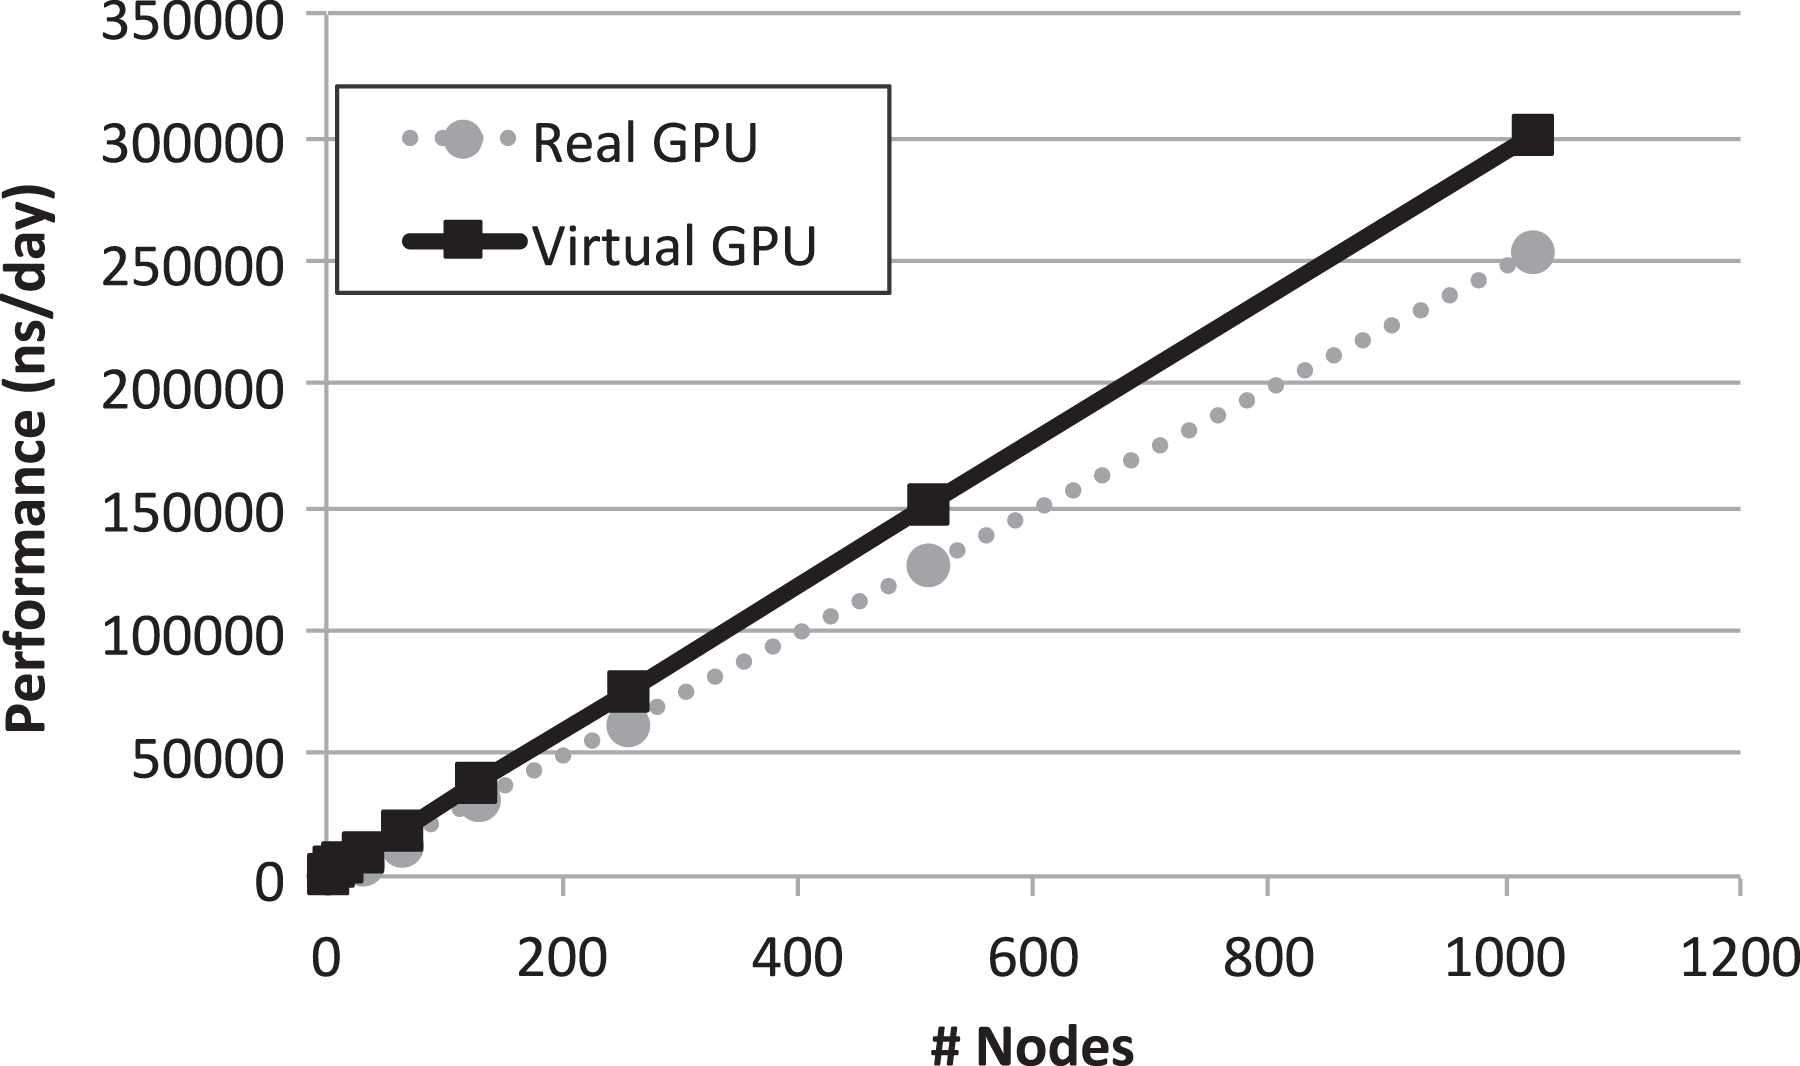
Aggregated throughput projection for a hybrid cluster composed of n nodes where half of the nodes own a GPU whereas the other half of the nodes do not leverage any accelerator. GPU: graphics processing unit.
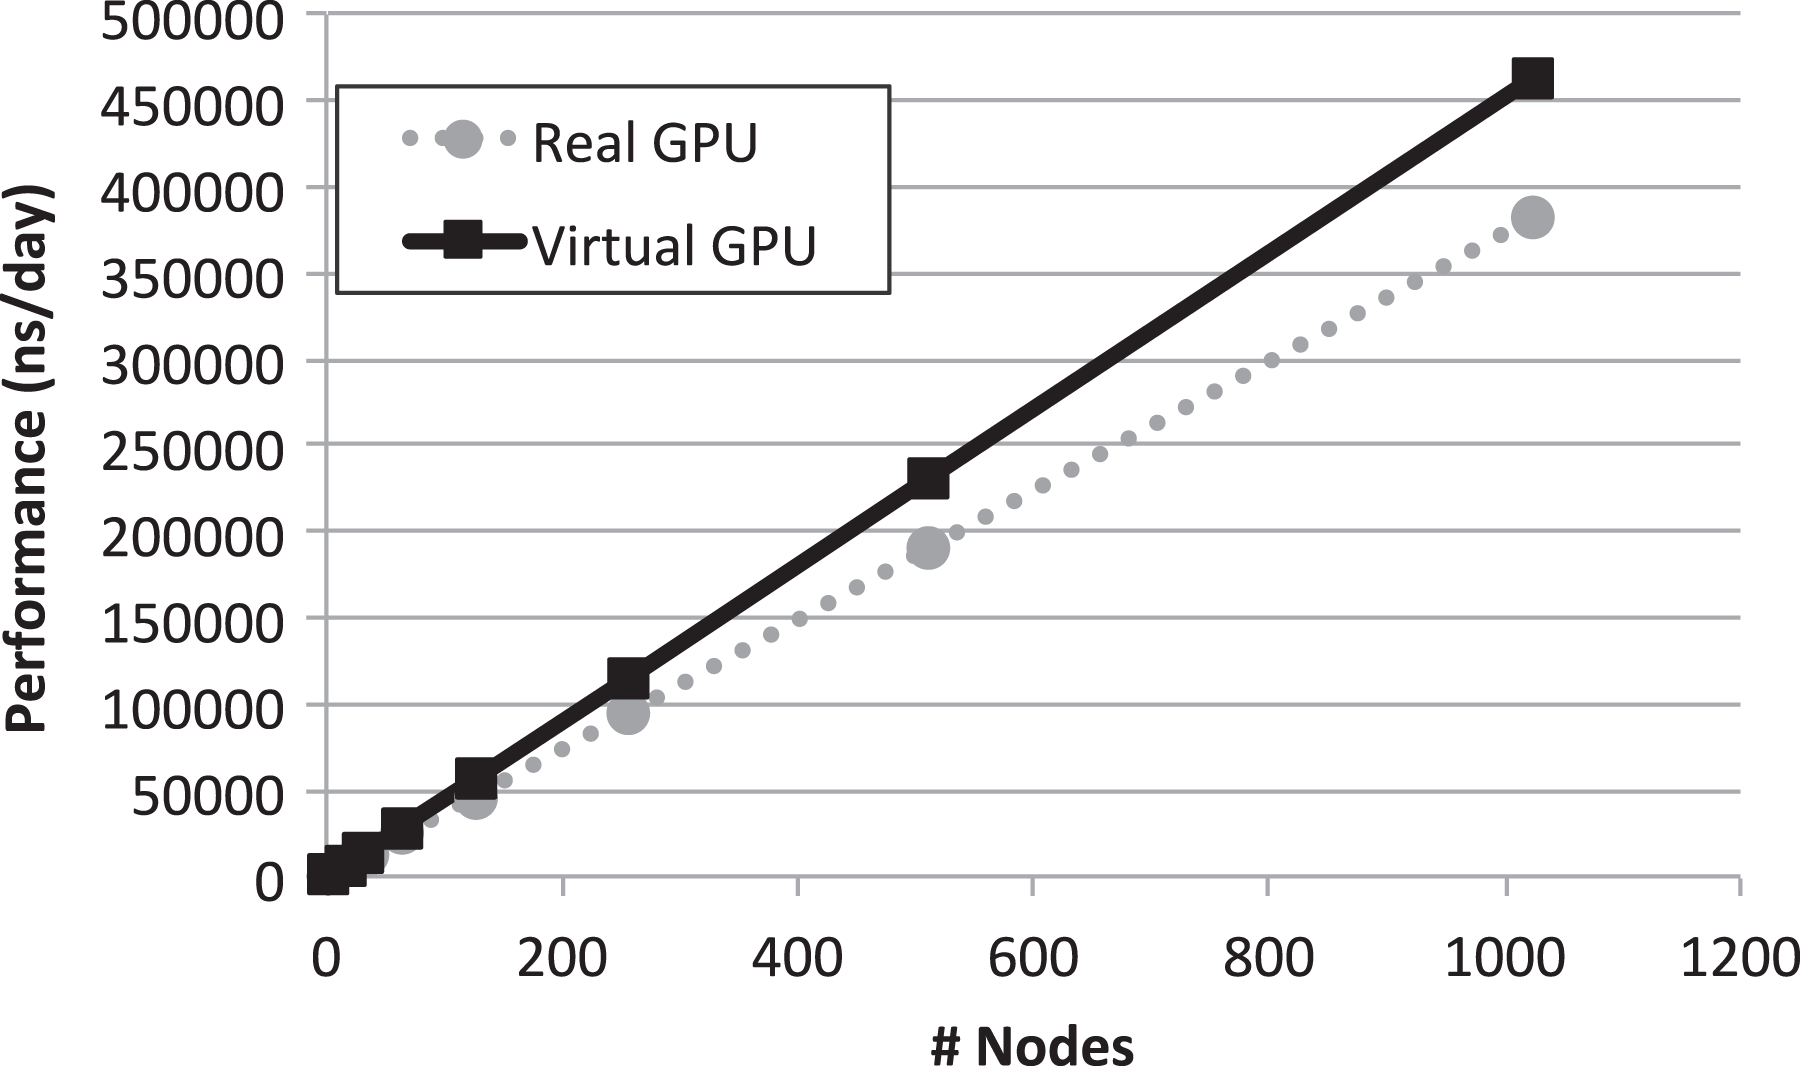
Aggregated throughput projection for a homogeneous cluster composed of n nodes where all the nodes own one GPU. GPU: graphics processing unit.
5.5. Analysis of obtained MD results in terms of biological validation
Regarding the biological significance and correctness of obtained results from previously mentioned MD results, as one can see in Figure 14, the computed root mean square deviation (RMSD) for the DNA structure along the MD trajectory ranges from around 0.3–2.2 nm. Although these might seem high RMSD values for such structural model, this is the logical consequence of performing long MD simulations without imposing any structural restriction to the studied DNA fragment. Of course, we may add end-to-end distance constraints to DNA to reduce these RMSD values. Besides, from Figures 15 and 16, we can observe that ligand DEPHBC remains stable regarding non-covalent interactions with DNA system, as Halder and Purkayastha (2018) reported experimentally, which confirms the validity of our proposal. However, our main goal was to show how rCUDA helps to increase the sampling of a bio-model free of any geometrical restriction to add a full dynamic protocol. It is also worth stressing that in spite of such measurable variation in the RMSD, the characteristic double helix architecture is maintained, so that reliable macroscopic conclusions can be extracted from the GROMACS output.
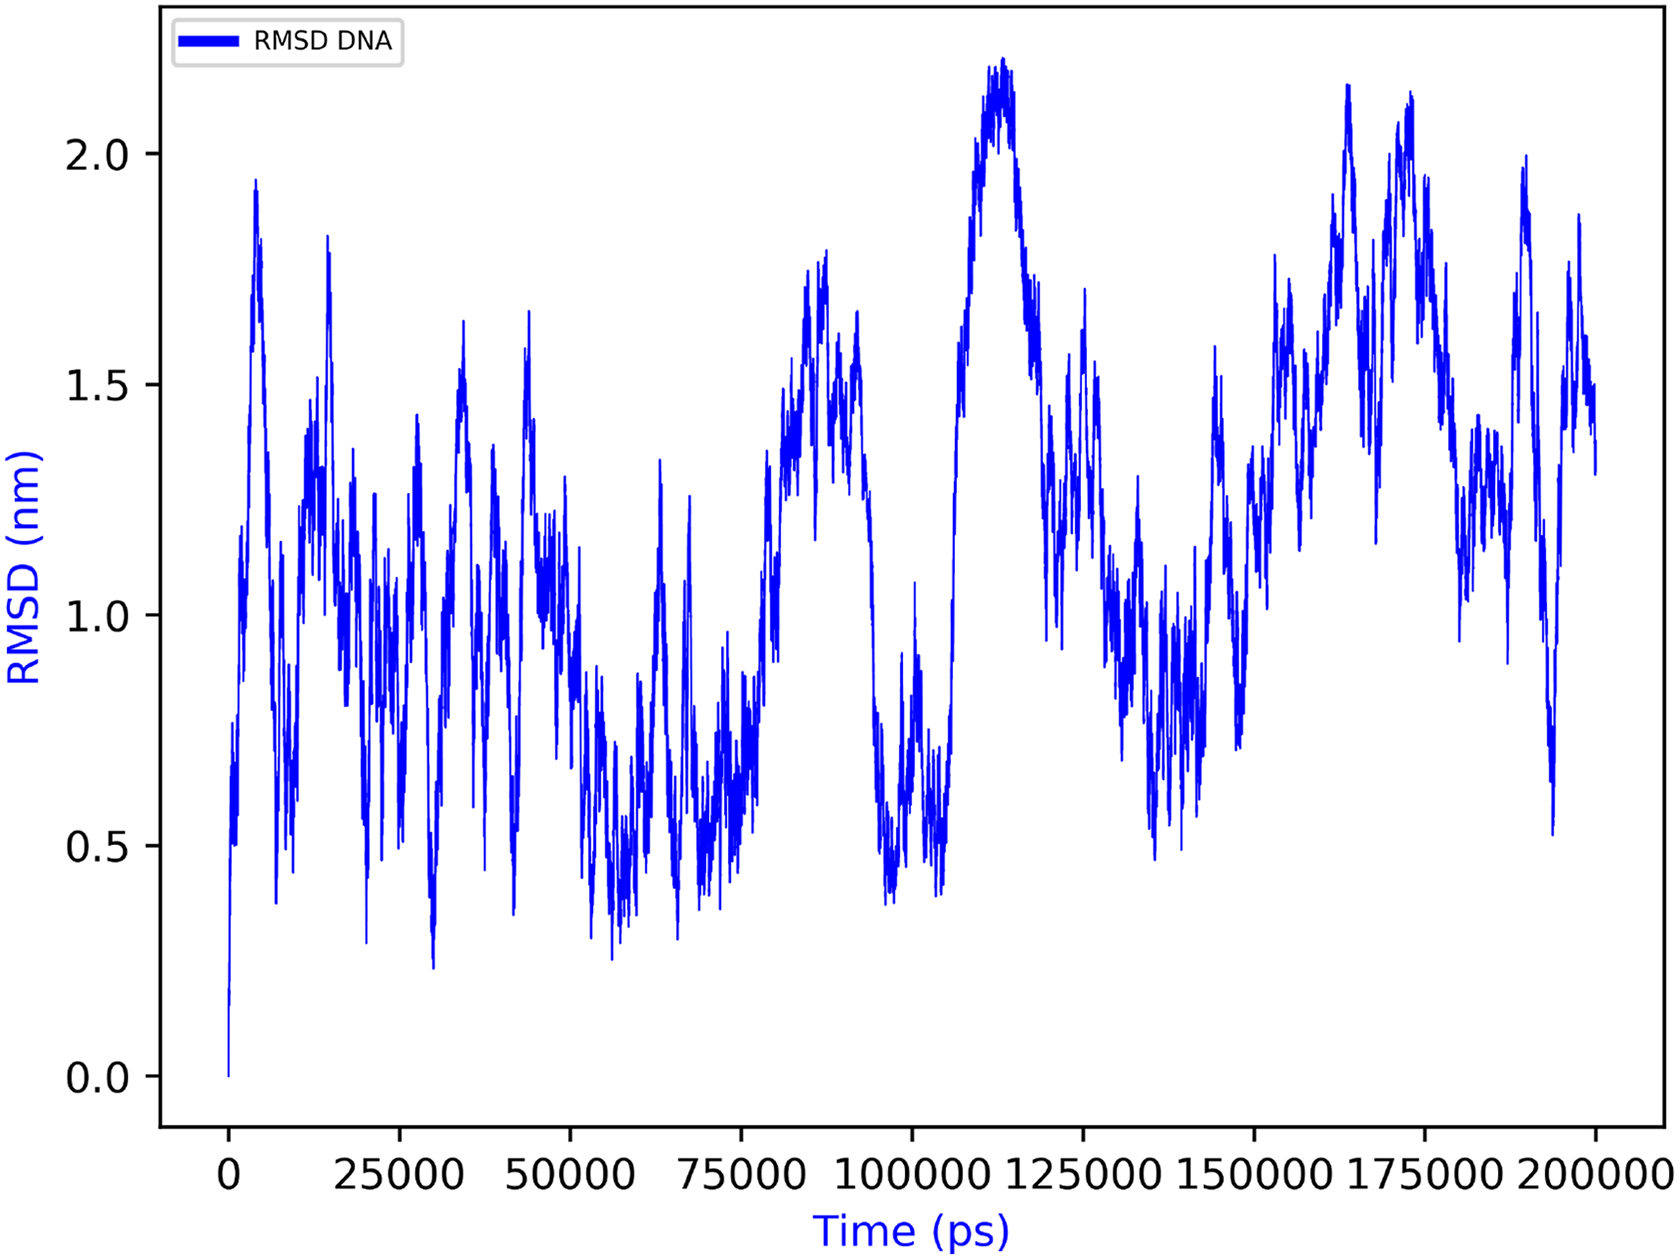
RMSD over time for the DNA structure. RMSD: root mean square deviation.
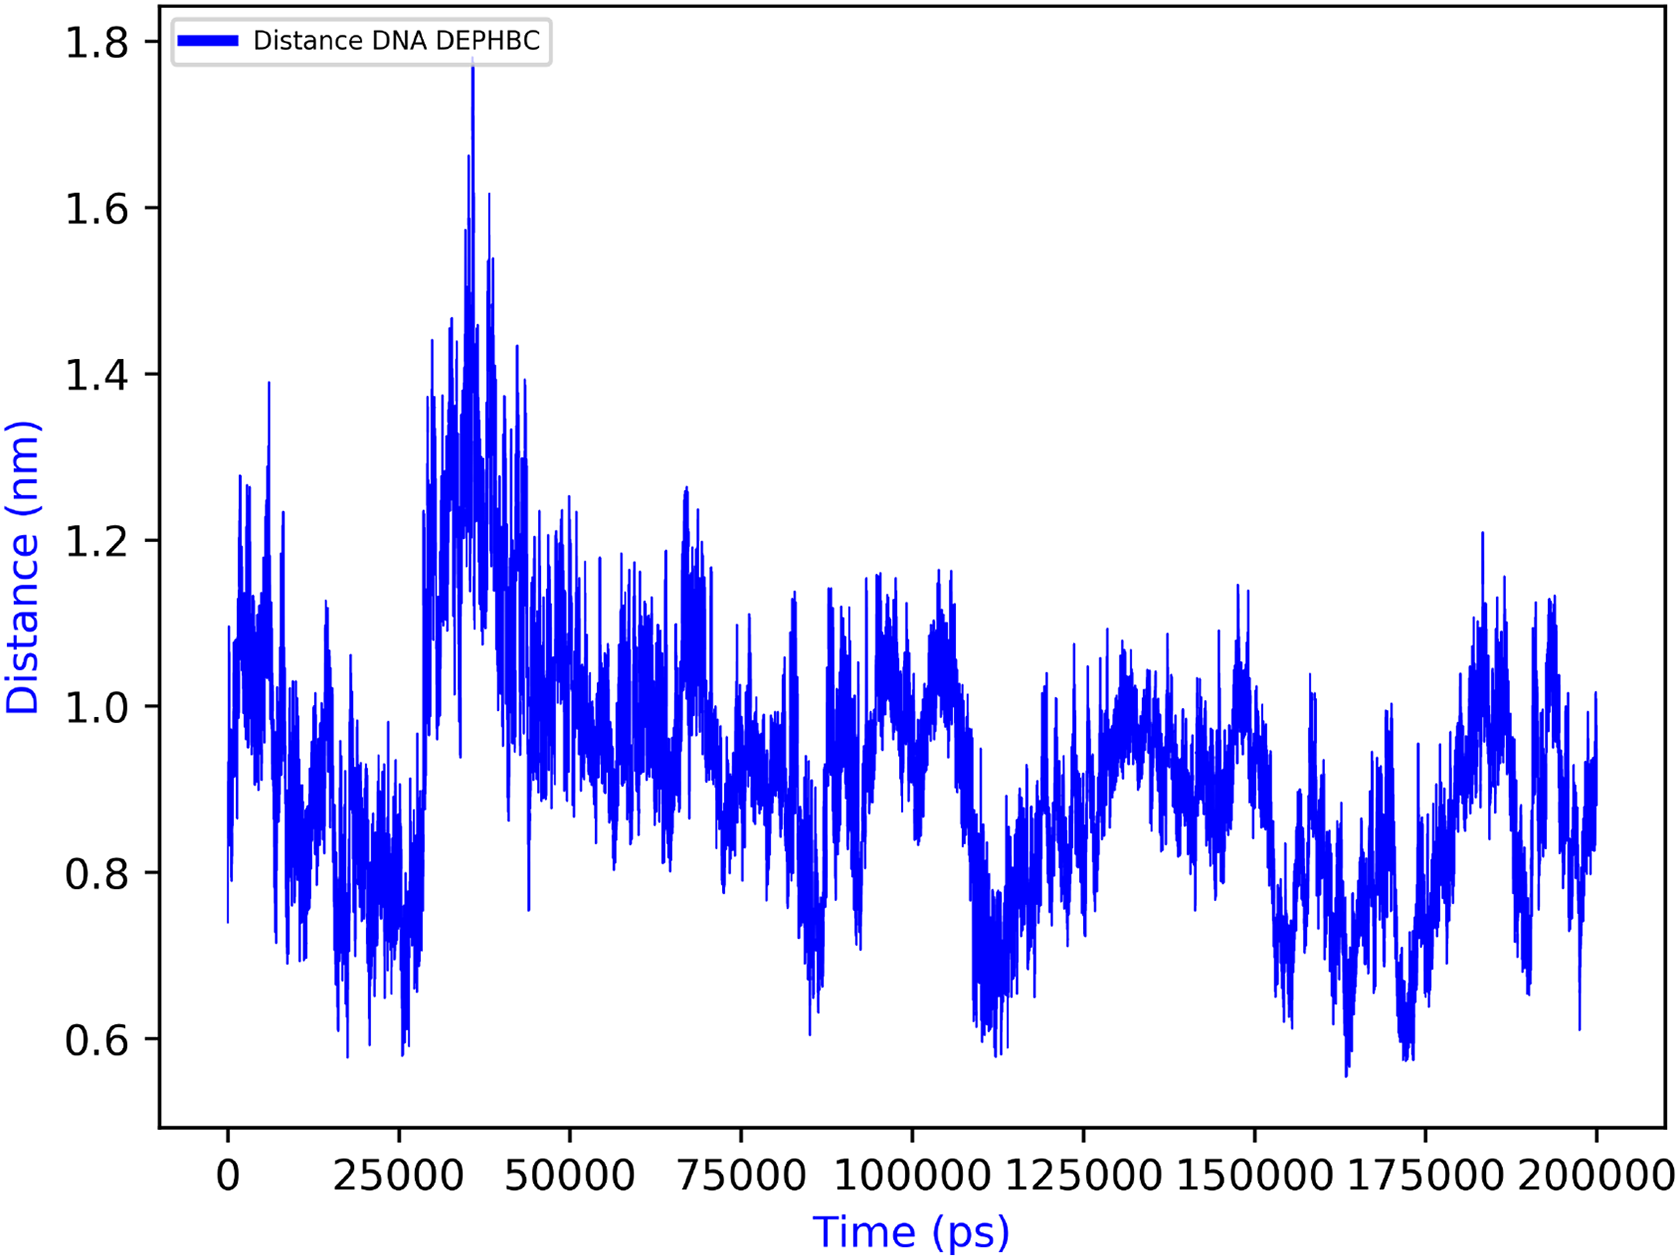
Average DNA (center of mass) to DEPHBC distance over time. DEPHBC: 2-(3,4-diethoxyphenyl)-3-hydroxy-4H-benzo[h]chromen-4-one.
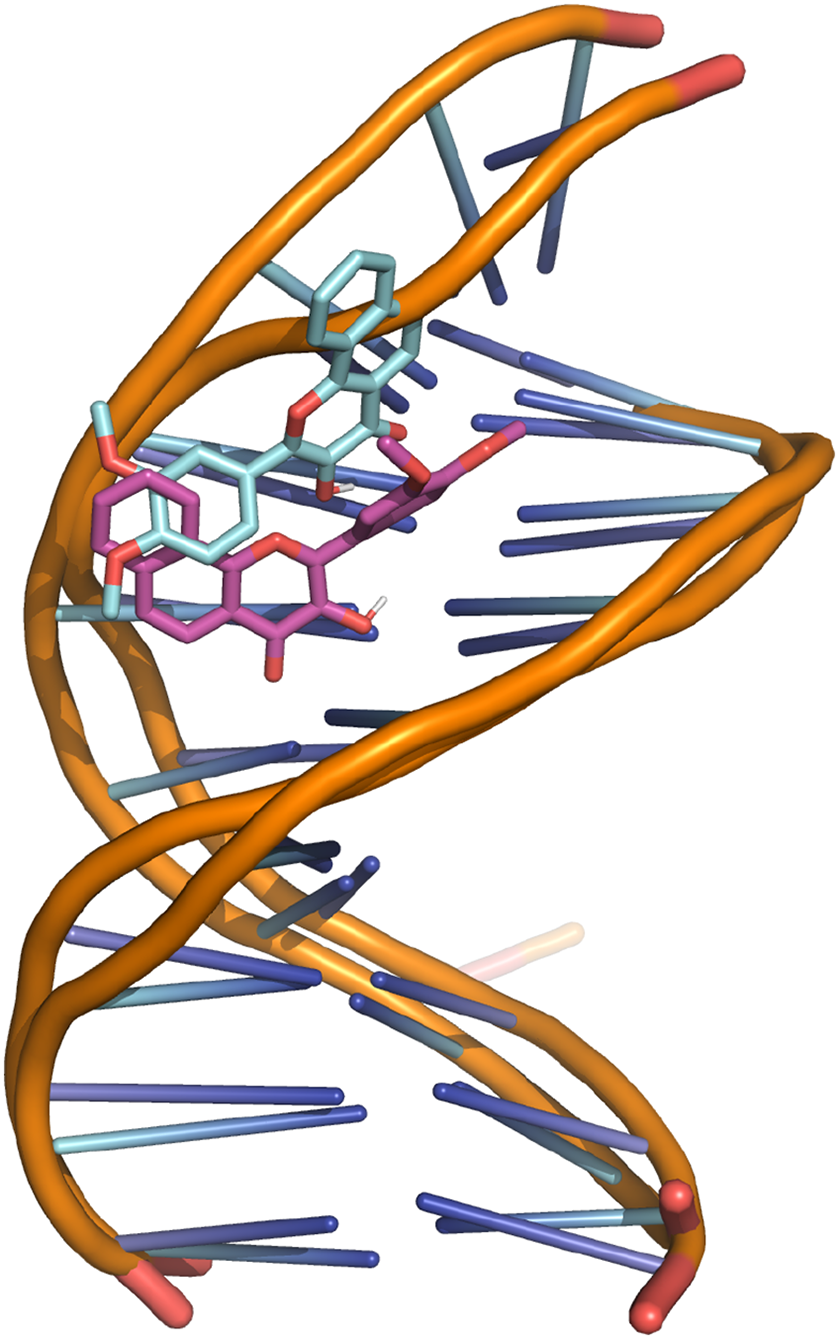
Superposition of the first and the last frame of the DNA-DEPHBC MD simulation. DEPHBC: 2-(3,4-diethoxyphenyl)-3-hydroxy-4H-benzo[h]chromen-4-one; MD: molecular dynamics.
6. Conclusions and future work
MD are computational tools that simulate the dynamical behavior of atoms and molecules. This simulation process is of paramount importance for several fields such as drug discovery, material simulation, and so on. However, the number of simulations and the computational horsepower required by them limit the success of MD techniques in real scenarios and the only solution is to scale to heterogeneous supercomputers comprised of CPUs and GPUs. This article shows that making use of a multi-tenant virtual GPU strategy is an effective way to enhance the overall throughput of GROMACS MD simulations. To that end, we have used the virtualized GPUs provided by the rCUDA middleware. rCUDA enables remote concurrent usage of CUDA-compatible GPUs and thus physical GPUs can be concurrently shared among several applications. This fact increases GPU occupancy by running several GROMACS instances at the same time. Furthermore, space cores in the system are devoted to run CPU-based GROMACS instances. Our results show that the use of rCUDA allows a speed-up over 1.21× while using the very same hardware resources. In addition, we apply our proposal to a system of biological relevance (DNA-DEPHBC) and validate it against previously obtained experimental results.
Future work includes widening this analysis with other data sets to verify the stability of the results. Other execution configurations should also be explored. For instance, instead of using single node simulations, spanning the execution of GROMACS to several cluster nodes should also be taken into account. Additionally, other GPU generations (such as the NVIDIA V100 GPU featuring more cores and more memory) should also be addressed to assess the feasibility of our proposal in recent cluster deployments. Finally, instead of making throughput projections, the actual performance of mixed GROMACS configurations should be investigated. Furthermore, according to our experience with the GROMACS simulations conducted in this study, energy consumption is probably lower when the multi-tenant virtual GPU strategy is leveraged. Thus, the exact energy requirements of such mixed configurations should also be analyzed. In this regard, if our intuition is confirmed, not only throughput would be increased but also total energy required to complete the MD simulations would be reduced.
Footnotes
Acknowledgments
The authors would like to thank NVIDIA for hardware donation under GPU Educational Center 2014–2016 and Research Center 2015–2016. They thank the CTE-POWER for providing computer resources and Barcelona Supercomputing Center – Centro Nacional de Supercomputaciòn (RES-BCV-2018-3-0008) for providing the technical support. They are also grateful to Mellanox Technologies Inc. for their generous support. They also acknowledge Professor Pradipta Purkayastha, from the Department of Chemical Sciences, Indian Institute of Science Education and Research (IISER) Kolkata, for kindly providing the initial ligand and DNA structures.
Declaration of conflicting interests
The author(s) declared no potential conflicts of interest with respect to the research, authorship, and/or publication of this article.
Funding
The author(s) disclosed receipt of the following financial support for the research, authorship, and/or publication of this article: This work was jointly supported by the Fundación Séneca (Agencia Regional de Ciencia y Tecnología, Región de Murcia) under grants (20524/PDC/18, 20813/PI/18, and 20988/PI/18) and by the Spanish MEC and European Commission FEDER under grants TIN2015-66972-C5-3-R, TIN2016-78799-P, and CTQ2017-87974-R (AEI/FEDER, UE). Researchers from the Universitat Politècnica de València are supported by the Generalitat Valenciana under grant PROMETEO/2017/077.