
Abstract
Forced-choice (FC) measures are becoming increasingly popular as an alternative to single-statement (SS) measures. However, to ensure the practical usefulness of an FC measure, it is crucial to address the tension between psychometric properties and faking resistance by balancing mixed keying and social desirability matching. It is currently unknown from an empirical perspective whether the two design criteria can be reconciled, and how they impact respondent reactions. By conducting a two-wave experimental design, we constructed four FC measures with varying degrees of mixed-keying and social desirability matching from the same statement pool and investigated their differences in terms of psychometric properties, faking resistance, and respondent reactions. Results showed that all FC measures demonstrated comparable reliability and induced similar respondent reactions. Forced-choice measures with stricter social desirability matching were more faking resistant, while FC measures with more mixed keyed blocks had higher convergent validity with the SS measure and displayed similar discriminant and criterion-related validity profiles as the SS benchmark. More importantly, we found that it is possible to strike a balance between social desirability matching and mixed keying, such that FC measures can have adequate psychometric properties and faking resistance. A seven-step recommendation and a tutorial based on the autoFC R package were provided to help readers construct their own FC measures.
The forced-choice (FC) format has regained popularity in recent years as an alternative to traditional single-statement (SS) format for several reasons. First, properly designed FC measures are substantially more faking-resistant than their SS counterparts (Cao & Drasgow, 2019). Second, compared to SS measures, personality scores derived from FC measures possess higher predictive validity for important work outcomes (Salgado et al., 2015; Speer et al., 2023). Third, FC measures by design are immune to a number of response biases plaguing SS measures, such as acquiescence, extreme responding, and midpoint responding (Schulte et al., 2021). Finally, recent development of freely accessible R packages for automatic test assembly (Li et al., 2022) and scoring (Bürkner, 2019; Zhang, Tu et al., 2023) lifted many technical barriers. It is not surprising that FC measures are receiving growing attention, especially from those concerned with applicant faking.
However, previous Monte Carlo simulation studies revealed a seeming tension between psychometric properties and faking-resistance (i.e., Brown & Maydeu-Olivares, 2011; Bürkner, 2022; Bürkner et al., 2019; Lee et al., 2022). On one hand, for the estimated latent trait scores to be reliable, the state-of-the-art FC scoring model requires mixed keying (Brown & Maydeu-Olivares, 2011), which refers to the inclusion of FC blocks with a mixture of both positively and negatively keyed statements. On the other hand, faking-resistance requires statements within a block to have similar levels of social desirability, which in most cases means that statements within a block can not be mixed keyed. How to strike a balance between mixed-keying and social desirability matching such that we can develop psychometrically sound and faking-resistant FC measures is one of the most urgent practical issues to be addressed in FC measurement. While simulation studies are informative for understanding the reliability of trait score estimates under fully controlled ideal conditions, they offer limited insights regarding the fakability of FC measures in real world, as this is an empirical question by nature. Therefore, we argue that it is critical to move beyond simulations and toward empirical studies to investigate the key question of how to strike a balance between mixed-keying and social desirability matching to produce psychometrically sound and faking-resistant FC measures.
Another often neglected aspect of FC measurement is respondent reactions, which are critical for respondent engagement, data quality, and recruitment success (Hausknecht et al., 2004). Although some previous examinations of respondent reactions toward FC measures have been conducted (Converse et al., 2008; Dalal et al., 2021; Sass et al., 2020; Zhang, Sun et al., 2020; Zhang, Luo et al., 2023), no evidence is available yet for the potential impact of mixed keying and social desirability matching on respondents’ reactions in both honest and motivated faking situations. Again, the question of respondent reactions is purely empirical in nature and thus requires empirical data to answer it.
Therefore, echoing the call for more research on developing psychometrically sound, faking-resistant, and user-friendly personnel selection tools (Van Iddekinge et al., 2023), this study seeks to provide the first piece of empirical evidence on how mixed-keying and social desirability matching may impact FC measures’ psychometric properties (i.e., reliability, convergent validity, discriminant validity, and criterion-related validity), fakability (i.e., rank-order stability and mean score inflation), and respondent reactions (i.e., general and selection-specific). Based on our empirical findings, we also provide a step-by-step recommendation on how to construct good FC measures in the Discussion section. While we do not conduct simulation studies to answer the focal empirical questions, we do appreciate the value of simulations for FC measure development, such as estimating the reliability of trait scores derived from FC measures in ideal conditions. Therefore, we updated the R package autoFC (Li et al., 2022) with several additional functions that users can easily use to run customized simulations, and an associated tutorial in the Online Supplementary Materials. Ultimately, we aim to contribute empirical knowledge and practical tools to the construction of high-quality FC measures.
A Brief Overview of FC Measurement
Noncognitive constructs such as personality and vocational interests have been playing increasingly important roles in organizational research and personnel selection, due to their sizeable predictive validity for important organizational outcomes (He et al., 2019; Nye et al., 2012) and their potential to reduce adverse impact (Cottrell et al., 2015; Jones et al., 2022). Thus, accurate assessment of these constructs has been of key interest. The SS format, which requires respondents to indicate to what extent they agree with each statement on a polytomous scale (e.g., 1 = “Strongly disagree”, …, 5 = “Strongly agree”), is no doubt the most widely adopted format to assess noncognitive constructs, due to the relative ease of scale development, administration, and scoring. However, scores derived from SS measures are often contaminated by various response biases and deliberate faking (Kreitchmann et al., 2019; Wetzel et al., 2021; Zhang, Cao et al., 2020), all of which will, at least to some degree, render such scores less valid for making between-person comparisons and predicting key workplace outcomes (Schulte et al., 2021).
To address the issues of response biases and faking in the SS format, the FC format was introduced as an alternative (Sisson, 1948). In an FC measure, individuals are presented with blocks, each containing at least two statements (“statements” in FC measures are the same as “items” in SS measures). Respondents are then asked to either (1) choose the statement(s) that are most and/or least descriptive (the MOLE format) of themselves or (2) rank all the statements in each block from the most descriptive to the least descriptive (the RANK format) of themselves (Cao & Drasgow, 2019). The number of statements per block is called block size, which is often constant within an FC measure and typically ranges from 2 to 5. A block is called unidimensional if the statements within that block measure the same latent trait, and multidimensional if the statements within that block measure different latent traits. Multidimensional blocks are more common than unidimensional ones. In Figure 1, we illustrated examples of multidimensional FC blocks.
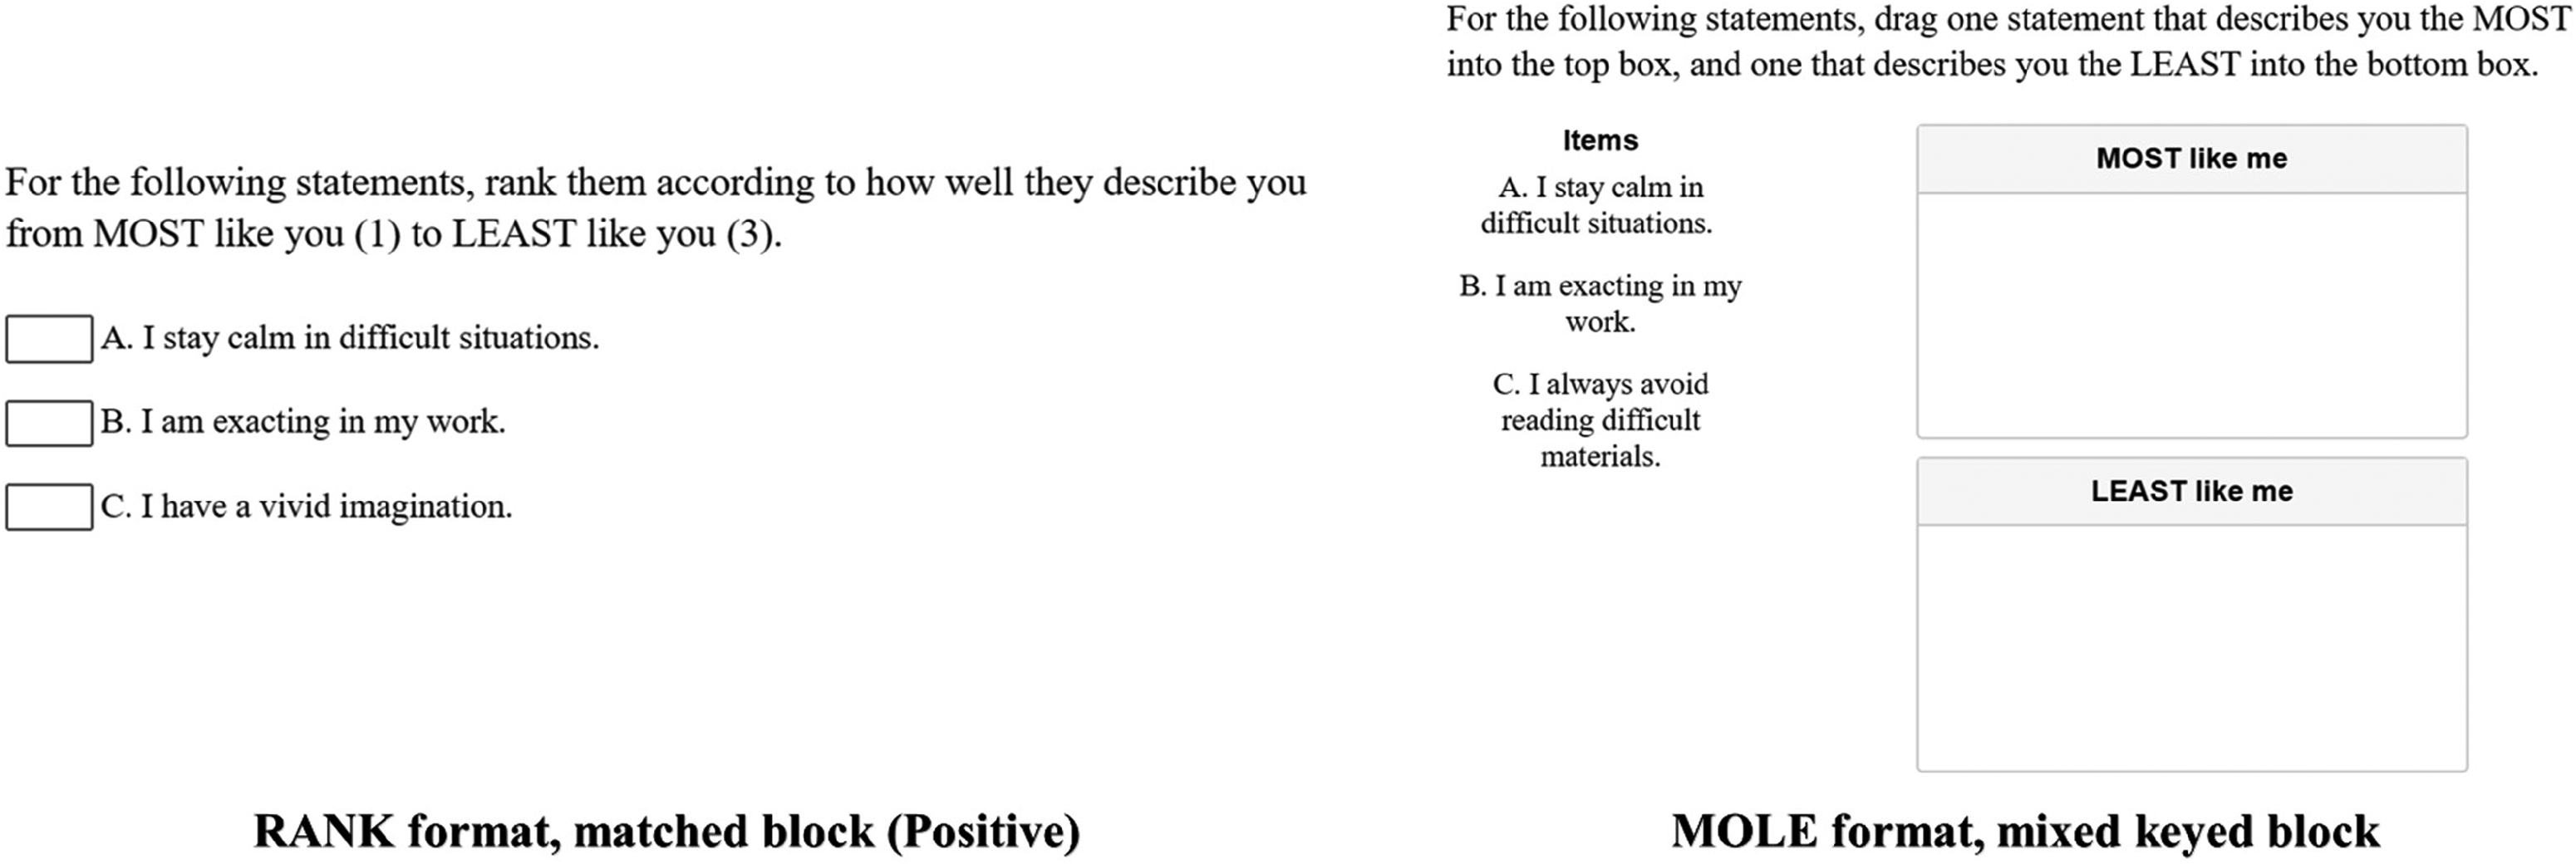
Examples of multidimensional forced-choice blocks.
When the block size n is greater than 2, responses to each block (e.g., Lily chose statement A as “the most like me,” statement B as “the least like me,” and left statement C in between; A > C > B) will be decomposed into n(n-1)/2 pseudo items representing dichotomous outcomes of all unique pairwise comparisons (e.g., AB = 1; AC = 1; BC = 0), each indicating whether the first statement in a pair is preferred to the second (outcome 1) or not (outcome 0). These pseudo items will serve as indicators of latent factors and will be subjected to the Thurstonian Item Response Theory (TIRT; Brown & Maydeu-Olivares, 2011) model, which is a special type of categorical confirmatory factor analysis model for estimating statement parameters and person scores. This explains why larger blocks are more psychometrically informative when everything else is held constant, as larger blocks mean more indicators for latent factors (e.g., responses to block sizes of 2, 3, 4, and 5 corresponds to 1, 3, 6, and 10 pseudo items, respectively, if full ranking is elicited).
Unlike SS measures where participants make an absolute judgment regarding their agreement with each statement, FC measures require respondents to decide which statement in the current block describes them relatively better than others. Even when all statements within a block describe them with similar accuracy in the absolute sense (e.g., “all the statements describe me accurately/inaccurately”), they are still required to make a relative choice. Given the “forced” nature of responding, FC measures are immune to response biases such as acquiescence, extreme responding, halo bias, and leniency bias by design (Schulte et al., 2021). If statements within blocks are further matched on social desirability, FC measures are also substantially more faking-resistant than their SS counterparts (Cao & Drasgow, 2019; Speer et al., 2023).
In sum, the removal of multiple response biases and the faking resistance potential has rendered the FC format a promising alternative to the SS format. However, one challenge in FC measures is that achieving good psychometric properties and faking resistance often seem incompatible with each other. Next, we will elaborate on the rationale for social desirability matching and mixed keying in constructing FC measures, followed by a discussion on why the two seem incompatible. We will further discuss why respondent reactions should be considered when developing FC measures.
Maintaining Faking Resistance by Matching Social Desirability
Many noncognitive measures include both positively and negatively keyed statements for better coverage of the construct continuum (Tay & Ng, 2018). In most cases, positively keyed statements (e.g., “I am hardworking”) are substantially more socially desirable than their negatively keyed counterparts (e.g., “I often come to work late”). Participants presented with these statements in the same FC block can often identify and choose the more desirable statement in motivated faking situations (Bürkner et al., 2019) regardless of whether it is truly more descriptive of them than others (Schulte et al., 2021). In this sense, this FC measure is said to be more fakable. Following previous practices (Cao & Drasgow, 2019; Hu & Connelly, 2021), we operationalized the fakability of a measure in two complimentary ways: (1) as the standardized mean score difference (Cohen's d) between latent trait scores obtained in faking versus honest conditions, and (2) as the rank-order stability of latent trait scores across faking and honest situations. A larger standardized mean score difference and a lower rank-order stability both indicate a higher level of fakability. To minimize the opportunities for faking in FC measures, statements within the same block need to be matched on social desirability (Cao & Drasgow, 2019). To achieve this goal, researchers first need to obtain the social desirability values of all statements. Next, an index of similarity for desirability values (and the corresponding cutoff) is determined for the statements to be paired within a block. More details on how to obtain social desirability values and how to use them for creating blocks are discussed in the Recommended Steps to Develop FC Measures section in the Discussion section.
Improving Psychometric Properties by Using Mixed Keying
Aside from fakability, a fundamental requirement for any FC measure is that the estimated trait scores are reliable and valid. However, Brown (2016) and Bürkner (2022) mathematically showed that latent trait scores estimated from the FC format will be unreliable if all blocks contain statements keyed in the same direction (all statements in a block have either positive or negative factor loadings). This is because equally keyed blocks provide little information regarding the sum of latent trait scores involved in these blocks, which is essential for recovering their absolute locations (Brown & Maydeu-Olivares, 2011; Schulte et al., 2021). More precisely, when holding other factors constant, the amount of information provided by a pair is positively related to the absolute difference between factor loadings of the two statements (Brown & Maydeu-Olivares, 2011; Bürkner, 2022) and will drop to zero if the two statements have identical factor loadings. Given that most statements have been selected to possess moderate to high factor loadings, if statements keyed in the same direction are put into the same block, their factor loading difference would be small and thus not psychometrically informative.
Indeed, many simulation studies have confirmed that FC measures with only equally keyed blocks suffered from various psychometric issues, including low model convergence rates, severely biased estimates of statement parameters, unreliable estimates of latent trait scores (Brown & Maydeu-Olivares, 2011), and biased estimates of inter-trait correlations (Bürkner et al., 2019; Schulte et al., 2021). One theoretical solution is to include a larger number of latent factors (e.g., 30) and/or a large number of statements per trait (e.g., 15) with high factor loadings (e.g., .80 or above) in one FC measure, which has been shown to be effective in simulation studies (Bürkner et al., 2019; Schulte et al., 2021) and empirical settings (Brown & Bartram, 2009). However, this solution is likely too demanding and most often impractical. The easiest and the most effective solution is to include a substantial number of mixed-keyed blocks that contain both positively and negatively keyed statements, as it is easier to maintain substantial factor loading difference when one loading is positive and another one is negative, and both are of moderate magnitude. Simulations have shown that FC measures including mixed-keyed blocks consistently outperformed those with only equally keyed blocks in terms of model convergence and parameter recovery accuracy (Brown & Maydeu-Olivares, 2011; Bürkner et al., 2019; Schulte et al., 2021).
Social Desirability Matching vs. Mixed Keying: A Dilemma?
As discussed above, both social desirability matching and mixed keying are important for different properties of FC measures. However, researchers would be placed into a dilemmatic position if they wish to follow both design criteria: on one hand, the faking resistance of an FC measure is based on social desirability matching that often requires equally keyed blocks; on the other hand, accurate score estimation requires a substantial number of mixed keyed blocks, which can be equivalent to social desirability mismatching because positively keyed statements are often more desirable than their negatively keyed counterparts. It seems that no matter which side we prioritize, the other side will suffer. This leads some researchers to conclude that it is impossible to simultaneously maintain good psychometric properties and faking resistance for an FC measure (Bürkner et al., 2019; Ng et al., 2021; Schulte et al., 2021).
While we agree that social desirability matching and mixed keying may conflict with each other on some occasions, we argue that it is still possible to find a sweet spot between the two criteria, such that we can develop FC measures that are both sufficiently faking-resistant and psychometrically sound. According to a recent simulation study (Lee et al., 2022), 20% mixed keyed blocks suffice to ensure reliable latent trait scores estimates, as long as the statements are reliable indicators of the latent factors. In addition, the marginal utility of more mixed keyed blocks for reliability gradually decreases and reaches a plateau when the proportion of mixed keyed blocks exceeds 60%, implying that too many mixed keyed blocks are unnecessary. These findings are important as they showed that including a small proportion of mixed-keyed blocks can substantially benefit the psychometric properties of an FC measure while at the same time presumably not affecting the fakability as severely as previously thought (an FC measure with 80% of its blocks matched on social desirability may still be fairly faking-resistant). It is possible to compromise slightly on both criteria to reach a sweet spot where both good enough psychometric properties and fakability are achieved. There is hope!
However, in pursuit of such a sweet spot, we must rely on empirical evidence from real human responses instead of simulations because faking is a complex psychological phenomenon, for which we do not yet have a satisfactory psychometric model. As such, even though Lee et al.'s. (2022) simulations provide benchmarks for satisfactory reliability, these simulation results tell us little about the degree to which different proportions of mixed-keyed blocks will impact the fakability of an FC measure. Aside from fakability, other important psychometric properties of a measure, such as criterion-related validity, can only be examined using empirical data collected from real human respondents as well. In fact, even previous simulation findings on the reliability of FC scores should also be subjected to empirical tests because all simulations studies are based on untested assumptions and if these assumptions do not hold empirically, findings may be untrustworthy. In sum, it is critical to move beyond simulation studies and use empirical data to investigate whether it is possible to balance social desirability matching and mixed keying, and ultimately, develop FC measures with good enough psychometric properties and faking-resistance.
Respondent Reactions to FC Measures
Another important but often neglected issue in developing FC measures is respondent reactions. Respondent reactions refer to respondents’ attitudes, affect, or cognitions related to the measurement tool (Hausknecht et al., 2004). Positive respondent reactions can elicit favorable impressions on employers from respondents’ perspectives, increase applicants’ intention to recommend the employer to other job seekers, and improve data quality through enhanced test motivation (Hausknecht et al., 2004; McCarthy et al., 2017; Sass et al., 2020).
However, studies examining how FC design features can impact respondent reactions are still lacking, except Dalal et al. (2021) and Fuechtenhans and Brown (2022). Although Dalal et al. (2021) examined how different FC designs impacted respondent reactions, their use of a computerized adaptive testing design (where each respondent was presented with different statements that best matched their latent trait levels) may confound the effect of different statements with the effect of design features. Moreover, in many scenarios, researchers and practitioners would use a static FC measure constructed from a small statement pool. It is thus critical to know how different pairing strategies will impact respondents’ reactions when holding the statement pool constant. Fuechtenhans and Brown (2022) used a qualitative study design to examine how statement matching would impact respondents’ experience with the FC format. They found that blocks with both desirable and undesirable statements are generally considered as easier and less cognitively demanding than blocks matched on social desirability. Although these findings are valuable, it is important to complement these findings with quantitative estimates from a rigorously designed experiment and provide a more comprehensive coverage of other aspects of respondent reactions (e.g., perceived fakability), which are still lacking in the current literature.
The Present Study
The present study seeks to empirically examine how different levels of social desirability matching and mixed keying influence the (1) psychometric properties of, (2) fakability of, and (3) respondent reactions to FC measures. Answers to these questions would not only complement previous simulation findings but also provide an evidence-based guide to the construction of reliable, valid, faking-resistant, and user-friendly FC measures. To achieve these goals, we constructed four different versions of FC measures based on the same set of statements (see Methods section below for details). To further facilitate the use of the FC format, we provided step-by-step recommendations on how to construct high-quality FC measures in Discussion. A tutorial written in R implementing each of these steps using the autoFC (Li et al., 2022) package is also provided in the Online Supplementary Materials.
Methods
Participants and Procedures
We conducted a two-wave study to examine the psychometric properties of, fakability of, and respondent reactions to four different FC measures with different design features while holding the statement pool constant. Respondents were recruited from the Prolific crowdsourcing platform. The study flow and demographic information in each group can be found in Figure 2. At Time 1 (honest condition), we aimed for 550 respondents per group, and a total of 2,187 respondents were eventually recruited, each paid $3 for participation. After consenting to proceed, participants first responded to demographic questions and were then presented randomly with one of the four FC measures. After this, they were immediately asked about their reactions to the FC measure, then followed by the SS measure. Finally, participants completed several criterion measures, which were presented in random order. For both FC and SS measures, participants were instructed to respond as honestly as possible. After excluding responses that failed more than one out of six quality control items, a total of 2,147 usable responses were retained.
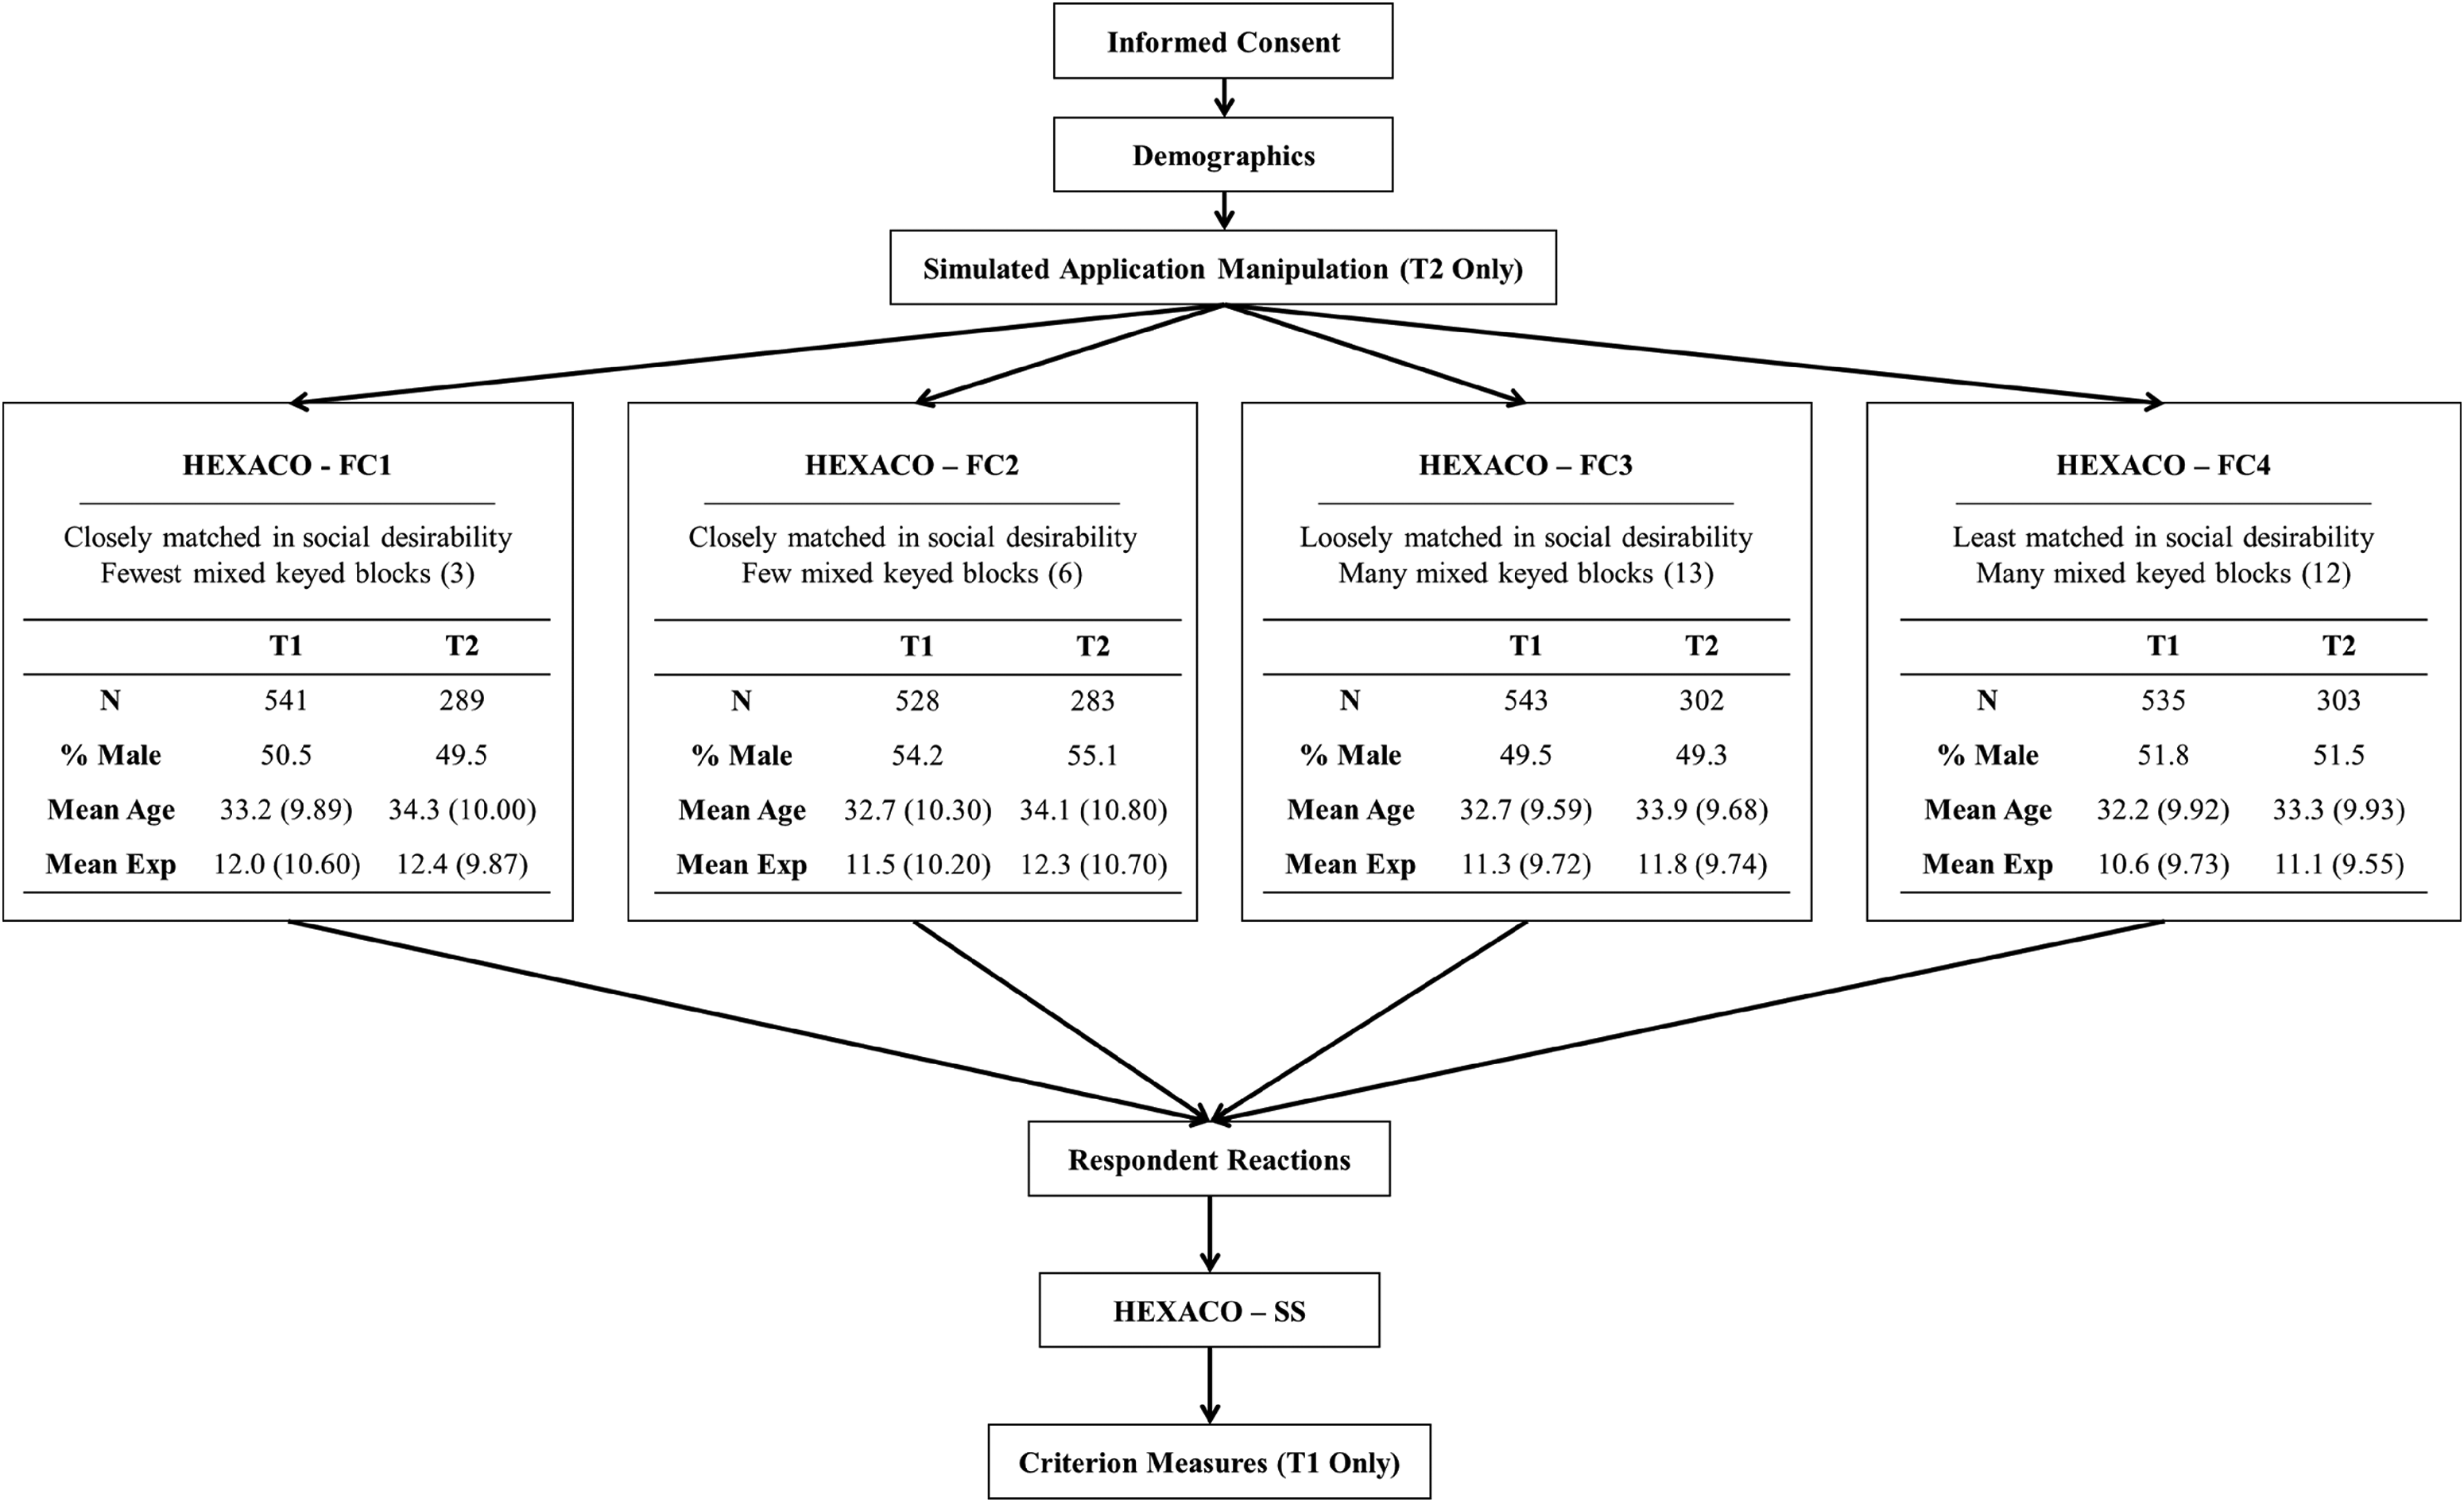
Study procedures.
Three months later (Time 2; fake-good condition), all participants who participated in Time 1 survey were invited to join a follow-up survey for a $2 reward. Similar to Time 1, participants consented to their participation and provided demographic information. However, before presenting the focal measures, we simulated a fake-good test situation where participants were instructed to respond as if they were applying for their dream job. To increase the fidelity of the simulation, we first asked respondents to write down names of their dream organizations and positions. They were then asked to use one or two sentences to explain why they wanted these positions. After the explanation, respondents were asked to imagine that their dream organizations were hiring and the organizations would use a personality test to decide who will be invited to fly to the headquarters for the final interview. To seize this opportunity, respondents were asked to try their best to get on the invitation list. Our decision of implementing a “faking for your dream job” scenario was based on two reasons. First, describing their most wanted positions from their dream organization can make the simulated scenario more personally relevant and can better represent a real job application situation where most respondents would apply for jobs they like. Second, instructing participants to fake for their dream jobs overcomes the limitations brought by differential ability and motivation to fake had they been asked to fake for a predetermined position (Fuechtenhans & Brown, 2022). Following the simulated job application scenario, participants were presented with the same FC personality measure they completed in Time 1. After the completion of the FC measure, participants again indicated their reactions toward the measure, and then responded to the SS personality measure. No criterion measures were presented in Time 2. A total of 1,177 responses were collected at Time 2, resulting in a response rate of 54.82%.
Measures
Demographics
Respondent self-reported their demographic information, including age, gender (1 = Female, 2 = Male, 3 = Nonbinary), education level (1 = Primary school, 2 = High school or equivalent, 3 = Some college or equivalent, 4 = Bachelor or equivalent, 5 = Master, 6 = PhD), and annual income before tax (1 = under $10,000, 2 = $10,000–$19,999, 3 = $20,000–$29,999, 4 = $30,000–$39,999, 5 = $40,000–$49,999, 6 = $50,000–$74,999, 7 = $75,000–$99,999, 8 = $100,000–$150,000, 9 = Over $150,000).
HEXACO-60_FC
In this study, we constructed FC measures based on the HEXACO-60 (Ashton & Lee, 2009) and used a triplet format. We chose 20 triplets because (1) we want the FC measures to be sensitive to manipulations, (2) we want to keep the survey to a reasonable length, and (3) 20 triplets for 5–6 latent factors are also quite common (e.g., Brown & Maydeu-Olivares, 2011; Lee et al., 2019; Walton et al., 2020; Wetzel & Frick, 2020). To develop triplet MFC HEXACO measures, we first obtained social desirability ratings (ranging from 1 to 5) for the 60 statements from Anglim et al. (2017). Specifically, social desirability ratings from the applicant sample in their study were used. We then constructed four different FC versions, each with 20 triplets consisting of three statements measuring different dimensions from HEXACO. We constructed these FC measures using an automatic item pairing R package, autoFC (Li et al., 2022). The design criteria for these four measures (also see Figure 2) were as follows: (1) For the first two FC measures (FC1 and FC2), statements within a triplet were matched by similar levels of social desirability. More specifically, we operationalized social desirability discrepancy as the maximum difference of social desirability among the three statements in a block and maintained the mean discrepancy across all 20 blocks as 0.34 (min = 0.05, max = 0.70) for FC1 and 0.37 (min = 0.13, max = 0.73) for FC2. The numbers of mixed keyed blocks for FC1 and FC2 were set to be 3 and 6, respectively. (2) For the remaining two FC measures (FC3 and FC4), the numbers of mixed keyed blocks were set to be 13 for FC3 and 12 for FC4 to represent cases with more mixed keyed blocks 1 . The mean discrepancy across 20 blocks was 0.86 (min = 0.13, max = 1.85) for FC3 and 1.09 (min = 0.48, max = 2.01) for FC4. (3) Across the four FC versions, we tried our best to ensure that each latent trait was paired with the other five traits for about an equal number of times (at least twice) while satisfying all previous constraints. Participants were required to select one statement describing them most, and another one describing them least from each block. Detailed block design for the four FC measures is presented in Table S1 in the Online Supplementary Materials.
In sum, FC1 and FC4 represent two realistic extremes of the compromise between social desirability matching and mixed keying. FC1 has the best match in terms of social desirability but has the fewest mixed-keyed blocks, while FC4 has the majority of blocks being mixed-keyed but is least matched on social desirability. The two FC measures in between (FC2 and FC3) represent attempts to strike a balance between mixed-keying and social desirability matching. Ideally, we would expect FC1 and FC2 to be more faking-resistant and FC3 and FC4 to be superior in measurement precision. By comparing FC1–FC2, we can examine the effect of increasing the number of mixed keyed blocks while maintaining the same degree of social desirability matching; By comparing FC3–FC4, we examine the effect of relaxing social desirability matching while maintaining a sufficient number of mixed keyed blocks. Finally, by comparing FC2–FC3, we can investigate the impact of different preferences for the balance between the two design criteria, in which FC2 favors better social desirability matching while FC3 favors more mixed keyed blocks. In sum, different comparisons between the four versions of FC can provide us with a holistic picture of the individual and joint impact of the two criteria.
HEXACO-60_SS
The same 60 statements from HEXACO-60 (Ashton & Lee, 2009) were also used as an SS Likert-type measure. Participants were instructed to indicate the extent to which each item described themselves on a 5-point rating scale. Items were randomly presented for each participant to reduce order effects. The SS measure served as an anchor to evaluate the psychometric properties of different FC measures.
Criterion measures
Details about criterion measures (e.g., reliability, length, rating scales) and their HEXACO correlates based on previous meta-analyses and large-sample primary studies are presented in Table 1. Full items can be found in the Online Supplementary Materials Section 4. Means, SDs, and reliabilities can be found in Table S2 in the Online Supplementary Materials.
Details about Criterion Measures and Respondent Reactions Measures.

Note. Number after each construct name indicates the number of items measuring that construct. OCB = Organizational citizenship behavior; CWB = Counterproductive work behavior; JP = Job performance; JS = Job satisfaction; BNT = Burnout; TI = Turnover intentions; ORG = Organizational status; CHAR = Charity behaviors; SWB = Subjective well-being; FS = Financial Security; PHQ = Physical health; NARC = Narcissism; MACH = Machiavellianism; PSYCH = Psychopathy; H = Honesty-Humility; E = Emotionality; X = Extraversion; A = Agreeableness; C = Conscientiousness; O = Openness. For the “Theoretical HEXACO Correlates” column, A “(+)” notation indicates evidence for a positive association between the personality trait and the corresponding criterion variable, with an absolute magnitude of ≥.10. A “(-)” notation indicates evidence for a negative association between the personality trait and the corresponding criterion variable, with an absolute magnitude of ≥.10. A “(/)” notation indicates the association between the personality trait and the corresponding criterion variable is small with a magnitude < .10 (regardless of direction). Also for the “Theoretical HEXACO Correlates” column, notation not in italics represents evidence from a published meta-analysis, while italics represent evidence from a primary study. Reliabilities for Exerted Effort, Exhaustion, and Energy Level are not available as these variables were measured by only one item.
Respondent reactions
Respondent reaction measures at Time 1 focused on general perceptions of the FC measures, while those at Time 2 were tailored to the job application context. Items were adapted from previous studies (Chan et al., 1998; Dalal et al., 2021; Harris et al., 2021; Highhouse et al., 2003; Lopez et al., 2019; Macan et al., 1994; Smither et al., 1993; Tonidandel et al., 2002; Zhang, Luo et al., 2023) and self-developed. Assessed facets and example items can be found in Table 1. Complete items can be found in Section 4 of the Online Supplementary Materials.
Quality control items
Six quality control items were embedded, with five in the Likert measures and one in the FC measure. For items embedded in Likert measures, respondents were instructed to endorse a particular response option (e.g., strongly disagree). The quality control block in the FC measure required participants to select the first statement from the block as “most like me” and the second statement as “least like me.” In all subsequent analyses, we screened out respondents who missed more than one quality control item.
Scoring
All four FC measures were scored using the TIRT model (Brown & Maydeu-Olivares, 2011) with the R package thurstonianIRT (version 0.12.1; Bürkner, 2019). Specifically, we used the Markov chain Monte Carlo approach with default diffuse priors to estimate the TIRT model. The TIRT model converged well for the four versions with the largest potential scale reduction factor (R hat) being less than 1.10. As the SS version of the HEXACO scales was identical across the four groups, we pooled their responses together and scored them by the Multidimensional Graded Response Model (Samejima, 1997) using the R package mirt (version 1.33.2; Chalmers, 2012) with the estimator based on Cai's (2010) Metropolis-Hastings Robbins-Monro algorithm 2 . To ensure comparability across time, Time 2 responses were scored by fixing statement parameters to those obtained at Time 1. Maximum a posteriori estimates were obtained for both FC and SS personality measures. For the sake of simplicity, criterion and all other measures were scored using sum scores after reverse coding. For transparency, all data and analysis scripts were made available on the Open Science Framework: https://osf.io/yvpz3/?view_only = 08601755f471440b80973194571b60bd.
Results Reporting
For psychometric properties, we reported (a) empirical reliability, computed as
Results
Psychometric Properties
Reliability
As shown in Table 2, the empirical reliabilities of all six traits for the four FC measures were at least marginally acceptable (>.63). Also, the reliabilities of all four FC measures were consistently lower than those of the SS measure (FC: average reliabilities across traits ranging from .69 to .73 at Time 1 and .67 to .71 at Time 2; SS: average reliabilities across traits equal to .84 at Time 1 and Time 2), regardless of the FC design features or the measurement contexts. Furthermore, for all four FC measures, reliability estimates at Time 2 (fake-good condition) were slightly lower than those at Time 1 (honest condition). Comparing the reliability estimates of each individual factor across different FC measures, the differences were mostly small (less than .10). Notable exceptions were (1) Extraversion between FC1 and the other three FC measures, where the reliability for FC1 was .13 lower than FC2, .10 lower than FC3, and .14 lower than FC4 at Time 1, while .10 lower than FC2 at Time 2, and (2) Conscientiousness between FC3 and FC4, where the reliability for FC3 was .10 lower at Time 1. Overall, results from Table 2 showed that the impact of the extent of social desirability matching and mixed keying on FC reliability was limited as long as there were at least three mixed triplets. In addition, empirical reliability did not seem to be substantially compromised even if participants were motivated to fake their responses. Readers interested in the standard error of measurement for each person score against their estimated latent trait levels can refer to Figures S1 and S2 in the Online Supplementary Materials.
FC and SS Empirical Reliability.
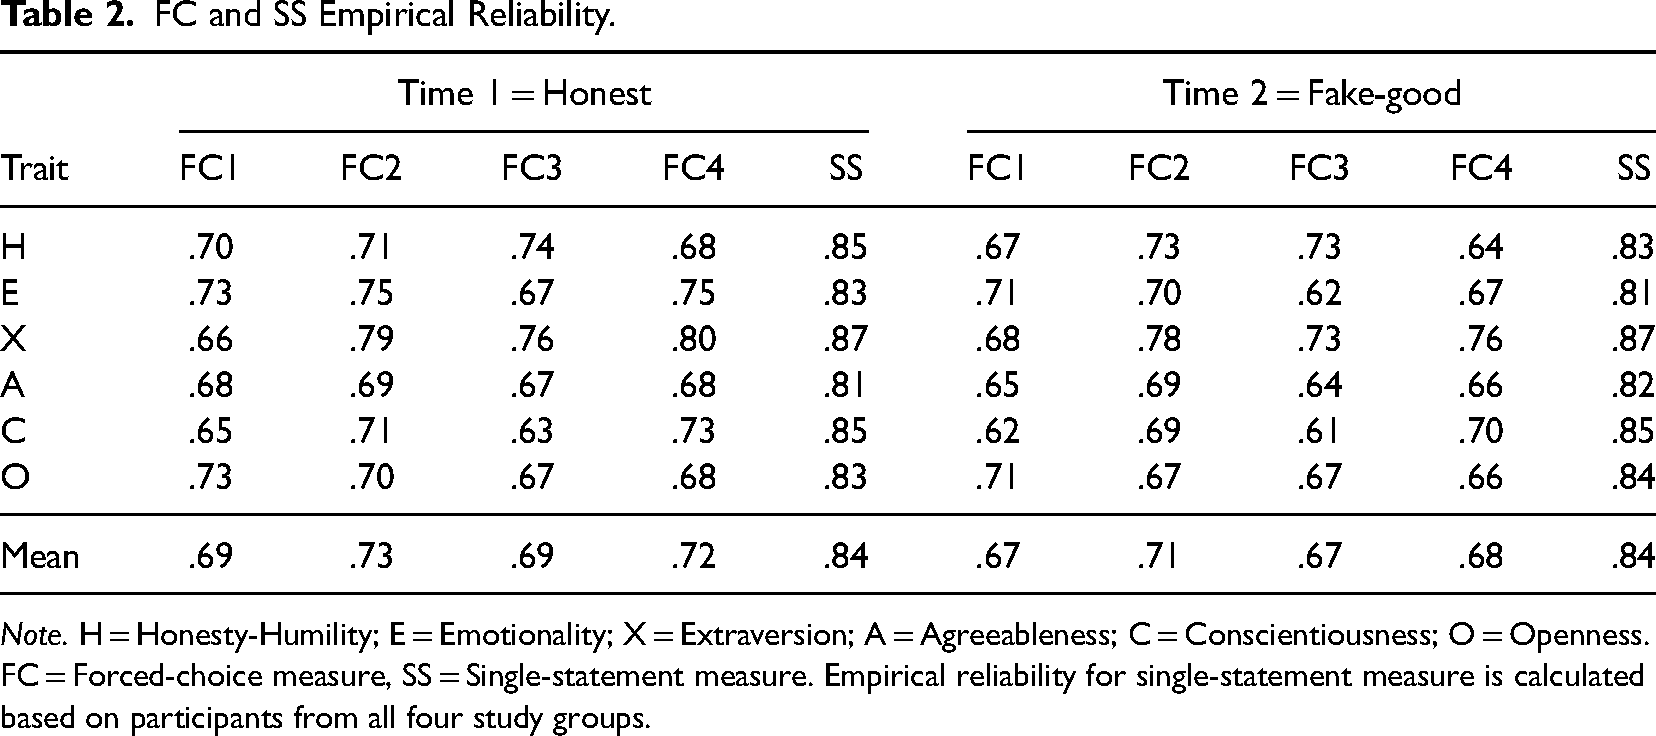
Note. H = Honesty-Humility; E = Emotionality; X = Extraversion; A = Agreeableness; C = Conscientiousness; O = Openness. FC = Forced-choice measure, SS = Single-statement measure. Empirical reliability for single-statement measure is calculated based on participants from all four study groups.
Convergent validity
Table 3 shows the raw and corrected (for unreliability) convergent validity of all four FC measures with their SS counterpart. To control for the confounding effect of different reliabilities, we interpret the corrected convergent validities. At Time 1, the average correlation between trait scores measured with FC and SS measures was substantially lower for FC1 (but still large in magnitude; M = .81, min = .59, max = 1.00) while the other three versions had very similar and higher convergent validity (FC2: M = .91, min = .79, max = 1.00; FC3: M = .94, min = .88, max = 1.00; FC4: M = .94, min = .85, max = 1.00). This pattern suggests that although the construct validity of all four FC measures was properly retained, FC2–FC4 still fared better than FC1. At Time 2, the convergent validity dropped substantially (FC1: M = .71, min = .53, max = .84; FC2: M = .73, min = .55, max = .84; FC3: M = .79, min = .74, max = .93; FC4: M = .79, min = .73, max = .89). Noticeably, convergent validity for some traits in FC1 and FC2 was substantially worse than that in FC3 or FC4, particularly for Conscientiousness (.53 and .55 for FC1 and FC2 vs. .74 for FC3 and FC4). However, we note that the lower convergent validity with SS scores at Time 2 was likely because SS scores were substantially distorted due to faking.
FC and SS Convergent Validity.
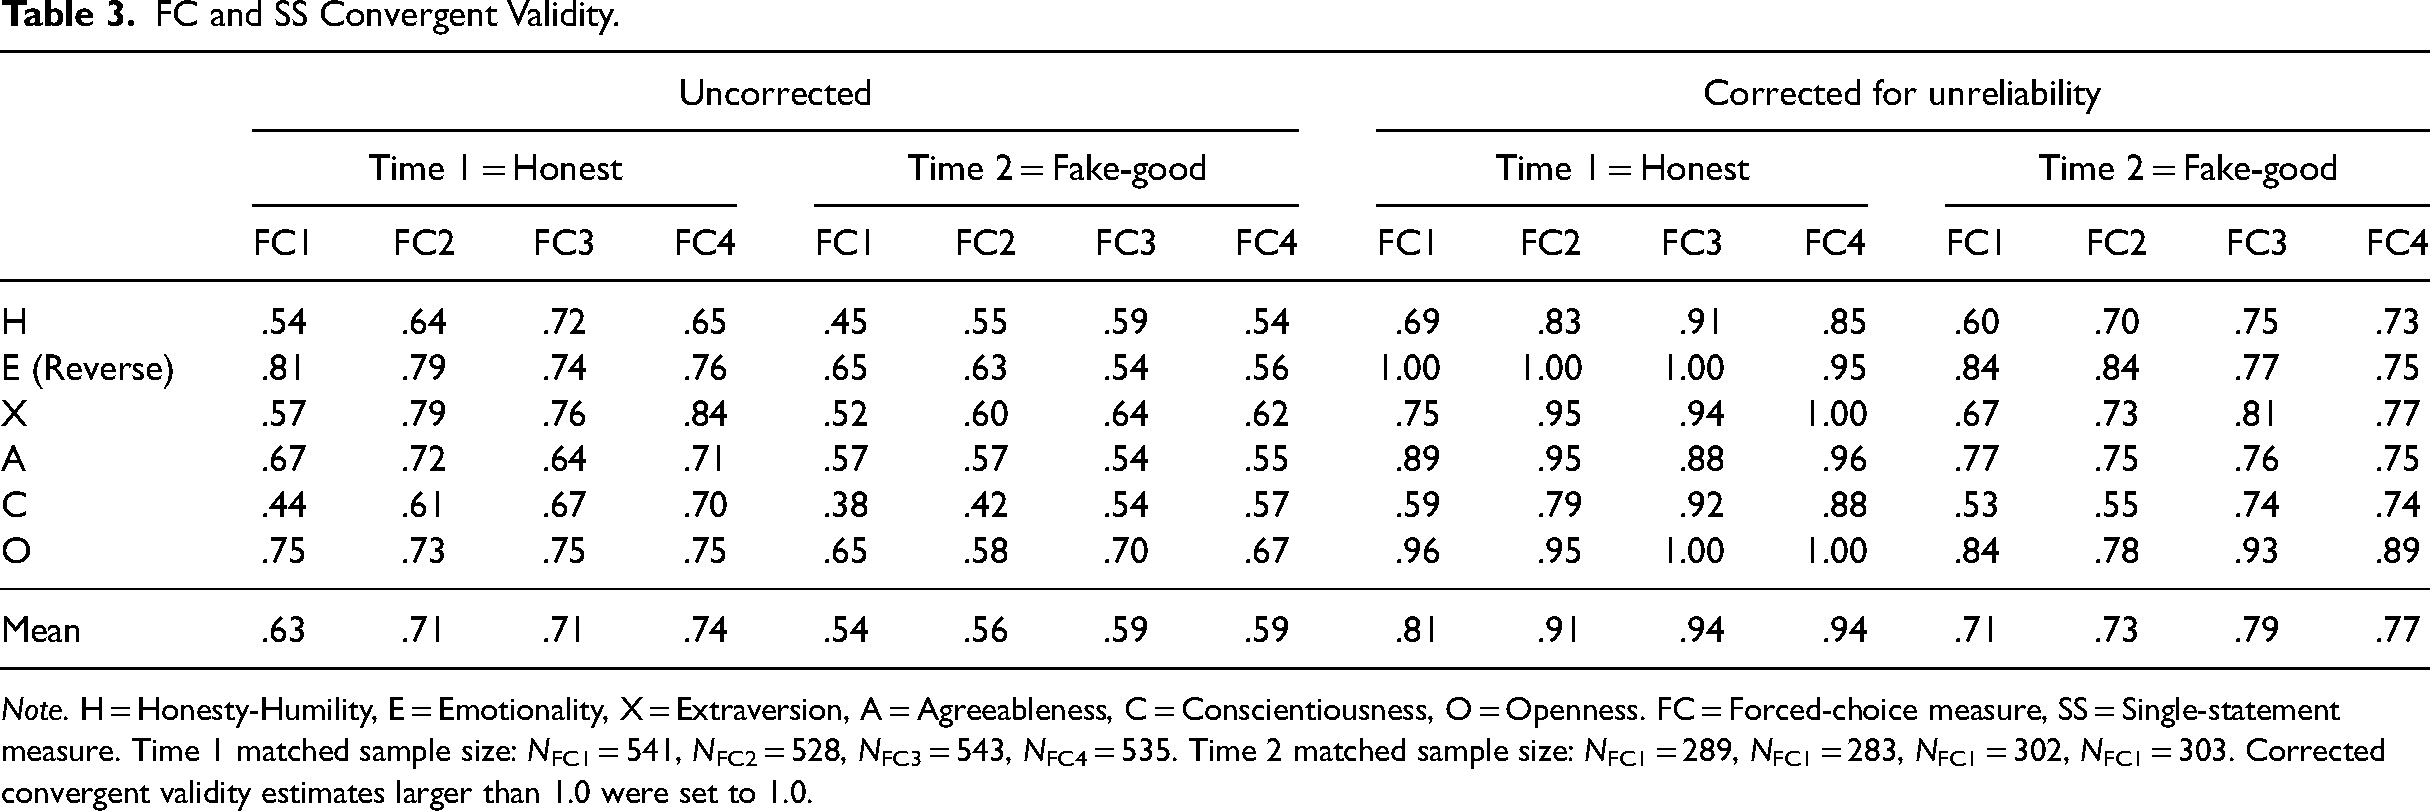
Note. H = Honesty-Humility, E = Emotionality, X = Extraversion, A = Agreeableness, C = Conscientiousness, O = Openness. FC = Forced-choice measure, SS = Single-statement measure. Time 1 matched sample size: NFC1 = 541, NFC2 = 528, NFC3 = 543, NFC4 = 535. Time 2 matched sample size: NFC1 = 289, NFC1 = 283, NFC1 = 302, NFC1 = 303. Corrected convergent validity estimates larger than 1.0 were set to 1.0.
Discriminant validity
In Table 4, we reported the model-based latent correlations among the six traits for FC1–FC4 and SS. As we scored Time 2 responses by fixing model parameters obtained from Time 1 instead of separately estimating a model for each format at Time 2, we only reported discriminant validity information for Time 1. Overall, FC2, FC3, and FC4 demonstrated similarly moderate ICC with those estimated from SS (ICCs = .71, .67, and .64), while the trait intercorrelations for FC1 were vastly different from those found in SS, as shown by the low ICC (.17). For example, the correlations for Emotionality with Honesty-Humility and Extraversion were .06 and −.34, respectively, for SS but were .36 and −.03 for FC1. These results suggested that FC1 demonstrated substantially lower construct validity in terms of the intercorrelations between the traits. Besides those point estimates, the standard errors of discriminant validity estimates of FC1 (M = .078) were also about 10% to 20% higher than those for FC2–FC4 (M = .064, .070, and .068).
Discriminant Validity at Time 1.
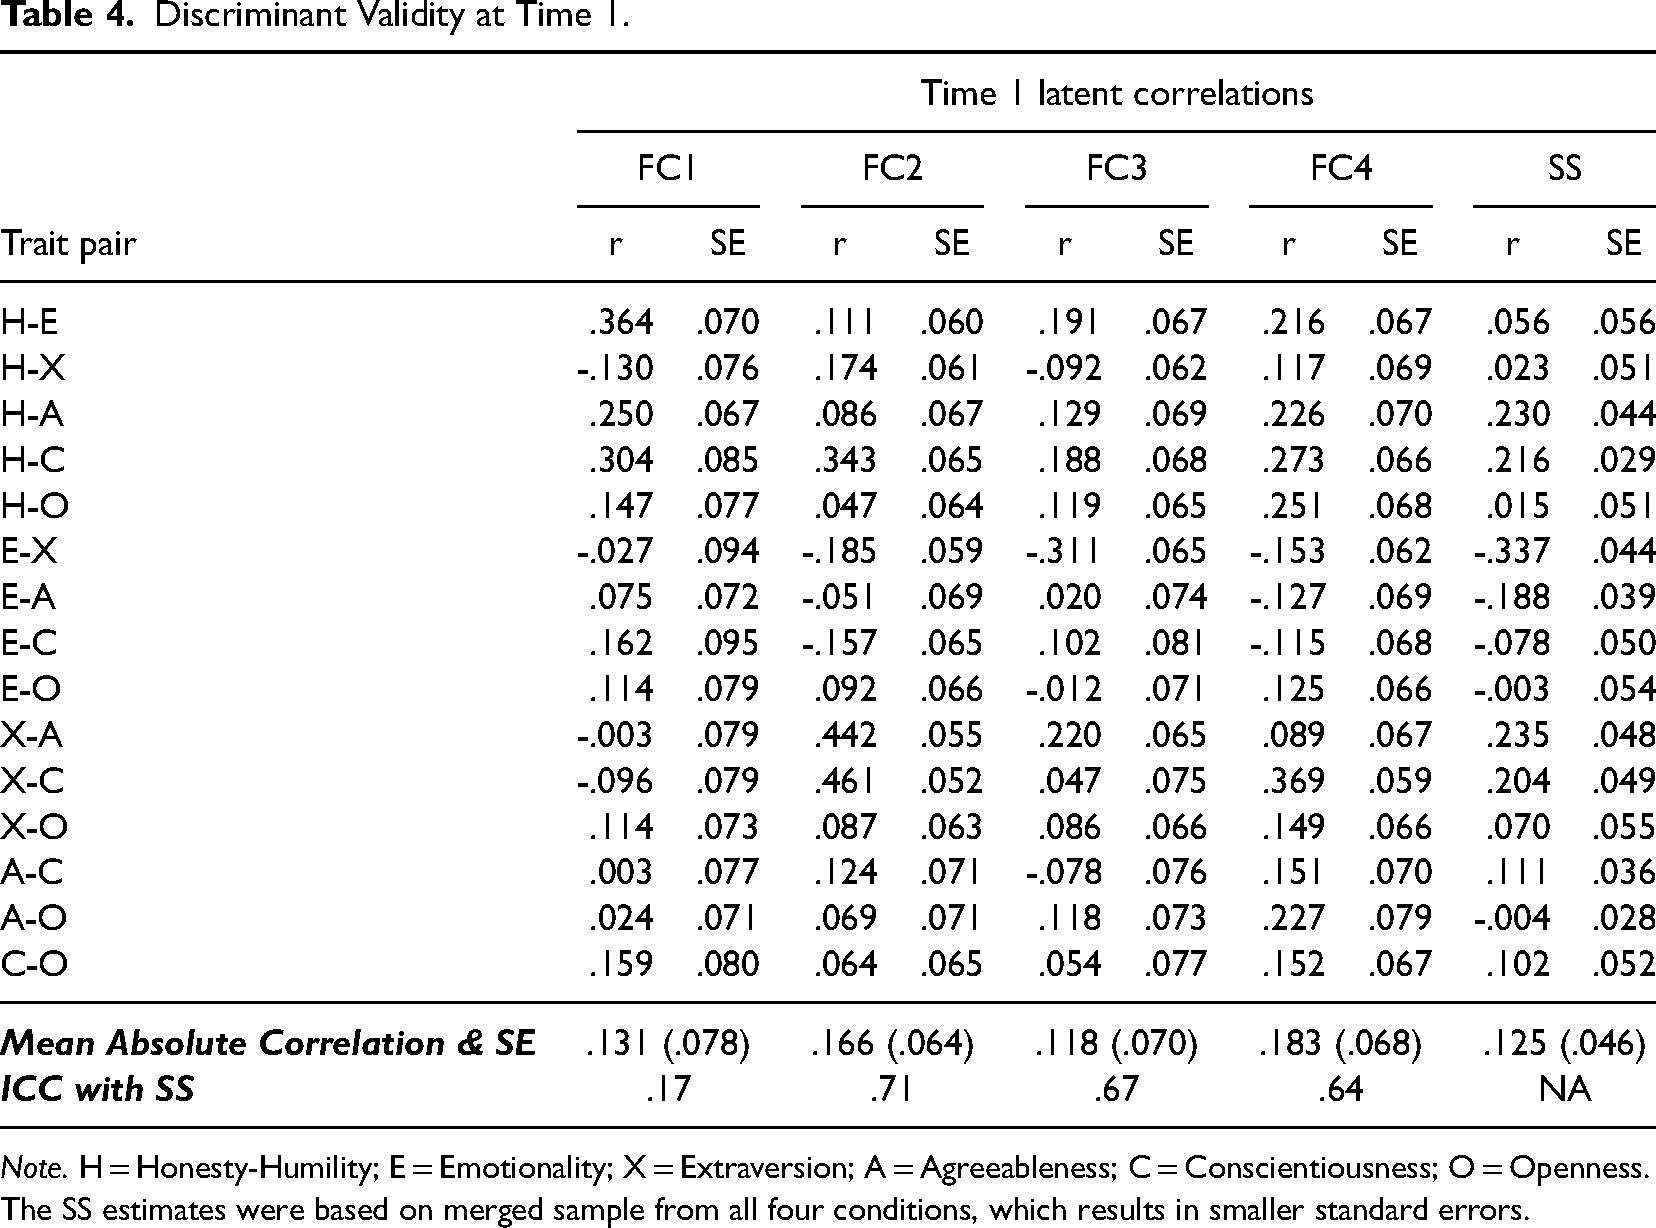
Note. H = Honesty-Humility; E = Emotionality; X = Extraversion; A = Agreeableness; C = Conscientiousness; O = Openness. The SS estimates were based on merged sample from all four conditions, which results in smaller standard errors.
Criterion-related validity
Table 5 presents the double-entry ICC between the validity profiles of each FC and the SS measure after correcting for unreliability of personality scores (see Table S4 and Table S5 in the Online Supplementary Materials for full corrected and raw correlations). A correction was conducted on these correlations to control for differential reliabilities for FC and SS measures. ICC for each factor and across all HEXACO factors were reported. Generally speaking, FC1 was the least similar to the SS in terms of criterion-related validity (ICC = .54) and FC4 was the most similar (ICC = .96). FC2 and FC3 also had similar validity profiles as the SS (ICCs = .83 and .77 for FC2 and FC3). When examined trait by trait, the patterns are also consistent with those revealed by the overall ICCs. Specifically, FC1 displayed validity profiles that were the least similar to the SS (double entry ICCs = −.04, .08, and .23 for Conscientiousness, Openness, and Honesty-Humility). In contrast, FC4 consistently demonstrated the highest resemblance to the SS for all personality traits. We also observed some trait specificity beyond the general pattern. For example, the validity profiles of Emotionality for FC1, FC2, and FC4 were highly similar to those of the SS (ICCs ranging from .94 to .97), while the ICC for FC3 Emotionality was somehow lower (ICC = .79). Additionally, the ICCs for Openness were consistently among the lower end of the six traits across the four FC measures (ICCs = .08 .40, .66, and .68 for FC1–FC4), which was likely to be an artifact due to range restriction because openness correlated weakly with all criteria.
R2 of HEXACO Trait Scores Predicting Criterion Variables and Double Entry ICCs of Validity Profile between FC and SS Measures, Corrected for Unreliability of Personality Scores.
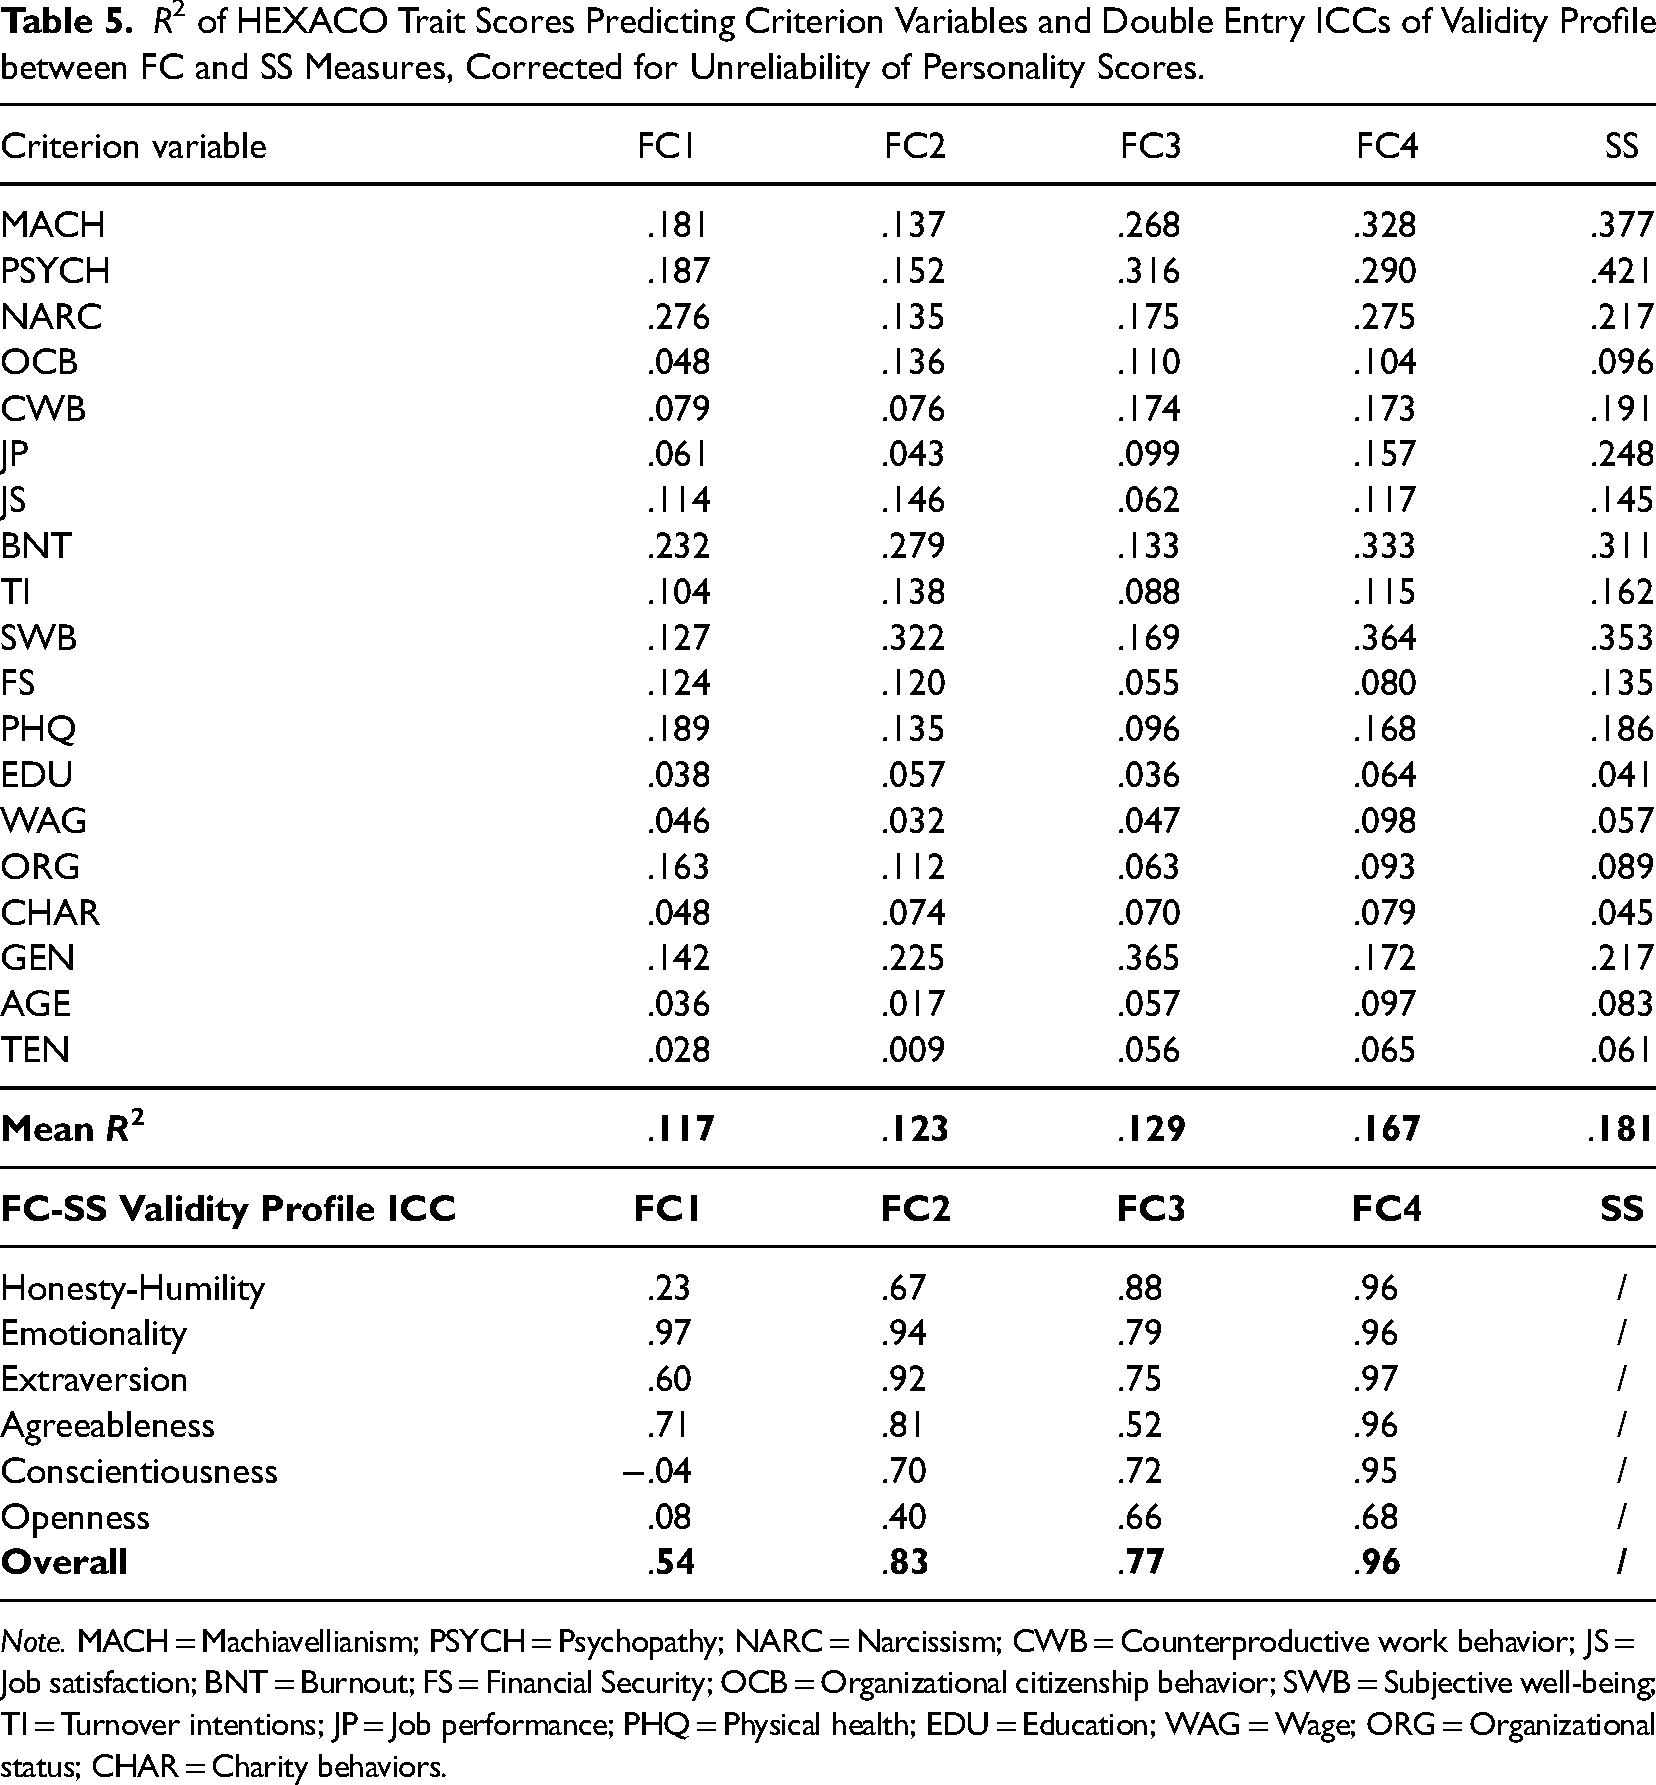
Note. MACH = Machiavellianism; PSYCH = Psychopathy; NARC = Narcissism; CWB = Counterproductive work behavior; JS = Job satisfaction; BNT = Burnout; FS = Financial Security; OCB = Organizational citizenship behavior; SWB = Subjective well-being; TI = Turnover intentions; JP = Job performance; PHQ = Physical health; EDU = Education; WAG = Wage; ORG = Organizational status; CHAR = Charity behaviors.
We also presented the R2 of all six personality traits predicting each criterion variable in Table 5. Averaging across all criterion variables, FC4 demonstrated the highest average R2 (.167) among the four FC measures, which was also close to the one produced by SS (.181). This was followed by FC3 (.129) and FC2 (.123), while FC1 had the lowest average R2 (.117). If we further differentiate criterion variables that were subjectively assessed by Likert-type measures (e.g., dark personality, OCB, and CWB) from more objectively reported criterion variables (e.g., education, wages), we can see that the SS measure displayed superiority over the FC measures in predicting the former (average R2s were .144, .152, .145, .209, and .237 for FC1, FC2, FC3, FC4, and SS) but showed no advantages at all in predicting the latter (average R2s were .072, .075, .099, .095, and .085 for FC1, FC2, FC3, FC4, and SS). Overall, these results showed that the criterion-related validity for FC4 was the best, while for FC1, it was the worst.
Fakability
Rank-order stability
Raw and corrected correlations between the same personality trait scores obtained in both honest and fake-good conditions are presented in Table 6. To control for the confounding effect of reliability differences, we focused on corrected rank-order stability. A more faking-resistant measure should be better at preserving respondents’ rank orders across honest and fake-good conditions. As expected, FC1 was the most faking-resistant (M = .81, min = .72, max = .95), and FC4 was the least faking-resistant (M = .71, min = .54, max = .90). All FC measures except FC4 were more faking-resistant than the SS measure (M = .72, min = .62, max = .89). Averaged across measures, Conscientiousness appeared to be most susceptible to faking, while Openness consistently showed the lowest susceptibility to faking. Correlations between Time 1 SS scores and Time 2 FC scores can be found in Table S7.
Rank-Order Stability and Mean Score Differences.
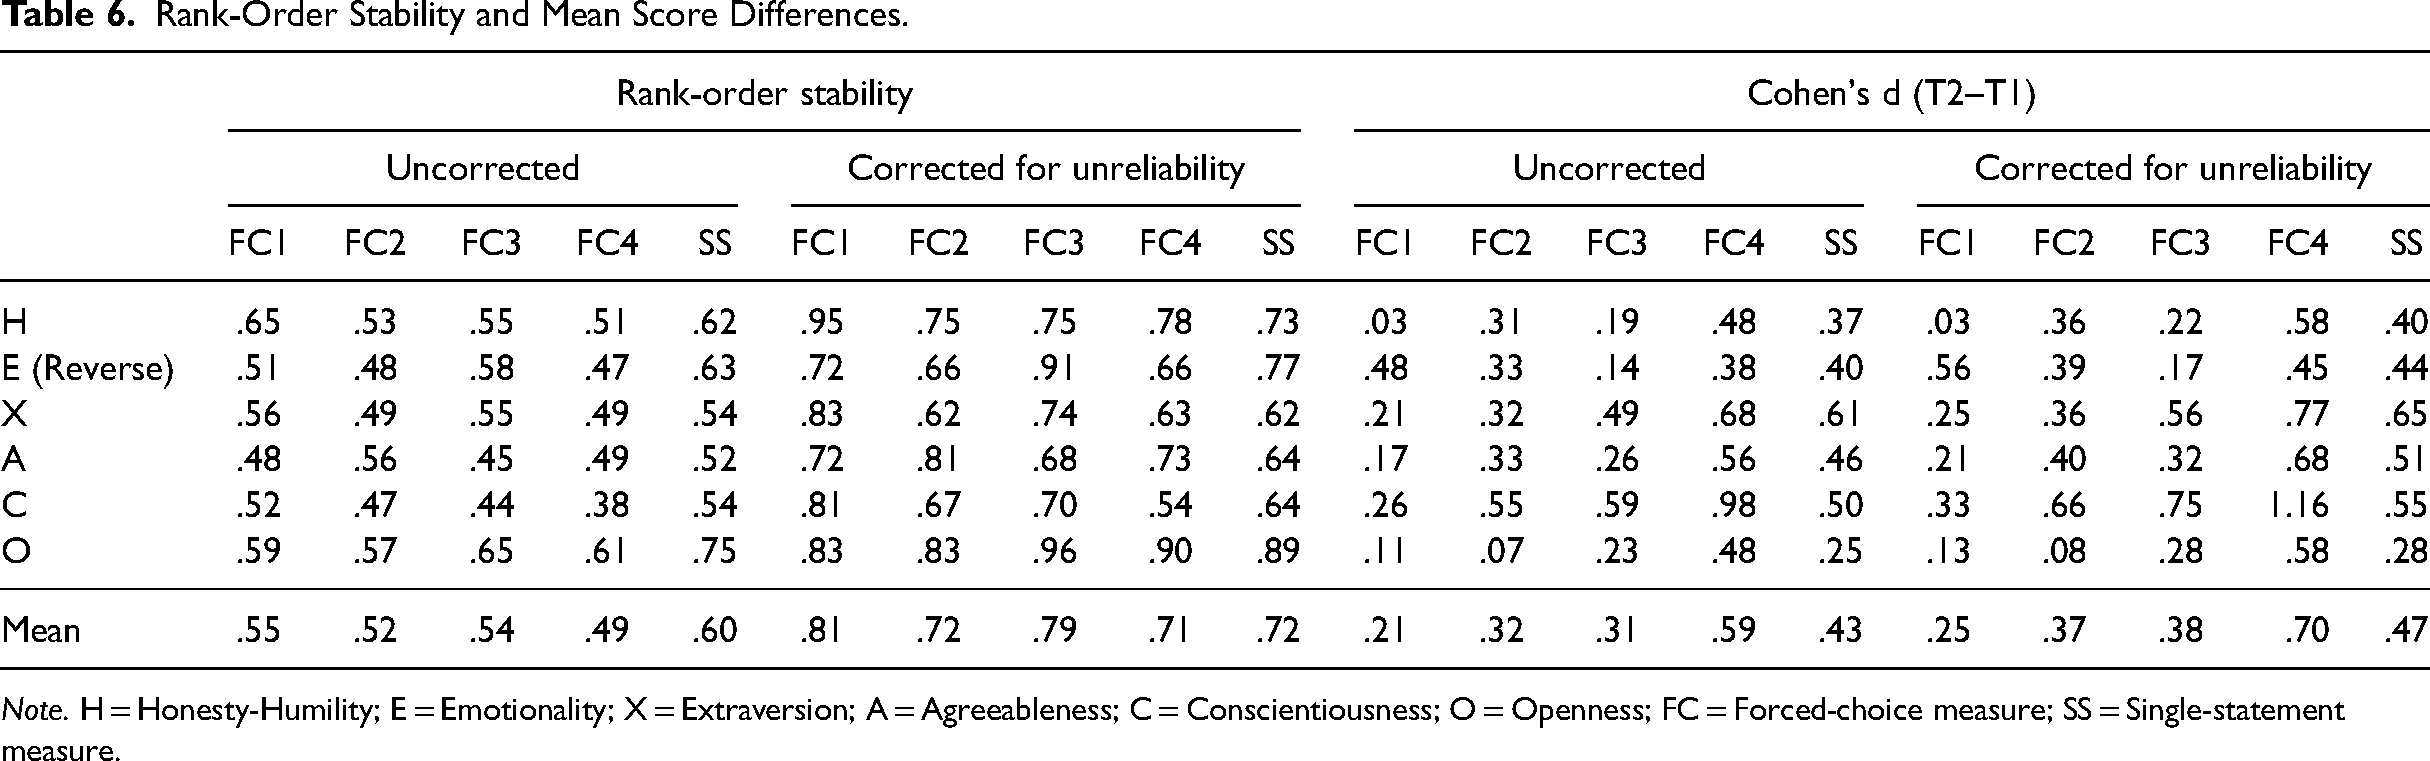
Note. H = Honesty-Humility; E = Emotionality; X = Extraversion; A = Agreeableness; C = Conscientiousness; O = Openness; FC = Forced-choice measure; SS = Single-statement measure.
Mean score inflation
Raw and corrected (using formulas from Wiernik & Dahlke, 2020) standardized mean score differences (Cohen's d) between the honest and fake-good conditions can also be found in Table 6. Again, we focused on corrected effect sizes to account for the confounding effect of reliability differences. A more faking-resistant test should have smaller mean score inflation. As expected, FC1 was the most faking-resistant (M = 0.25, min = 0.03, max = 0.56), and FC4 was the least faking-resistant (M = 0.70, min = 0.45, max = 1.16). FC2 and FC3 were in between and performed very similarly (FC2: M = 0.37, min = 0.08, max = 0.66; FC3: M = 0.38, min = 0.17, max = 0.75) but showed differential faking effects across traits. For example, participants seemed to inflate their scores more easily on Honesty-Humility and Emotionality in FC2, while the same trend was observed for Extraversion and Openness in FC3. Inspections by trait yielded the same conclusion as when examining rank-order stability: averaged across FC measures, Conscientiousness consistently showed the highest susceptibility to faking, while Openness consistently exhibited the lowest susceptibility. Interestingly, the observed faking effect sizes in FC4 were higher than those in SS (M = 0.47, min = 0.28, max = 0.65).
Respondent Reactions
As displayed in Table 7, in honest condition, we found almost no meaningful differences in any aspects of respondent reactions. Specifically, after adjusting for multiple comparisons, none of the differences was statistically significant (ds < .19). Likewise, in the fake-good condition, the majority of the comparisons were statistically nonsignificant with tiny effect sizes, except for perceived faking resistance between FC2 and FC4, where FC2 was perceived as more faking-resistant than FC4 (adjusted p < .05, d = .30).
Respondent Reactions.
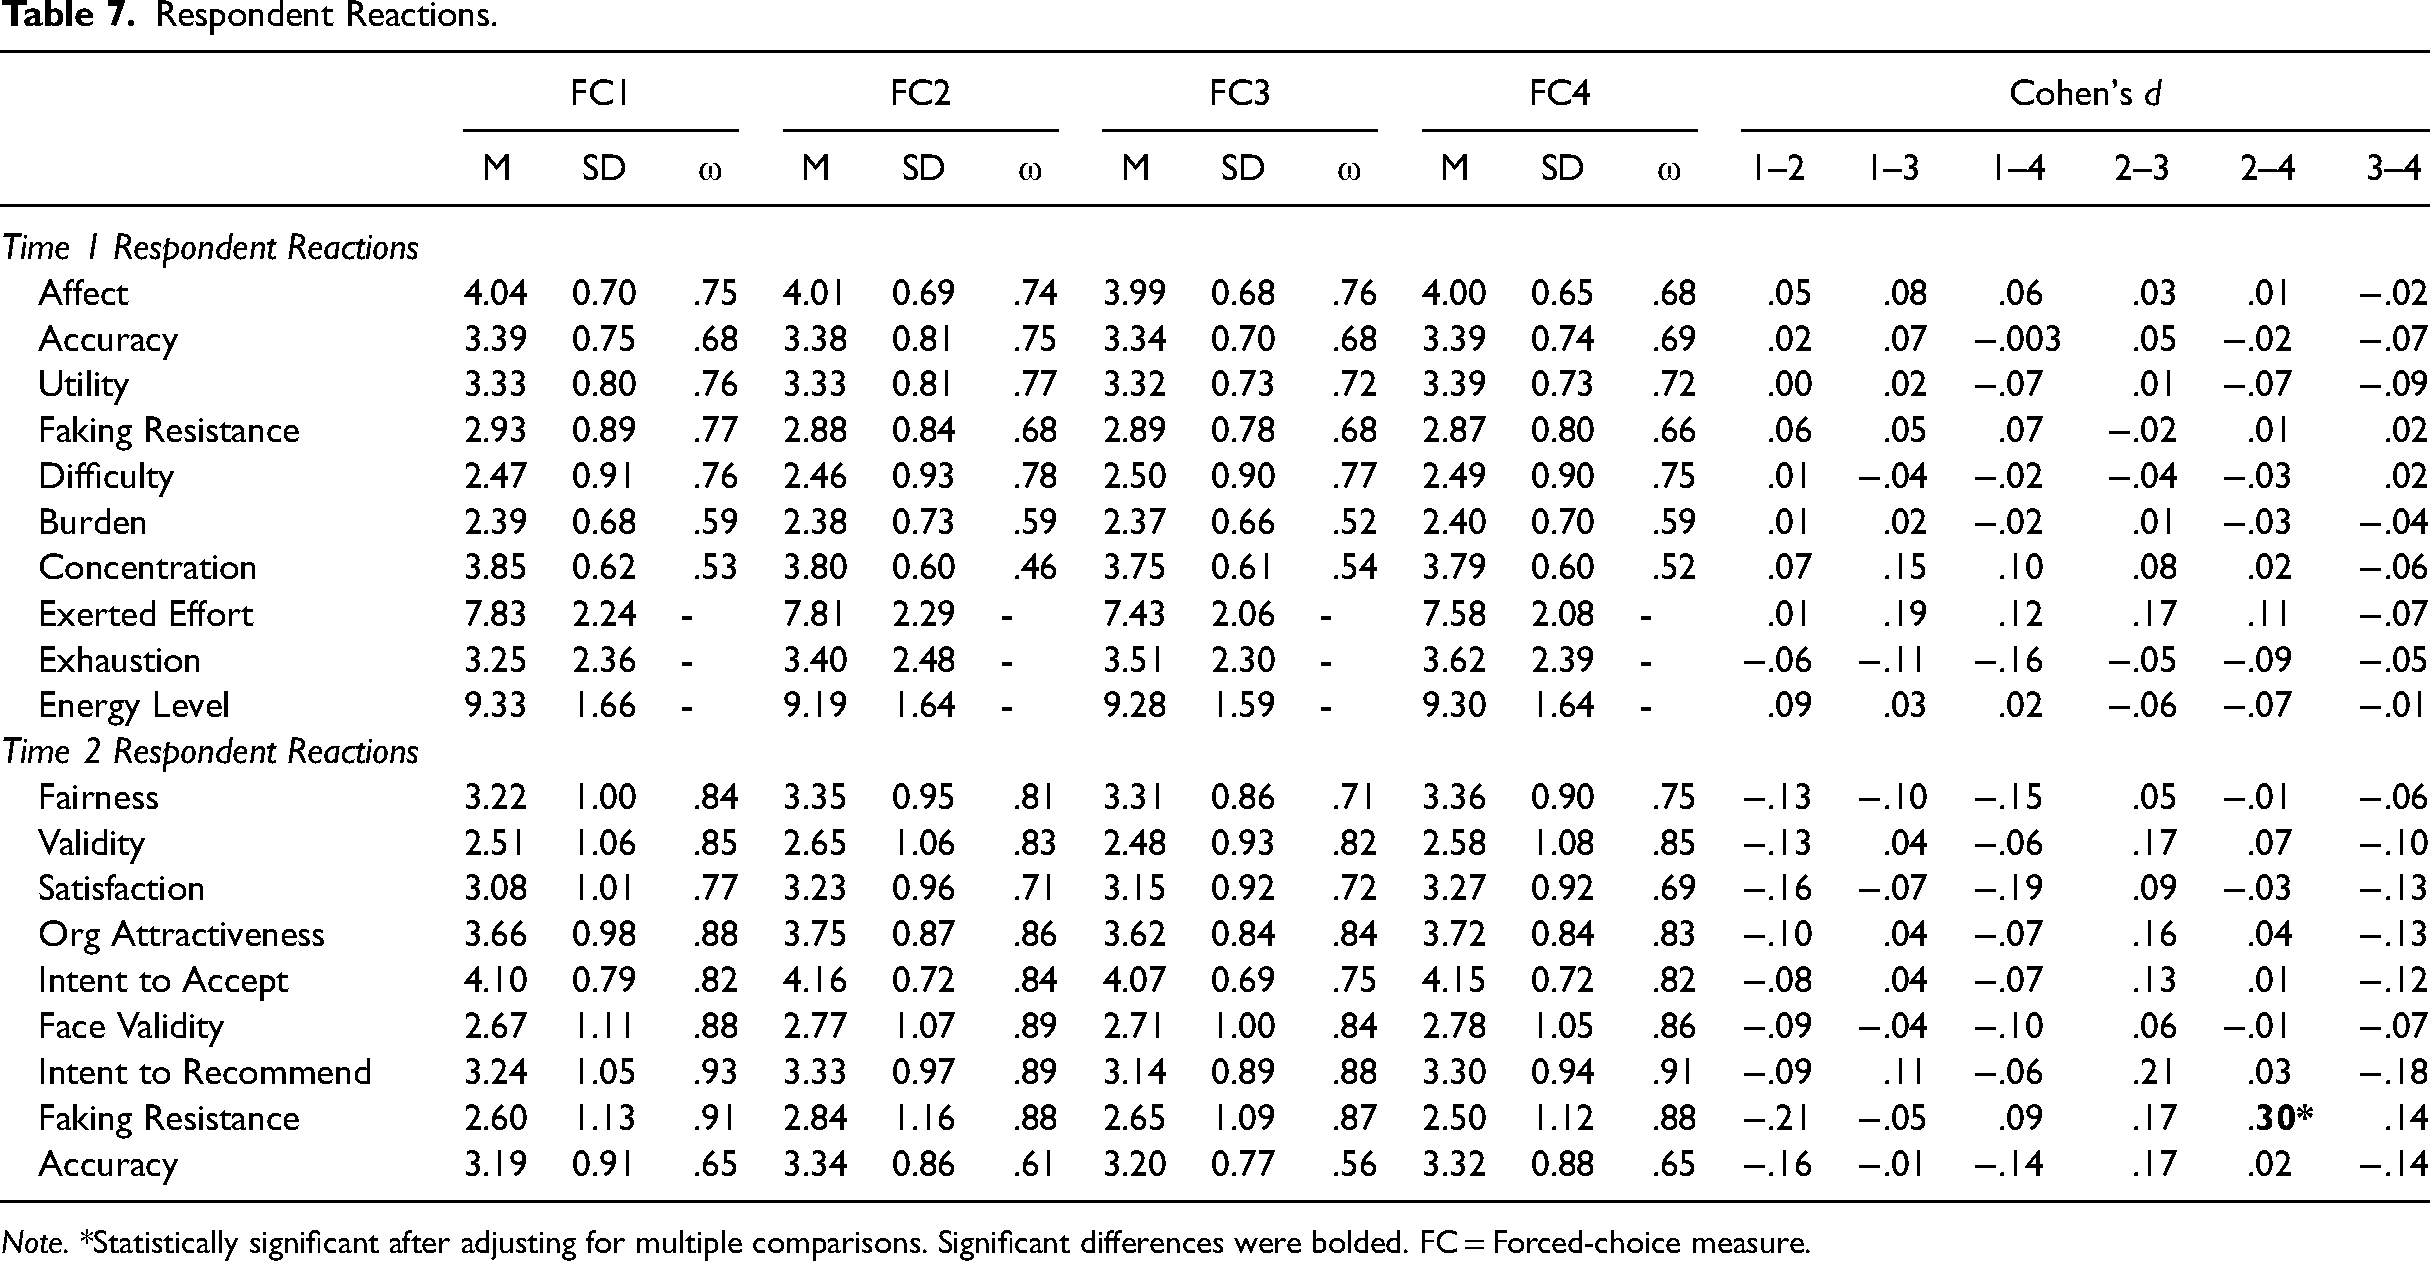
Note. *Statistically significant after adjusting for multiple comparisons. Significant differences were bolded. FC = Forced-choice measure.
Discussion
When intended for high-stakes situations, good psychometric properties and strong faking resistance are the two primary yet somewhat contradictory requirements for FC design. Achieving faking resistance often necessitates social desirability matching, but good psychometric properties require some mixed-keyed blocks which are often inevitably equivalent to social desirability mismatching. Besides, respondent reactions are also important in both low- and high-stakes situations because they may impact data quality and recruitment outcomes. However, no empirical evidence is yet available regarding the effects of different levels of social desirability matching and mixed keying on the psychometric properties of, faking resistance of, and respondents’ reactions to FC measures. To fill in this critical empirical gap, we conducted the first time-lagged experimental study to examine these three issues under different conditions by manipulating the levels of social desirability matching and mixed-keying. Results showed that (1) the impact of social desirability matching and mixed-keying on reliability was small (as long as there are at least 3 mixed keyed blocks), (2) FC measures with more mixed keyed blocks had substantially higher convergent validity with SS, more similar criterion-related and discriminant validity profile with SS, and can better predict criterion variables, (3) FC measures with better social desirability matching were generally more faking-resistant, and (4) different combinations of mixed keying and social desirability matching had negligible impact on respondents’ reactions in both honest and fake-good conditions. These findings demonstrate that it is possible to find a sweet spot between social desirability matching and mixed keying and thus construct a psychometrically sound and faking-resistant FC measure. Based on these findings and our first-hand experience with FC construction, we also provide tentative guidance on how to construct such a measure.
Mixed Keying or Social Desirability Matching?
Psychometric properties and faking resistance
Building upon initial attempts to reach a possible sweet spot between the two design criteria (Lee et al., 2022), we provided the first comprehensive empirical investigation on the effects of different mixed keying and social desirability matching combinations. First, as expected, neither solely focusing on social desirability matching (FC1) nor mixed keying (FC4) can produce FC measures that are both faking resistant and psychometrically sound. For FC1, although its high degree of social desirability matching brings notable advantages in faking resistance, the lack of mixed keyed blocks undermines its convergent validity, discriminant validity, and criterion-related validity. This essentially brings into question the construct validity of the scores. On the other hand, for FC4, its extensive focus on more mixed keyed blocks indeed allows its construct validity to be well maintained, consistent with the emphasis on mixed keying from simulation studies. However, relaxing social desirability matching too much also renders it more fakable compared to other FC counterparts. The utility of FC4 under the fake-good condition is hence limited.
These negative outcomes revealed by FC1 and FC4 suggest that for FC measures to be as valid and faking resistant as they are supposed to be, scale developers need to consider designing FC measures within a “middle ground.” As such, FC2 and FC3, representing the “middle ground” compromise between mixed keying and social desirability matching, demonstrate a better balance between psychometric properties and faking resistance. Comparing FC1 with FC2, consistent with Lee et al. (2022), psychometric properties of FC measures can be effectively improved and reach an acceptable level with the inclusion of just three more mixed keyed blocks (i.e., from 15% to 30%). We further extended their findings by showing that such improvement can even be achieved with a slight compromise in social desirability matching. Comparing FC3 with FC4, we found that faking resistance can be substantially strengthened with a better match in terms of social desirability (from 1.09 to 0.86 in terms of mean block desirability discrepancy), without reducing the number of mixed keyed blocks. Even more importantly, although FC2 and FC3 differed in terms of social desirability matching and mixed keying, their psychometric properties and faking resistance were largely similar. Admittedly, the trade-off still exists and a certain amount of loss in desirable psychometric properties is unavoidable, but such a trade-off seems acceptable for keeping FC as a both valid and faking-resistant measurement tool. We also acknowledge that it is not an easy task to find such a balance manually given a fixed statement pool, because the number of possible combinations can be astronomical. Hence, we recommend researchers use the R package autoFC (Li et al., 2022) to automate the search process and find the nearly optimal solutions.
Respondent reactions
No substantial impact was found for social desirability matching or mixed keying on respondent reactions. This is reassuring because it suggests that test developers do not need to worry a lot about respondent reactions when developing new FC measures.
Forced-Choice vs. Single Statement Measures
Although the primary focus of the present study is on the comparisons across the four FC measures, we believe the comparisons between the FC and the SS measures may also be of interest. By design, FC measures are less susceptible to or even immune from multiple response biases that plagues the SS format (Kreitchmann et al., 2019; Zhang, Luo et al., 2023). Our study further demonstrated that FC measures can be designed to maintain good construct validity. Nevertheless, readers may still be legitimately concerned about the utility of FC measures, given their relatively lower reliability estimates compared to their SS counterparts. The reliability discrepancy between the FC and the SS measures may originate from two sources. First, the FC responses are dichotomous in nature because respondents are only allowed to choose A or B. In comparison, the SS format allows respondents to indicate their degree of agreement. When holding other factors constant, dichotomous responses provide less information than graded ones, resulting in lower reliability of FC measures (Brown & Maydeu-Olivares, 2018). Fortunately, we can easily add a few more hard-to-fake desirability-matched blocks to FC2/FC3 to make trait scores derived from them as reliable as those from the SS format while maintaining their faking-resistance. However, it is much harder (if possible) to make the SS format as faking-resistant as the FC format. Second, it is well-known that the SS format is susceptible to various response biases, such as acquiescent, midpoint, and extreme response styles (Li et al., 2021; Plieninger & Heck, 2018; Sun et al., 2019; Sun et al., 2022). These systematic but construct-irrelevant biases can inflate reliability estimates. In the Online Supplementary Materials (Tables S8–S12 and Figures S5–S7), we presented additional analysis results where we corrected the SS scores for three common response biases (acquiescence, extreme responding, and midpoint responding) using the method developed by Plieninger and Heck (2018). It turned out that, after correction, the average reliability of the SS scores dropped from .84 to .70, which was very similar to that of FC. Taken together, these additional results suggested that the higher reliability estimates of SS were inflated, at the very least to some extent, by response biases, and that the FC format can mitigate these issues and provide more realistic estimates when carefully designed.
Another important finding is that FC4 demonstrated even greater susceptibility to faking compared to SS. Many papers have discussed the FC format as more faking-resistant than the SS format without properly noting that they have to be thoughtfully designed to be so. Our finding highlighted that the FC format is NOT a panacea for preventing faking. When desirable and undesirable statements are contrasted with each other within the same block, the social desirability difference among statements may become even more salient than when they are presented separately, thus making such blocks more susceptible to faking than their constituting statements (McCloy et al., 2005). If there are a substantial number of such blocks, FC measures can be even more fakable than their SS counterparts. Therefore, we urge users interested in using the FC format to counteract faking to be aware of this issue.
Recommended Steps to Develop FC Measures
Despite all the promises of the FC format, many people still find it difficult to develop a good FC measure due to the lack of guidelines. To promote a wider adoption of the FC format in organizational research and practices, below we provide a step-by-step guideline on how to develop high-quality FC measures based on our research findings and first-hand experience. These recommendations are intended as tentative guidelines that should be updated with more empirical evidence in the future rather than a gold standard.
Step 1. Generate a sufficient pool of high-quality statements for focal traits and obtain statement parameters. Several excellent guidelines have provided detailed discussions on how to write and select high-quality statements (Cao et al., 2015; Clark & Watson, 1995; 2019; Hinkin, 1998; Lambert & Newman, 2022; Worthington & Whittaker, 2006). Readers are encouraged to refer to them for more details. Here we want to emphasize the following considerations in the context of FC measure development. First, we should avoid the use of extremely worded statements (e.g., “I have never complained about anything”). Avoiding extreme wording can substantially lower the risk of the statement being too socially (un)desirable and hence too difficult to be matched with other statements. Second, it is important to keep a small proportion of negatively keyed statements (2–4 per trait) because we need them for mixed keyed blocks. Third, it is strongly recommended to keep more statements per trait than needed for a target FC measure as this can greatly ease the pairing in subsequent steps. In this step, researchers can also obtain statement parameters that will be used in the following steps. Specifically, if the test-developer adopts a dominance-response-process-based approach, it is recommended to fit a correlated-factor-analysis model to responses to the single statements and record the standardized factor loadings, statement intercepts, variance of statement uniqueness, and latent correlations among traits. If they adopt an unfolding-model-based approach, it is recommended to fit a Multidimensional Generalized Graded Unfolding Model (Tu et al., 2021; Tu et al., 2023; Wang & Wu, 2016) to the dichotomized responses and record statement discrimination, location, and threshold parameters, and latent correlations among traits.
Step 2. Obtain social desirability estimates of statements. There are three approaches to obtaining social desirability estimates for statements developed in Step 1. The first approach is direct rating where a small group of subject matter experts provide their direct ratings of the social desirability of each statement on a Likert scale (e.g., 1 = Very undesirable, 5 = Very desirable; see examples from Vasilopoulos et al., 2006; and Wetzel et al., 2021). Subject matter experts can be asked to rate the general and/or job-specific social desirability of each statement, depending on the intended use of the measure: If the measure is designed for use in specific jobs or organizations, then job-specific social desirability can be more appropriate; if the measure is intended for selection across jobs/organizations, then general social desirability is preferred. The second approach is to ask respondents to respond to these statements as if they were ideal job candidates (Naemi et al., 2014; Stark et al., 2005). These fake-good responses can also be used to operationalize the social desirability of statements. Recently, Hommel (2023) demonstrated that natural language processing techniques can also be used to predict statement social desirability with high accuracy. As of now, we recommend the direct rating approach because it is the most straightforward operationalization of social desirability. Fake-good responses may be contaminated by other irrelevant factors such as faking motivation. The natural language processing approach is promising but ignores individual differences in the perception of statement social desirability. Further, we recommend researchers to (1) use at least 30 participants for more reliable estimates of social desirability, (2) ensure each trait has statements spanning a similar range of social desirability levels, and (3) examine interrater agreement and prioritize statements whose social desirability was agreed upon by most raters.
Step 3. Determine block size. One of the most important decisions when developing FC measures is block size, which could range from 2 to the total number of statements (full ranking task, which is impractical with any substantial number of statements). When making this decision, researchers need to consider psychometric properties and respondents’ cognitive load. Larger block sizes should demonstrate superior psychometric properties because they produce more pairwise comparisons, but may also impose heavier cognitive load on respondents, potentially leading to compromised respondent reactions and data quality, thereby jeopardizing psychometric properties (Brown & Maydeu-Olivares, 2011). Surprisingly, very few studies have systematically examined the impact of block size on psychometric properties of (but see Frick et al., 2023 for an exception) and respondent reactions to FC measures. Drawing from our own results obtained from three samples with >4,500 respondents in another ongoing project (results available upon request as we are still writing this manuscript), we found minor differences (Cohen's ds = −.16 to .18) on perceived difficulty, exhaustion and cognitive load between FC measures with block sizes of three and five when holding statements constant. As such, block sizes ranging from 3 to 5 can all be considered as reasonable for static FC measures (all respondents received identical blocks) because they strike a good balance between psychometric information and respondent reactions. Five is also the up-to-date estimate of the upper limit of working memory capacity for meaningful chunks for adults (Cowan, 2010; Halford et al., 2007). A block size of 2 is recommended for computerized adaptive tests because it is much easier to implement (Stark et al., 2012), but not for static FC measures because it is not very psychometrically efficient. If researchers have specific reasons to maintain a block size of 2, we recommend using the graded FC format. This format allows respondents to indicate their degree of preference, thereby providing more psychometric information (Brown & Maydeu-Olivares, 2018; Zhang, Luo et al., 2023; Zhang, Tu et al., 2023) and potentially fostering more positive respondent reactions (Dalal et al., 2021). It is also recommended that for multidimensional FC measures, block size should not exceed the number of measured latent traits because we generally want to avoid having more than one statement of the same latent trait in the same block.
Step 4. Determine the number of mixed keyed blocks. After obtaining social desirability and deciding on block size, researchers need to decide on the number of mixed keyed blocks. Previous simulations demonstrated that 20–30% of mixed keyed blocks in a triplet format were sufficient for maintaining satisfactory reliability of trait scores (Lee et al., 2022). Our empirical findings further confirmed that this setting can also maintain sufficient faking-resistance. However, it should be noted that it is hard to recommend an absolute number that universally applies to all FC measures because it depends on block size and the number of latent traits being measured. We also note that what matters for psychometric properties is the number of mixed keyed pairs (recoded pairwise comparisons) and what matters for fakability is the proportion of mixed keyed blocks. Our findings suggest that 6 mixed keyed triplets (6÷20 = 30% mixed keyed blocks) and 14 matched triplets, corresponding to 12 mixed keyed pairs (each mixed keyed triplet has two mixed keyed pairs and one matched pair) and 48 matched pairs (14 × 3 = 42 matched pairs from matched triplets, and 6 × 1 = 6 from mixed keyed triplets) when recoded into pairwise comparisons items, suffice for measuring six traits. It means that 30% or fewer mixed keyed blocks and two mixed keyed pairs per trait without duplication would be a reasonable recommendation. Surely, more matched pairs will be even better as they provide more information without impacting fakability. Let's say three researchers want to measure 12 traits using FC measures, they need to have at least 24 mixed keyed pairs regardless of the block size. If researcher A plans to use block size of 3, there should be 12 mixed keyed triplets (24 mixed keyed pairs÷2 mixed keyed pairs per mixed keyed triplet) and 28 ([12 mixed keyed triplets÷30%] × 70%) or more matched triplets (28 × 3 + 12 = 96 matched pairs or more); if researcher B wants to use a block size of 4 and they design the mixed keyed blocks as containing two positively keyed statements + 2 negatively keyed statements (four mixed keyed pairs and two matched pairs per mixed keyed block), they need to have 6 (24÷4) mixed keyed quadruplets and 14 ([6÷30%] × 70%) or more matched quadruplets (6 × 2 + 14 × 6 = 96 matched pairs or more); if researcher C uses a block size of 5 and they design the mixed keyed blocks as containing 2(3) positively keyed statements + 3(2) negatively keyed statements (six mixed keyed pairs and four matched pairs per mixed keyed block), they need to have 4 (24÷6) mixed keyed quintets and 10 ([4÷30%] × 70%, rounded up) or more matched quadruplets (4 × 4 + 10 × 10 = 116 matched pairs or more). Furthermore, we recommend that mixed-keyed triplets be composed of 2(1) positively and 1(2) negatively keyed statements, mixed-keyed quadruplets be composed of two positively and two negatively keyed statements, and mixed-keyed quintets be composed of 3(2) positively and 2(3) negatively keyed statements. These designs allow the maximum number of keyed mixed pairs to appear.
Step 5. Create blocks. While mixed keyed blocks almost inevitably involve bundling desirable and undesirable statements, researchers can still try some degree of matching by putting moderately desirable and moderately undesirable statements together instead of putting very desirable and very undesirable statements together. Therefore, we recommend users to construct mixed keyed blocks first so that they have the largest statement pool to choose from. For any FC measures, researchers should try to ensure that (1) statements within the same block measure different latent traits, (2) each trait should be paired with all other traits for about an equal number of times, (3) each trait should also be involved in at least one mixed keyed pair, and (4) statements in the same block should be matched on social desirability as much as they can. Given all these constraints, it becomes challenging to create optimal blocks manually. Therefore, in the Online Supplementary Materials, we provided a tutorial on how to use the autoFC R package (Li et al., 2022) to automatically assemble blocks according to multiple criteria.
Before moving to the next step, we consider two additional issues deserving further attention. The first issue concerns how to use social desirability value for matching. The most popular way is to focus on the mean value for each statement across raters and try to minimize the absolute difference between statements’ mean desirability values (the D index; Edwards, 1957; Pavlov, 2022). Statements are said to be matched if the largest D between all possible statement pairs within a block is smaller than a predefined cutoff. We recommend setting the cutoff to be .50 for a 5-point scale based on previous studies (e.g., Vasilopoulos et al. [2006] used .357; Chernyshenko et al. [2009], Drasgow et al. [2012], and Hughes et al. [2021] used .714) and our first-hand experience. For mixed keyed blocks, the cutoff should be relaxed, though less evidence exists on what cutoff should be set. Based on our experience with FC questionnaire construction, 1–1.5 on a 5-point scale seem to be a reasonable cutoff for mixed keyed blocks. One potential issue of using mean desirability values is that the variance of social desirability values across raters is ignored. To overcome this issue, Pavlov et al. (2022) proposed the inter-item agreement (IIA) approach, which essentially utilized robust interrater agreement indices, such as Brennan–Prediger index (Brennan & Prediger, 1981; Gwet, 2014) and AC index (Gwet, 2008, 2014). Statement pairing, in turn, is based on the interrater agreement on social desirability values, rather than differences in mean social desirability values. We believe that the IIA approach is promising for statement matching. Readers interested in this approach can use the autoFC R package to execute it.
The second issue concerns the contextual nature of social desirability. While it is common to match statements based on social desirability ratings obtained from SS administration, this practice implicitly assumes that respondents’ perception of statement social desirability remains constant when these statements are administered individually versus in pair with other statements (Frick, 2022). However, a statement may become more or less desirable depending on the statements it is paired with (Lin & Brown, 2017). Even two statements with identical social desirability ratings when presented individually can still be perceived as differentially (un)desirable when paired together. As such, after constructing preliminary blocks, test-developers can invite human raters to rate the desirability of multiple statements presented simultaneously in a block. Blocks that may need further revision can be identified by checking the D index computed from the social desirability ratings obtained from block administration. If the D index exceeds the cutoff suggested above, researchers should repeat this process until they find blocks that satisfy the criterion. While the present study focused on dominance-model-based FC measure, the ideal-point-model-based FC measure is also widely used (Drasgow et al., 2012; Boyce et al., 2015). Under the unfolding framework, test developers should match statements on both social desirability and extremity to ensure faking-resistance (Cao & Drasgow, 2019).
Step 6. Examine the reliability of the FC measure using simulated data. It is extremely helpful to have an initial understanding of the reliability of trait scores derived from the FC measure constructed in the previous step under ideal conditions using Monte Carlo simulations. If the reliability does not fare well in these ideal conditions, it is unlikely to be satisfactory in more realistic conditions. In those cases, researchers should go back to the previous step to construct a new FC measure and examine its reliability in ideal conditions again before collecting empirical data. To examine reliability using simulated data, researchers need to simulate FC responses based on the statement parameters obtained in Step 1, assuming that statement parameters are largely invariant across FC and SS (Lin & Brown, 2017; Morillo et al., 2019). Specifically, if test developers adopt the dominance model, FC responses should be generated according to equation (4) in Brown and Maydeu-Olivares (2013); if the unfolding model is adopted, FC responses can be generated according to equation (2) in Lee, Joo and Lee (2019) or equation (13)/(14) in Zhang, Tu et al. (2023). Finally, researchers could fit either a dominance (e.g., TIRT) or an unfolding (e.g., GGUM-RANK or GTUM) model to the simulated data depending on the data generation model used, and obtain reliability estimates accordingly.
A natural follow-up question is how to calculate reliability when assembling a new FC measure from calibrated statement banks and empirical data is not yet available. If the FC measure is intended to screen in/out respondents within a certain range of the latent trait continuum, we recommend direct examination of standard errors of measurement within the range of interest because this is the most straightforward way to quantify measurement precision. If the measure is designed for general purpose and an overall estimate of reliability is needed, following Lin (2022), we recommended test-developers to use the squared correlation between estimated person scores and true person scores as the reliability estimate, because this index relies on the least assumptions and is a straightforward operationalization of reliability under Classical Test Theory. However, this squared correlation is also the most conservative estimate (Lin, 2022). Thus, we additionally recommend the empirical reliability estimate using the formula
Step 7. Empirical validation. If the FC measure performs satisfactorily in simulations, researchers can then proceed to empirically test its psychometric properties, fakability, and respondent reactions. We believe our study provided a good example of empirical validation design that interested readers can adopt for their own studies. Specifically, we recommend a within-subjects design to contrast honest versus motivated faking situations to comprehensively estimate the fakability of an FC measure. Researchers are also recommended to include the SS counterpart as a benchmark to gauge the degree of possible benefits (in terms of psychometric properties and faking resistance) and costs (in terms of respondent reactions) brought by the FC. At this stage, we recommend using empirical reliability or test–retest reliability to quantify measurement precision, as they reflect the measurement accuracy in actual rather than hypothetical samples. We additionally recommend test developers to regularly examine measurement invariance across demographic groups (e.g., gender or racial groups) to identify potentially noninvariant blocks and ensure score comparability across groups. Several techniques for assessing measurement invariance of FC measures have been proposed in recent years (Lee & Smith, 2020; Lee et al., 2021; Qiu & Wang, 2021) and we recommend readers to refer to these approaches.
Limitations and Future Directions
Despite its many strengths (e.g., large sample, experimental design, comprehensiveness, guidelines, and tutorial), the present study is still limited in the following ways. First, we only used FC measures with a block size of three, which provided less information compared to larger block sizes. Future researchers are strongly encouraged to examine whether block size will moderate the effects of mixed-keying and social desirability on psychometric properties, faking resistance, and respondent reactions. Second, although the current study demonstrated negligible impact of FC designs on respondent reactions, it remains possible that respondent reactions are dependent on the construct being measured as well. For example, if respondents are required to choose between statements measuring the dark personality traits (A = “I manipulate people to get what I want,” B = “I deserve more attention than others,” C = “I enjoy quick and nasty revenge”) that may threaten their self-images, they may have more salient negative reactions (Fuechtenhans & Brown, 2022). In such cases, the design of FC measures may become more relevant. Hence, we believe that a promising future research direction is to examine the effect of construct types on respondent reactions, and whether the impact of FC design on respondent reactions depends on these construct types. Third, we exclusively used self-reported data for measuring both personality and criterion variables. It would be interesting for future studies to explore whether the criterion-related validity of different FC measures would vary in the same manner when predicting other reported outcomes.
Conclusion
We presented the first piece of comprehensive empirical evidence on the impact of social desirability matching and mixed keying on the psychometric properties of, fakability of, and respondent reactions to FC measures. Most notably, a small compromise on desirability matching in exchange for more mixed keyed blocks is feasible, such that the improvement in psychometric properties does not substantially harm the faking resistance of an FC measure. Also, respondents did not report differential reactions toward different FC designs. All in all, we showed that it is possible to find a middle ground between social desirability matching and mixed keying such that the FC measures can have both good psychometric properties and high faking resistance. We further provided researchers tools for constructing such FC measures.
Supplemental Material
sj-docx-1-orm-10.1177_10944281241229784 - Supplemental material for Mixed-Keying or Desirability-Matching in the Construction of Forced-Choice Measures? An Empirical Investigation and Practical Recommendations
Supplemental material, sj-docx-1-orm-10.1177_10944281241229784 for Mixed-Keying or Desirability-Matching in the Construction of Forced-Choice Measures? An Empirical Investigation and Practical Recommendations by Mengtong Li, Bo Zhang, Lingyue Li, Tianjun Sun and Anna Brown in Organizational Research Methods
Footnotes
Acknowledgment
The authors thank Dr. Fritz Drasgow for his insightful comments on an earlier version of the manuscript.
Authors’ Note
An earlier version of this paper was presented at the 38th Annual Conference of the Society for Industrial and Organizational Psychology.
Declaration of Conflicting Interests
The author(s) declared no potential conflicts of interest with respect to the research, authorship, and/or publication of this article.
Funding
The author(s) received no financial support for the research, authorship, and/or publication of this article.
Supplemental Material
Supplemental material for this article is available online.
Notes
Author Biographies
References
Supplementary Material
Please find the following supplemental material available below.
For Open Access articles published under a Creative Commons License, all supplemental material carries the same license as the article it is associated with.
For non-Open Access articles published, all supplemental material carries a non-exclusive license, and permission requests for re-use of supplemental material or any part of supplemental material shall be sent directly to the copyright owner as specified in the copyright notice associated with the article.