
Abstract
In recent decades, multidimensional forced-choice (MFC) tests have gained widespread popularity in organizational settings due to their effectiveness in reducing response biases. Detecting differential item functioning (DIF) is crucial in developing MFC tests, as it relates to test fairness and validity. However, existing methods appear insufficient for detecting DIF induced by the interaction between multiple covariates. Furthermore, for multi-category, ordered or continuous covariates, existing approaches often dichotomize them using a-priori cutoffs, commonly using the median of the covariates. This may lead to information loss and reduced power in detecting MFC DIF. To address these limitations, we propose a method to identify both main effect DIF and interactive DIF. This method can automatically search for the optimal cutoffs for ordered or continuous covariates without pre-defined cutoffs. We introduce the rationale behind the proposed method and evaluate its performance through three Monte Carlo simulation studies. Results demonstrate that the proposed method effectively identifies various DIF forms in MFC tests, thereby increasing detection power. Finally, we provide an empirical application to illustrate the practical applicability of the proposed method.
Keywords
Over the past two decades, a growing body of evidence has demonstrated the strong validity of noncognitive attributes, such as personality, leadership, motivation, and career interests, to predict job performance (e.g., Denis et al., 2010; Shaffer & Postlethwaite, 2013; Sitser et al., 2013). Consequently, in high-stakes personnel selection settings, noncognitive attributes are often assessed alongside cognitive abilities to accurately determine a candidate's suitability for a position. While historically the Likert-type rating scale has been widely used for measuring noncognitive attributes, it has been criticized for its susceptibility to response bias in many studies (e.g., Danner et al., 2016; Frick, 2022; Ng et al., 2020; Wetzel et al., 2016). As Paulhus (1991) defined, a response bias is “a systematic tendency to respond to a range of questionnaire items on some basis other than the specific item content.” Three prominent types of response bias are: (a) socially desirable responding (including faking bad, lying, etc.), (b) acquiescence (tendency to agree), and (c) extremity bias (tendency to use extreme ratings). Researchers have demonstrated that response biases can jeopardize the validity and utility of measures (e.g., Griffith et al., 2007; Schmitt & Oswald, 2006) and potentially lead to incorrect hiring decisions in high-stakes settings (Winkelspecht et al., 2006), rendering traditional Likert-type scales a suboptimal choice for personnel selection.
Forced-Choice Formats and Item Response Theory Models for Multidimensional Forced-Choice Tests
To reduce response biases, psychometric researchers have long advocated for the use of multidimensional forced-choice (MFC) tests (e.g., Anguiano-Carrasco et al., 2015; Calderón Carvajal et al., 2021; Christiansen et al., 2005; Guenole et al., 2018; Jackson et al., 2000; Merk et al., 2017; Ng et al., 2020). In MFC tests, respondents are given two or more statements with similar appeals, and are asked to choose the one that fits them best or to rank them in order of fit (for an overview of different MFC formats, see Hontangas et al., 2015). Numerous studies have shown that the MFC form significantly reduces socially desirable responding and acquiescence (e.g., Heggestad et al., 2006; Jackson et al., 2000). Some research also demonstrated that MFC tests have similar or higher construct and criterion-related validity than Likert-type personality scales (Bartram, 2007; Salgado et al., 2015). Currently, examples of widely used MFC questionnaires include the International Personality Item Pool-Multidimensional Forced Choice (IPIP-MFC; Heggestad et al., 2006), the Occupational Personality Questionnaire (ipsative shorted format; OPQ32r; Brown & Bartram, 2009), and the Personality and Preference Inventory (Cubiks, 2010). According to Tett et al. (2011), almost 30% of U.S. companies use MFC tests for talent selection in organizational contexts.
Although MFC tests have great advantages, traditional scoring formats of these tests have been criticized for yielding ipsative or partially ipsative scores (Baron, 1996; Brown & Maydeu-Olivares, 2011; Cattell, 1944). Cattell (1944) first used the term ipsative (from the Latin ipse: he, himself) to name a type of scale in which a score on one attribute is relative to scores on the person's other attributes. The scores generated when individuals respond to such a scale are ipsative scores. Ipsative scores only reflect relative levels of the measured traits within an individual because the sum of scores is a constant for each respondent (Hontangas et al., 2015). Accordingly, ipsative scores are not directly comparable across individuals (Loo, 1999). Brown and Maydeu-Olivares (2013) also indicated that ipsative scores have problematic psychometric properties, including reliability, criterion-related validity, and construct validity. For a period of time, this limited the application of MFC tests.
Fortunately, this problem has been addressed using modern psychometric theories. Specifically, researchers have proposed a group of multidimensional forced-choice item response theory (MFC-IRT) models to analyze MFC item response data and generate reliable trait scores that can be compared across individuals. Research has revealed that IRT-estimated scores effectively overcome the limitation of ipsative data and offer higher measurement precision than ipsative scores (Brown & Maydeu-Olivares, 2013). In the past few decades, various MFC-IRT models have been proposed to establish the relationship between the overt responses and the latent traits assessed by MFC tests. To classify existing MFC-IRT models, Brown (2014) introduced a unified framework comprising three dimensions: (1) the MFC format used, (2) the measurement model for the relationships between items and measured traits, and (3) the decision model for choice behavior. In the framework, measurement models used for personality assessments are categorized into two main types: 1) Dominance Models and 2) Ideal Point Models, depending on assumptions regarding respondents’ response processes. Dominance models posit a monotonic increase in the likelihood of endorsing an item with an increasing underlying trait level. Conversely, ideal point models assume a nonmonotonic relationship where the probability of endorsement peaks when the respondent's trait level matches the item's location. As for decision models, four primary types have been employed to model MFC response data: Thurstone's Law of Comparative Judgment (Thurstone, 1927), Andrich's Forced Endorsement Model (Andrich, 1989), Luce's Choice Axiom (Luce, 1977) and Bradley–Terry Model (Bradley & Terry, 1952). Following the Brown's (2014) framework, existing MFC-IRT models are classified as depicted in Table 1.
Existing MFC-IRT Models and Their Categorization in the Brown's (2014) Framework.
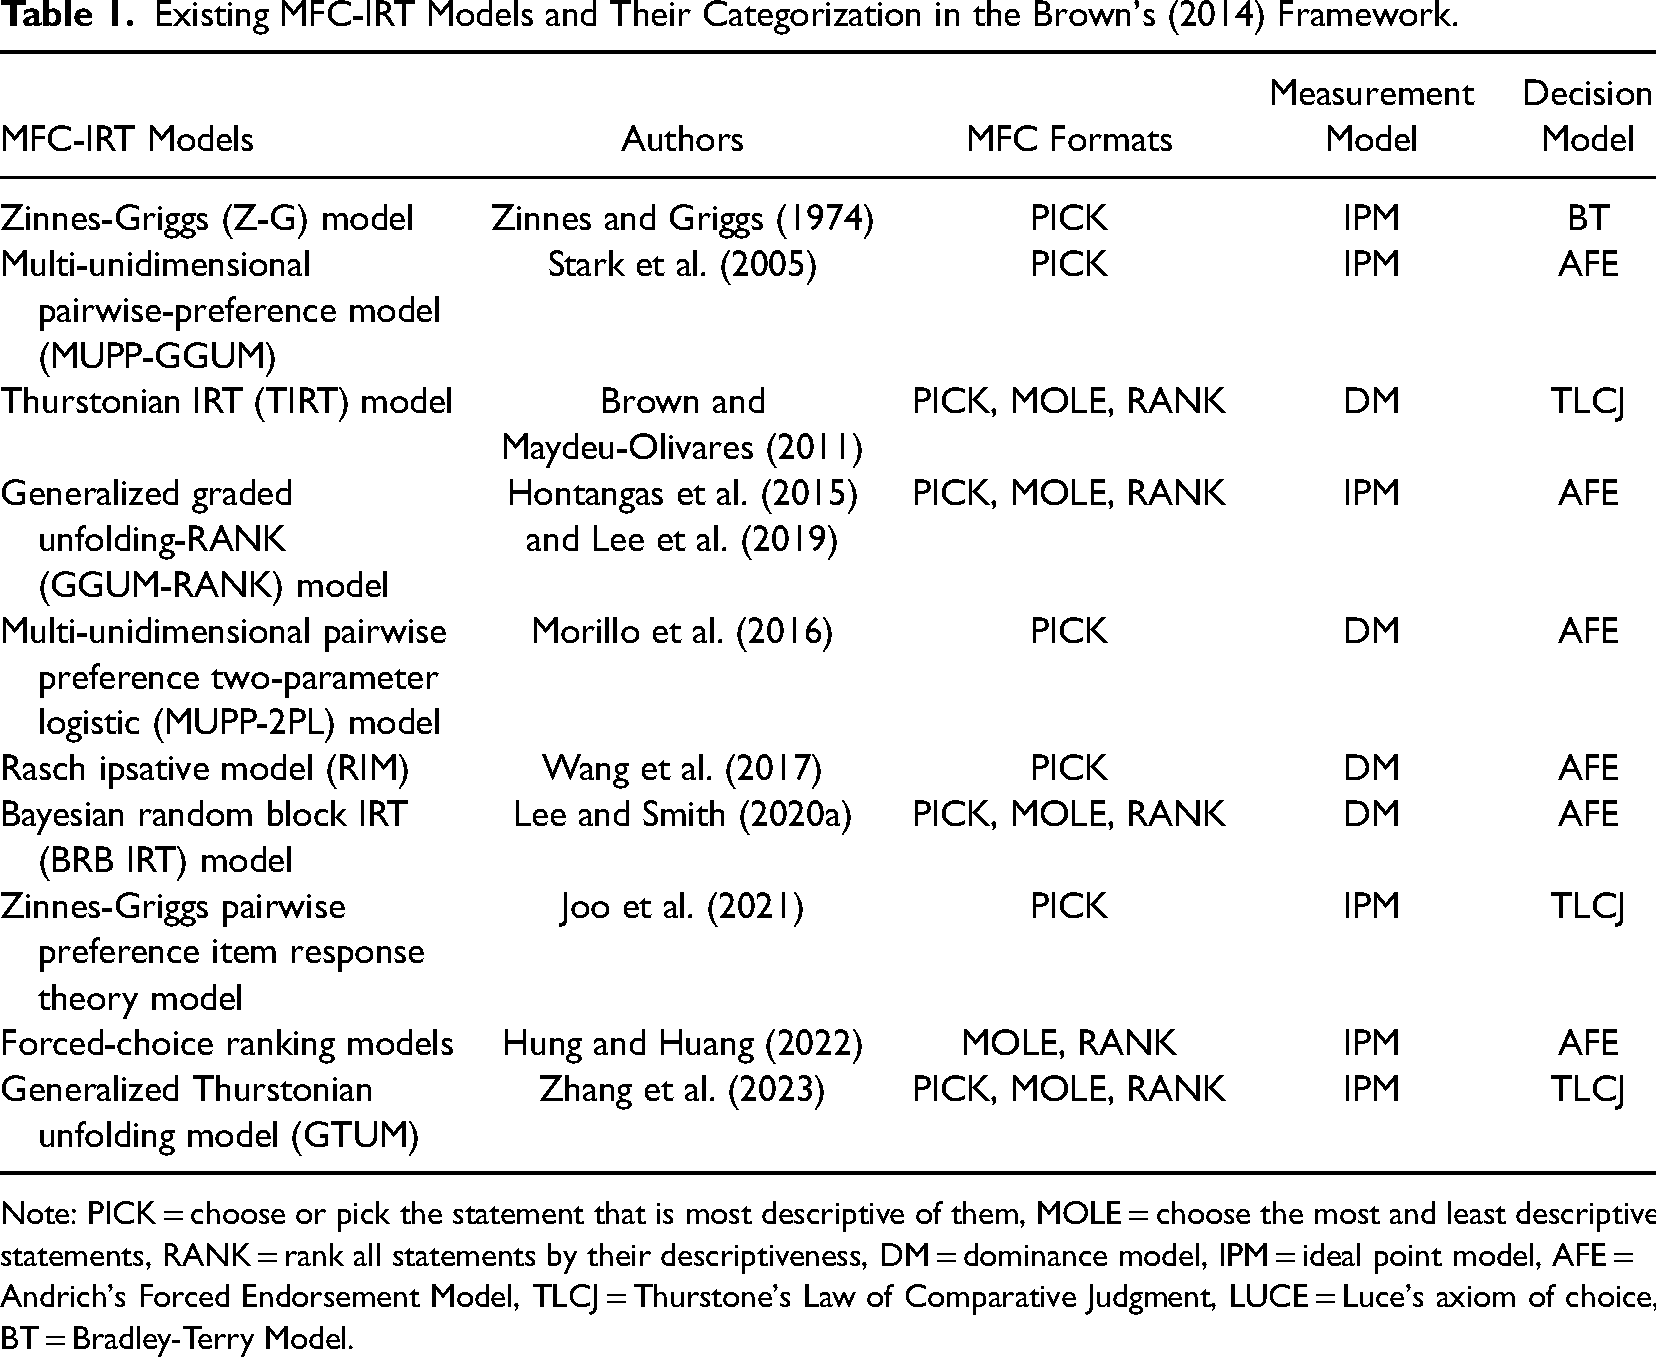
Note: PICK = choose or pick the statement that is most descriptive of them, MOLE = choose the most and least descriptive statements, RANK = rank all statements by their descriptiveness, DM = dominance model, IPM = ideal point model, AFE = Andrich's Forced Endorsement Model, TLCJ = Thurstone's Law of Comparative Judgment, LUCE = Luce's axiom of choice, BT = Bradley-Terry Model.
Recent advancements in IRT models for analyzing MFC response data have created two noteworthy and innovative research avenues. First, the development of novel MFC-IRT models that incorporate response time (e.g., Bunji & Okada, 2020, 2022; Guo et al., 2023) has provided a deeper understanding of the MFC item response process. This integration of response modeling and response time modeling holds promise for enhancing measurement accuracy. Second, researchers have delved into modeling aberrant response behavior specific to MFC tests (e.g., Frick, 2022; Peng et al., 2023). Expanding the scope of MFC-IRT models to accommodate diverse aberrant response patterns contributes significantly to enhancing the validity of derived trait estimates. Looking ahead, by continuing to advance MFC-IRT methodology and expand the scope of modeled response behaviors, researchers can further unlock the richness of MFC response data to obtain enhanced insights into the cognitive processes underlying test performance and more valid measurement of the noncognitive constructs of interest.
In summary, modern IRT approaches facilitate robust modeling and scoring of MFC tests, providing versatile options for analyzing MFC response data and generating reliable trait scores. Despite the abundance of MFC-IRT models, this study chose the TIRT model for three reasons: (a) it can deal with common MFC formats including choose or pick the statement that is most descriptive of them (PICK), choose the most and least descriptive statements (MOLE), and rank all statements by their descriptiveness (RANK); (b) its adaptability and widespread use in recent research (e.g., Brown & Maydeu-Olivares, 2011; Bürkner et al., 2019; Peng et al., 2023) have established it as a reliable analysis framework; (c) the development of MFC item blocks for dominance models seems easier and incur a lower cost than for ideal point models (Brown & Maydeu-Olivares, 2010), and some studies pointed out that the majority of existing personality assessments seem to fit a dominance model better than an ideal point model (e.g., Cho et al., 2015).
Why Detect Differential Item Functioning for MFC Tests?
As delineated in the Principles for the Validation and Use of Personnel Selection Procedures (2018), a fair selection procedure enables all test takers to show their status on a construct without undue advantage or disadvantage due to other personal attributes (e.g., age, race, ethnicity and gender). As an impactful assessment tool in high-stakes personnel selection procedure, MFC tests must also inevitably consider the issue of test fairness. In psychometric contexts, a frequently used concept intimately tied to test fairness is measurement invariance (MI). MI reflects the comparability of the trait estimates by respondents with divergent demographic characteristics (e.g., males and females). MI at the item level is also referred to as being free from differential item functioning (DIF; see Magis et al., 2010 for an overview). In MFC tests, MFC DIF refers to how individuals with matched latent trait levels but from different subgroups may respond to the same MFC item block 1 in a different way. As highlighted by the Standards of Educational and Psychological Testing (AERA et al., 2014) and Zieky (2015), DIF analysis has been a routine practice in test construction to ensure the fairness and accuracy of test outcomes. Hence, to ensure the fairness and validity of newly developed MFC tests in high-stakes personnel selection environments, it is essential to conduct MFC DIF analysis.
Compared to the traditional DIF detection with single-stimulus items, detecting DIF in MFC tests faces unique challenges. Specifically, the manifestation of DIF is more complex in MFC tests than in traditional tests. First, each item block in the MFC test contains at least two statements, which increases the chances that DIF appears in MFC tests. Additionally, following the views of Qiu and Wang (2021) and Lee et al. (2021), there are multiple possible sources of DIF in MFC tests, including statements, pairwise comparisons, or both. Finally, DIF in MFC tests may cancel or accumulate depending on how the statements are perceived relative to each other (Lee et al., 2021). This complexity requires unique detection methods for DIF in MFC tests, necessitating research in developing DIF detection methods tailored specifically for MFC tests.
Existing MFC DIF Detection Methods and Their Limitations
The current literature on MFC DIF detection methods is thin, with only four studies published to date to our knowledge. Existing methods can be classified into three categories, depending on whether they address differential functioning at the statement level, the item block level, or the whole test level.
Overall, all the above existing methods for detecting MFC DIF employed a multigroup approach, a technique also utilized in traditional single-stimulus DIF detection. This approach requires that the covariates used for DIF detection be categorial, frequently with only two groups, like male and female respondents. While these established MFC DIF detection methods have demonstrated effectiveness, none adequately tackle two crucial issues.
First, in organizational settings, for those ordered or multi-category covariates (e.g., country, ethnicity, race, socioeconomic status, educational level, department/division, job grade, and cultural background) and continuous covariates (e.g., working years, language proficiency, and salary level), if without protected classes prescribed by laws or regulations, the subgroups are defined arbitrarily using a-priori cutoffs, commonly dichotomizing these covariates by their respective medians calculated from the collected data (Bourion-Bédès et al., 2015; Strobl et al., 2013). However, as cautioned by MacCallum et al. (2002), a-priori discretization carries the risk of discarding crucial variation within artificial categories, and may even fail to capture the range where DIF occurs precisely. Moreover, the outcomes of DIF detection are significantly affected by how subgroups are formed. Some researchers also demonstrated that determining the groups arbitrarily a-priori may lead to information loss and a potential decrease in the power to detect DIF (Strobl et al., 2013; Tay et al., 2015).
The second limitation of the existing MFC DIF detection methods is omitting the interaction among multiple covariates that potentially induce DIF, as existing methods only detect MFC DIF by each covariate separately. To distinguish DIF induced by the interaction between multiple covariates from DIF induced by a single covariate investigated in previous MFC DIF studies, we refer to the former interactive DIF, and the latter main effect DIF. Detecting interactive DIF in MFC tests bears many benefits. First, it allows for a more thorough understanding of the complex sources causing differential functioning (Belzak, 2023; Robert et al., 2006; Tay et al., 2015), enabling experts to make targeted modifications. As stated by Collins (1990), there is an increasing recognition that identity encompasses the intersection of multiple background characteristics. Second, it helps to more effectively ensure test fairness. Revealing more hidden measurement bias through interactive DIF detection helps to prevent hiring discrimination. Finally, it further enhances test validity and the overall quality of the tests. In contrast to main effect DIF, interactive DIF is particularly insidious, and it only becomes apparent when multiple covariates are considered simultaneously in a single round of DIF testing. But interactive DIF can be commonly present. For example, this measurement bias caused by the interaction between covariates is quite evident in the assessment of adolescent delinquent behavior (Bauer, 2017). Over the past decade, researchers have shown great research interest in the interactive DIF and developed methods to detect interactive DIF in traditional single-stimulus tests (e.g., Bollmann et al., 2018; Strobl et al., 2013; Tutz & Berger, 2016). However, methods to detect interactive DIF in MFC tests are lacking.
In conclusion, the current methods for detecting MFC DIF face limitations in dichotomizing the grouping covariates arbitrarily a-priori, and omitting the investigation of interactive DIF. This paper proposes a new method based on the recursive partitioning technique to address these limitations.
A Brief Overview of Recursive Partitioning Technique and Its Application in IRT-Based DIF Detection
Advances in machine learning (ML) have provided new opportunities to overcome the constraints of conventional DIF detection approaches. As a multivariate data mining technique in ML, recursive partitioning (RP) has proven remarkably effective in analyzing multivariate data across diverse scientific fields, including genetics (e.g., Díaz-Uriarte & Alvarez de Andrés, 2006), ecology (e.g., Cutler et al., 2007), medicine (e.g., Khalilia et al., 2011), and psychology (e.g., Hayes et al., 2015). RP has its origins in classification and regression tree (CART) models introduced by Breiman et al. (1984). The RP algorithm works by building a tree-like structure, with covariates being the nodes. The tree starts with a single node, and then branches into two mutually exclusive child nodes that maximize within-node homogeneity and between-node heterogeneity. This branching recurs for each new node.
In recent years, RP has emerged as a promising ML approach for IRT-based DIF detection in single-stimulus tests. One major advantage is the ability to incorporate both multi-category and continuous covariates into the partitioning, with the branching cutoffs determined organically based on the data. RP is expected to uncover complex and intricate interactive DIF, which traditional techniques cannot. Owing to these strengths, RP has gained increasing research attention over the past decade as an innovative tool for detecting DIF in traditional single-stimulus tests (e.g., Bollmann et al., 2018; Finch et al., 2015; Strobl et al., 2013; Tutz & Berger, 2016). Such RP algorithm involves the following five key steps:
Starting with the full sample, perform grouping parameter calibration using the current sample of all respondents based on each covariate of interests. Calculate the selected splitting criterion (e.g., the log-likelihood test statistic) for each covariate of interests; Locate the maximum value among all calculated split criteria and consider the combination of covariate and split point represented by this maximum value as the first best split covariate and its best split point. Search for further best split covariate and its best split point based on Step 3. Recursively repeat steps 2–4 on each resulting node until stopping criteria are met.
Existing studies employing RP for IRT-based DIF detection can be grouped into two main categories: global and item-level approaches. Global-level methods, such as Rasch Trees (Strobl et al., 2013) and polytomous Rasch Trees (Komboz et al., 2016), detect parameter instability across covariates to identify regions where DIF occurs but fail to automatically identify items responsible for DIF. In contrast, item-level RP approaches, such as item-focused trees for the Rasch Model (IFT; Tutz & Berger, 2016) and item-focused trees for the Partial Credit Model (PCM-IFT; Bollmann et al., 2018), enable the simultaneous identification of both items and variables responsible for DIF. Item-level methods generate tree diagrams that visualize which items exhibit DIF at which levels of which covariates and in which ways. This granular information facilitates focused review of potential DIF sources (Finch et al., 2015). Thus, item-level RP approach is more useful for leveraging DIF outcomes to improve test development and fairness.
The Present Study
To our knowledge, published studies on DIF detection using RP techniques have been limited to single-stimulus tests. While promising results have been demonstrated, its effectiveness in MFC tests has not yet been thoroughly investigated. In this study, we designed a RP-based method to detect both the main effect DIF and interactive DIF in MFC tests and evaluated its efficacy with simulation. The proposed method seeks to enhance the power of detecting MFC DIF related to ordered and continuous covariates without predefined protected classes through data-optimized grouping. Furthermore, it is designed to simultaneously identify item blocks and covariates responsible for DIF, holding significant practical implications for improving the validity and fairness of MFC tests in high-stakes personnel selection.
In what follows, we first introduce the Thurstonian IRT model, a statistical model used to fit forced-choice response data in this study. Second, we provide detailed information on the procedures of the proposed method. Third, we evaluate the proposed method's performance using three Monte Carlo simulation studies. In the fourth section, we present an empirical example that illustrates the applicability of the proposed method using a dataset derived from a well-validated MFC test collected in a real-world setting. Lastly, we discuss the limitations of the current study and offer recommendations for future research aimed at enhancing the capabilities of the proposed method.
The Thurstonian IRT Model
Thurstone (1927) introduced Thurstone's Law of Comparative Judgment to describe the respondents’ response process when responding to an MFC item block. He argued that for two statements, i and k, paired in an item block j, respondents reacted independently to each one, and each produced a utility, that is, ti and tk. He assumed that:

The Thurstonian IRT (TIRT) model was proposed by Brown and Maydeu-Olivares (2011) and used to fit the response data generated from the MFC questionnaires. Assuming that the utility is a linear function of the latent trait being measured, the utility values 

As the latent traits and errors were normally distributed, 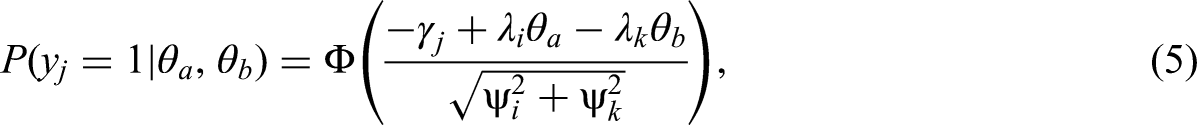
The Proposed Method for Detecting Both the Main Effect DIF and Interactive MFC DIF
Differential Item Functioning for the Thurstonian IRT Model
In the TIRT model, we can model the DIF by specifying separate equations for the two groups of interest using the following expression: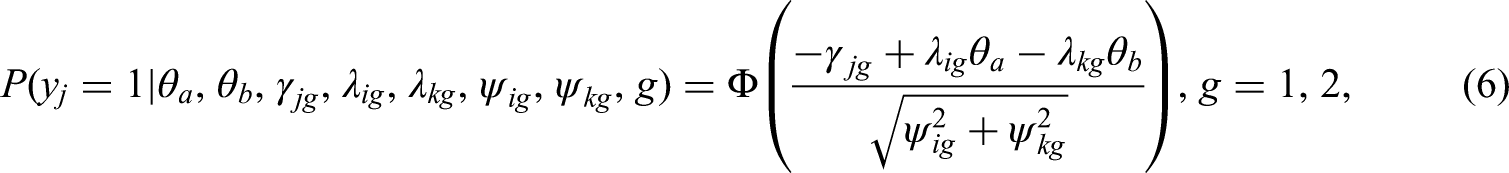
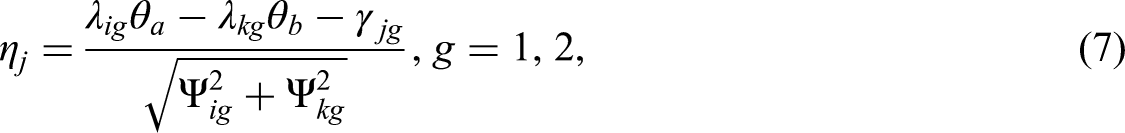
According to Lee et al. (2021), DIF in the TIRT model can manifest in one of three scenarios: only loading parameters (λ), only threshold parameters (γ), or both loading and threshold parameters. These scenarios correspond to DIF at the statement level, pairwise comparison level, and both levels simultaneously, respectively. When examining DIF at the MFC item block level, it is important to note that DIF may occur even when all statements within the block are individually invariant. Therefore, a robust approach is to perform simultaneous DIF detection for both the loading and threshold parameters of each item block, as testing one parameter alone may lead to inaccurate conclusions.
The Procedures of the Proposed Method: the Block-Based Sequential Recursive Partitioning Trees
This paper proposes the Block-based Sequential Recursive Partitioning Trees method to detect MFC DIF in MFC tests, abbreviated as MFC-BSRPT. This method combines recursive partitioning technique with the TIRT model to grow a DIF tree for each studied item block. We first estimate the item parameters of the item block based on response data from respondents of different two subgroups (i.e., focal and reference groups) at each splitting point, then, based on binary splits, sequentially grow a recursive partitioning tree for each item block using a selected split criterion, and finally generate a tree diagram that displays where DIF is present by which cutoff of which covariate and in what ways. To aid understanding, we provide a flow chart of the procedure (see Figure 1). Below we elaborate on the detailed procedures and technical details of the proposed method taking a single studied item block as an example.
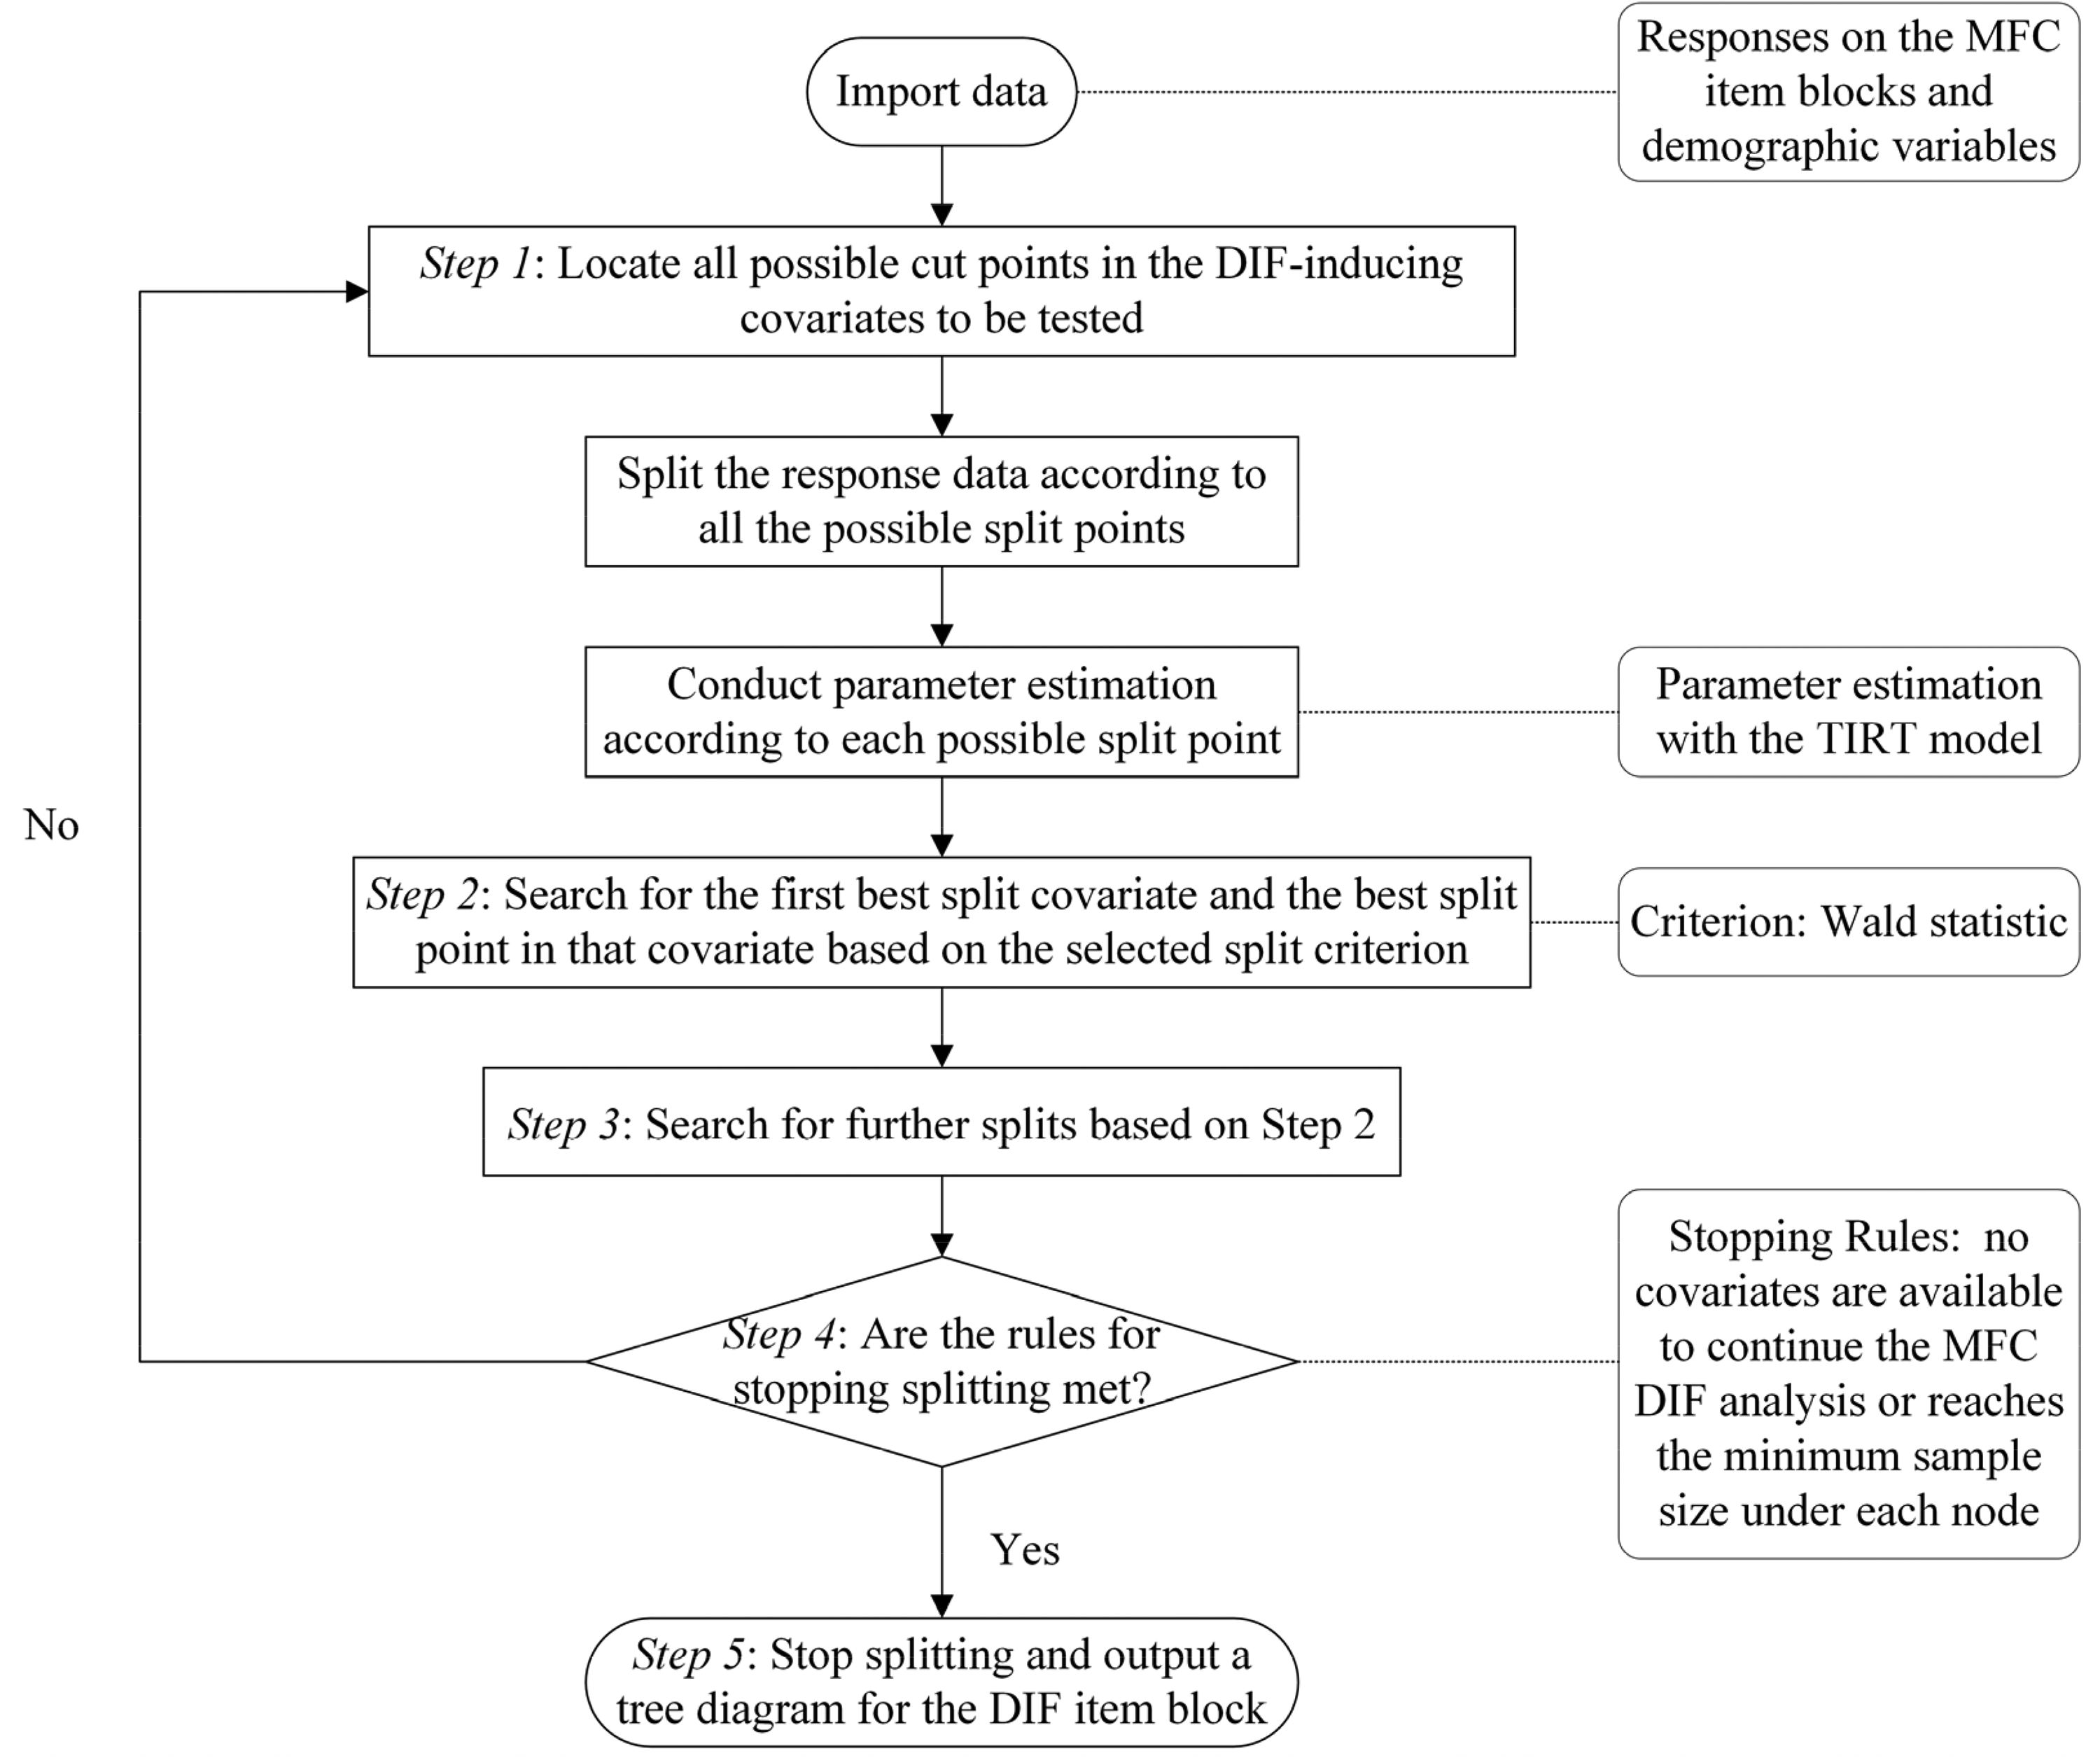
A flow chart of the fitting procedures for the proposed method.
Step 1: Locate All Possible Cut Points in All Available Covariates
Two key issues must be considered when growing a tree: (1) how to select a covariate for a node and identify the best cut point for the selected covariate, and (2) when to stop growing the tree. These issues are explained in subsequent sections.
To grow a tree, one must identify all possible cutpoints within the covariate space. The covariate space refers to all levels of all covariates of interest, and these covariates could be categorial, ordered, or continuous. Notably, while all possible levels with multi-category and ordered covariates are countable, the levels for a continuous covariate have infinite choices. Therefore, in order to locate cutpoints suitable for dichotomizing the continuous covariate to facilitate DIF detection, we need to determine countable and meaningful levels for continuous covariates. In general, a common approach is to consider the number of decimal places reserved for each cutoff. For example, Strobl et al. (2013) took each possible cutoff value that was used to dichotomize the continuous covariate to two decimal places.
At each node, a covariate is selected and we divide all respondents of the full set A into two subgroups (i.e., focal and reference groups), that is, two subsets A1 and A2, which are denoted by the following equation:
Let 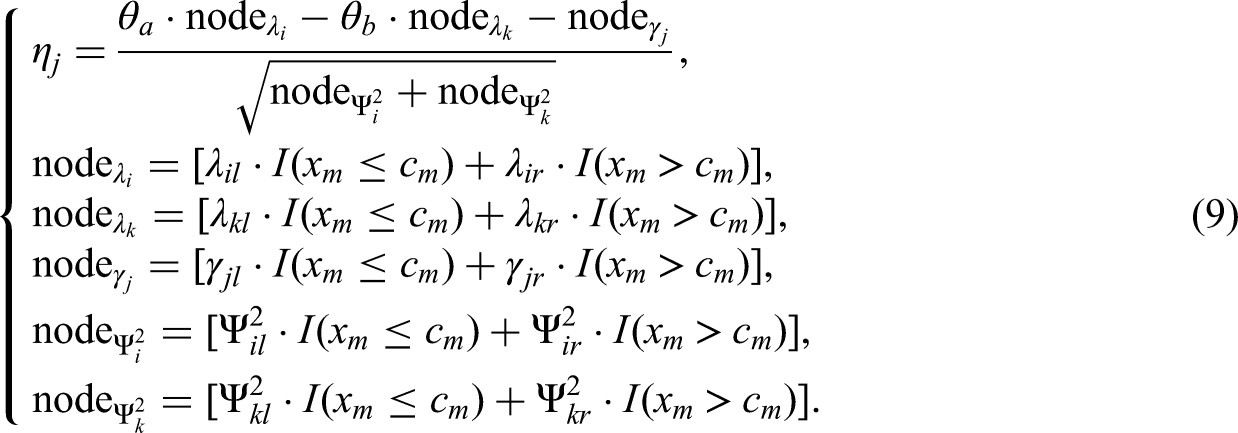
Step 2: Search for the First Best Split Covariate and the Best Split Point Based on a Split Criterion
After locating all possible cut points in all available covariates, the algorithm searches for the optimal split of each covariate by applying a selected split criterion. According to Tutz and Berger (2016) and Strobl et al. (2009), there are two commonly accepted split criteria in tree-based modeling approaches: (a) impurity measures such as the Gini Index or Shannon Entropy, and (b) test-based splits such as the log-likelihood test statistic. Test-based splits assess whether the current child node requires further partitioning based on the corresponding test statistic. Because this study utilizes the TIRT model, we chose the test-based split criterion for the proposed method.
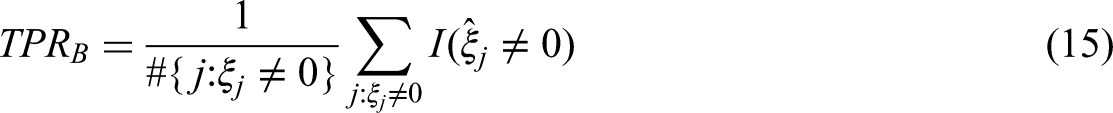
In general, any statistic which has been shown to perform well in identifying MFC DIF can serve as a test statistic. In this study, we chose the Wald statistic. Based on Lee et al.'s (2021) study, the Wald statistic 
One issue that must be addressed before using the Wald statistic for MFC DIF detection is how to obtain comparable item parameter estimates for the different subgroups of respondents. In this study, we used a well-validated method named the free baseline DIF testing approach employed by Lee et al. (2021). The procedures of this approach are as follows. First, an anchor subset consisting of one or more DIF-free item blocks should be identified, which ensures a common metric between groups when conducting TIRT parameter calibration. Then, conduct parameter calibration. For anchor items, get parameter calibrated with the TIRT model in which the parameters of all anchor item blocks are constrained to be identical between groups; for all the remaining item blocks, parameters for these item blocks were freely estimated across groups. Finally, examine the equivalence of parameters using the omnibus 6-df Wald tests in the current block. Lee et al. (2021) found that, as the sample size and DIF magnitude increased, power approached 1.0 and Type I error rates approached the nominal level (.05). Therefore, the Wald statistic based on free baseline testing is adopted as the selection criterion for the proposed method.
To identify the first best split covariate and its best cut point, the algorithm fits the TIRT model to different grouped response datasets, and these datasets are generated by splitting the original response data based on all possible cut points in the covariates being examined. After parameter calibration, the algorithm employs the null hypothesis H0:
In general RP applications, a covariate is allowed to be reused for different nodes of the same tree. However, in the proposed method, we set a restriction that each covariate is not allowed to be reused. More specifically, once the first best split covariate m is identified, it is excluded from further consideration during subsequent search iterations within the same block. This restriction was performed for two main reasons: (1) to control for Type I errors due to the multiple testing on the same covariate and (2) to reduce the complexity of the tree structure to improve interpretability of the proposed method.
Step 3: Search for Further Splits Based on Step 2
After identifying the first best split covariate and its best cut point, the method will continue to search for the subsequent best split covariates from the remaining covariates and their best split point. Specifically, the algorithm will re-calibrate the TIRT model item parameters using the subset of response data that belong to the current node only, and then re-compute the corresponding Wald statistics. Then, the algorithm locates the optimal combination of covariate and split point corresponding to when the Wald statistic is maximized.
Take the established right child node (i.e., 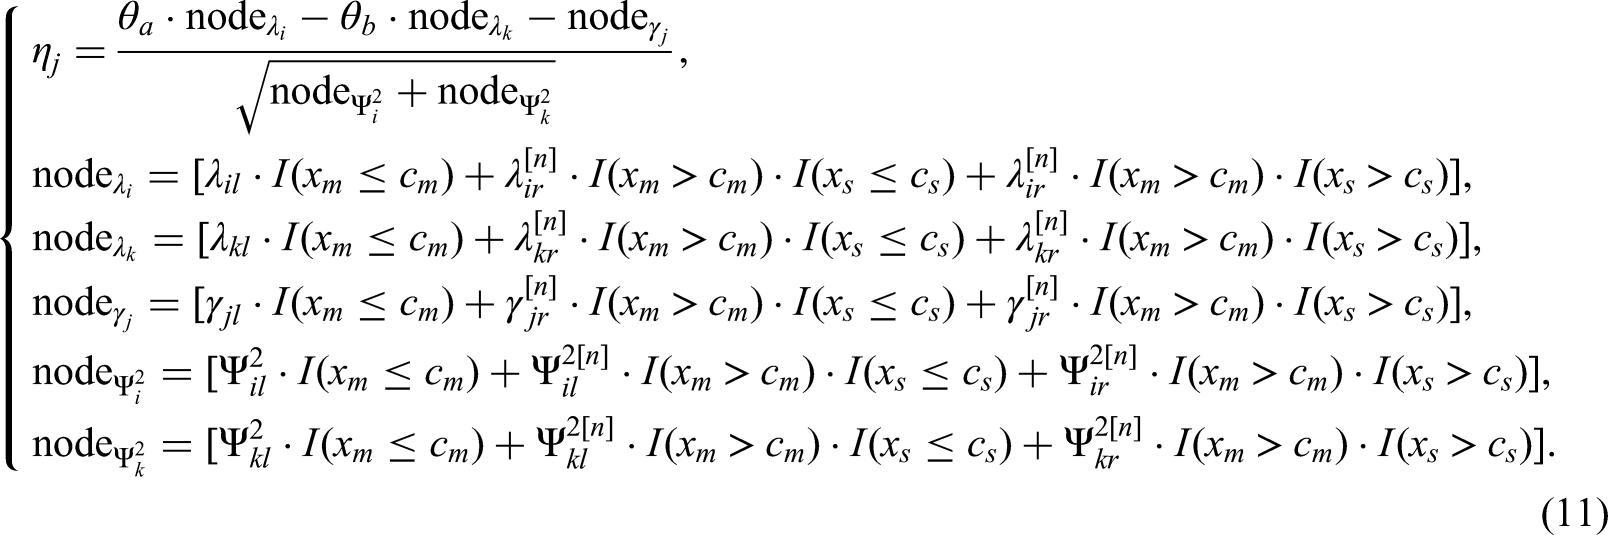
Step 4: Repeat Steps 1 to 3 Until the Stopping Rules are Met
Given that the data is recursively partitioned, the subsequent nodes are assigned smaller sample sizes. Therefore, a rule must be implemented to ensure an appropriate sample size of observed responses for accurate parameter estimation. The stopping rules for the proposed algorithm include: a) no covariates remain to continue the MFC DIF detection, or b) the sample size of a node drops below the threshold (e.g., 100 respondents). When a child node satisfies either of the above rules, the algorithm ceases to split further. After the algorithm is terminated, the proposed method will utilize the significant level of the final Wald statistics representing each established child node, which is the maximum value among all possible splits, to determine whether the item block exhibits DIF or not. Specifically, because a large number of significance tests are being performed at a time, the problem of multiple testing needs to be addressed, and the family-wise type I error needs to be controlled. We propose four different methods to control the type I error using the adjusted local significance level and/or DIF effect sizes. See the section titled “Controlling the Type I Error” after Step 5 for the details. If none of the Wald statistics exceeds the significance threshold, the proposed method would conclude that the current block is DIF-free.
Step 5: Terminate DIF Detection and Output a Tree Diagram Presenting the MFC DIF Form of the Current Item Block
It is crucial to note that tree diagrams are unnecessary for DIF-free item blocks on all the covariates that are incorporated into the MFC DIF detection. However, for DIF item blocks, a tree diagram is essential to illuminate which covariates generate DIF and their corresponding forms of MFC DIF. To aid potential practitioners’ understanding, Figure 2 presents four schematic tree diagrams, each representing a different MFC DIF form. Each child node of the tree represents a subgroup, and all TIRT model item parameters (i.e., λ and γ) for the current item block on the current subgroup are displayed in that child node. Solid or dashed arrows are used to indicate which covariates induce or do not induce MFC DIF, with solid lines signifying the presence of MFC DIF and dashed lines indicating its absence. While both item blocks 1 and 2 exhibit the main effect DIF, the difference lies in that item block 1 exhibits DIF solely on age, while item block 2 exhibits DIF on both the age and gender. In contrast, both item blocks 3 and 4 exhibit the interactive DIF, but there are differences in their MFC DIF forms. Specifically, the DIF in item block 3 is induced solely by the interaction between the two covariates, whereas the DIF in item block 4 exhibits main effect DIF on age in addition to being induced by the interaction between the two covariates.
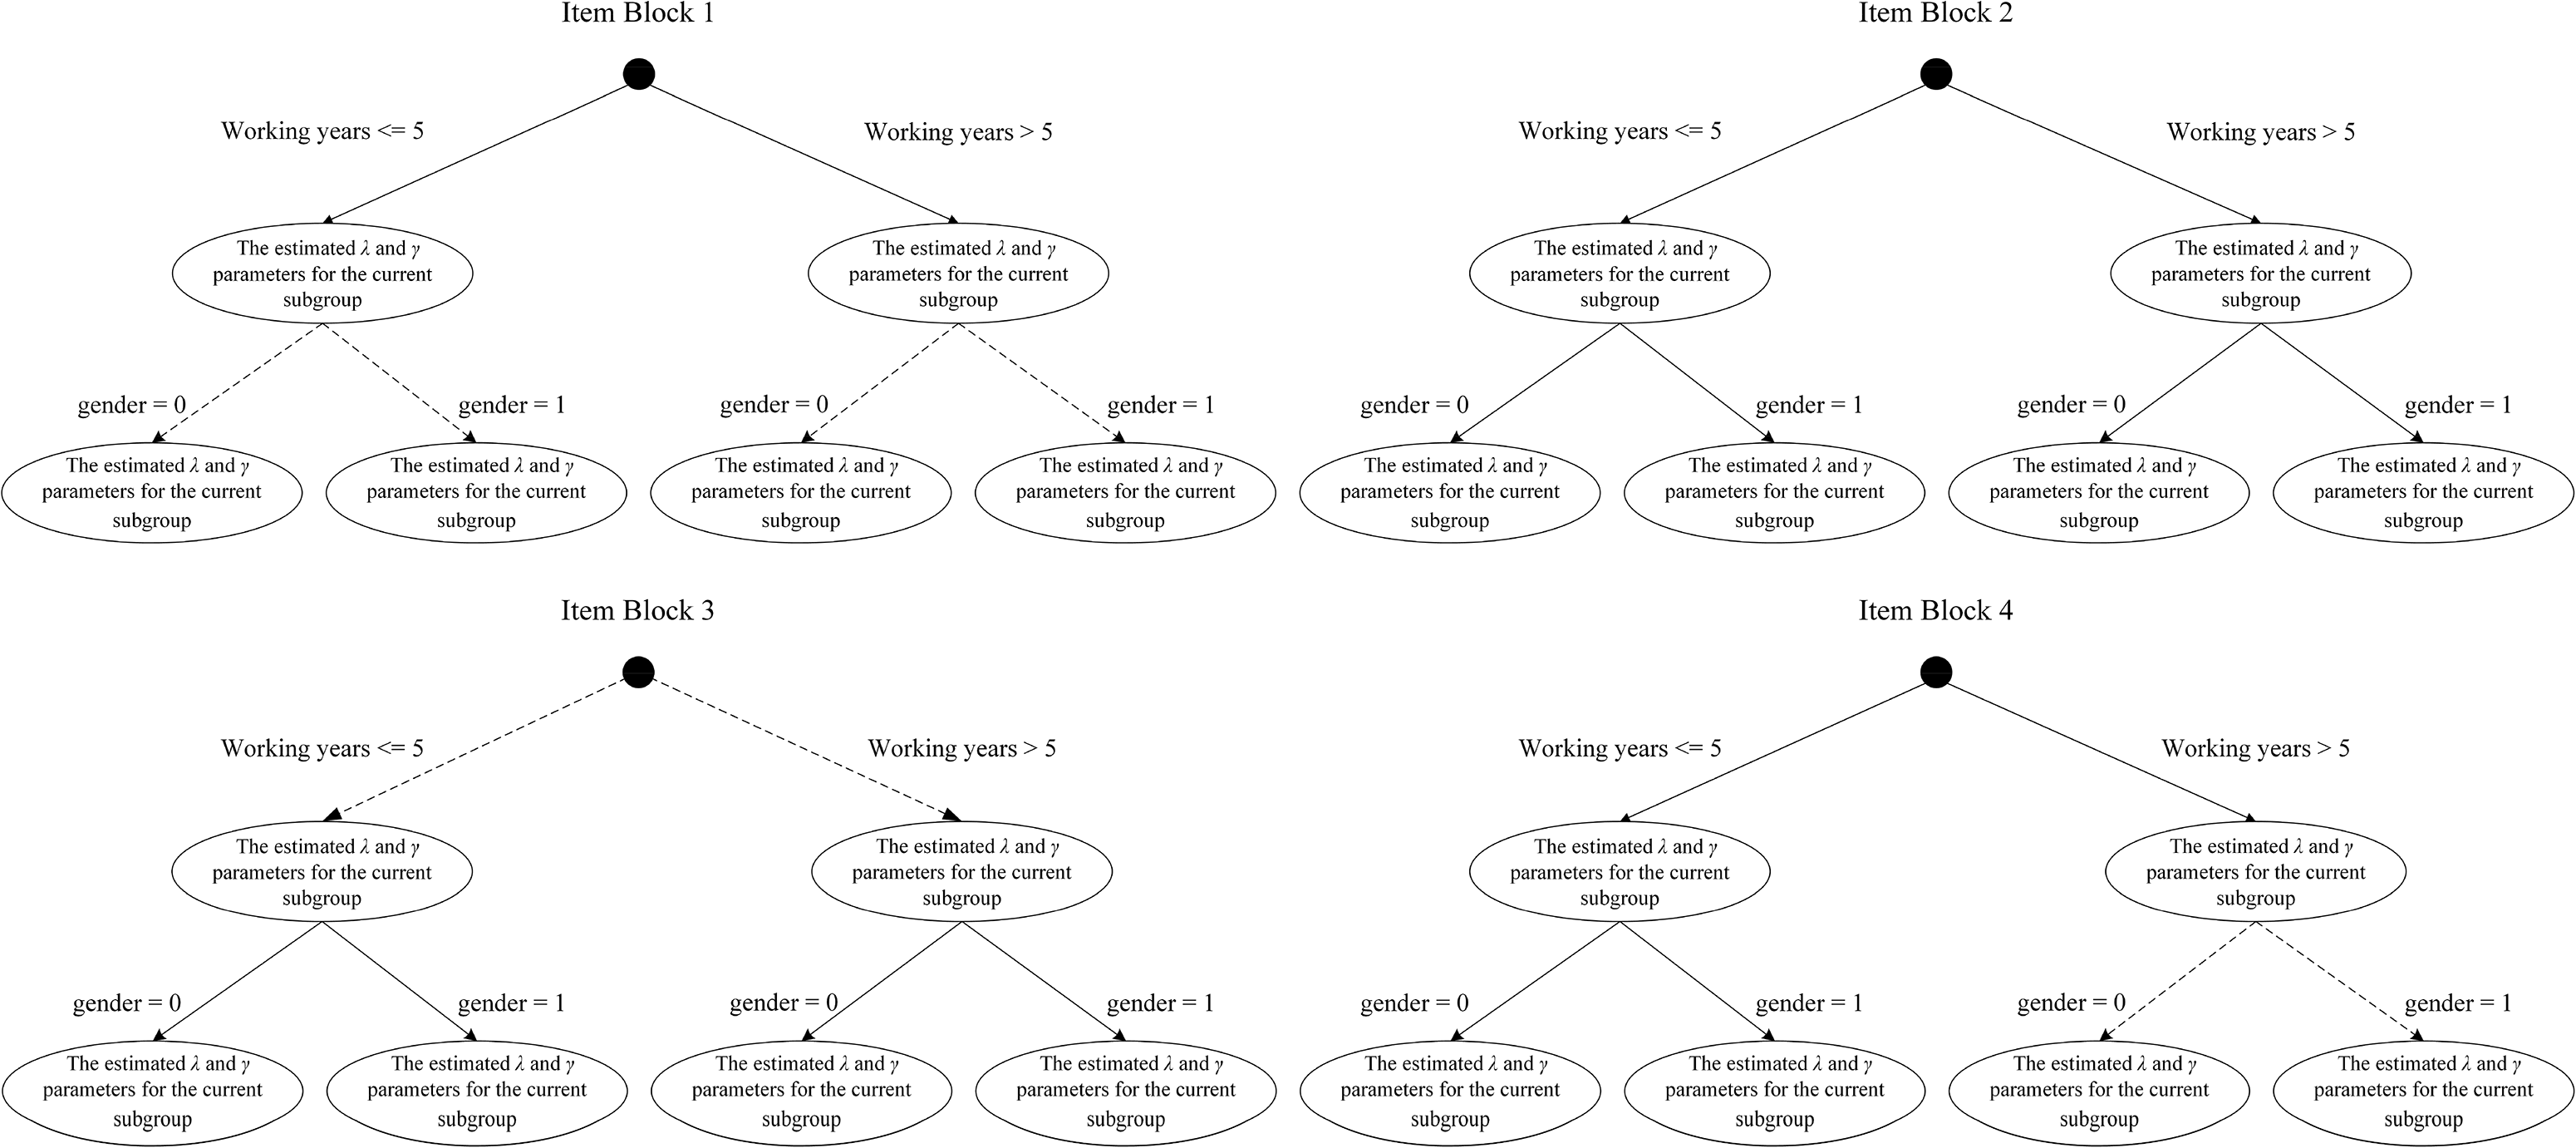
Schematic tree diagrams of different MFC DIF forms for different item blocks of a MFC test.
Controlling the Type I Error
Compared to existing MFC DIF detection methods, the potential advantage of the proposed method is in its ability to not only detect MFC DIF by multiple covariates simultaneously in a single algorithm, but also to handle ordered, multi-category and continuous covariates in addition to binary covariates, all with the same algorithm. However, the problem of multiple testing needs to be addressed. For the proposed method, whether performing inter-covariate DIF detection (i.e., simultaneous DIF detection of multiple covariates) and intra-covariate DIF detection (i.e., simultaneous DIF detection at multiple possible levels to dichotomize each multi-category, ordered or continuous covariate), the proposed method involves multiple DIF testing. And it is possible that small or trivial DIF effects may be detected in item blocks that do not actually exhibit DIF in a covariate, especially for the multi-category, ordered and continuous covariate, which may lead to inflated false alarms.
An important concept in the statistical literature on multiple testing is the familywise error rate. According to Benjamini and Hochberg (1995), the familywise error rate refers to the probability of at least one false rejection when a family of null hypotheses is tested simultaneously. In the proposed method, it corresponds to the probability that, for an item block, at least one of the Wald tests conducted among multiple covariates and multiple possible dichotomization levels within each covariate is falsely positive, making a Type I error, and flagging the item block as a DIF item block. Following the suggestion of Tutz and Berger (2016), if one wants to control the familywise error rate by a global significance level α in DIF detection, one has to use much smaller significance levels in the single tests, that is, one should adjust the local significance level based on the global significance level.
To effectively control for the family-wise Type I errors for the proposed method, we implemented the Bonferroni adjustment in this study. The Bonferroni adjustment divides the overall significance level α (here set as 0.05) by the number of hypotheses under examination, yielding the local significance level for the Wald test applied to each item block and covariate. This adjustment accounts for the increased probability of false positives due to multiple testing, thereby ensuring that the probability of incorrectly identifying a DIF-free item block as a DIF block is controlled at or below α. It is worth noting that, in this study, when adjusting the local significance level in the multiple DIF testing using the Bonferroni adjustment, the denominator for α can be set in two ways: (1) the number of covariates requiring DIF testing, and (2) the number of different possible levels at which each covariate requiring DIF testing is dichotomized. For a binary covariate, only the first option is applicable; For multi-category, ordered, or continuous covariates, both options are applicable.
In addition to the Bonferroni adjustment, Nye (2011) noted that incorporating DIF effect size estimation indices, a measure of practical significance, can potentially remedy the weaknesses of hypothesis testing (i.e., statistical significance) and potentially mitigate Type I errors. For the MFC test, Lee et al. (2021) proposed to calculate the MFC DIF effect size for each item block, an adaptation of Nye's (2011) method, as depicted in the equation below.
Furthermore, Nye (2011) pointed out that, within the IRT framework, a DIF effect size of 0.1 is considered small. Therefore, one can consider this value as a threshold to dichotomize the DIF effect size continuum into a binary classification, and then combine both the significance of the p-value and this binary classification to determine whether the current item block exhibits DIF. The procedures for controlling Type I errors using the DIF effect size are as follows. First, the Wald statistic and its p-value are output at each child node created after recursively partitioning the current block using the proposed method. Next, the average DIF effect size estimate for each child node within the current block is calculated using Equation 12. Finally, the significance of each child node's p-value and its average DIF effect size are combined to further determine whether DIF is present in the current block (i.e., the first two rows in Table 2). Specifically, for an item block to be flagged as a DIF item block requires that the following criterion must be met: the p-value on any established child node is below the adjusted local significance level, and the average DIF effect size estimate of that node should also be greater than or equal to 0.1.
Potential Strategies for Controlling Type I Errors in the Proposed Method.
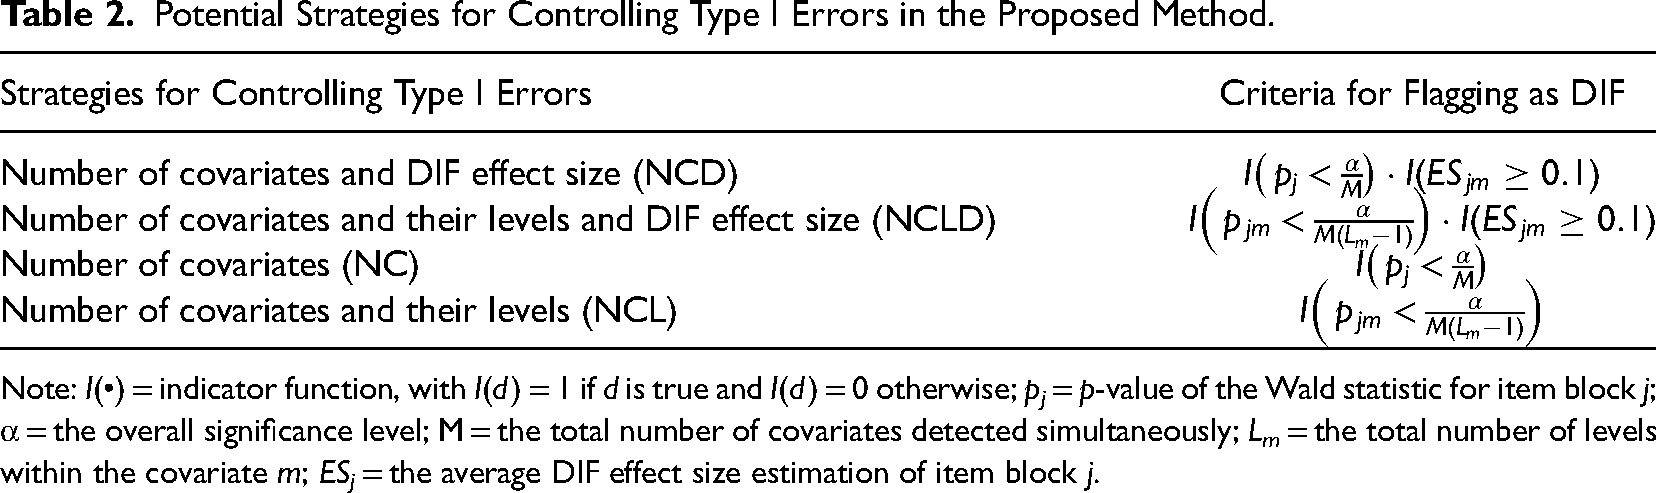
Note: I(•) = indicator function, with I(d) = 1 if d is true and I(d) = 0 otherwise; pj = p-value of the Wald statistic for item block j; α = the overall significance level; M = the total number of covariates detected simultaneously; Lm = the total number of levels within the covariate m; ESj = the average DIF effect size estimation of item block j.
In the present study, four possible strategies for controlling type I errors in the proposed method are outlined in Table 2, depending on the different Bonferroni adjustment perspectives and whether the average DIF effect size estimate is included. Through these strategies, we hope to provide effective guidance to potential users and ensure a more rigorous and meaningful assessment of DIF, while reducing the risk of identifying spurious effects due to the multiple testing.
Simulation Studies
Three simulation studies were conducted to investigate the three main research questions. Study 1 aimed to compare the DIF detection performance of the proposed method with that of an existing method in the field of MFC DIF detection, under different MFC DIF forms in the presence of two binary covariates. Study 2 investigated the ability of the proposed method to detect MFC DIF in the presence of both a binary covariate and an ordered covariate under different forms of DIF in a more realistic scenario. The scenario considered a true latent trait correlation matrix from a well-validated personality scale, more latent traits, and more item blocks in the MFC test, which is intended to more accurately reflect real-world data. Study 3 further investigated the performance of the proposed method under different DIF forms when there is both a binary covariate and a continuous covariate. All the simulation codes used in the three studies can be found at https://osf.io/b98dy/.
Study 1
Design
To enable a comprehensive comparison between the proposed method and an existing method (i.e., omnibus Wald tests on loadings and thresholds; Lee et al., 2021), we included two binary covariates, x1 and x2. In the present study, we adopted most of the simulation conditions used in the study of Lee et al. (2021). These conditions comprised 10 MFC item blocks, three measured latent traits, and three statements within each block (i.e., a triplet). This format has been used extensively in MFC research (e.g., Bürkner et al., 2019; Guenole et al., 2018; Lee et al., 2021; Ng et al., 2020) due to its reduced cognitive load and enhanced measurement accuracy compared to other formats like pairs and tetrads. Additionally, seven additional factors were manipulated as follows:
The percentage of blocks that exhibit DIF: (a) 0% and (b) 10%. Type of noninvariant item parameters of the TIRT model: DIF on (a) loading parameter (λ), (b) threshold parameter (γ), and (c) both loading and threshold parameters. DIF size: (a) 0.3 (i.e., 0.3 increase in focal group's loading and/or threshold parameter) and (b) 0.6 (i.e., 0.6 increase in focal group's loading and/or threshold parameter). In previous DIF studies (e.g., Kim et al., 2016; Lee et al., 2021; Stark et al., 2006), these effect sizes were commonly defined as small and large, respectively. MFC DIF detection method: (a) omnibus Wald tests on loadings and thresholds (abbreviated as OWT; Lee et al., 2021) and (b) the proposed method, i.e., MFC-BSRPT. We selected the OWT method for comparison with our proposed method because it can detect MFC DIF at the item block level. We excluded certain other methods, such as the MFC-based logistic regression method (Chen & Wang, 2014), DSF-based methods (Qiu & Wang, 2021), and multiple group confirmatory factor analysis of the TIRT model (Lee & Smith, 2020b), as they are not designed to detect MFC DIF at the item block level. Number of noninvariant item parameters under a specific noninvariant item parameter type within an item block: (a) 1, (b) 2, and (c) 3. When selecting a noninvariant item parameter type, it was important to consider not only the type itself, but also how many parameters in the block exhibited DIF for that type. For example, in a triplet with three loading and three threshold parameters, if we assumed that the DIF was related to the loading parameter in the MFC form, we needed to determine exactly how many loading parameters exhibited DIF. MFC DIF form: (a) only the main effect DIF, (b) only the interactive DIF, and (c) both main effect DIF and interactive DIF. The sample size per group: (a) 500, (b) 1,000, and (c) 2,000. These three levels correspond to a total sample size of 1,000, 2,000, and 4,000, respectively. Regarding the sample size of MFC response data, previous simulation studies using the TIRT model have mainly used large samples (e.g., 1,000, 2,000, or 4,000) (Brown & Maydeu-Olivares, 2011, 2012).
The sample sizes were equal across different levels of the same covariate. The total number of simulation conditions was 330 (0% of MFC DIF item blocks could not be meaningfully crossed with factors 1, 2, 3, 5, and 6; therefore, the 318 extraneous conditions were removed). For each condition, we performed 50 replications. All simulation code were written in R version 4.1.1 (R Development Core Team, 2021). To implement the proposed method, we utilized two R packages, thurstonianIRT (Bürkner et al., 2019) and MplusAutomation (Hallquist & Wiley, 2018), and the Mplus software (Version 8.0; Muthén & Muthén, 2017). In these two R packages, the former automatically generated the Mplus syntax for fitting MFC response data to the TIRT model and performing DIF detection, while the latter facilitated the use of Mplus for complex projects in R, such as Monte Carlo simulation studies or the comparison of many methods. It is important to note that the thurstonianIRT package cannot be directly applied for DIF detection. We have therefore made appropriate adjustments to its original R code.
Data Generation
To generate response data for DIF-free item blocks, we followed these steps: (1) Latent trait vectors were drawn from a multivariate normal distribution with a mean vector of 0 and a covariance matrix denoted as: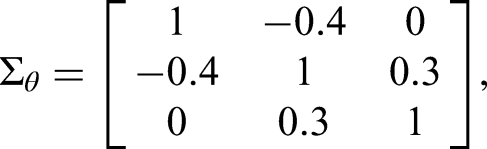

The process of generating data for DIF item blocks followed the same procedure as outlined above, with one exception in Step 4. Under the DIF condition, Step 4 involved manipulating certain item parameters (i.e., λ and/or γ) of the focal group of DIF item blocks. For this study, we created MFC DIF by manipulating the item parameters of Item Block 3, which was designated as the DIF block with a 10% DIF proportion in the MFC test. Table 3 illustrates the simulation of the different DIF forms used to manipulate the item parameters of Block 3.
True Simulated Differences of Item Parameters for Different DIF Forms Under the Comparison of Focal and Reference Groups.
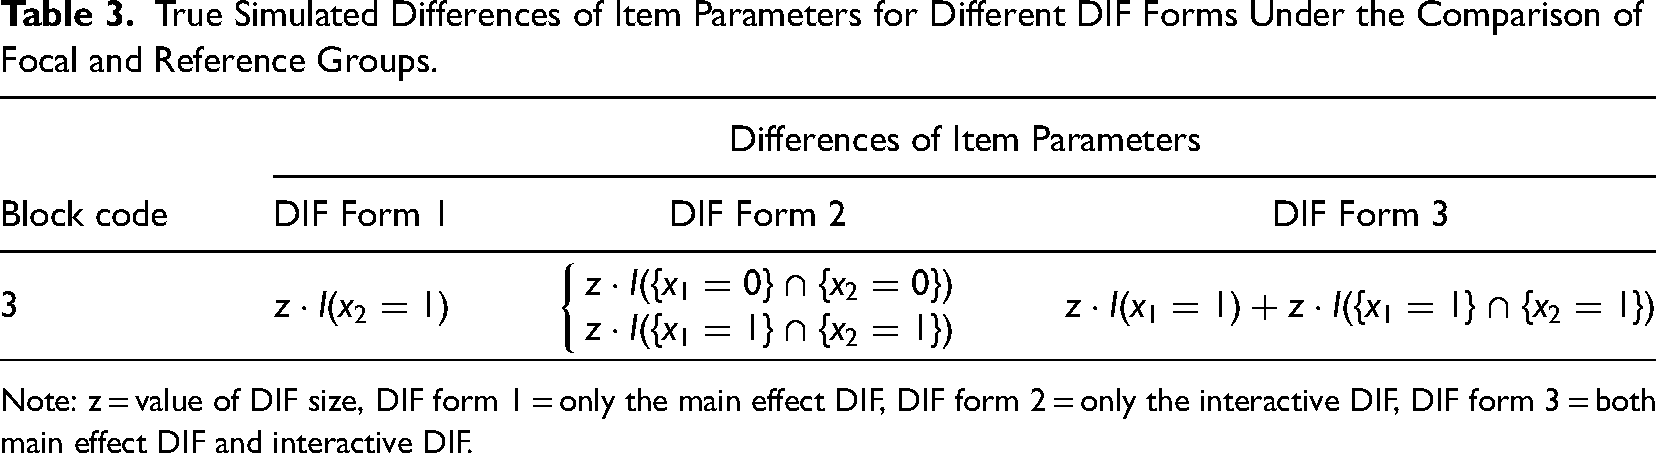
Note: z = value of DIF size, DIF form 1 = only the main effect DIF, DIF form 2 = only the interactive DIF, DIF form 3 = both main effect DIF and interactive DIF.
We also provide a simple example illustrating how to generate DIF data to aid understanding. Based on the assumption that the first two loading parameters of Block 3 (i.e., statements 7 and 8) exhibit main effect DIF on the covariates x1 and x2, and that these parameters also exhibit interactive DIF due to the interaction between these two covariates, we use the following equation to simulate responses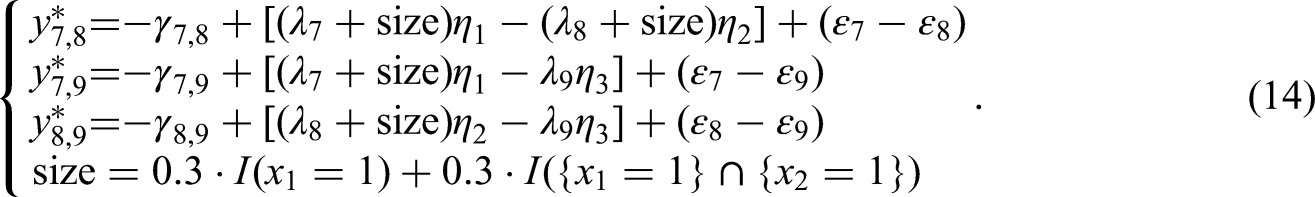
Parameter Estimation and DIF Detection
In this study, we utilized the mean-and-variance-adjusted unweighted least squares (ULSMV) estimator in Mplus, following the recommendation of Brown and Maydeu-Olivares (2011). This was done to facilitate the fitting of multigroup TIRT models with constrained item parameter estimates, specifically applied to data partitioned by varying split points. To ensure comparability of item parameter estimates across subsamples, a pre-defined anchor subset (Blocks 1 and 2) was utilized prior to conducting DIF detection. In the process of generating the Mplus syntax, we set all studied MFC item blocks to perform unconstrained cross-group item parameter estimation, with the exception of the anchor subset, where the item parameters were constrained to be equal. As indicated by Lee et al. (2021), an MFC triplet's Wald statistic possesses 6 degrees of freedom (df). To ascertain the significance of each node and determine the optimal split covariate, we used the MODEL TEST command in Mplus and conducted a simultaneous 6-df Wald test for each block.
Evaluation Criteria
Let each block be characterized by a vector 1. TPR on the block level (TPRB) 2. FPR on the block level (FPRB) 3. TPR for the combination of block and variable (TPRBV) 4. FPR for the combination of block and variable (FPRBV)


Results of Study 1 for Power and Type I Error Rate
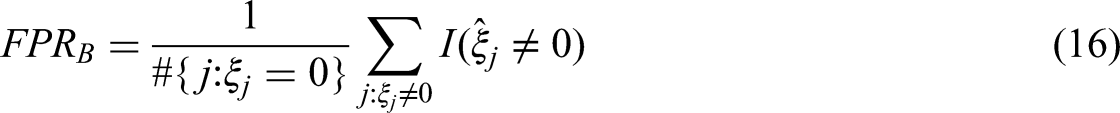
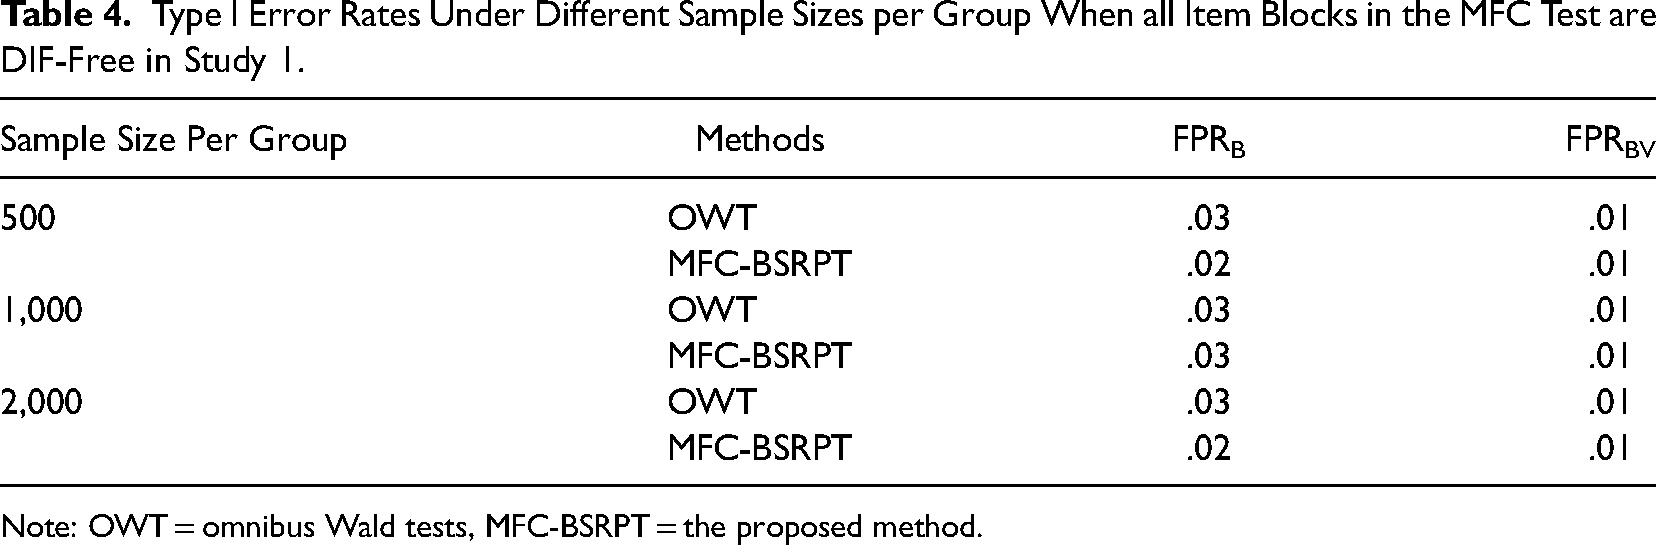
When all the item blocks in the MFC test were DIF-free, the false positive rates (a.k.a., Type I error rates) of the proposed method are presented in Table 4. Under a 10% DIF proportion in the MFC test, due to space constraints we only present the results under the condition of 2,000 per group in Table 5 of the main text. Please refer to Tables S1 to S3 and Tables S13 to S15 in the Supporting Information for the results from conditions with sample sizes of 500 or 1,000 per group. Notably, in Study 1, we found that when the two covariates were all binary, both the methods yielded acceptable Type I error rates even without considering DIF effect size estimation. Therefore, in Tables 4 and 5 of the main text, we only show the results when the strategy for controlling Type I errors was the number of covariates (NC). For simulation results of the proposed method when the strategy for controlling Type I errors was the Number of covariates & DIF effect size (NCD), see Tables S13 to S15 in the Supporting Information. Overall, as shown in Table 5, the performance of the two methods is comparable when the item block exhibits only the main effect DIF, while the proposed method shows better detection performance when the item block exhibits the interactive DIF compared to the conventional omnibus Wald tests. Subsequent sections analyze the impact of each manipulated factor on the experimental results.
Type I Error Rates Under Different Sample Sizes per Group When all Item Blocks in the MFC Test are DIF-Free in Study 1.
Note: OWT = omnibus Wald tests, MFC-BSRPT = the proposed method.
Simulation Results of 10% DIF Proportion Under Different MFC DIF Detection Methods and Different MFC DIF Forms When the DIF Size Is Large (Small) and the Sample Size per Group is 2,000 in Study 1.
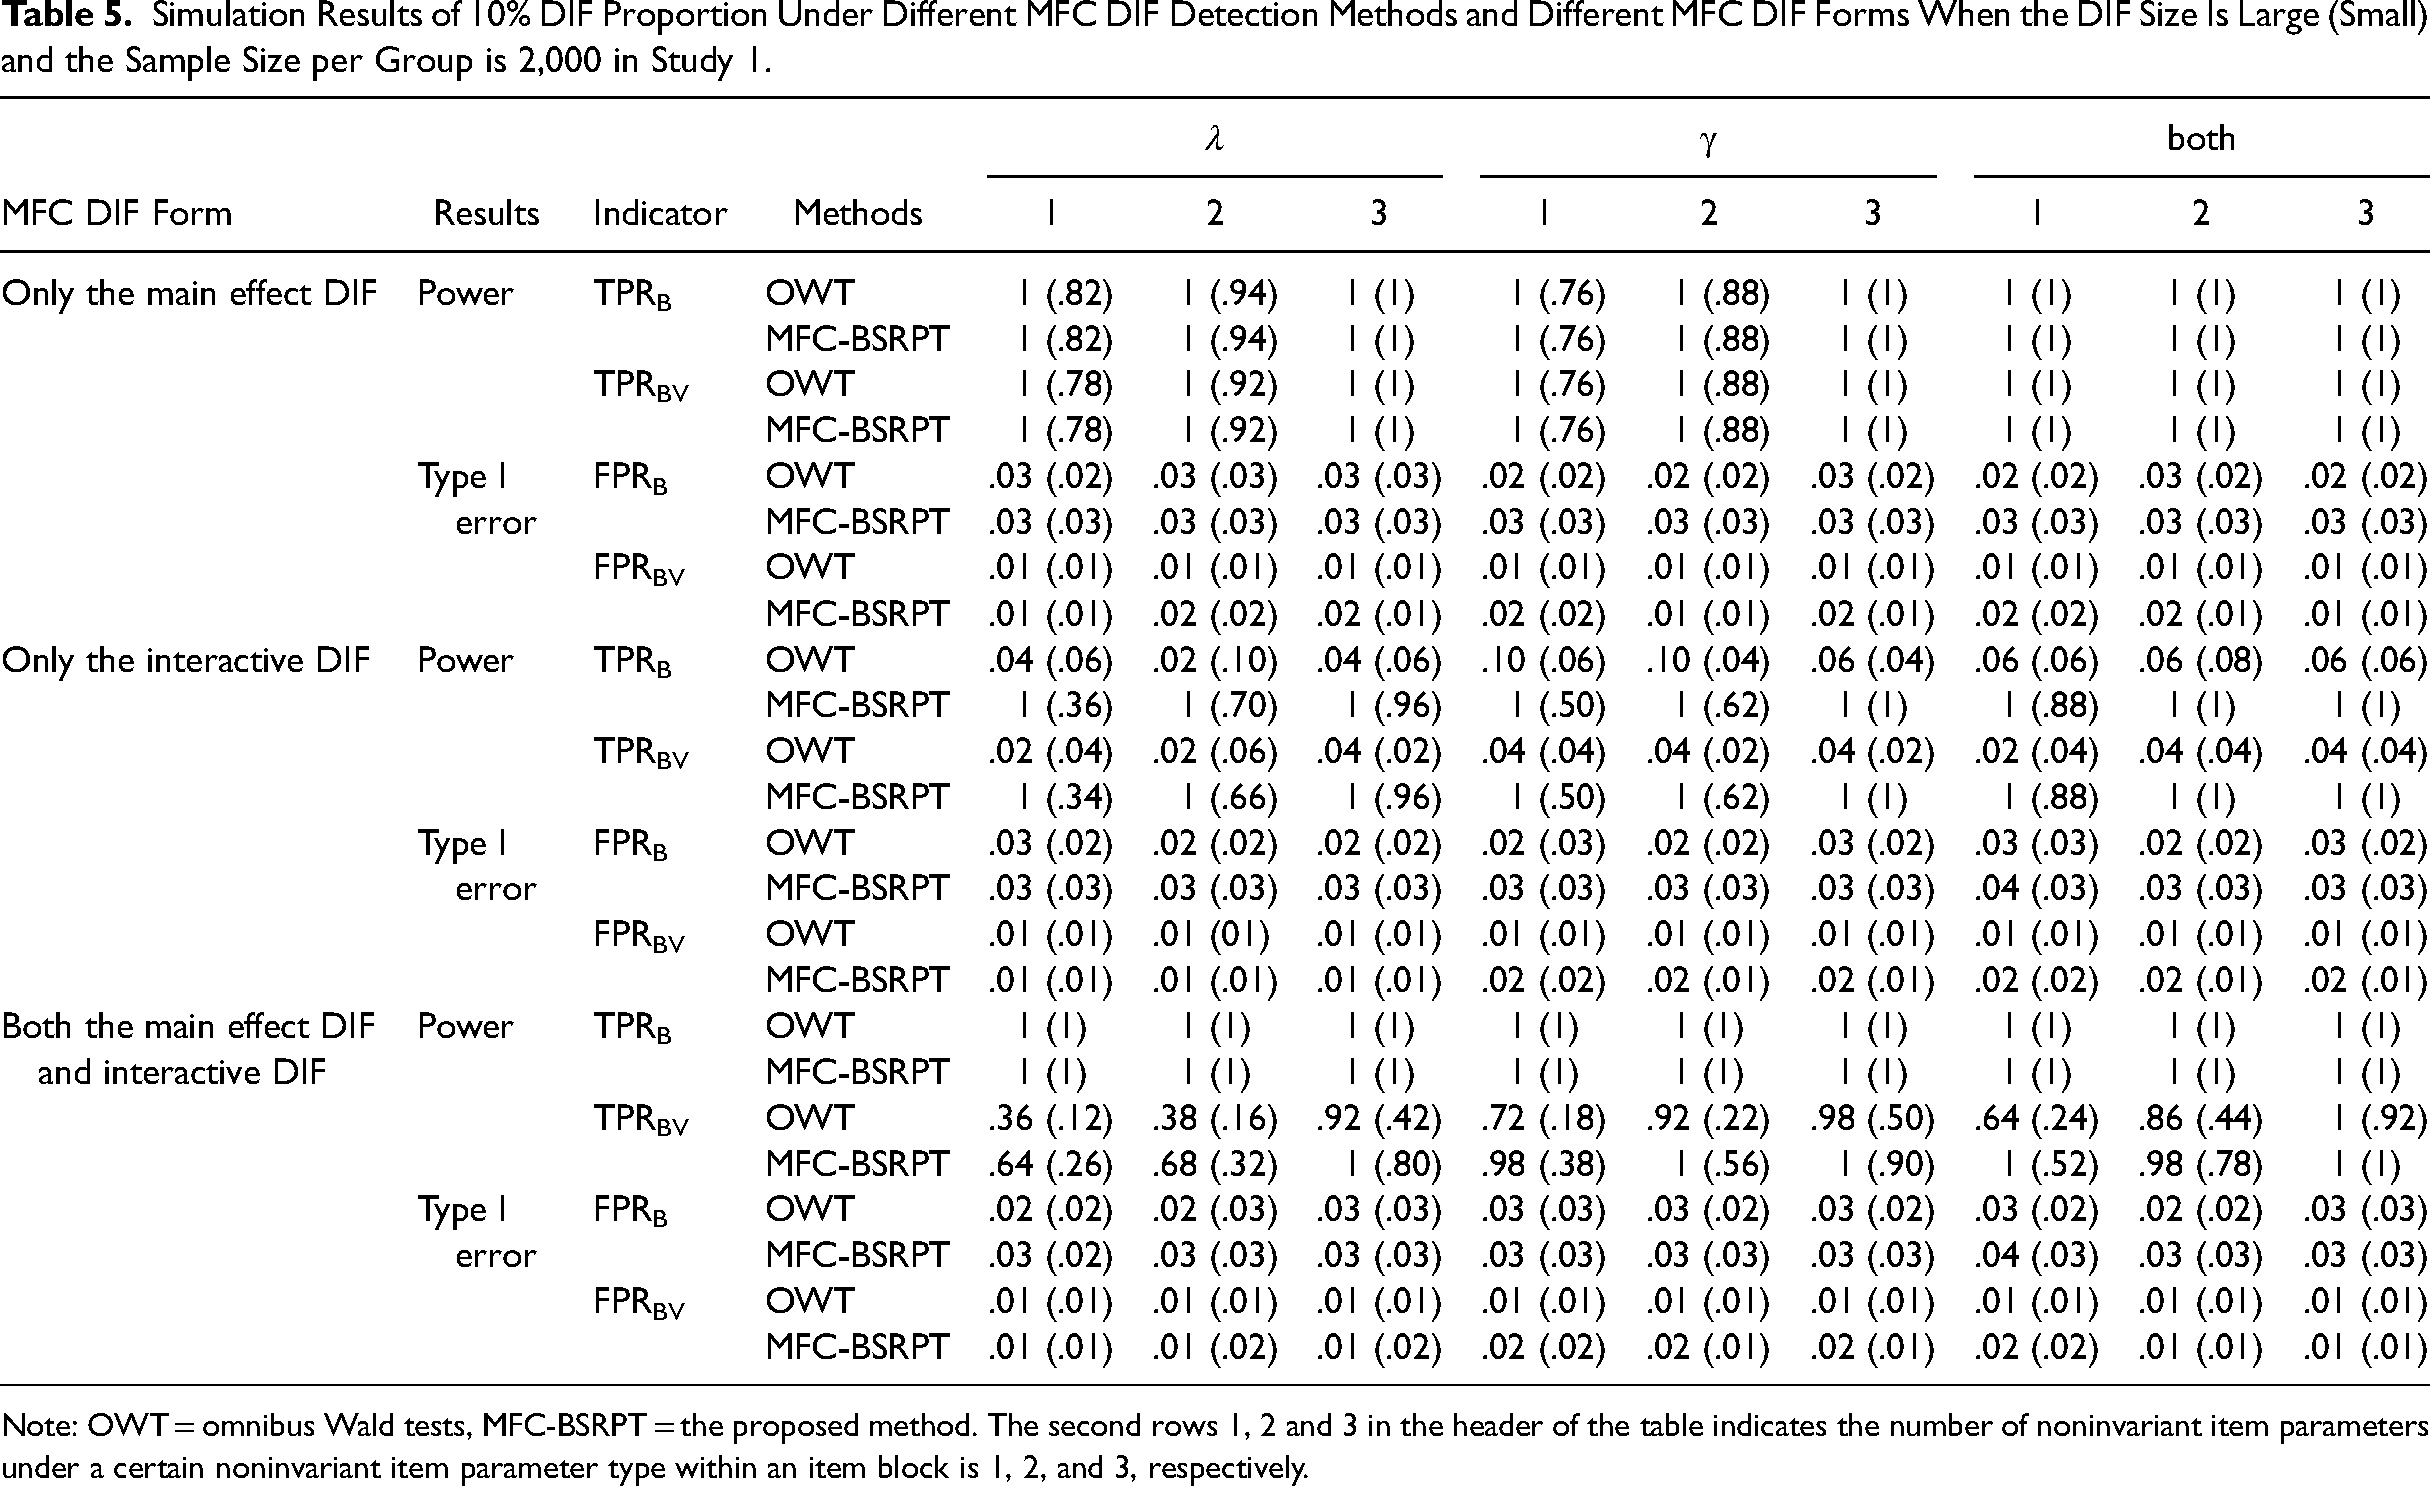
Note: OWT = omnibus Wald tests, MFC-BSRPT = the proposed method. The second rows 1, 2 and 3 in the header of the table indicates the number of noninvariant item parameters under a certain noninvariant item parameter type within an item block is 1, 2, and 3, respectively.
To improve the clarity and understanding of the results, we also generated Receiver Operating Characteristic (ROC) curves across different experimental conditions. In this study, the area under the curve (AUC) assesses the effectiveness of different MFC DIF detection methods in identifying DIF item blocks. A larger AUC indicates better detection performance. With a sample size per group of 2,000, a DIF proportion of 10%, a large DIF size (0.6), and two item parameters showing DIF within an item block under a specific noninvariant TIRT item parameter type, Figure 3 presents ROC curves under different conditions. These curves included different conditions such as MFC DIF form, detection method, and noninvariant item parameter type, both at the block level and the block-variable combination level. ROC curves for all other conditions are shown in Figures S1 to S17 in the Supporting Information. Overall, Figure 3 shows the better performance of the proposed method in detecting interactive DIF compared to the existing OWT method.
ROC curves across various conditions at a sample size per group of 2,000, a 10% DIF proportion, with a large DIF size (0.6) and two item parameters exhibiting DIF within an item block under a specific noninvariant TIRT item parameter type in Study 1.
Results of Study 1 for DIF Effect Size Estimates
In addition to power and Type I error rate, we calculated the DIF effect size estimates for all the experimental conditions. Due to space constraints, we only showed them in Tables S4 to S12 of the online Supporting Information. As shown in Tables S4 to S12, the DIF effect size estimation was promising to be used to identify the item blocks that exhibited DIF based on the significance test. Overall, the DIF effect size estimates calculated based on the proposed method were more accurate in revealing the existence of DIF than the DIF effect size estimates calculated using the existing OWT method. It is worth noting that under a smaller sample size (i.e., 500 respondents per group), the DIF effect size estimates performed poorly under both methods. However, as the sample size per group increased, the proposed method performed better on this indicator than the existing OWT method.
Study 2
Design
While Study 1 yielded encouraging results, it should be noted that the covariates used in this study were both binary. This was done to allow comparison of the omnibus Wald tests with the performance of the proposed method in detecting MFC DIF. However, in practical applications, covariates may have more than two levels. Unlike the omnibus Wald tests, the proposed method can handle covariates with multiple levels that may induce DIF. To further test the effectiveness of the proposed method, this study considered both a binary covariate x3 and an ordered covariate The percentage of item blocks that exhibit DIF: (a) 10% (i.e., Item Blocks 3 and 4), and (b) 30% (i.e., Item Blocks 3, 4, 5, 6, 7, and 8). Type of noninvariant item parameters of the TIRT model: DIF on (a) loading parameter (λ), (b) threshold parameter (γ), and (c) loading and threshold parameters. DIF size: (a) small DIF (i.e., 0.3 increase) and (b) large DIF (i.e., 0.6 increase). Number of noninvariant item parameters under a certain noninvariant item parameter type within an item block: (a) 1, (b) 2, and (c) 3. MFC DIF form: (a) only the main effect DIF, (b) both main effect DIF and interactive DIF, and (c) only the interactive DIF. The total sample size: (a) 1,000 and (b) 4,000. In Study 2, we considered both binary and order covariates, and the difference in the number of levels for the two covariates made it impossible to use a uniform number to describe the sample size per group. Therefore, we used the total sample size to replace the sample size per group described in Study 1. For example, given the same total sample size, the 500 respondents per group in Study 1 corresponds to 1,000 respondents here. In addition, to simplify the simulation, the condition with a total sample size of 2,000 used in Study 1 was removed from the present study.
A total of 216 conditions were employed in the simulation. To enhance the authenticity of the results, we kept the sample sizes for different levels of the same DIF-inducing covariate relatively uniform, although not exactly equal. Each of the conditions was replicated 50 times, and all simulation codes were written in R version 4.1.1 (R Development Core Team, 2021).
Data Generation
Although the data generation procedures for this study were largely the same as those used in Study 1, there were some notable differences. First, for our latent trait vector generation, we retrieved the true correlation matrix of traits from the NEO-PIR (McCrae & Costa, 1992) and represented it as: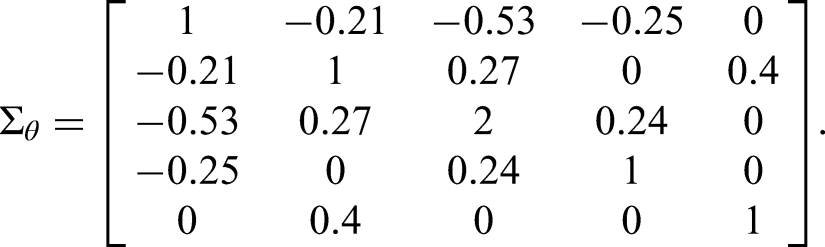
True Simulated Differences of Item Parameters for Different DIF Forms Under Different Groups in Study 2.
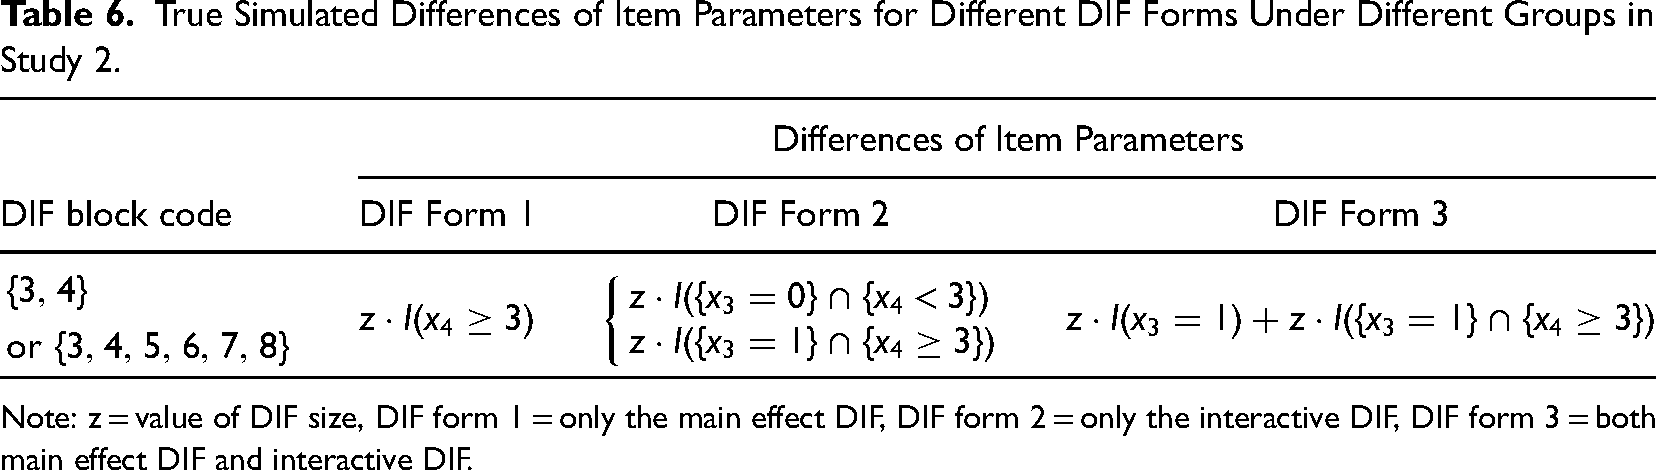
Note: z = value of DIF size, DIF form 1 = only the main effect DIF, DIF form 2 = only the interactive DIF, DIF form 3 = both main effect DIF and interactive DIF.
Evaluation Criteria
Study 2 used the same evaluation criteria as Study 1, please see the corresponding content in Study 1.
Results of Study 2
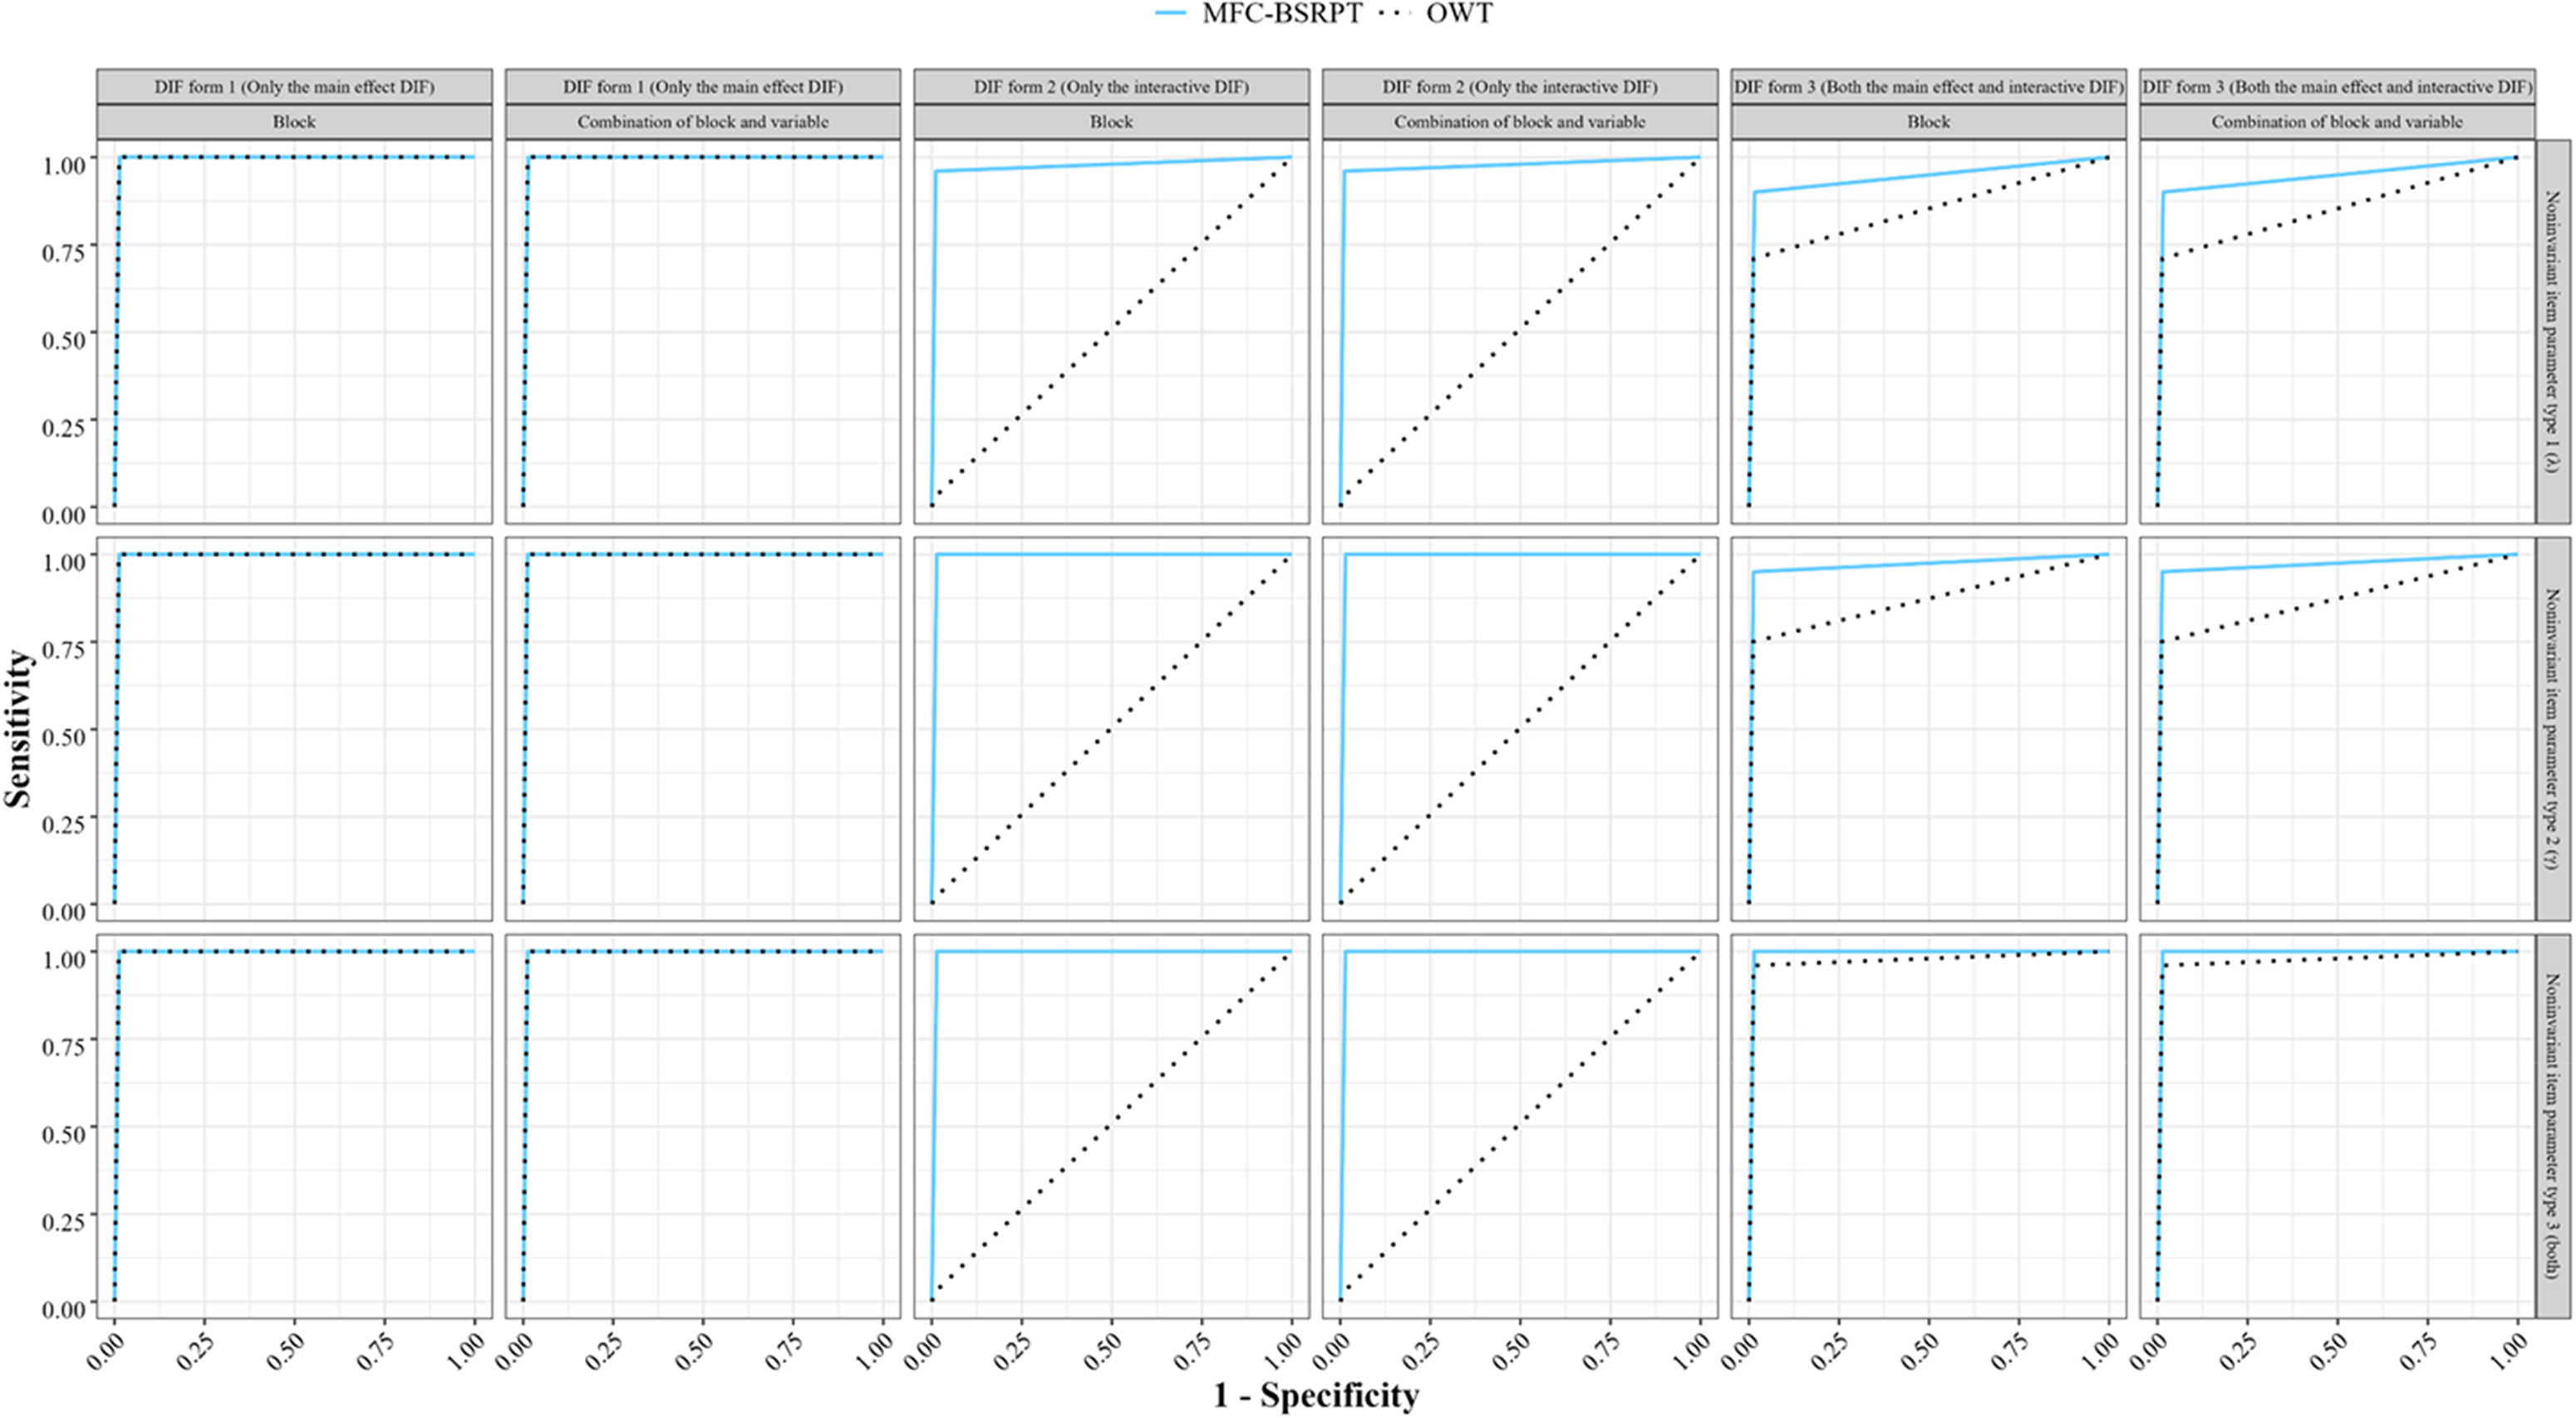
The results of the 30% DIF proportion condition are presented in Table 7 due to space limitations, as the 10% and 30% DIF proportions showed similarities. In addition, Table 7 shows the simulation results using only the Number of Covariates and their Levels & DIF Effect Size (NCLD) strategy for Type I error control, as it performs better than other strategies in terms of power and Type I error control. Full results can be found in Tables S17 to S24 in the online supporting information. Overall, the proposed method showed a favorable potential for detecting DIF with the ordered covariate, as shown in Table 7. It also showed promising results in dealing with different DIF forms and in the simultaneous identification of DIF item blocks and DIF-inducing covariates.
Simulation Results Under Different Conditions When the DIF Size is Large (Small) and the Percentage of Blocks That Exhibit DIF Is 30% in Study 2.
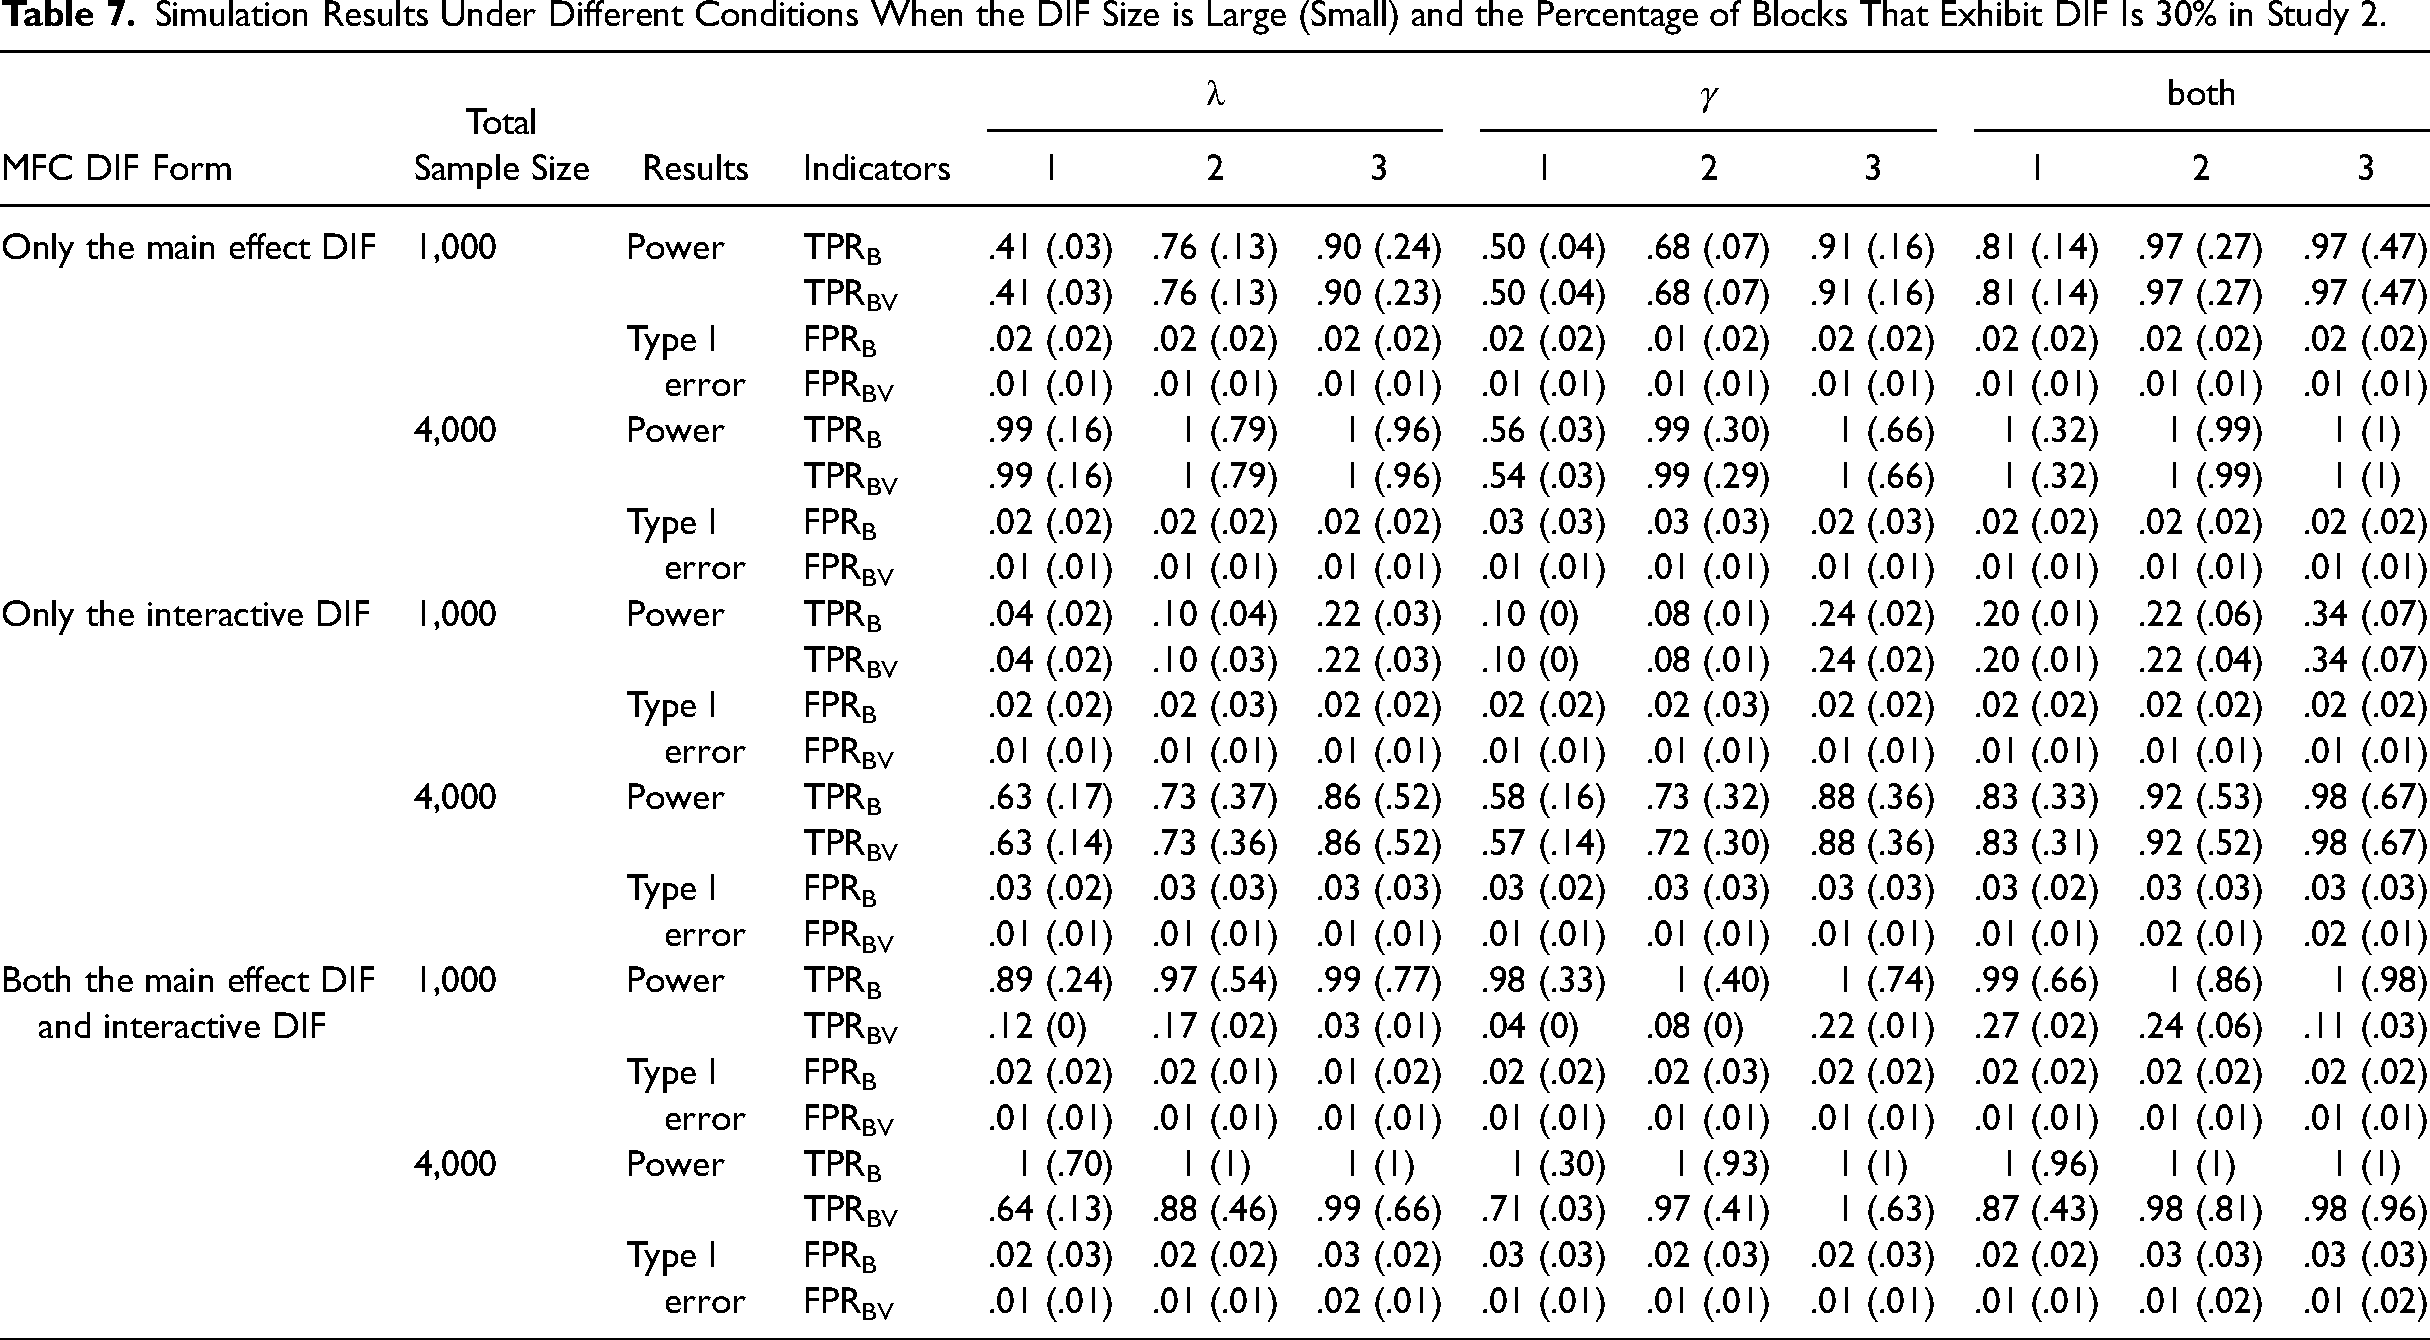
Other important findings were as follows: First, the power trends in Study 2 across factor levels mirrored those in Study 1. Second, compared to Study 1, the performance of the proposed method for the ordered covariate in Study 2 deteriorated somewhat for the same total sample size. For example, with a total sample size of 1,000, a small DIF size (0.3) and only main effect DIF, block-level TPRs ranged from .10∼.88 in Study 1 versus .03∼.47 in Study 2. This occurred because the binary covariate would have more cases per group than the ordered covariate, holding the total sample size constant. As noted by Lee et al. (2021), sample size has a significant impact on the performance of MFC DIF detection. Therefore, for multi-category and ordered covariates, the proposed method requires the sample size assigned to each subgroup to be greater than 500 if more robust detection performance is desired. Third, the results showed that the NLCD strategy performed best among all strategies for controlling type I errors. The next best method considered the number of covariates and their levels, followed by the number of covariates and the DIF effect size. The worst control considered only the number of covariates. Two findings can be summarized from such results: (1) multiple comparisons between all levels of a single ordered covariate can potentially increase type I error rates; (2) although the p-value of the Wald statistic for an item block incorrectly flagged as having DIF is lower than the adjusted α, the average DIF effect size for that block would be lower than 0.1 in the vast majority of cases. Therefore, considering both the number of covariates and their levels, as well as DIF effect size estimates, potentially helped reduce type I errors while maintaining acceptable power as much as possible.
Study 3
In Study 3, we performed a follow-up simulation to further validate the DIF detection performance of the proposed method in the presence of the continuous covariate. Specifically, we included a binary covariate x5 and a continuous covariate x6. The MFC test is constructed with 10 triplets measuring three latent traits, and each trait was measured by 10 statements. Following the procedure for generating continuous covariates in existing studies (Berger & Tutz, 2016; Strobl et al., 2013), we sample the values of the continuous covariate x6 from a standard normal distribution. The simulations for the different DIF forms were the same as in Study 2, except for the cutoff location that exhibited DIF in the continuous covariate. In this study, we set the cutoff location that exhibited DIF in the continuous covariate x6 to 0.1, following the approach of Strobl et al. (2013). It is worth noting that, while all possible levels for multi-category covariates are countable, the levels for a continuous covariate have an infinite number of choices. Therefore, to find suitable cutoff values for dichotomizing the continuous covariate to facilitate DIF detection, we also refer to the study by Strobl et al. (2013), in which they took each possible cutoff value used to dichotomize the continuous covariate to two decimal places. In the present study, we followed this setting. We also used the item parameters and the covariance matrix used in Study 1, and the generation of latent trait vectors and response data remained consistent with Study 1. To ensure that the sample sizes assigned to the extreme levels of the continuous variable x6 were not too small, we only considered the level of a total sample size of 4,000 used in both Study 1 and Study 2. Considering the efficiency of detecting continuous covariates with our proposed method, we only investigated six boundary conditions as listed in Table 8. Each condition was replicated 50 times.
Simulation Results of the Proposed Method Employing Different Strategies for Controlling Type I Errors in Study 3.
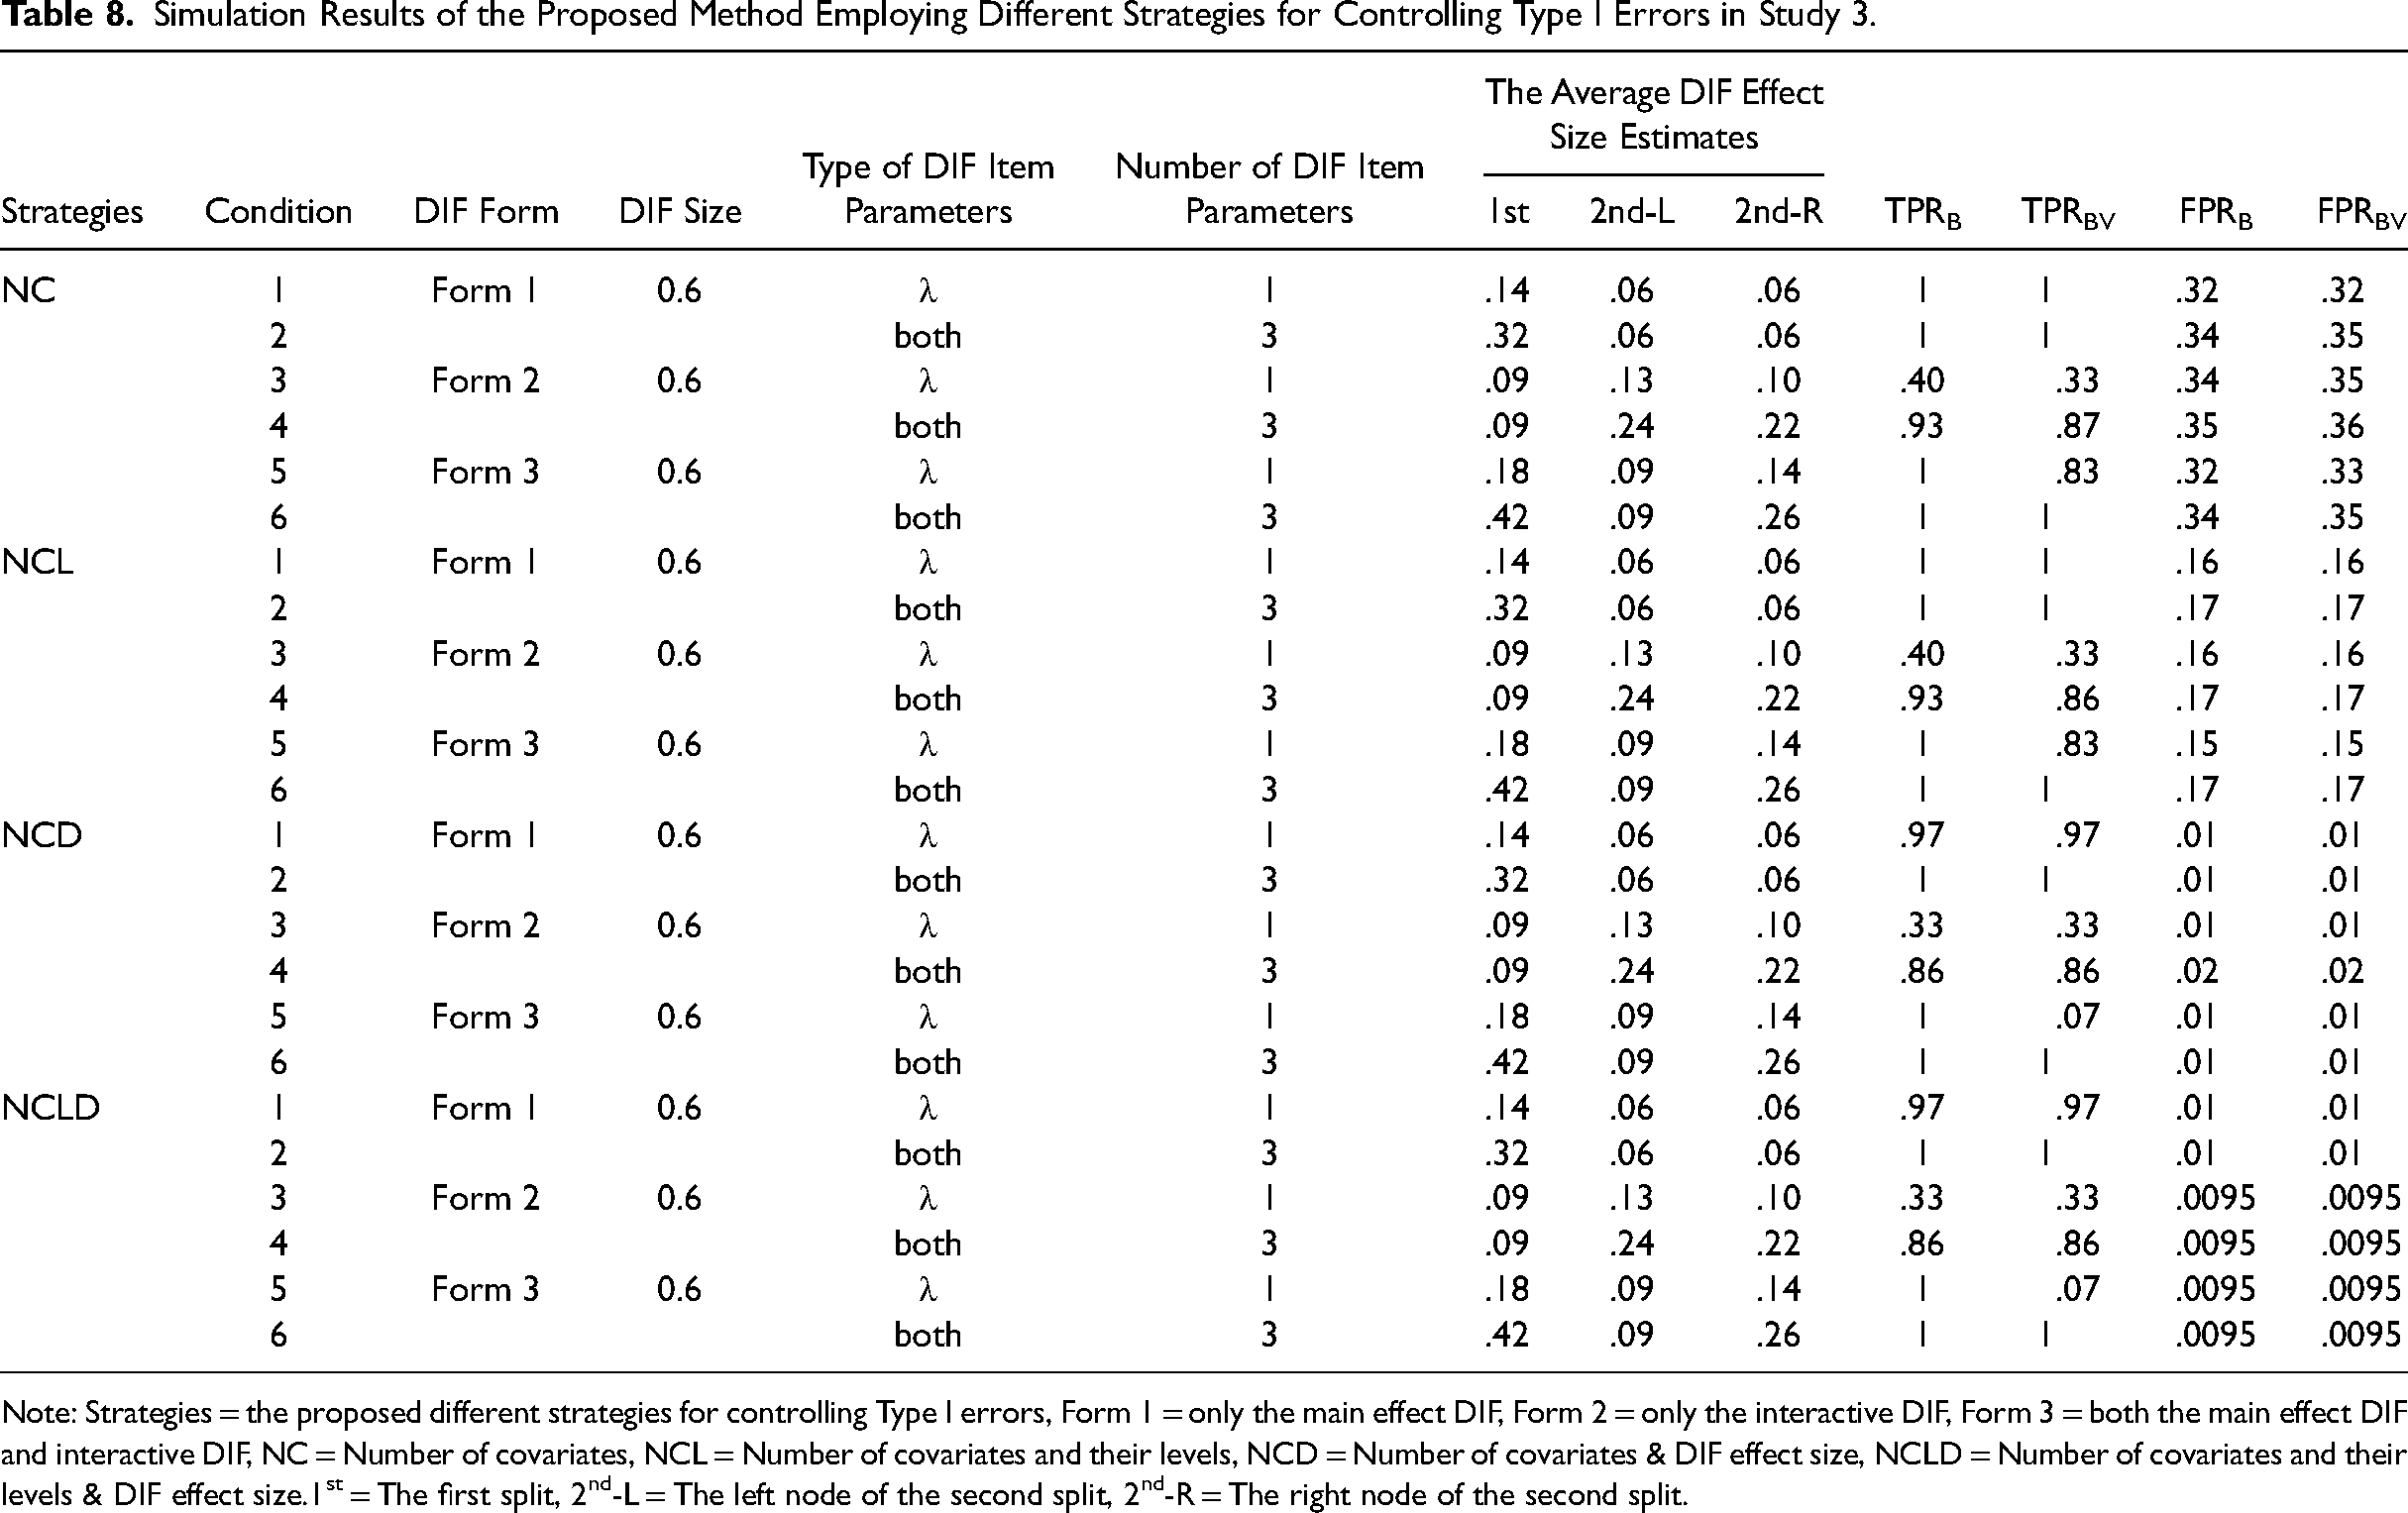
Note: Strategies = the proposed different strategies for controlling Type I errors, Form 1 = only the main effect DIF, Form 2 = only the interactive DIF, Form 3 = both the main effect DIF and interactive DIF, NC = Number of covariates, NCL = Number of covariates and their levels, NCD = Number of covariates & DIF effect size, NCLD = Number of covariates and their levels & DIF effect size.1st = The first split, 2nd-L = The left node of the second split, 2nd-R = The right node of the second split.
Table 8 shows the detection performance indices of the proposed method using different strategies for controlling Type I errors under each condition. The results for both TPRB and TPRBV were acceptable for most conditions. However, for both FPRB and FPRBV, there was a large difference between different strategies for controlling Type I errors. Specifically, the control strategy that considered the DIF effect size performed much better in controlling Type I errors than the performance when the DIF effect size was not considered. More importantly, there was no significant decrease in power when the control strategy included the DIF effect size estimate.
Empirical Application
Instrument and Data Collection
The present study used a Chinese version of the Multidimensional Forced-choice Five Facets of Mindfulness Questionnaire (MFC-FFMQ) to assess mindfulness. The Five Facets of Mindfulness Questionnaire (FFMQ; Baer et al., 2006) is originally a 39-item Likert-type personality assessment that measures five latent traits: Act, Describe, Nonjudging, Nonreactivity, and Observe. Deng et al. (2011) investigated the psychometric properties of the Chinese version of the FFMQ (Ch-FFMQ), and they found that the Ch-FFMQ has acceptable psychometric properties and is a valid instrument for assessing mindfulness. The MFC-FFMQ is a MFC version of the Ch-FFMQ that includes 13-triplet item blocks and uses the MOLE as the scoring format (i.e., participants choose the statements most and least descriptive to them), and each statement within a triplet measures a different dimension of mindfulness.
Data for the MFC-FFMQ were obtained by recruiting 1,408 participants through a combination of online media and field recruitment. All participants were university students who voluntarily agreed to participate in the study, and their anonymity was ensured. After screening the data for quality, 1,276 valid responses (61.91% female) were retained for subsequent data analysis. Respondents ranged in age from 16 to 35 years, with a mean age of 20.15 years (SD = 1.93). Of the participants, 65.44% were from rural areas and 34.56% were from urban areas.
Data Analysis
To begin, we calculated the empirical reliability index to evaluate the reliability of MFC-FFMQ. Then, we conducted a TIRT five-factor confirmatory factor analysis (CFA) on the MFC-FFMQ's five-factor structure using the R package thurstonianIRT (Bürkner et al., 2019) to evaluate the construct validity. Next, we used the proposed method and the omnibus Wald test to investigate MFC DIF in the MFC-FFMQ, with the goal of comparing the results yielded by each method. Specifically, we examined MFC DIF with respect to two binary covariates: gender (male: 1, female: 2) and household registration (rural population: 1, urban population: 2). To ensure good control of Type I errors, we applied the effective sequential free baseline approach recommended by Lee et al. (2021) to identify an anchor subset consisting of DIF-free item blocks. After establishing anchor subsets, we performed DIF detection using the two previously mentioned methods. All statistical analyses were conducted using R version 4.1.1 (R Development Core Team, 2021), with an overall significance level of 0.05 set for DIF test statistics.
Results
Measurement Reliability and Validity
MFC DIF Analysis
The sequential free baseline approach highlighted that MFC Items blocks 1, 8, and 11 were most consistent with Lee et al.'s (2021) anchor item screening criteria, consistently demonstrating DIF-free across all the covariates. Therefore, we selected these item blocks to form the anchor set for the subsequent MFC DIF detection on the remaining 10 item blocks. An overview of the final MFC-FFMQ DIF detection results obtained using the two methods is presented in Table 9, which shows a strong overlap between the two methods. We have also reported the average DIF effect size estimates within each item block for both the proposed method and the existing OWT method. As shown in Table 9, both the proposed method and the omnibus Wald test identified the same four MFC items (i.e., MFC item blocks 5, 7, 12, and 13) as exhibiting MFC DIF. To provide a visual representation of the DIF detection results, we have included the estimated trees for these DIF items in Figure 4. On analyzing the trees, we found that only the gender covariate induced MFC DIF for MFC item blocks 12 and 13, while both covariates gender and household registration induced MFC DIF for MFC item blocks 5 and 7, with an interaction between the two covariates in terms of inducing MFC DIF. MFC item blocks 5 and 7 showed both main effect DIF and interactive DIF across both covariates.
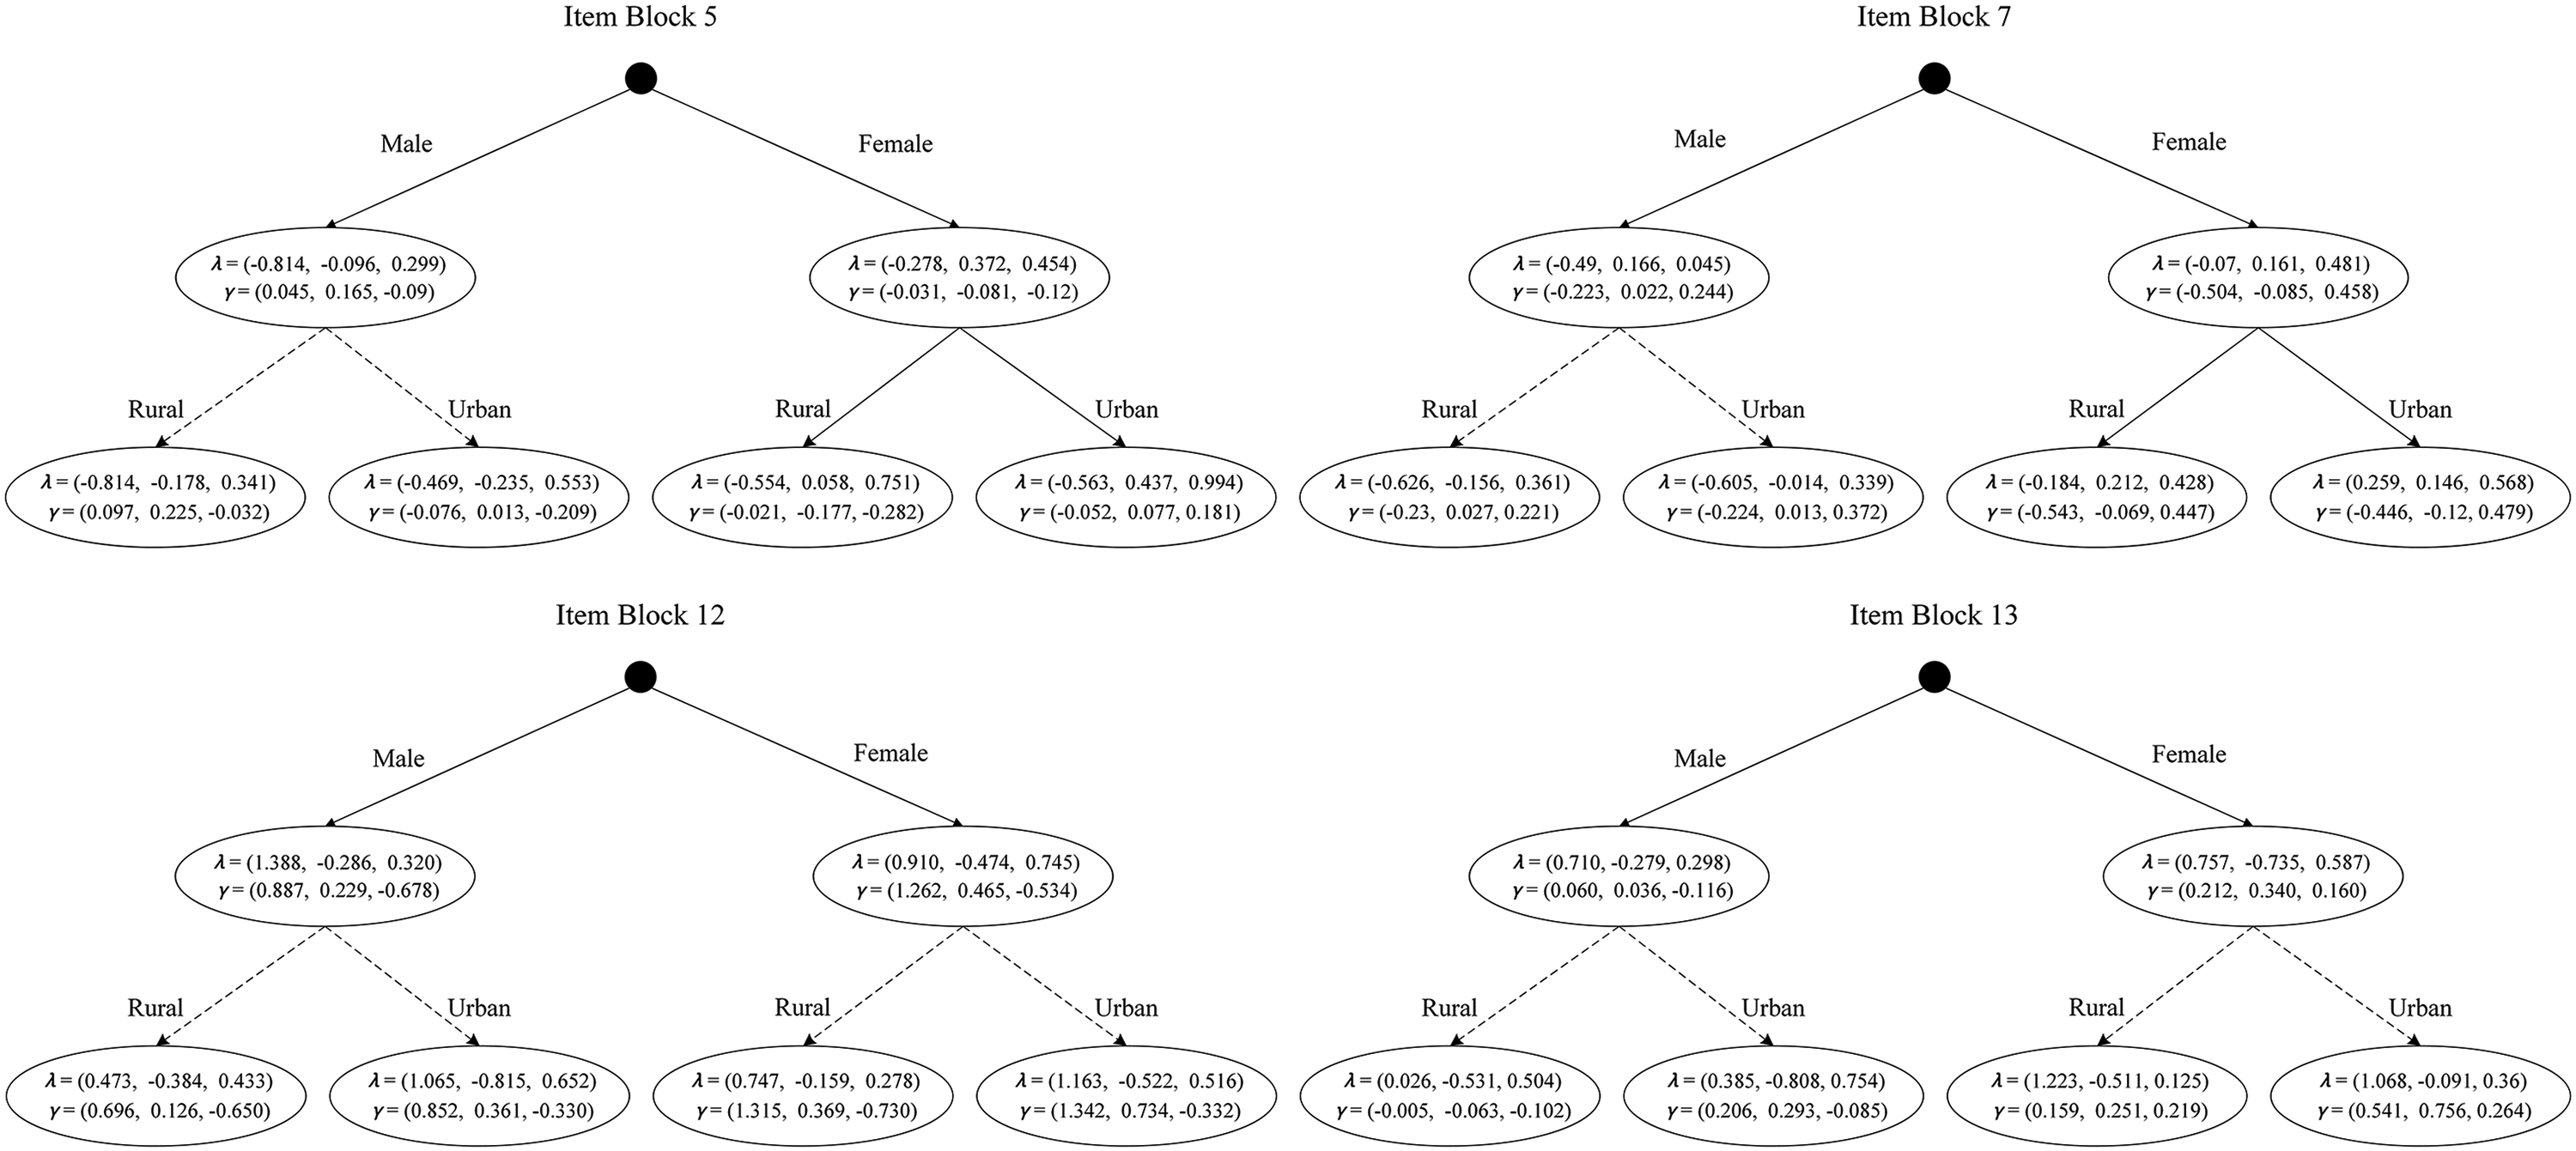
The tree diagrams for the MFC item blocks 5, 7, 12 and 13 of MFC-FFMQ.
Comparison of MFC DIF Detection Results for the MFC-FFMQ Using the Proposed Method and the Omnibus Wald Test.
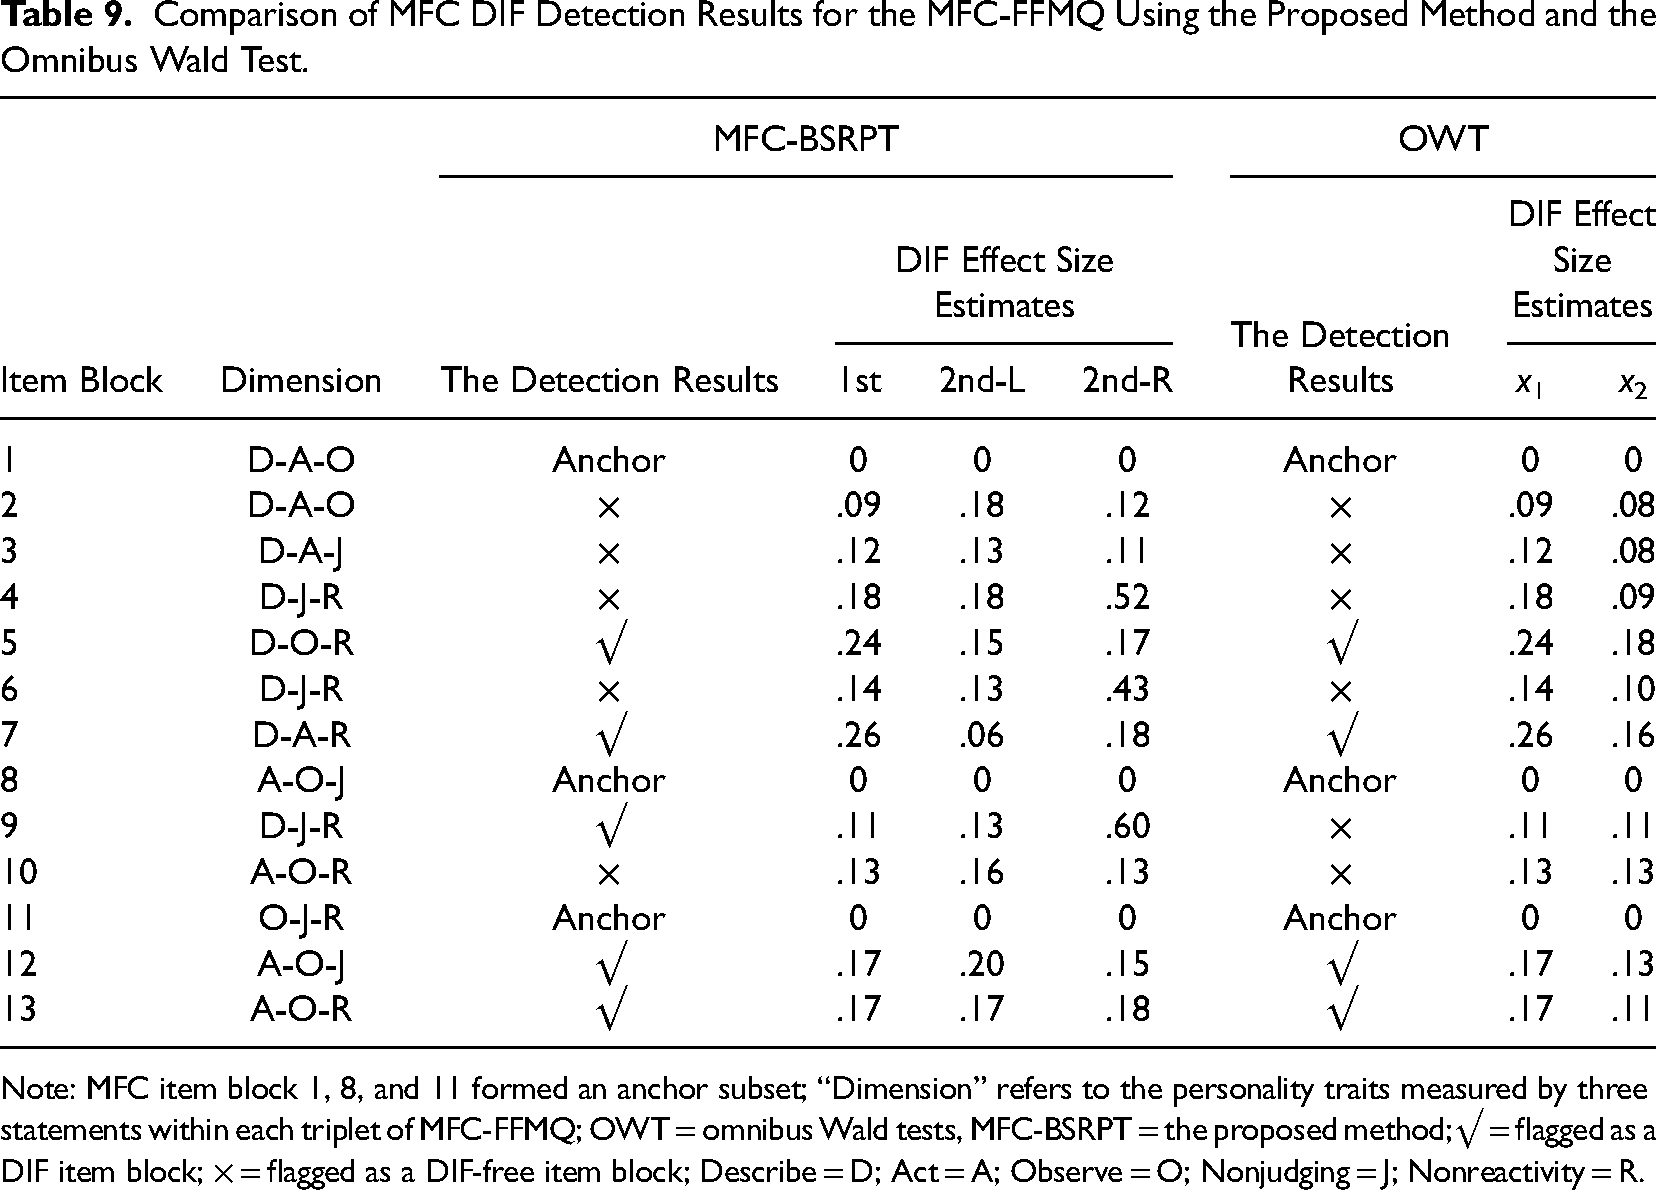
Note: MFC item block 1, 8, and 11 formed an anchor subset; “Dimension” refers to the personality traits measured by three statements within each triplet of MFC-FFMQ; OWT = omnibus Wald tests, MFC-BSRPT = the proposed method;√ = flagged as a DIF item block; × = flagged as a DIF-free item block; Describe = D; Act = A; Observe = O; Nonjudging = J; Nonreactivity = R.
However, there were differences between the two detection methods in relation to MFC item block 9. The proposed method detected MFC DIF for this item block, but the OWT method did not. Figure 5 shows the recursive partitioning tree for item block 9, indicating MFC DIF caused by an interaction between the two covariates. Two solid arrows connected the two leaf nodes in the lower right corner to the internal node directly above, with dotted arrows connecting all other root nodes to internal nodes or leaf nodes. Thus, MFC item block 9 was classified as exhibiting the only interactive DIF. Notably, the omnibus Wald test did not detect MFC DIF for Item Block 9, as expected, given its limitation in identifying the interactive DIF present in the MFC tests. Specifically, the DIF detection results revealed no significant difference between urban and rural males on Item Block 9, with an average DIF effect size estimate of 0.13 within this block. However, there was a significant difference between urban and rural females on Item Block 9, with an average DIF effect size estimate of 0.6 within this block, exceeding the 0.2 threshold, indicating non-negligible DIF.
According to Costa et al. (2001), social desirability bias can lead to the endorsement of gender-relevant traits by both men and women, and they also suggested that “certain traits, such as fearfulness, may be viewed as less undesirable for women than for men” (p.131). These claims appear to be supported by the results of our study. For example, for MFC item block 12, the value of the loading parameter of the third statement (i.e., Usually when I have distressing thoughts or images, I just notice them and let them go.) was much higher for the female group than for the male group (.745 vs. .320). We found this statement to be highly socially desirable, with the potential to activate gender stereotypes for women and elicit socially desirable responses. Although Lee et al. (2021) have pointed out that the post hoc interpretation of DIF can be problematic, even though it is based on speculation, this does not prevent us from concluding that the proposed method has the ability to identify more MFC DIF forms.
(Figure 5).
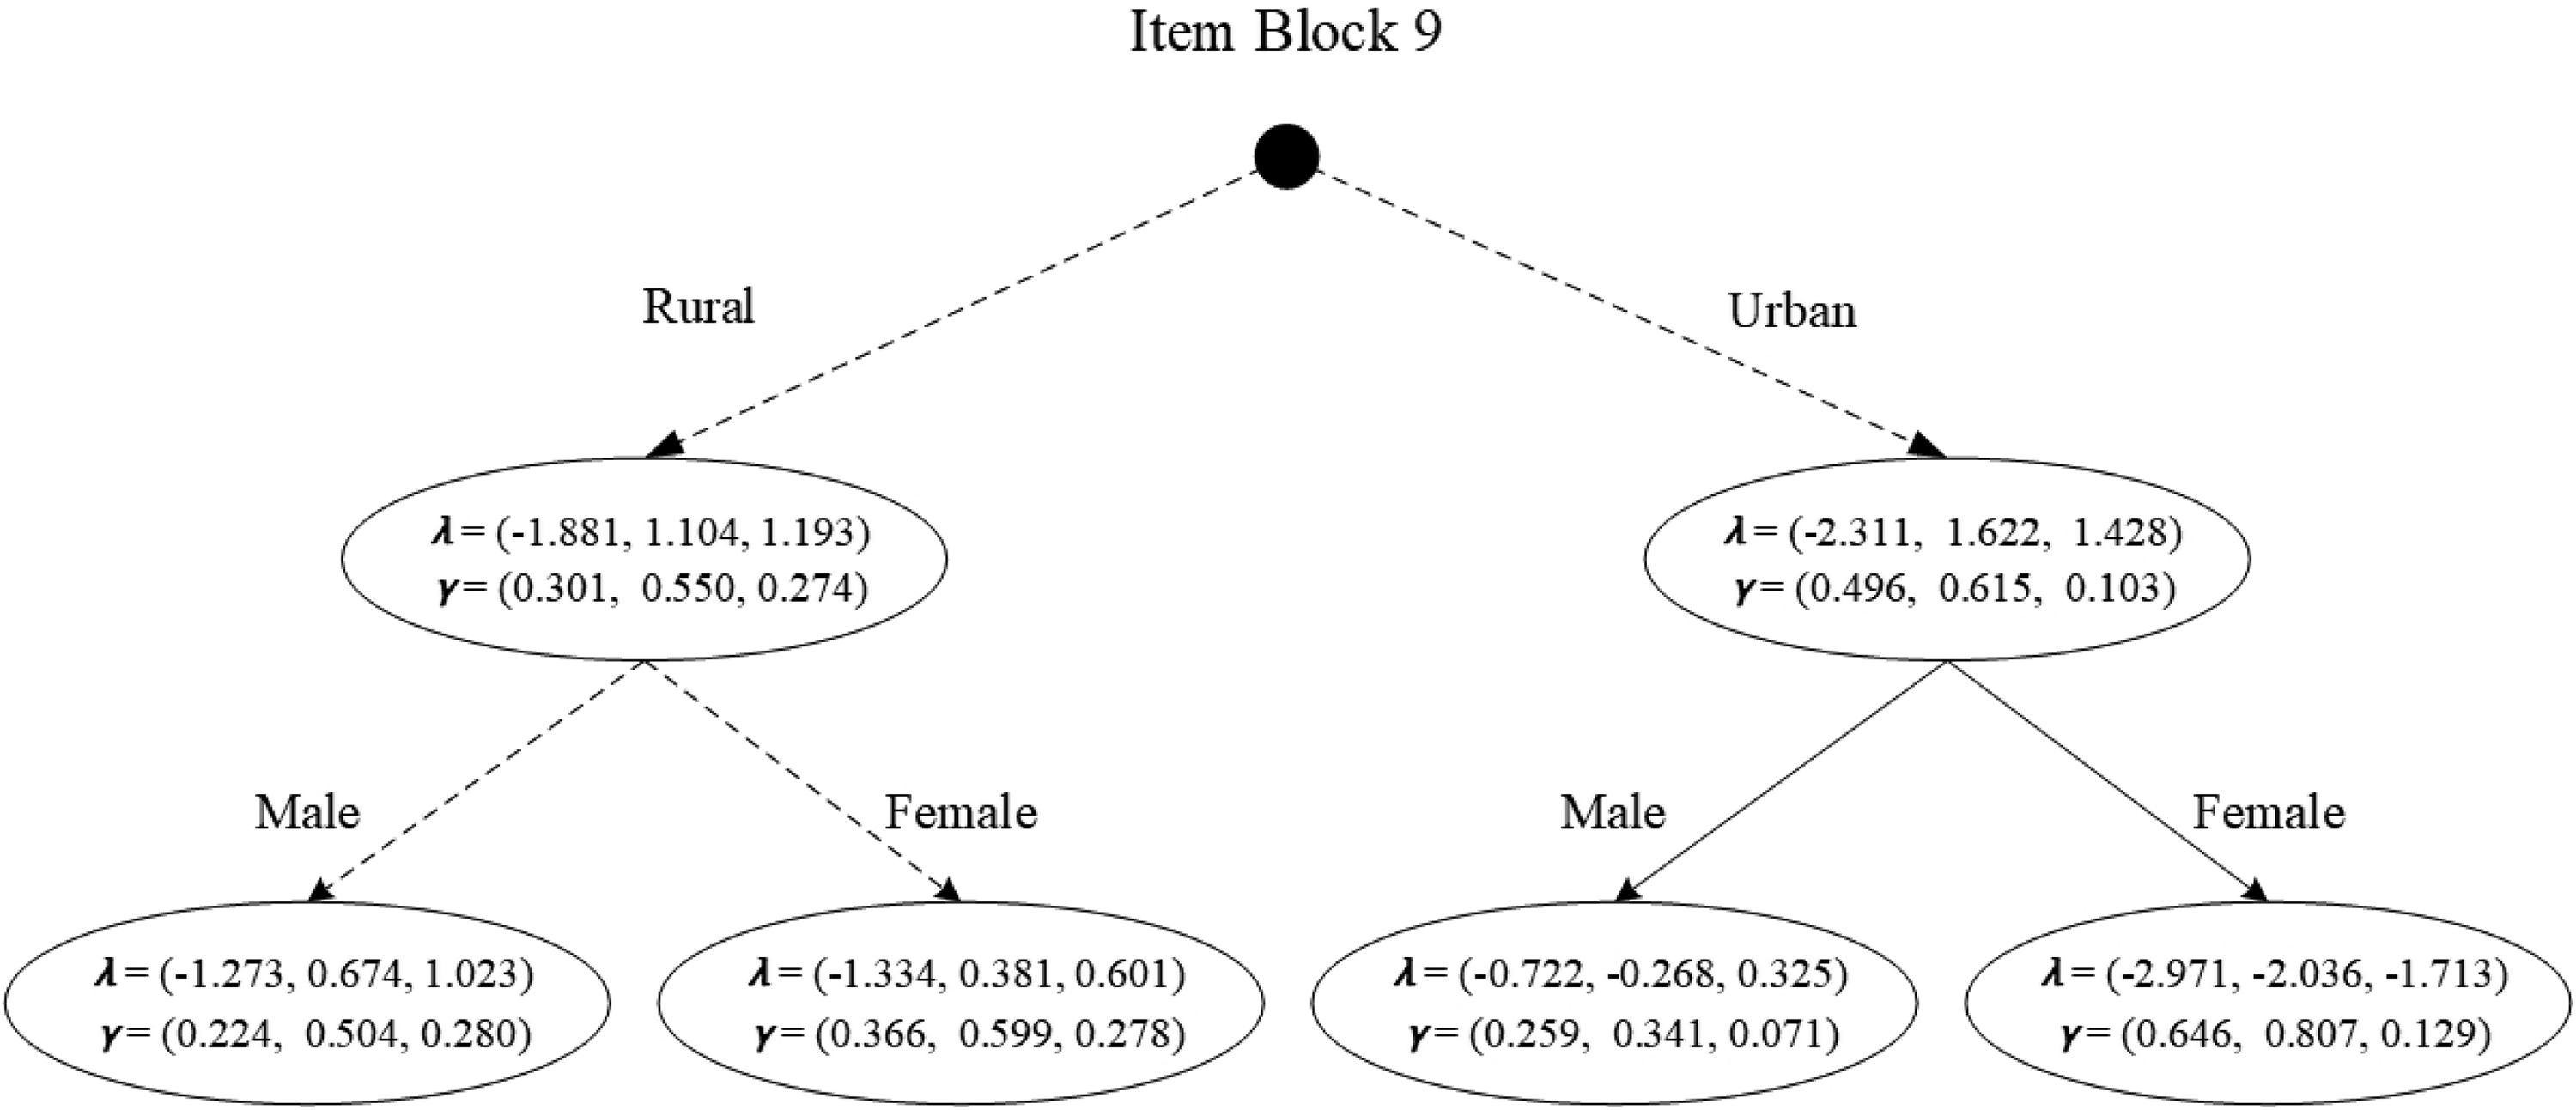
The tree diagram for the MFC item block 9 of MFC-FFMQ.
Note: The solid line indicates the presence of MFC DIF in the current node and the dashed line indicates the absence of MFC DIF in the current node. Estimated TIRT-based item parameters (i.e.,
Discussion
Summary of the Present Study
Detecting DIF for MFC tests is important for maintaining the fairness and validity of the tests. However, existing methods to detect DIF for MFC tests all have limitations (see the introduction section for details). The manifestation of DIF in MFC tests is more complex than in traditional single-stimulus tests, making DIF detection in MFC tests more challenging.
In this study, we introduce a MFC DIF detection method called MFC-BSPRT that uses the recursive partitioning technique to address the limitations of current MFC DIF detection approaches. To investigate the performance of the proposed method, we conducted three carefully designed simulation studies. These three studies aim to accomplish the following two tasks: (1) A comprehensive comparison of the detection performance of the existing omnibus Wald tests and the proposed method when the covariates used for MFC DIF detection are all binary. The experimental conditions include varying MFC DIF forms, sample sizes per group, percentages of MFC DIF item blocks, types of noninvariant item parameters of the TIRT model, DIF sizes, and numbers of noninvariant item parameters under a certain noninvariant item parameter type within an item block; (2) A comprehensive evaluation of the detection performance of the proposed DIF detection method for ordered covariates and continuous covariates. The experimental conditions include different percentages of item blocks that exhibit DIF, types of noninvariant item parameters of the TIRT model, DIF sizes, numbers of noninvariant item parameters under a certain noninvariant item parameter type within an item block, MFC DIF forms, and total sample sizes. In addition to the simulation studies, we conducted an empirical study to demonstrate the feasibility of the proposed method in a practical setting, and provided a comprehensive comparison of our framework with the existing OWT approach.
The main findings of this study are as follows. First, simulation studies demonstrated that our proposed method effectively controlled Type I errors and exhibited superior detection power compared to the existing OWT method under most experimental conditions. Second, regarding MFC DIF forms, our proposed method exhibited comparable detection performance to the existing OWT method in identifying main effect DIF, while also demonstrating superior detection power in detecting interactive DIF. Third, concerning the types of DIF-induced covariates that can be handled, the proposed method exhibited a robust detection power identifying MFC DIF for binary covariates, as well as demonstrating good detection power and adequate Type I error control for multi-category, ordered, and continuous covariates, surpassing the existing OWT method's inadequate performance in addressing these effectively. Fourth, in the empirical study on 12 out of 13 item blocks of the MFC-FFMQ, our proposed method displayed the same DIF detection as the existing OWT method.
Advantages of Using the MFC-BSRPT Approach for Developing and Validating MFC Tests
Recommendations for Applying the MFC-BSRPT Approach in Organizational Applications and Research
Limitations and Directions for Future Study
Although this study found encouraging results demonstrating the effectiveness of the proposed method, there is room for improvement. First, although the proposed method showed potential in correctly identifying DIF item blocks and DIF-inducing covariates, it does not yet specify the exact level of MFC DIF manifestation, whether it is at the pairwise comparison level, the statement level, or both. Therefore, future research could explore more fine-grained ways to detect and distinguish at which level MFC DIF manifests based on the proposed method.
Second, our proposed method relies on the Wald statistic to split response data, which may not perform as well with smaller sample sizes, as suggested by our simulation results and other recent research (Lee et al., 2021). One possible direction for future research is to develop new test statistics for MFC DIF detection or to adapt existing single-stimulus-based DIF test statistics to improve the detection performance in small sample conditions.
Third, given the difficulty of obtaining representative samples in high-stakes talent selection settings, we used only a sample of university students in our empirical study. University students tend to be younger, more educated, less experienced, and come from a narrower range of backgrounds than real candidates for high-stakes personnel selection. Therefore, findings based only on student samples may not generalize well to real personnel selection contexts. Further research is needed to collect more diverse, representative samples from organizational settings.
Fourth, like the existing studies on IRT-based DIF detection using the recursive partitioning technique, our proposed method currently only performs binary splits. In future studies, researchers can consider the problem of multivariate splits.
Finally, our proposed method currently operates only under the dominance model, while its applicability to the ideal point model is unknown. Therefore, future research can explore the proposed method's performance under those ideal point models, such as the widely used multi-unidimensional pairwise-preference model (MUPP-GGUM; Stark et al., 2005), which has been applied to the MFC computerized adaptive testing algorithm and several personality tests for selection in the U.S. military (Stark et al., 2012).
Supplemental Material
sj-pdf-1-orm-10.1177_10944281241244760 - Supplemental material for A Framework for Detecting Both Main Effect and Interactive DIF in Multidimensional Forced-Choice Assessments
Supplemental material, sj-pdf-1-orm-10.1177_10944281241244760 for A Framework for Detecting Both Main Effect and Interactive DIF in Multidimensional Forced-Choice Assessments by Kai Liu, Yi Zheng, Daxun Wang, Yan Cai, Yuanyuan Shi, Chongqin Xi and Dongbo Tu in Organizational Research Methods
Supplemental Material
sj-docx-2-orm-10.1177_10944281241244760 - Supplemental material for A Framework for Detecting Both Main Effect and Interactive DIF in Multidimensional Forced-Choice Assessments
Supplemental material, sj-docx-2-orm-10.1177_10944281241244760 for A Framework for Detecting Both Main Effect and Interactive DIF in Multidimensional Forced-Choice Assessments by Kai Liu, Yi Zheng, Daxun Wang, Yan Cai, Yuanyuan Shi, Chongqin Xi and Dongbo Tu in Organizational Research Methods
Footnotes
Declaration of Conflicting Interests
The author(s) declared no potential conflicts of interest with respect to the research, authorship, and/or publication of this article.
Funding
The authors disclosed receipt of the following financial support for the research, authorship, and/or publication of this article: This work was supported by the National Natural Science Foundation of China (grant numbers 32160203, 62167004, 32300942).
Supplemental Material
Supplemental material for this article is available online.
Notes
Author Biographies
References
Supplementary Material
Please find the following supplemental material available below.
For Open Access articles published under a Creative Commons License, all supplemental material carries the same license as the article it is associated with.
For non-Open Access articles published, all supplemental material carries a non-exclusive license, and permission requests for re-use of supplemental material or any part of supplemental material shall be sent directly to the copyright owner as specified in the copyright notice associated with the article.