
Abstract
Recent advances in process data collection have made it possible to efficiently collect multimodal behavioral indicators, such as response times and eye-tracking measures. These multimodal data have been widely applied in cognitive and achievement assessments, where they have improved the accuracy of latent construct estimation. However, the use of informative multimodal process data in noncognitive assessments, such as personality measures widely used in organizational research, has received considerably less attention. To address this gap, we integrate response time and eye-tracking data into a conventional item response model to capture respondents’ response processes, thereby improving differentiation across trait levels and enhancing noncognitive assessment. Simulation studies were conducted to evaluate the performance of the proposed model and compare it with a conventional IRT model. Results indicate that model parameters can be accurately recovered and that incorporating multimodal data significantly improves the accuracy of person latent trait estimates. Finally, an empirical analysis was conducted to demonstrate the applicability and advantages of the proposed model in personality assessment.
Keywords
In organizational research, self-report measures, such as questionnaires and surveys, are widely used to assess constructs such as personality, attitudes, and beliefs. Although efficient, these measures are subject to well-known limitations, including social desirability bias, extreme response styles, and unconscious influences (Donaldson & Grant-Vallone, 2002; Kam & Meyer, 2015; Wetzel et al., 2016). Consequently, scholars have increasingly emphasized the need to complement self-report data with behavioral measures and to integrate multiple sources of information to improve measurement accuracy (Chen & Wojcik, 2016; Meißner & Oll, 2019).
Recent technological advances have made the collection of multimodal process data (e.g., response times, eye-tracking measures, and mouse trajectories) more accessible. Unlike traditional self-report scores, which primarily capture a static outcome (i.e., the final response), multimodal data provide insight into the dynamic cognitive and decision-making processes underlying respondents’ answers. This additional information enables researchers to refine response scoring, thereby improving the accuracy of inferences about respondents’ behavioral patterns and psychological traits.
Theoretical work on item response processes provides additional support for incorporating multimodal data. Response difficulty increases as the distance between a person's trait level and the item location decreases (Ferrando, 2007; Ferrando & Lorenzo-Seva, 2007; Meng et al., 2013). For polytomous items, each examinee's latent trait can be conceptualized as a continuous continuum, with each item partitioned by multiple category thresholds. When a respondent's trait level lies far from these thresholds, responses tend to be faster and more confident. Conversely, when the trait level is close to a threshold, none of the available categories fully matches the respondent's standing, leading to greater hesitation and decision conflict. These differences in response certainty reflect person–item interactions and can be captured by multimodal behavioral indicators (Guo et al., 2024; Krajbich et al., 2010; Uggeldahl et al., 2016), such as response times and eye-tracking measures (e.g., fixation counts).
Joint modeling of item responses and multimodal process data within the framework of item response theory (IRT) has demonstrated considerable potential in cognitive and achievement assessments by improving parameter recovery and providing deeper insight into individual differences (Liang et al., 2023; Man et al., 2022; Zhan, 2022). However, relatively few studies have applied this approach to personality measurement, and even fewer have integrated more than two data modalities. To address this gap, the present study employs a cross-loading multimodal modeling framework to jointly analyze process data and outcome scores, thereby enhancing the assessment of personality traits.
Multimodal Process Data
As one of the most accessible and widely used sources of process data, response times (RTs) serve as a valuable indicator for detecting aberrant responding (Ulitzsch et al., 2020a, 2020b, 2022), identifying response styles (Henninger & Plieninger, 2021), and predicting preference strength (Konovalov & Krajbich, 2019). Specifically, RTs have been shown to be strongly associated with response uncertainty (Meng et al., 2013; Uggeldahl et al., 2016). The time required to respond is influenced by the individual's level of uncertainty: greater hesitation leads to longer latencies, whereas greater decisiveness leads to shorter latencies. Whereas response scores indicate what was selected, response time reflects how decisively the choice was made. Analysis of RT data can improve the differentiation of individuals across trait levels (Guo et al., 2024). A substantial body of research further indicates that jointly modeling response content and response times significantly improves the accuracy of latent trait estimation (Man et al., 2022; Tian et al., 2023).
Eye-tracking data is among the most widely used and important measures in psychological research. Although eye-tracking data collection remains predominantly lab-based, technological advances are increasing its accessibility and practicality. Apple's ARKit provides built-in eye-tracking capabilities on iOS devices, enabling researchers to use native eye-tracking functions on iPads without requiring additional specialized hardware (Anisimov et al., 2021; Taore et al., 2025). Scalable online research platforms, such as jsPsych internationally (Anwyl-Irvine et al., 2021) and Credamo in China (Zhang et al., 2023), now allow researchers to conduct remote eye-tracking studies using participants’ standard webcams. These platforms employ computer vision models to estimate gaze points, thereby making large-scale, cost-effective behavioral data collection more feasible. Meißner and Oll (2019) also emphasize the timeliness and potential of eye-tracking in organizational science, highlighting: (a) technological advances that have lowered costs and improved usability; (b) the growing importance of attention and information processing in today's information-rich organizational environments; (c) the ability of eye-tracking to provide real-time, objective behavioral data that complements traditional self-report methods.
Commonly used eye-tracking indicators include fixation count (FC), which measures the number of times an individual fixates on a location; saccades, which capture changes in fixation position; regression count, which indicates the number of times a participant returns their gaze to a specific target; and fixation duration, which quantifies how long the eyes remain still at a location. Among these indicators, FC is the most commonly used, as it may reflect the intensity of attention allocated to a targeted visual region (Zhan et al., 2022). In survey research, eye-tracking data have been used to examine questionnaire completion processes, for example: to investigate the relationship between eye movement measures and response consistency (Chauliac et al., 2020); to examine participants’ cognitive strategies, including how they interpret items, question stems, and response options (Margot et al., 2023); and to assess cognitive load(Kosch et al., 2018) and monitor attention (Michinov et al., 2015; Skinner et al., 2018).
Visual fixations are also employed to examine the decision-making process (Fisher, 2021; Krajbich et al., 2010; Uggeldahl et al., 2016; Van Loo et al., 2018). According to the attentional drift-diffusion model (aDDM; Krajbich & Rangel, 2011; Krajbich et al., 2012; Liu et al., 2023), when the difference between two options is small, more fixations are typically needed to accumulate sufficient evidence to reach the decision threshold and make a choice. Conversely, when the difference between the options is large, the decision-maker can reach the threshold with fewer fixations and make a decision more quickly. In other words, the number of fixations during item processing increases with rising uncertainty.
In summary, response time (RT) and fixation count (FC), as two types of multimodal process data, serve as key indicators of response uncertainty. When an individual is highly certain about how to respond to an item, the difficulty of selecting among alternatives is low; in this case, RTs are short, and the number of fixations (FC) tends to decrease. Conversely, if an individual perceives two or more alternatives as plausible, both RT and FC increase relative to the previous scenario.
Why Is Multimodal Assessment Needed in Personality Assessment?
In organizational research, noncognitive attributes, such as personality, leadership styles, self-efficacy, and job satisfaction, play a crucial role in guiding high-stakes decisions, including hiring, promotion, and personnel development (Al-Malki & Juan, 2018; Bakker et al., 2012; Bin & Shmailan, 2015; Judge et al., 2007). Measuring these constructs is critical for organizational decision-making. Self-report questionnaires remain the primary tool for their assessment and are widely considered efficient, cost-effective, and easy to administer.
Completing questionnaires is often regarded as a simple task, requiring participants to respond to each item sequentially. For each item, respondents must interpret the question and reflect on it using their own judgment. The Cognitive Aspects of Survey Methodology (CASM) movement emphasized that understanding individual response processes is essential for evaluating questionnaire validity and identifying potential sources of error (Fowler, 2013). The key assumption is that respondents’ cognitive processes underlie their survey responses (Schwarz, 2007; Tourangeau, 2003). The response process is not merely a mechanical selection of responses but a complex sequence of cognitive operations involving several stages, including item comprehension, retrieval of relevant information from memory, judgment formation, and mapping these judgments onto overt responses (Margot et al., 2023). The complexity of the response process cannot be fully captured by a single test score, which reflects only the final outcome of cognitive operations.
In cognitive and achievement assessment, the scope of measurable data has substantially expanded. These data include not only traditional response outcomes but also various process-related indicators. The technology-enhanced assessment (TEA; Sweeney et al., 2017; Webb & Gibson, 2015) system employs built-in sensors to record learners’ real-time psychological and biological responses (e.g., eye-trackers, motion detectors, heart rate monitors), enabling educators to monitor learning and adjust instruction accordingly (Man et al., 2022). With technological advancements, collateral process data collection has become routine in large-scale computer-based assessments, such as the Program for International Student Assessment (PISA). Since 2015, the PISA test has been administered on computers, with all student–computer interactions logged, enabling researchers to examine test-takers’ behaviors in greater detail (Ivanova et al., 2020). Compared with unimodal models that rely solely on response outcomes, multimodal data introduce additional informational constraints in parameter estimation, thereby improving the precision of latent trait estimation (e.g., Liang et al., 2023; Tian et al., 2023; Zhan, 2022; Zhan et al., 2022).
Although multimodal data have shown considerable utility in cognitive and achievement testing, their application in noncognitive assessment remains limited. Since measuring noncognitive traits also involves complex internal psychological processes, extending multimodal research approaches to this domain has become an inevitable trend. This approach shifts the focus from simple response outcomes to a more comprehensive capture of cognitive and behavioral processes, thereby enhancing the precision of noncognitive assessment.
Existing Approaches and Limitations
A review of prior literature on the joint modeling of examinees’ response data and multimodal process data indicates that hierarchical framework modeling, as proposed by Van der Linden (2007), is predominantly used for the combined analysis of responses and response times (RT). However, hierarchical framework modeling also presents several limitations. Ranger (2013) highlighted that the main theoretical limitation of hierarchical framework modeling is that incorporating RT data improves the estimation accuracy of latent ability only when the correlation between latent trait and latent processing speed is nonzero. Moreover, empirical studies have reported a low correlation between latent ability and latent processing speed (Man et al., 2022). According to Bolsinova and Tijmstra (2018), joint hierarchical framework models fall short in fully leveraging RT data because they assume that RTs are influenced solely by latent processing speed and not by latent traits. Crucially, hierarchical framework models do not account for how respondents’ cognitive processes generate the multimodal data observed during task performance.
Cross-loading modeling (Bolsinova & Tijmstra, 2018; Meng et al., 2013; Molenaar et al., 2015) can be viewed as an extension of the joint hierarchical modeling framework. In principle, including cross-loading terms allows auxiliary process indicators to directly inform the estimation of the focal latent trait, rather than being treated solely as correlated secondary outcomes. Regardless of the correlation between the latent trait and latent variables derived from multimodal data, these data can contribute to the estimation of latent trait parameters, thereby enhancing estimation accuracy.
Ferrando and Lorenzo-Seva (2007) initially proposed a response time model with cross-loading terms for dichotomous personality test items. Meng et al. (2013) later extended this model to polytomous IRT and argued that the difficulty of responding to an item reflects uncertainty in the decision-making process, with differences among response probabilities serving as key factors in determining item difficulty. Guo et al. (2024) introduced response uncertainty as a cross-loading term to link the latent trait with response time and found that this approach improved latent trait estimation accuracy in forced-choice assessments.
Therefore, we focus on personality assessment and develop a multimodal polytomous IRT model that integrates response outcomes, RT, and FC, with response uncertainty—measured via information entropy (see the section “Response Uncertainty in Personality Assessment”)—serving as a cross-loading indicator within a joint–cross-loading modeling framework.
Aims and Highlights of the Present Study
In both organizational and broader behavioral research, there have been strong calls for increased use of behavioral data and the integration of multiple methodological sources. With the growing prevalence of computer- and web-based assessments, the collection of process data has become routine. For example, the development of TEAs, together with advances in multimodal data acquisition, has emphasized the need for corresponding improvements in modeling techniques that can leverage these data. Despite the richness and diversity of these data sources, their application in organizational research remains limited. Most traditional IRT-based assessments provide limited information and fail to fully capture individual differences in latent traits, potentially constraining informed organizational decision-making.
To address this gap, this study employs a cross-loading modeling framework to jointly analyze multimodal process data. The model uses cross-loading terms to explain how response uncertainty arising from person–item interactions produces variability in multimodal data, and how these multimodal indicators, in turn, inform the cross-loading terms to enhance the precision of latent trait parameter estimation. As response uncertainty increases, item difficulty also rises, resulting in longer response times and higher visual fixation counts. This approach not only enables a more precise differentiation of individual latent traits but also establishes a methodological foundation for utilizing multimodal behavioral data in organizational decision-making contexts.
The remainder of this paper is organized as follows. First, cross-loading terms within the cross-loading modeling framework are introduced. Next, the three sub-models of the proposed framework—the IRT model, the response time model, and the visual fixation counts (FC) model—are presented, along with the rationale for their integration. Then, a simulation study was conducted to evaluate the feasibility of the proposed model, followed by a real data analysis to demonstrate the utility of multimodal data in practical applications. Finally, the study discusses its implications, limitations, and proposed directions for future research.
The Proposed Multimodal Item Response Modeling for Personality Assessment
Response Uncertainty in Personality Assessment
In the present study, information entropy was introduced to more accurately quantify response uncertainty during the decision-making process. Differences among response probabilities reflect the uncertainty in responding to an item (Meng et al., 2013). In information theory, information entropy measures the uncertainty associated with a random variable (Shannon, 1948): the more uniform the distribution of outcomes, the greater the uncertainty and the higher the entropy; conversely, if an outcome is highly certain, the entropy is low. Therefore, to more effectively capture differences among response probabilities and quantify response uncertainty during the answering process, information entropy was introduced as an index of uncertainty. For K response categories, with integer values ranging from 0, 1, 2, …, K–1, information entropy can be defined as:

Here,
When information entropy approaches its maximum, log(K), meaning that the probabilities of all response categories are equal, i.e.,
When information entropy approaches its minimum, 0, meaning that the probability of selecting one response category is 100%, the examinee is certain which response to select, and choosing among alternatives involves minimal difficulty. Consequently, a rapid response with fewer fixations is expected.
The Framework of the Proposed Modeling (Multimodal-IRTM)
In this study, we employed a joint cross-loading modeling approach to integrate multiple types of data sources. Specifically, the joint model, referred to as multimodal-IRTM, consists of three components: Sub-Model I describes the response score data using an IRT model (e.g., the Graded Response Model; Samejima, 1969); Sub-Model II describes the response time data using the lognormal RT (LRT) model (Van der Linden, 2007); and Sub-Model III describes visual FC data using the Negative Binomial Fixation (NBF) model (Man & Harring, 2019). We then incorporate the introduced information entropy (see equation (1)) as a cross-loading term to link the three sub-models and to associate individuals’ latent traits with their response times and visual FCs. Further details of the proposed multimodal modeling framework are illustrated in Figure 1.
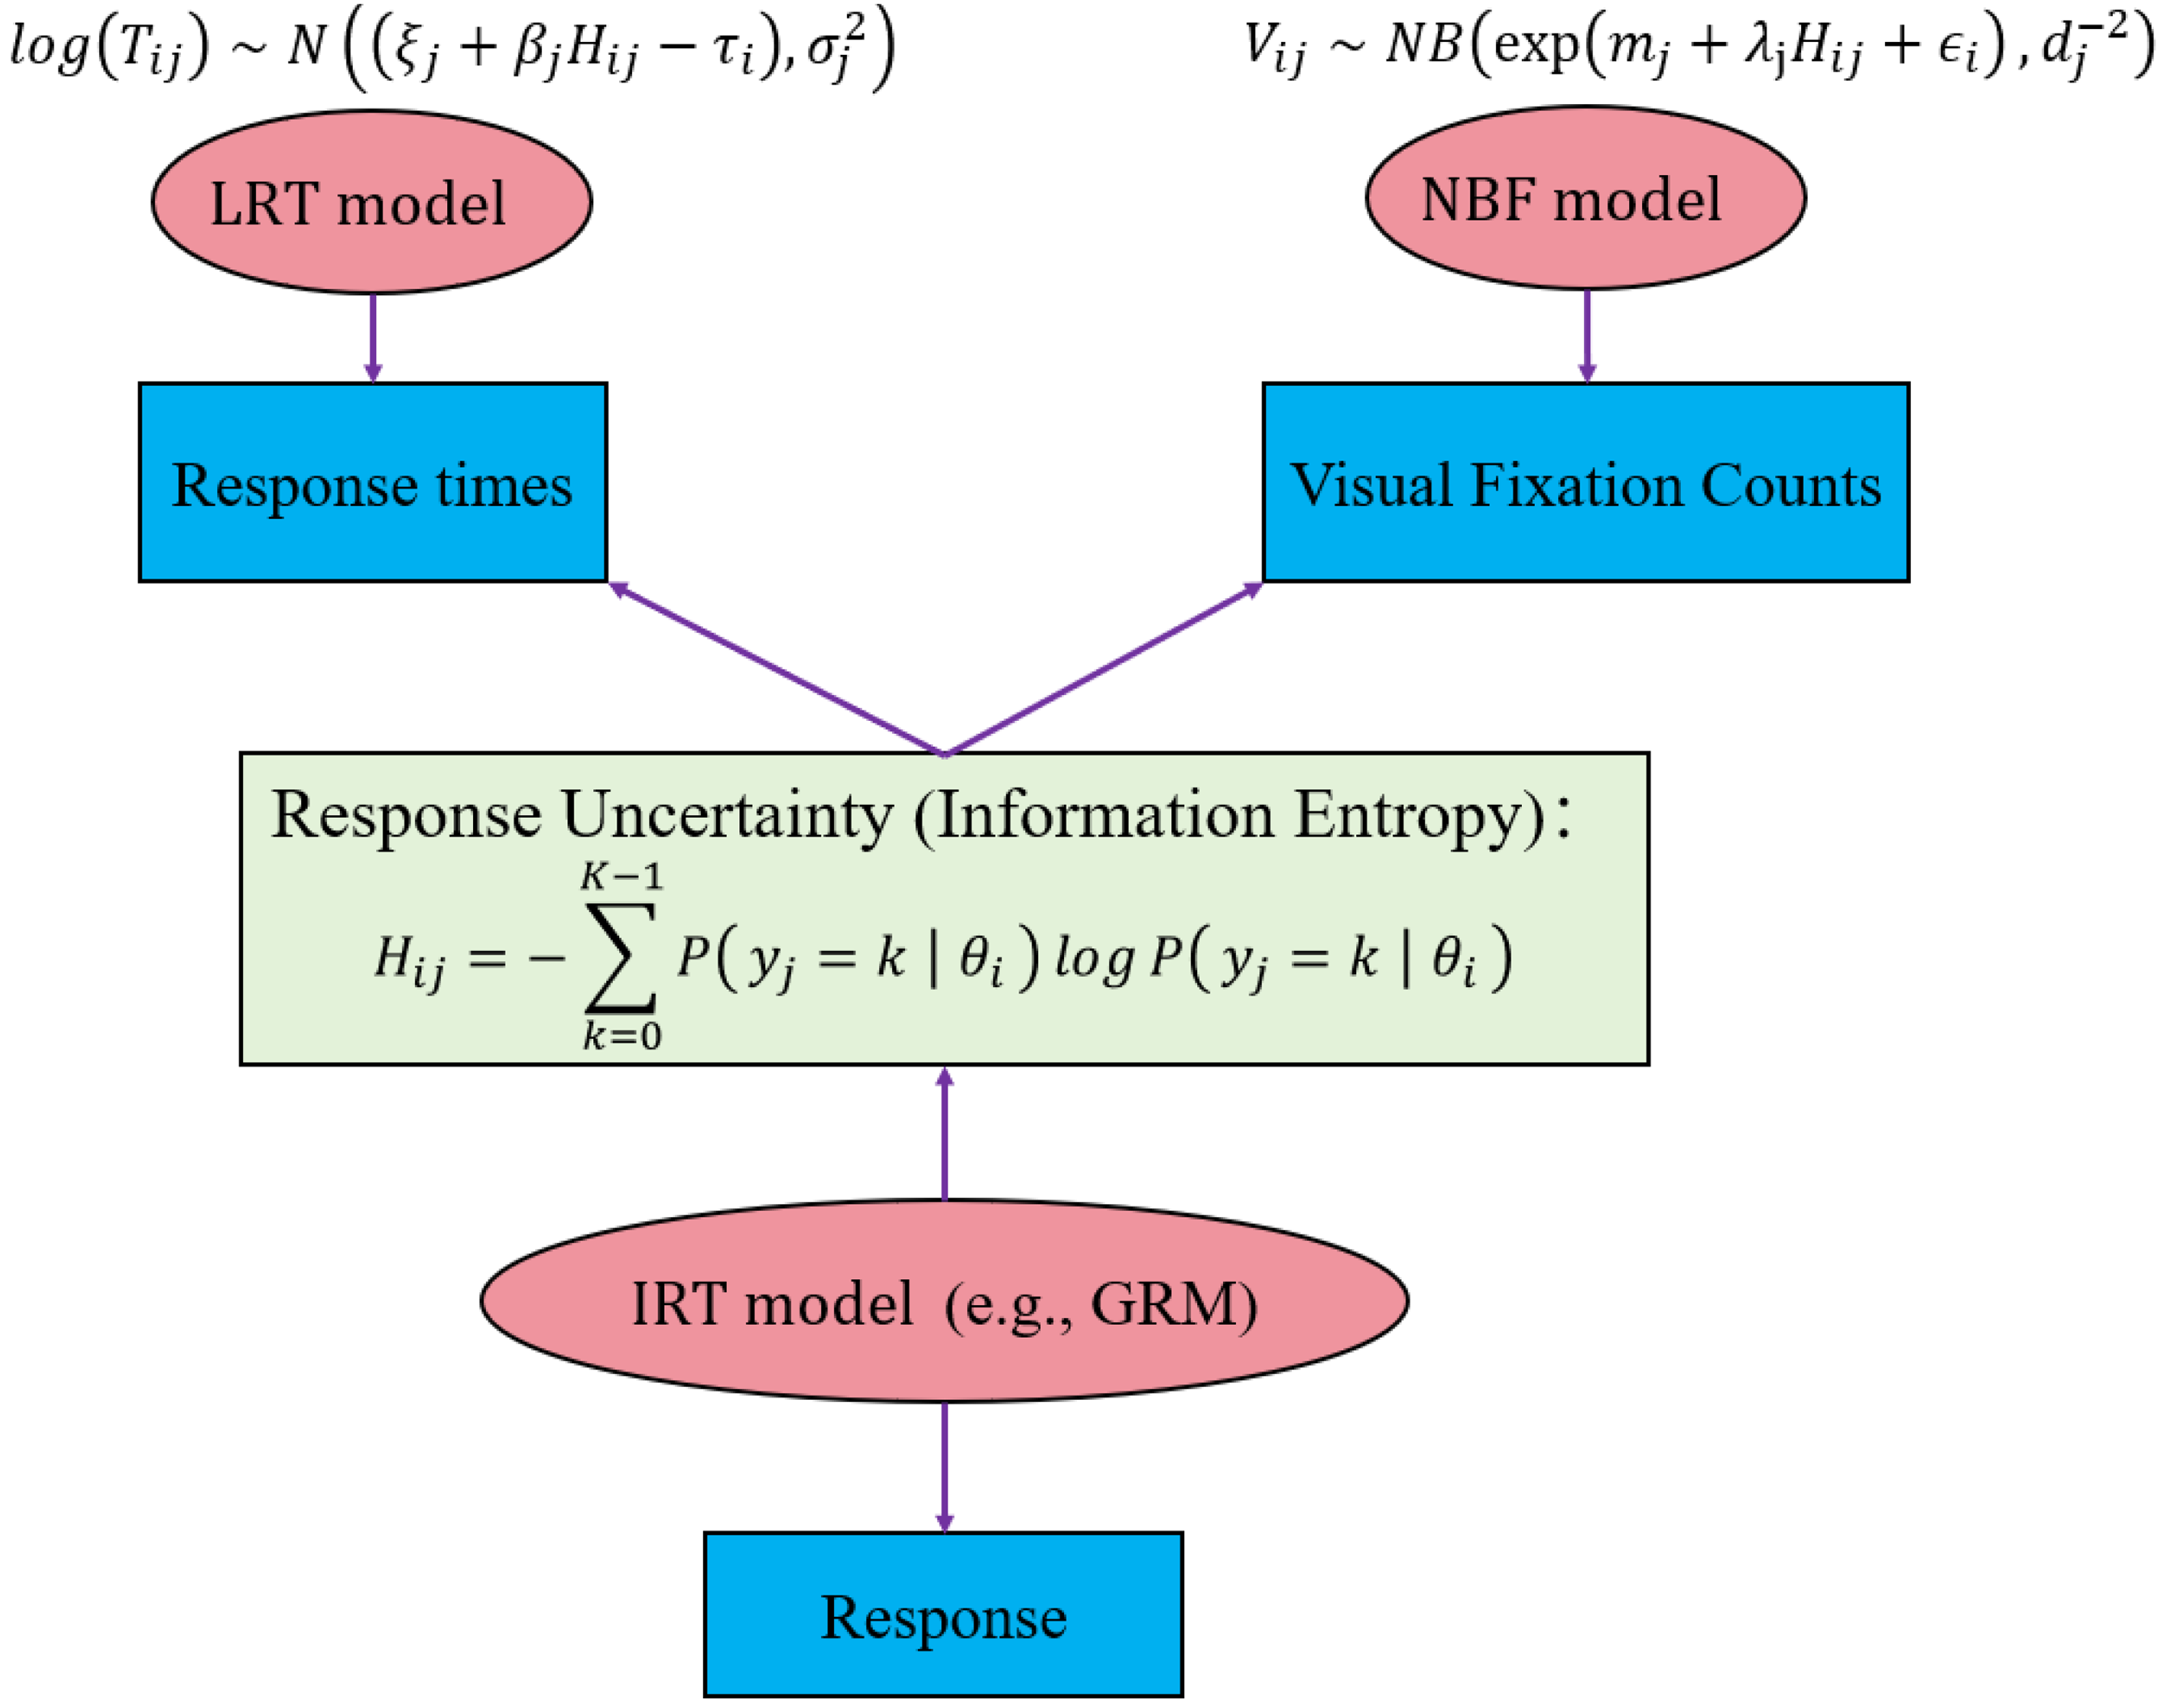
A graphical representation of the proposed multimodal-IRTM.
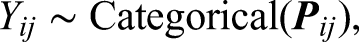
For the Graded Response Model (Samejima, 1969), let there be
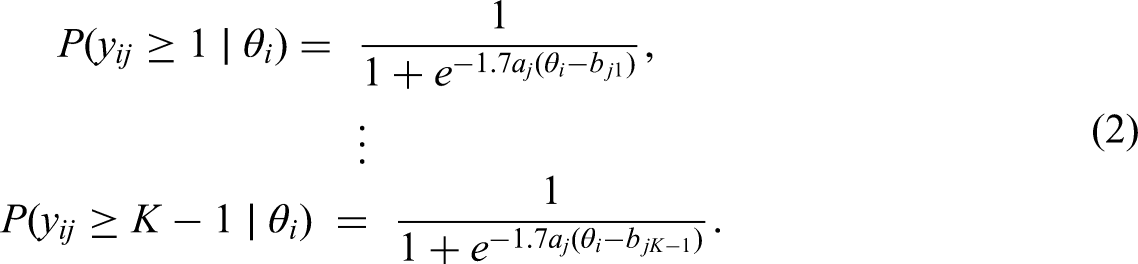
Then the probability that examinee i attains exactly score k on item

The variation in respondents’ observed RT when answering an item is primarily influenced by three factors: (a) the information processing speed at which respondents work during the test (i.e., the person main effect), (b) the amount of labor required by the item (i.e., the item main effect), and (c) the person–item interaction effect (Thissen, 1983). Information entropy can be viewed as representing the person–item interaction term. The positive skewness and frequent large outliers inherent in RT data make the lognormal RT model a preferred choice for modeling such data (Van der Linden, 2007). Accordingly, the lognormal RT (LRT) model, incorporating information entropy, can be expressed as follows:


For visual FC data, we adopt a parallel decomposition framework similar to that used for response times, in which FCs reflect person effects, item effects, and person–item interactions. Information entropy is incorporated to quantify response uncertainty. Following the approach of Man and Harring (2019), the Negative Binomial Fixation (NBF) model for FCs, incorporating information entropy, can be expressed as follows:
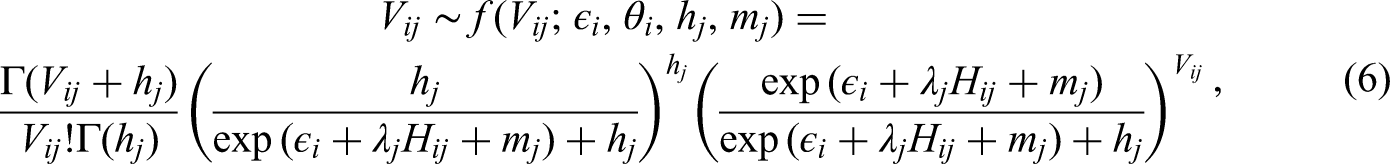

Where
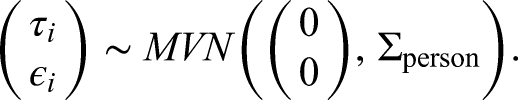
Finally, suppose that a correlation exists between participants’ latent processing speed and latent visual engagement. In this case, the joint distribution of latent processing speed and latent visual engagement is assumed to follow a multivariate normal distribution:

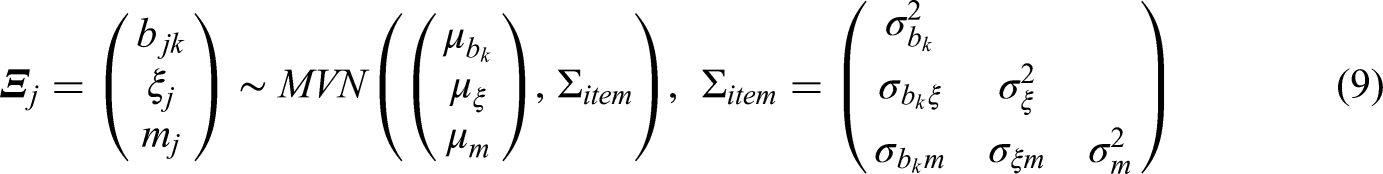
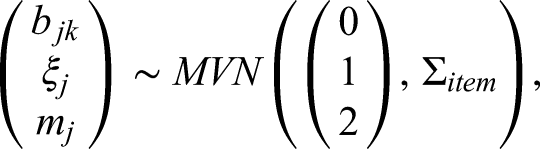
A multivariate normal distribution is also assumed for the item parameters, such that:
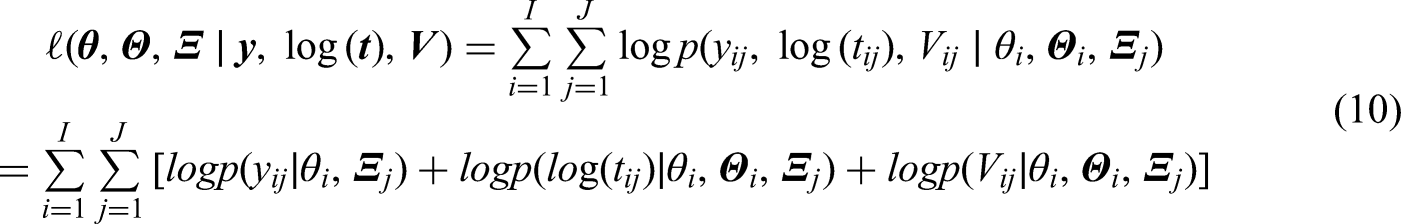
The log-likelihood of the proposed model can be expressed as:
Bayesian Parameter Estimation
Given the complexity of the proposed model, the parameters of the multimodal-IRTM model were estimated using a Bayesian approach with MCMC sampling, implemented in R via the nimble package. The prior are set following those in Man and Harring (2019), Man et al. (2022), Zhan et al. (2022), Guo et al. (2024), and Zhou and Guo (2026).
First,


Due to the assumed correlation between latent processing speed and latent visual engagement, the priors for the person parameters of the LRT model and the NBF model are assumed from a multivariate normal distribution, that is:
Furthermore, hyper priors for the covariance matrix of the multivariate normal distribution are specified as
For the GRM model, the person parameter
In addition, the priors of item parameters are specified as


Simulation Studies
The simulation study was designed to evaluate the performance of the proposed multimodal-IRTM model. Specifically, two complementary analyses were conducted within the same simulation framework: first, parameter recovery was assessed to examine the accuracy and precision of latent trait estimates under varying test lengths, sample sizes, and regression coefficients, with a fixed number of response categories (K = 5); second, the comparative performance of the GRM and multimodal-IRTM models was evaluated to determine whether incorporating multimodal information improves the accuracy of personality assessment.
Design and Data Generation
A simulation design was adopted to investigate both parameter recovery and comparative model performance. As demonstrated in prior simulation studies (e.g., Man et al., 2022; Meng et al., 2013; Zhan et al., 2022), the manipulated factors included test length (I = 15, 30), sample size (N = 200, 500, 1000), regression coefficients of information entropy (RC:
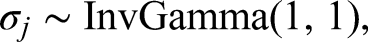
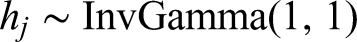
The latent processing speed
The latent personality trait
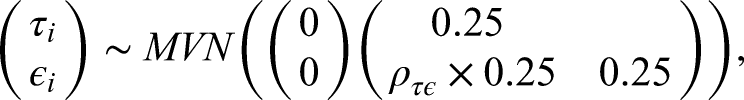
The item ordered threshold
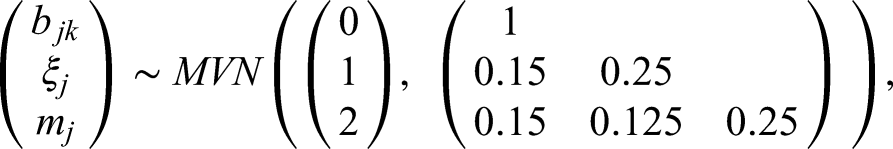
The remaining parameters of the GRM model, the item slope
Finally, item scores, response times, and visual FCs were simulated using the GRM model (equations (2) and (3)), the LRT model (equation (5)), and the negative binomial model (equation (7)), respectively.
Analysis
Considering the complexity of the proposed model, this study utilizes a cutting-edge R package “nimble” (de Valpine et al., 2017) for Bayesian inference. Nimble is an R package for programming with BUGS models using syntax similar to WinBUGS and JAGS, but with more flexibility in defining the models and algorithms. Users can operate from within R, and nimble will generate the C++ code for faster computation. For each condition, parameters were estimated using the MCMC algorithm with a single chain, a thinning interval of 1, 10,000 iterations, and a burn-in period of 5,000, after which the remaining 5,000 iterations were used for model parameter inference.
To investigate the accuracy of parameter estimation, we computed the BIAS and root mean square error (RMSE) as
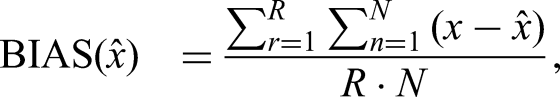
Additionally, correlations (COR) between estimated and true parameter values were evaluated to assess parameter recovery accuracy.
Results
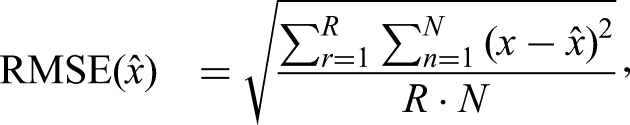
Table 1 summarizes the recovery results for the latent trait (
Latent Traits Parameter Recovery Between GRM and Multimodal-IRTM.
Note:
In comparing the multimodal-IRTM with the GRM, the multimodal-IRTM demonstrated more accurate latent trait recovery in most conditions. When the RC were equal to zero, the RMSE and COR for
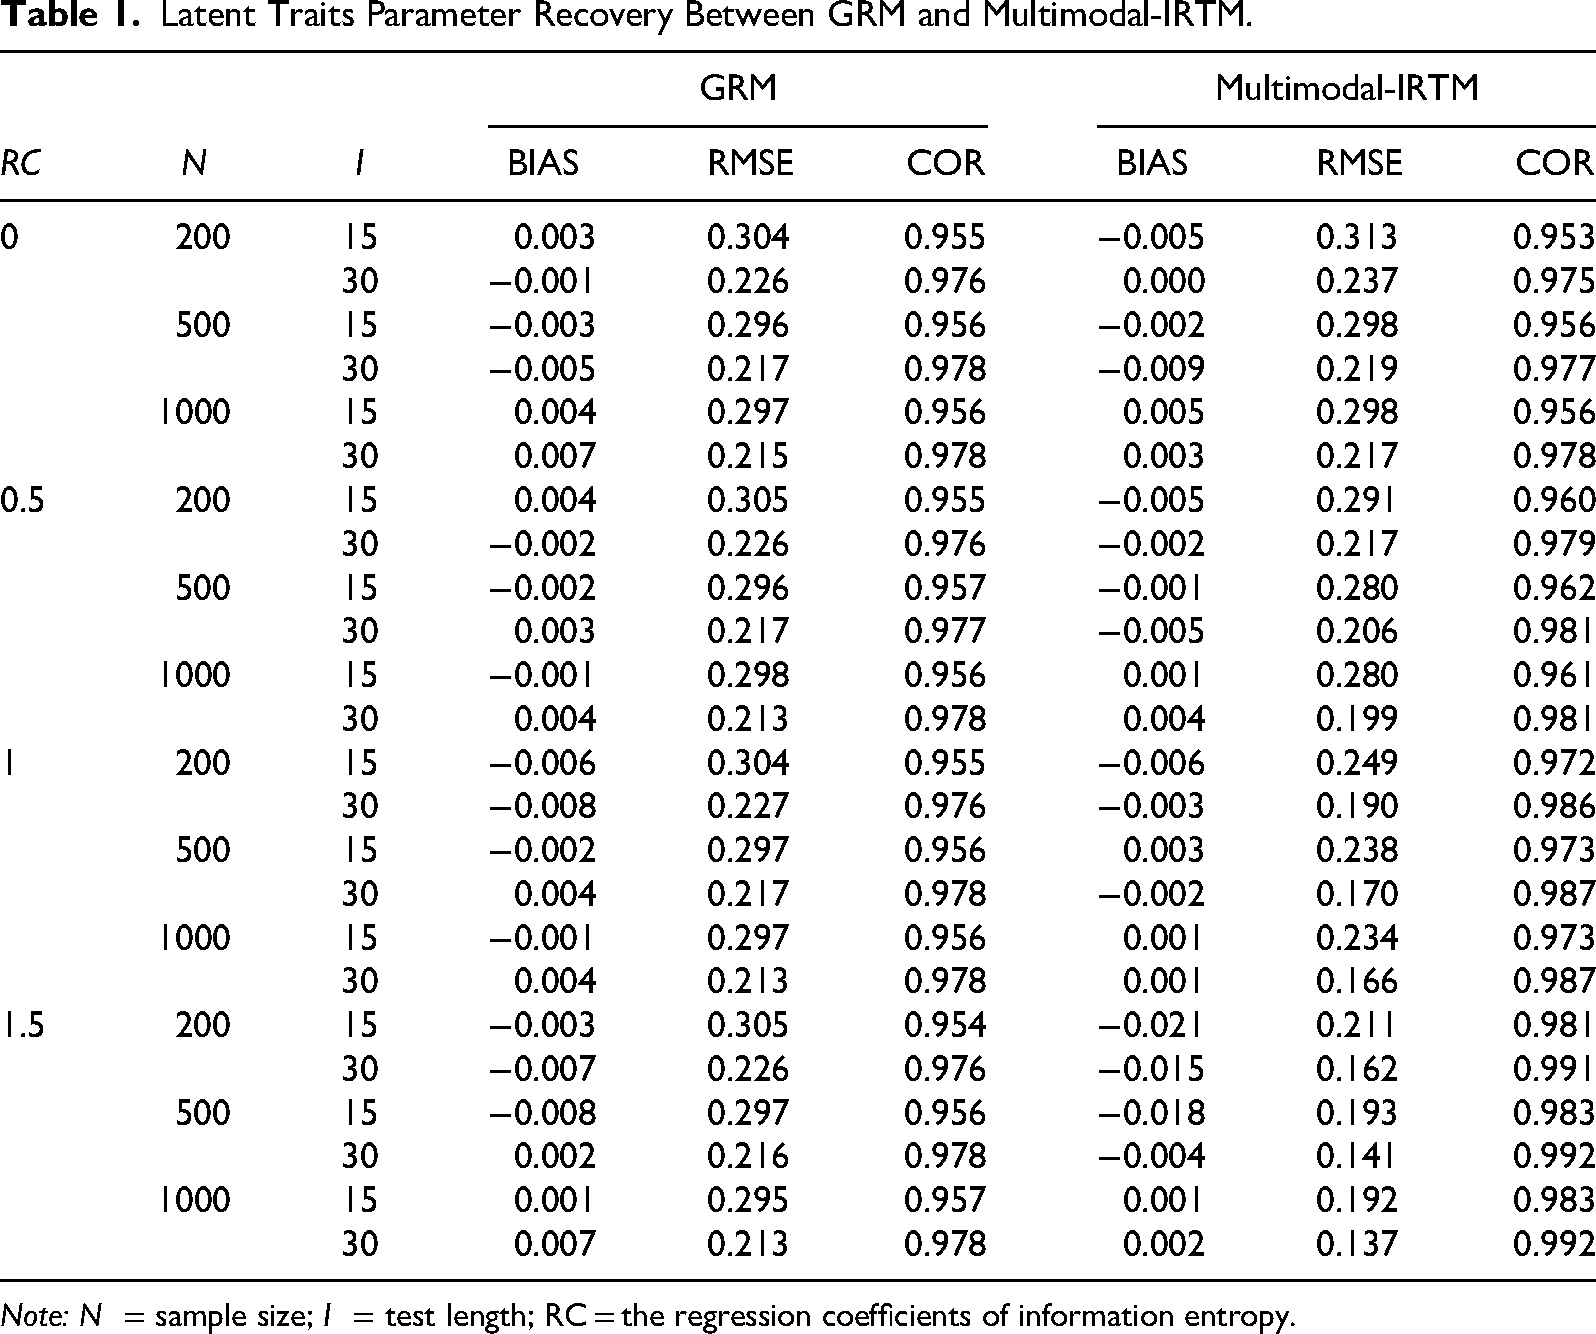
Figure 2 and Figure 3 report the recovery performance of item parameters (i.e.,
Boxplots of RMSE for item parameter recovery under the 15-item condition.
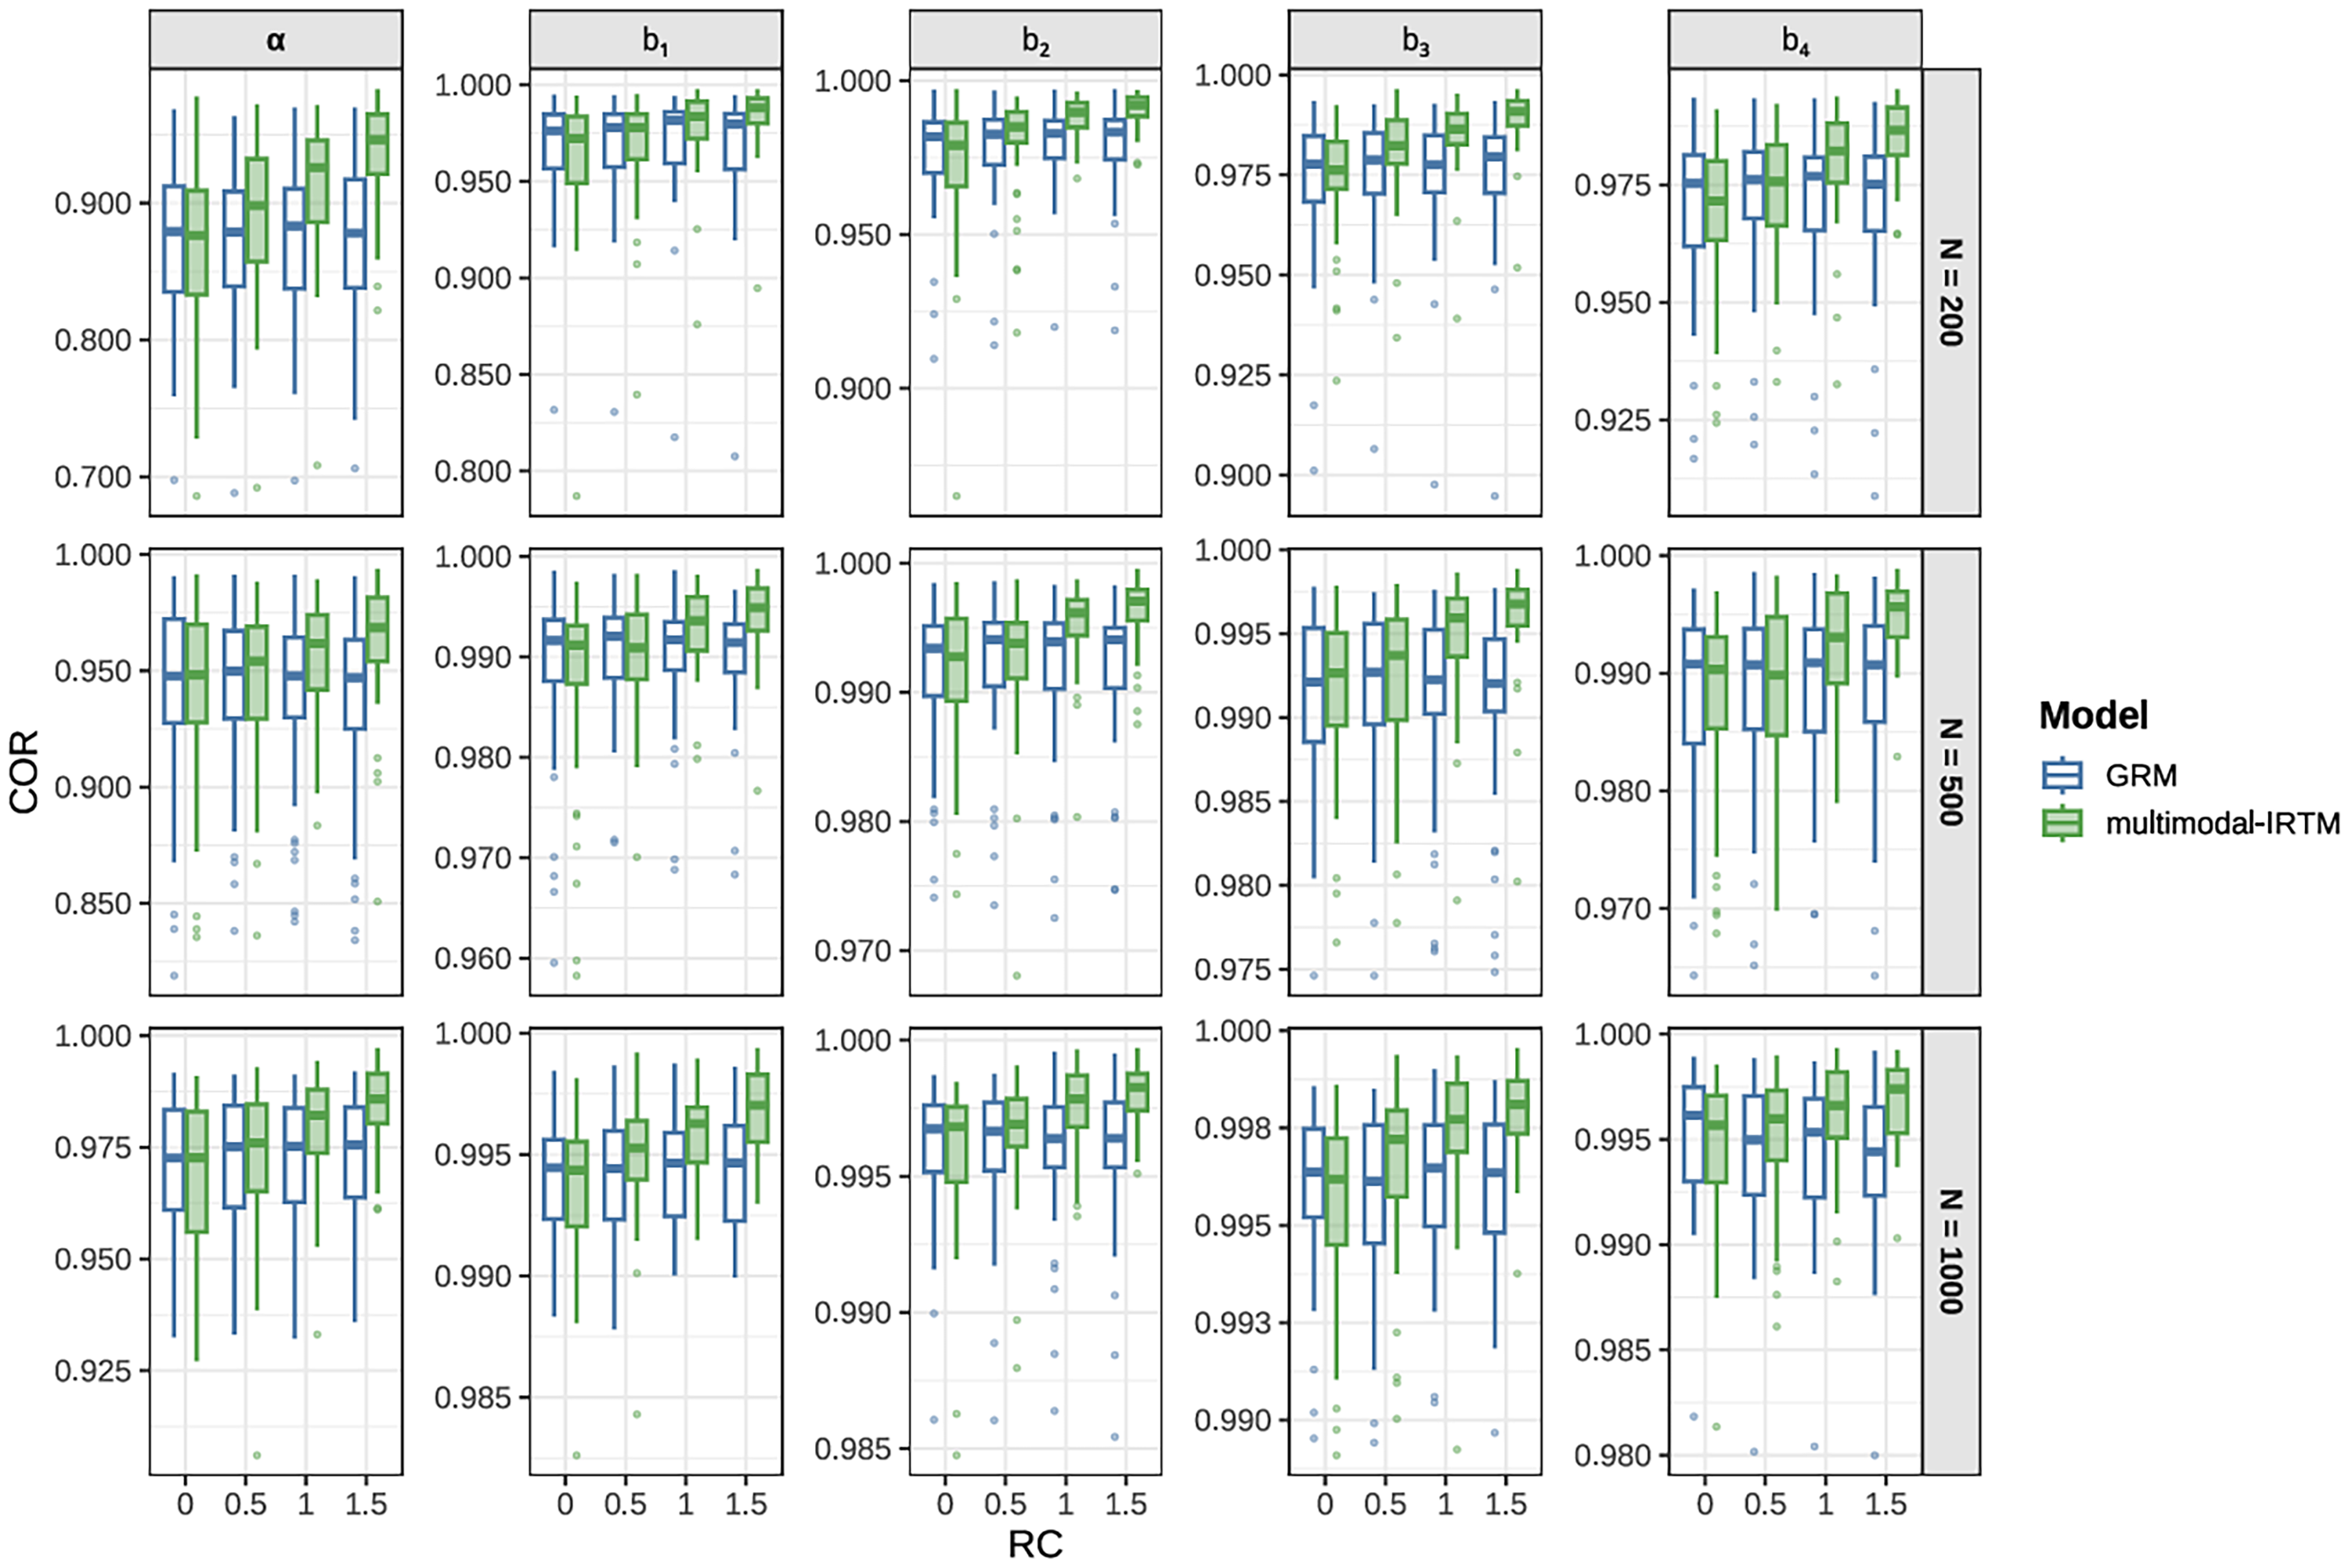
Boxplots of COR for item parameter recovery under the 15-item condition.
For the multimodal-IRTM, both item parameters were recovered with good accuracy, with the vast majority of RMSE values below 0.4 and COR above 0.8. Moreover, increases in sample size were associated with improved parameter recovery, reflected in lower RMSE and higher COR values at larger sample sizes. The estimation results for the four threshold parameters indicate that
Figures 2 and 3 clearly show that the item parameter recovery of the GRM is largely invariant to changes in RC. In contrast, for the multimodal-IRTM, RMSE decreases and COR increases as RC increases, indicating an overall trend of improving estimation accuracy. In other words, as RC increases, the advantage of the multimodal-IRTM over the GRM becomes increasingly pronounced. When RC was equal to zero, similar to the results for
When RC was equal to zero, and aside from the joint estimation of three sets of item parameters (i.e., the item threshold parameters
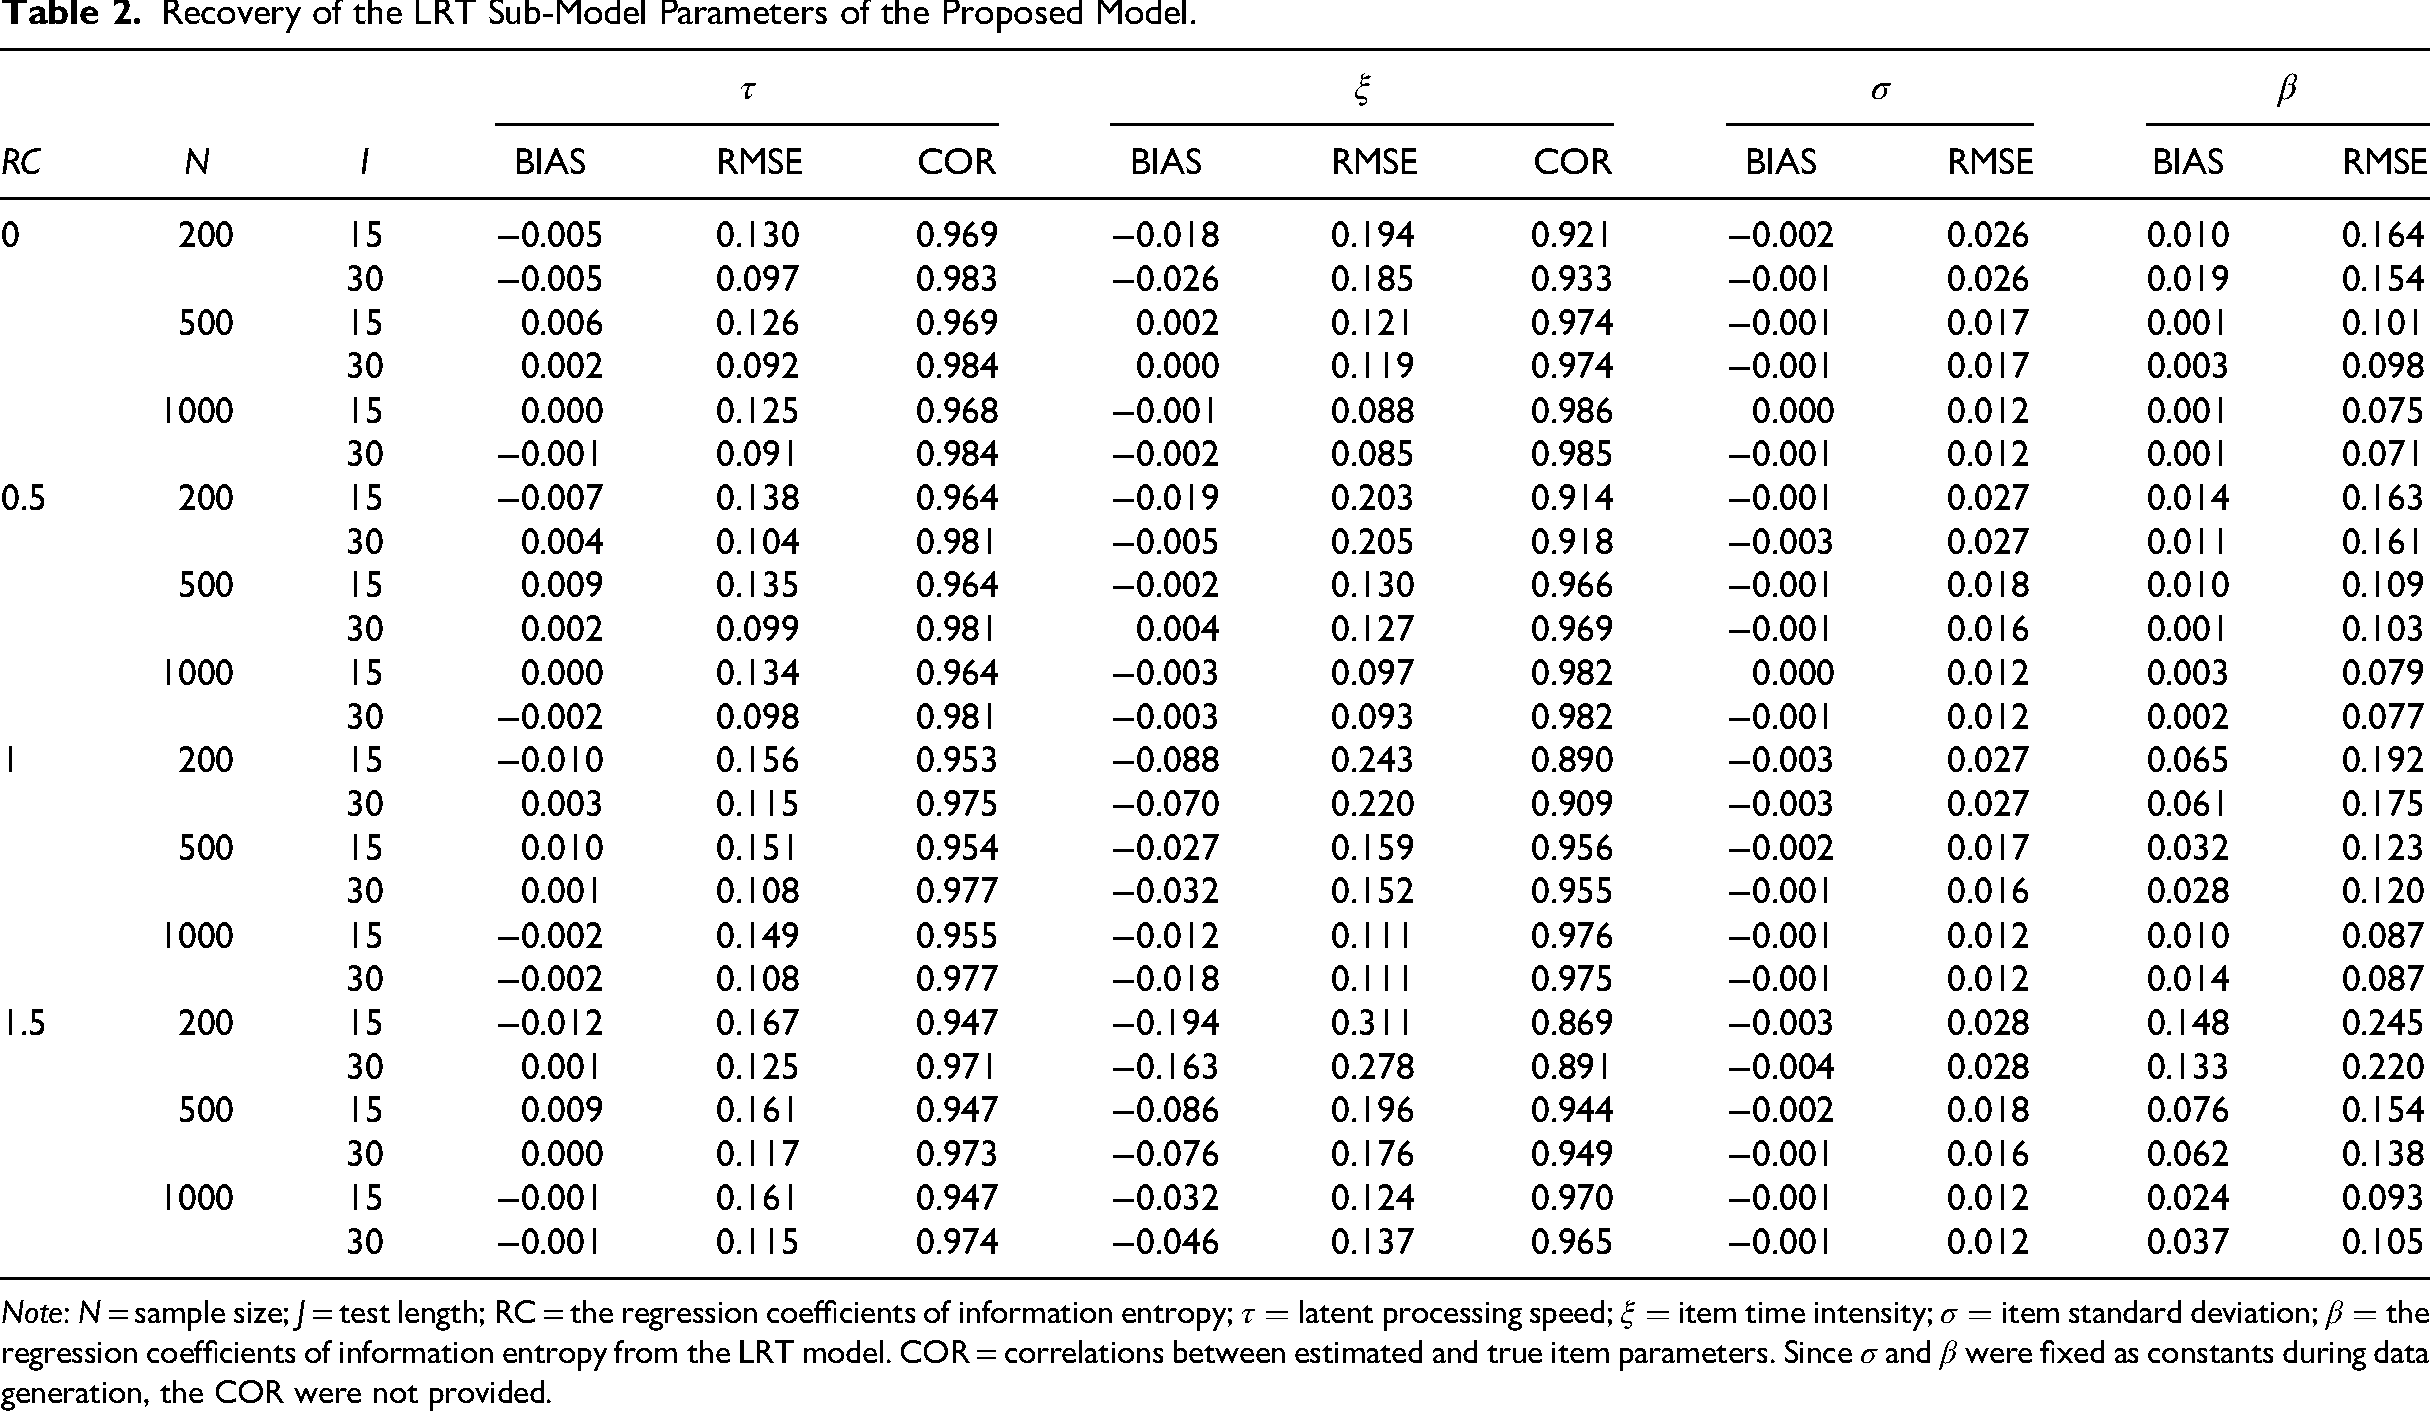
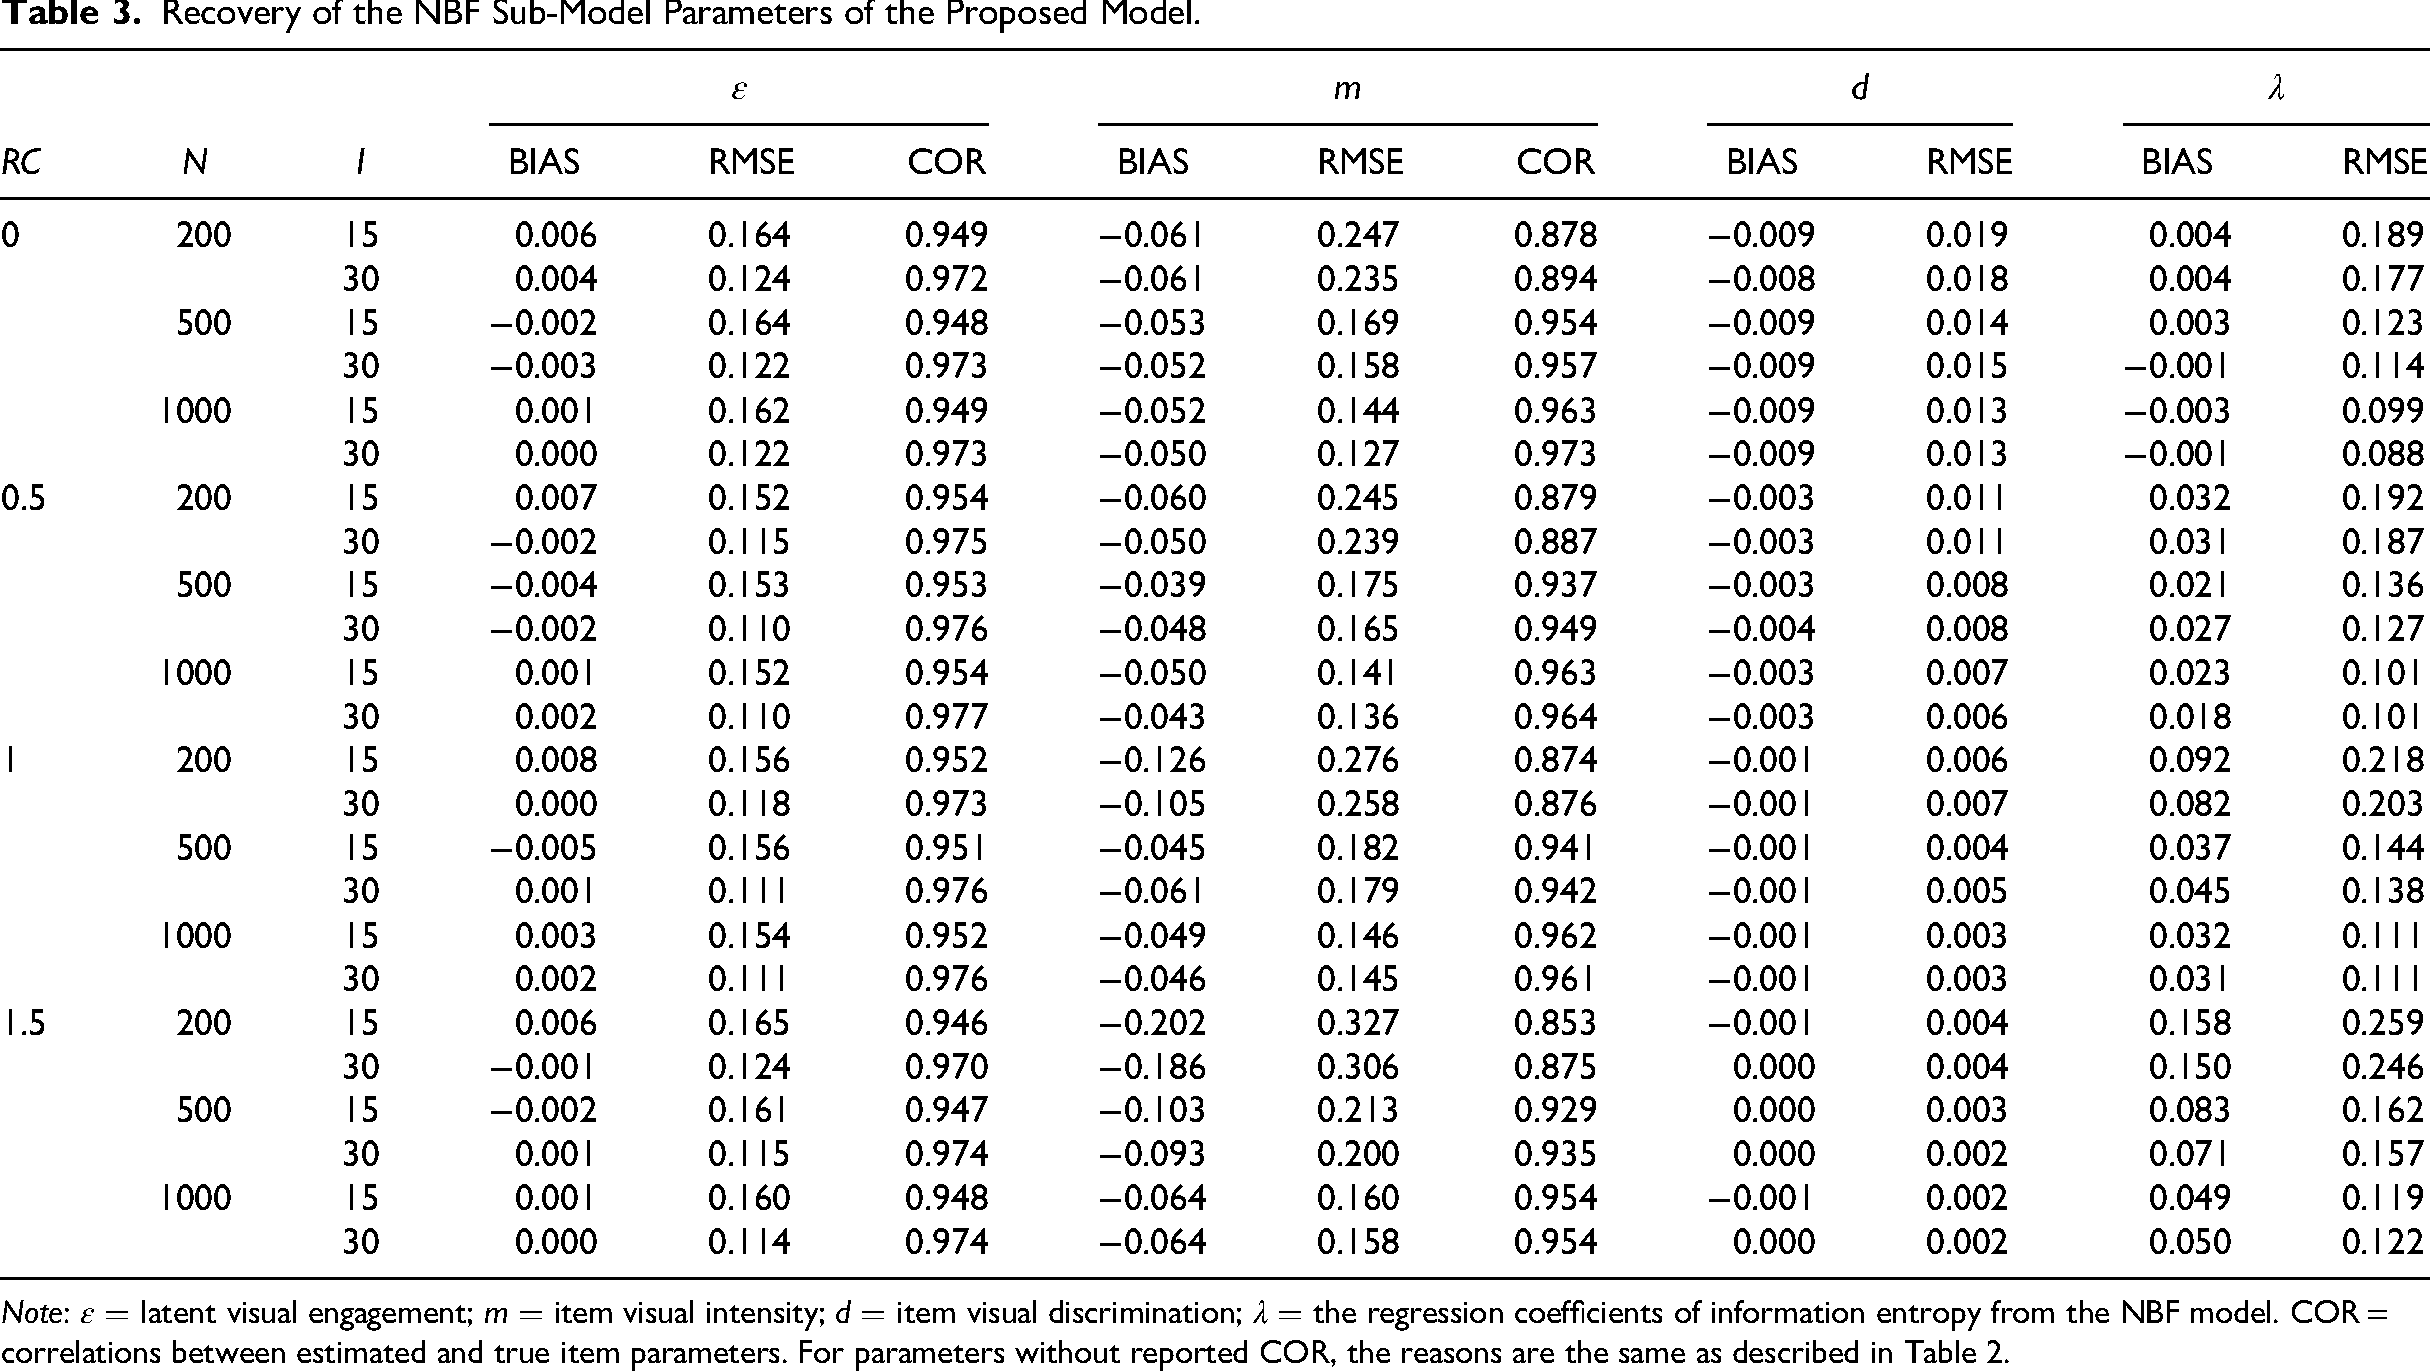
Tables 2 and 3 present the parameter estimates of the LRT model and the NBF model within the multimodal-IRTM framework, respectively. The multimodal-IRTM demonstrated satisfactory parameter recovery across conditions; larger sample sizes were associated with improved recovery of item parameters, whereas longer tests resulted in more accurate estimation of person parameters. However, as RC increased, the RMSE for the speed parameter increased slightly, a pattern also reported by Guo et al. (2024), which may reflect additional uncertainty introduced into the response model parameters.
Recovery of the LRT Sub-Model Parameters of the Proposed Model.
Note:
Recovery of the NBF Sub-Model Parameters of the Proposed Model.
Note:
As shown in Table 2, most BIAS values for the item time-intensity parameter
Empirical Data Application
Data Collection
To demonstrate the practical application of the proposed multimodal-IRTM model in personality assessment, we used the Chinese version of the Big Five Inventory (BFI; Li et al., 2025), whose items were selected from the International Personality Item Pool (IPIP; Goldberg, 1992). Response scores, response times, and eye-tracking data were collected using the Tobii Pro Fusion and Tobii TX300 eye trackers.
At the beginning of the questionnaire, participants were asked to provide demographic information, including age, gender (1 = male; 2 = female), and educational level (1 = Bachelor's degree; 2 = Master's degree; 3 = Doctoral degree or higher). Additionally, all participants provided informed consent prior to completing the formal tasks.
The experiment was conducted in a controlled eye-tracking laboratory setting. The study utilized a web-based program developed in Visual Studio Code, which incorporated the Big Five Personality Inventory. The program was deployed on a computer connected to a Tobii eye tracker, through which participants completed the questionnaire. During the task, the program automatically recorded participants’ response times and eye-movement data from the onset of each item to the corresponding keypress. Participants rated each item on a 5-point Likert scale ranging from 1 (strongly disagree) to 5 (strongly agree). Prior to the formal experiment, an example item was presented to illustrate the response procedure, and participants were encouraged to seek clarification from the experimenter if needed.
Data Description
Data were collected from undergraduate students enrolled at two universities across different provinces in China. Participants with color blindness, strabismus, severe myopia, or significant interocular differences in myopia were excluded to minimize potential sources of bias. The study initially recruited a total of 262 participants. After applying quality control filters (i.e., eye-tracking data with a sampling rate below 85% (He et al., 2025) and participants who failed either of the two attention-check items), 236 participants were retained for the final analysis. Among the final sample, 53 participants were male and 183 were female. The mean age was 21.58 years (SD = 2.82).
The scale comprised a total of 62 items, including 60 items assessing the Big Five personality traits (i.e., Agreeableness, Conscientiousness, Extraversion, Neuroticism, and Openness), with each trait measured by 12 items. Additionally, two attention-check items were inserted following the 20th and 40th items. In the current study, Cronbach's α coefficients for the five traits were 0.827, 0.887, 0.914, 0.917, and 0.865, respectively.
We simultaneously collected three types of data: response scores, response times, and visual FCs. Before analysis, observations with response times shorter than 0.3 s were excluded, as such rapid responses suggest that participants may not have adequately engaged with the items (Bunji & Okada, 2020; Guo et al., 2024). Response times were then converted to seconds and log-transformed to reduce skewness and limit the influence of outliers (Van der Linden, 2007). Visual FCs were computed using Tobii's default algorithm, which is based on the I-VT (Velocity-Threshold Identification) method proposed by Salvucci and Goldberg (2000).
Analysis
Model Convergence
Parameter convergence was evaluated using the potential scale reduction factor (PSRF; Brooks & Gelman, 1998), commonly denoted as
Model-fit
Bayesian leave-one-out cross-validation (LOO) and the Watanabe-Akaike Information Criterion (WAIC), as introduced in Watanabe and Opper (2010), were used as MCMC-based Bayesian model fit indices to evaluate and compare the relative adequacy of competing models, where lower values indicate better fit.
Since the GRM did not incorporate process data, such as response times or FCs, it was estimated using less information than the multimodal-IRTM, which integrates both outcome and process indicators. Hence, WAIC values from the GRM are not directly comparable with those from the multimodal-IRTM. To facilitate comparison between the GRM and multimodal-IRTM, we adopted the separate modeling approach (Meng et al., 2013; Zhan, 2022), consistent with conventional psychometric practice, in which each modality is modeled independently and the GRM, LRT, and NBF models are analyzed separately. For convenience, the three models generated using the separate modeling approach are hereafter referred to as the separate-Model. We then applied the separate-Model and the proposed multimodal-IRTM to analyze empirical data across the five dimensions of the Big Five Inventory (BFI). MCMC analyses were conducted using the nimble package in R. For each model, two MCMC chains were run for 60,000 iterations each, with the first 50,000 iterations discarded as burn-in.
Results
As shown in Table 4, across all analyses of the five personality dimensions, convergence diagnostics indicated satisfactory convergence for both the separate-Model and multimodal-IRTM, with at least 95% of parameter estimates in each dimension exhibiting a potential scale reduction factor (PSRF) below 1.2. Table 4 also presents model fit indices for the separate-Model and the proposed multimodal-IRTM applied to the empirical data. Across all five dimensions of the Big Five personality traits, the multimodal-IRTM produced lower LOO and WAIC values than the separate-Model, indicating superior model performance. For multimodal data, jointly modeled approaches achieve better fit than models that analyze each modality separately.
Model Convergence and Model Fit in Real-Data Application.
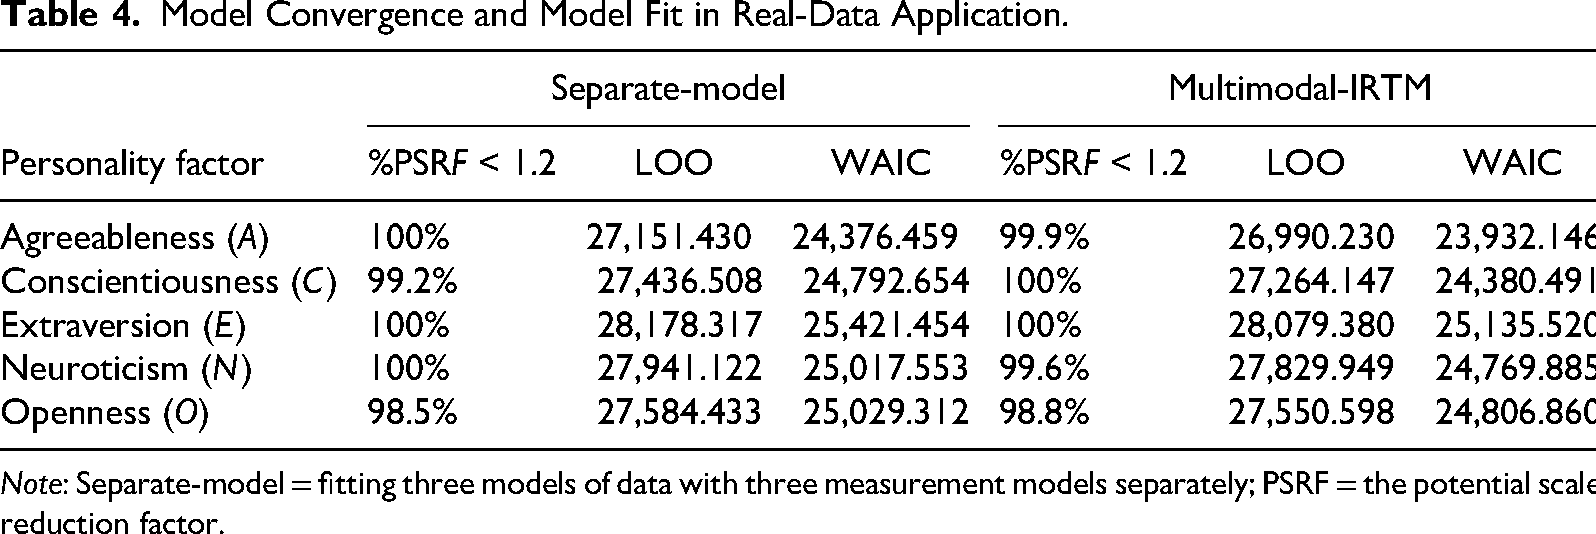
Note: Separate-model = fitting three models of data with three measurement models separately; PSRF = the potential scale reduction factor.
Table 5 reports the estimates of item parameters for the three measurement models in the multimodal-IRTM corresponding to the Agreeableness dimension (similar patterns were observed for other dimensions; details are provided in Part 2 of the Supplemental Document), along with the regression coefficients
Estimates of Item Parameters for the Multimodal-IRTM Model in Empirical Data (Dimension A).
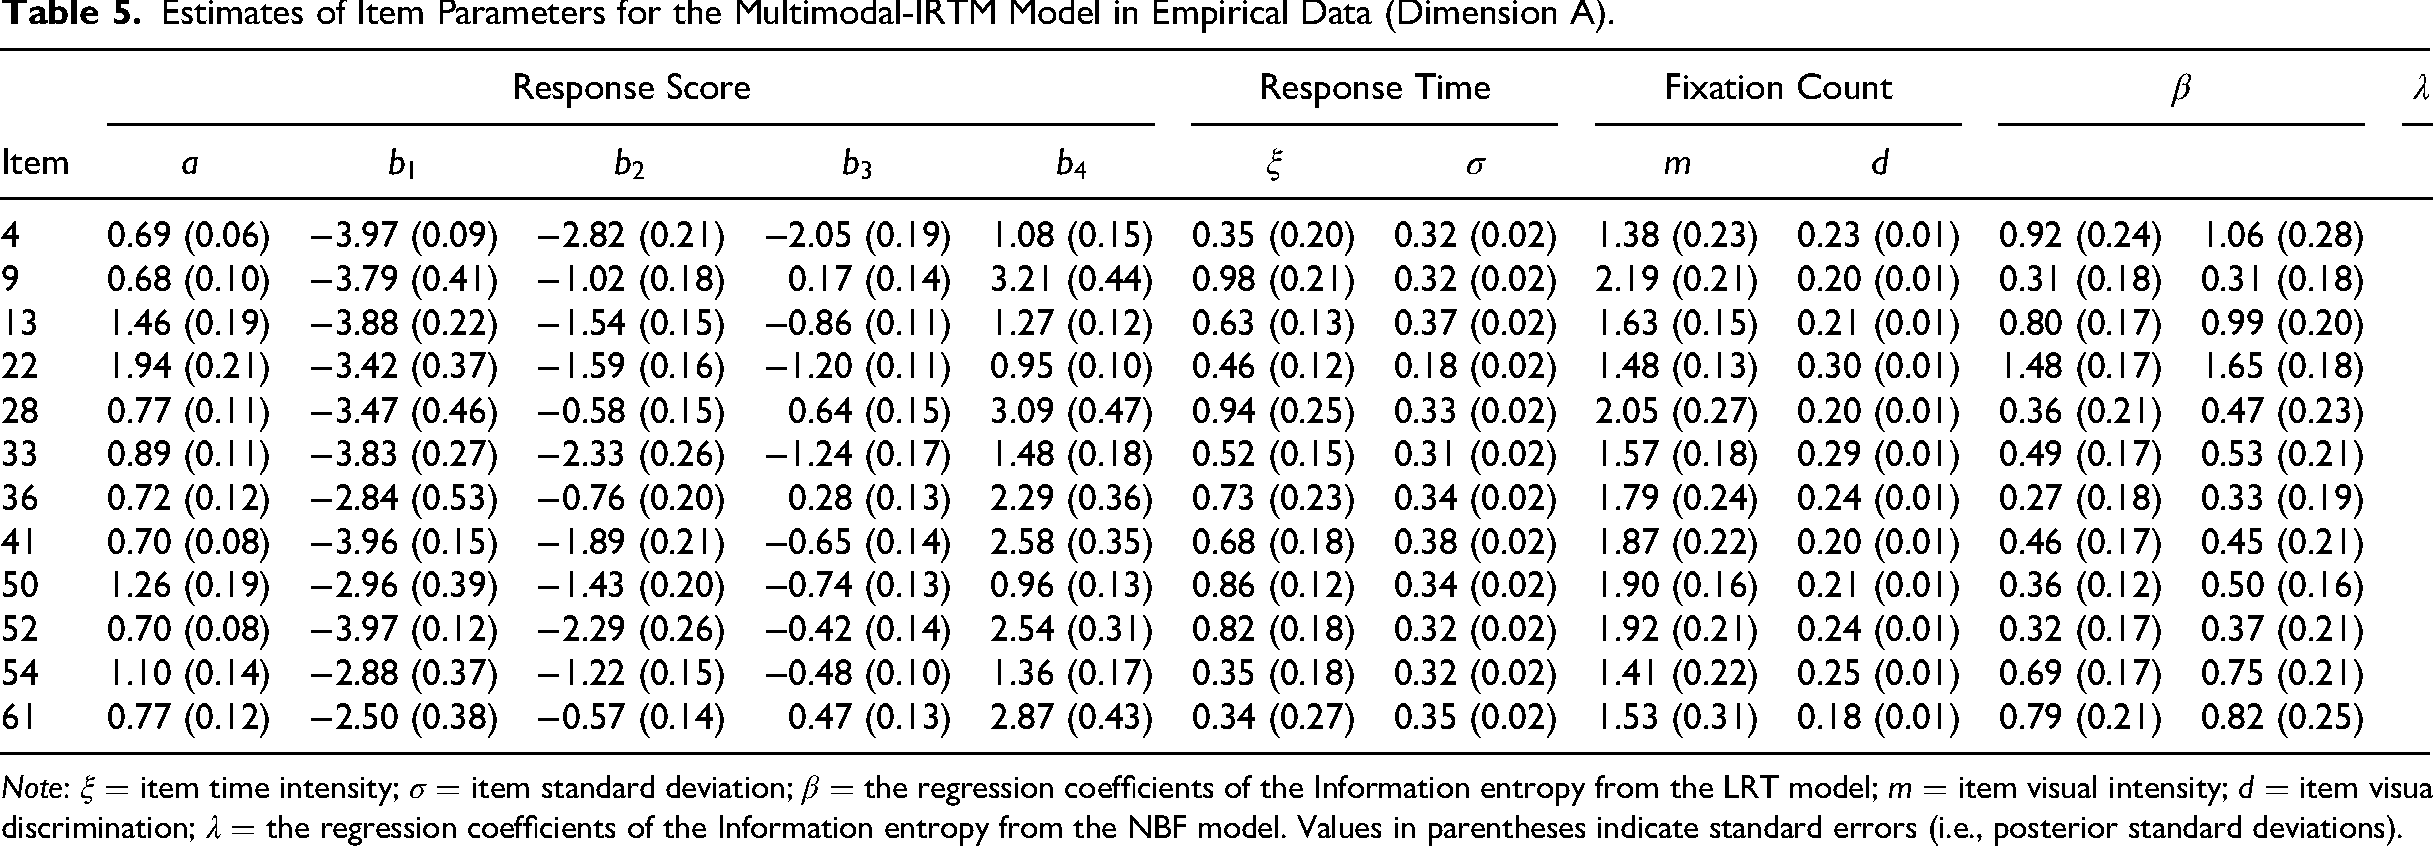
Note:
Figure 4 presents the distributions of posterior standard deviations for latent trait estimates across the five personality dimensions. Posterior standard deviations are generally low, indicating that latent traits are estimated with adequate precision for the current sample size (N = 236). Notably, measurement precision varies across dimensions, with Openness showing relatively greater dispersion and Extraversion displaying the most concentrated estimates. The presence of a few right-tailed observations in Agreeableness indicates that some respondents were located in regions of the latent continuum with lower information. Importantly, despite the increased complexity introduced by multimodal process data, posterior standard deviations remain well controlled, supporting robust recovery of individual differences.
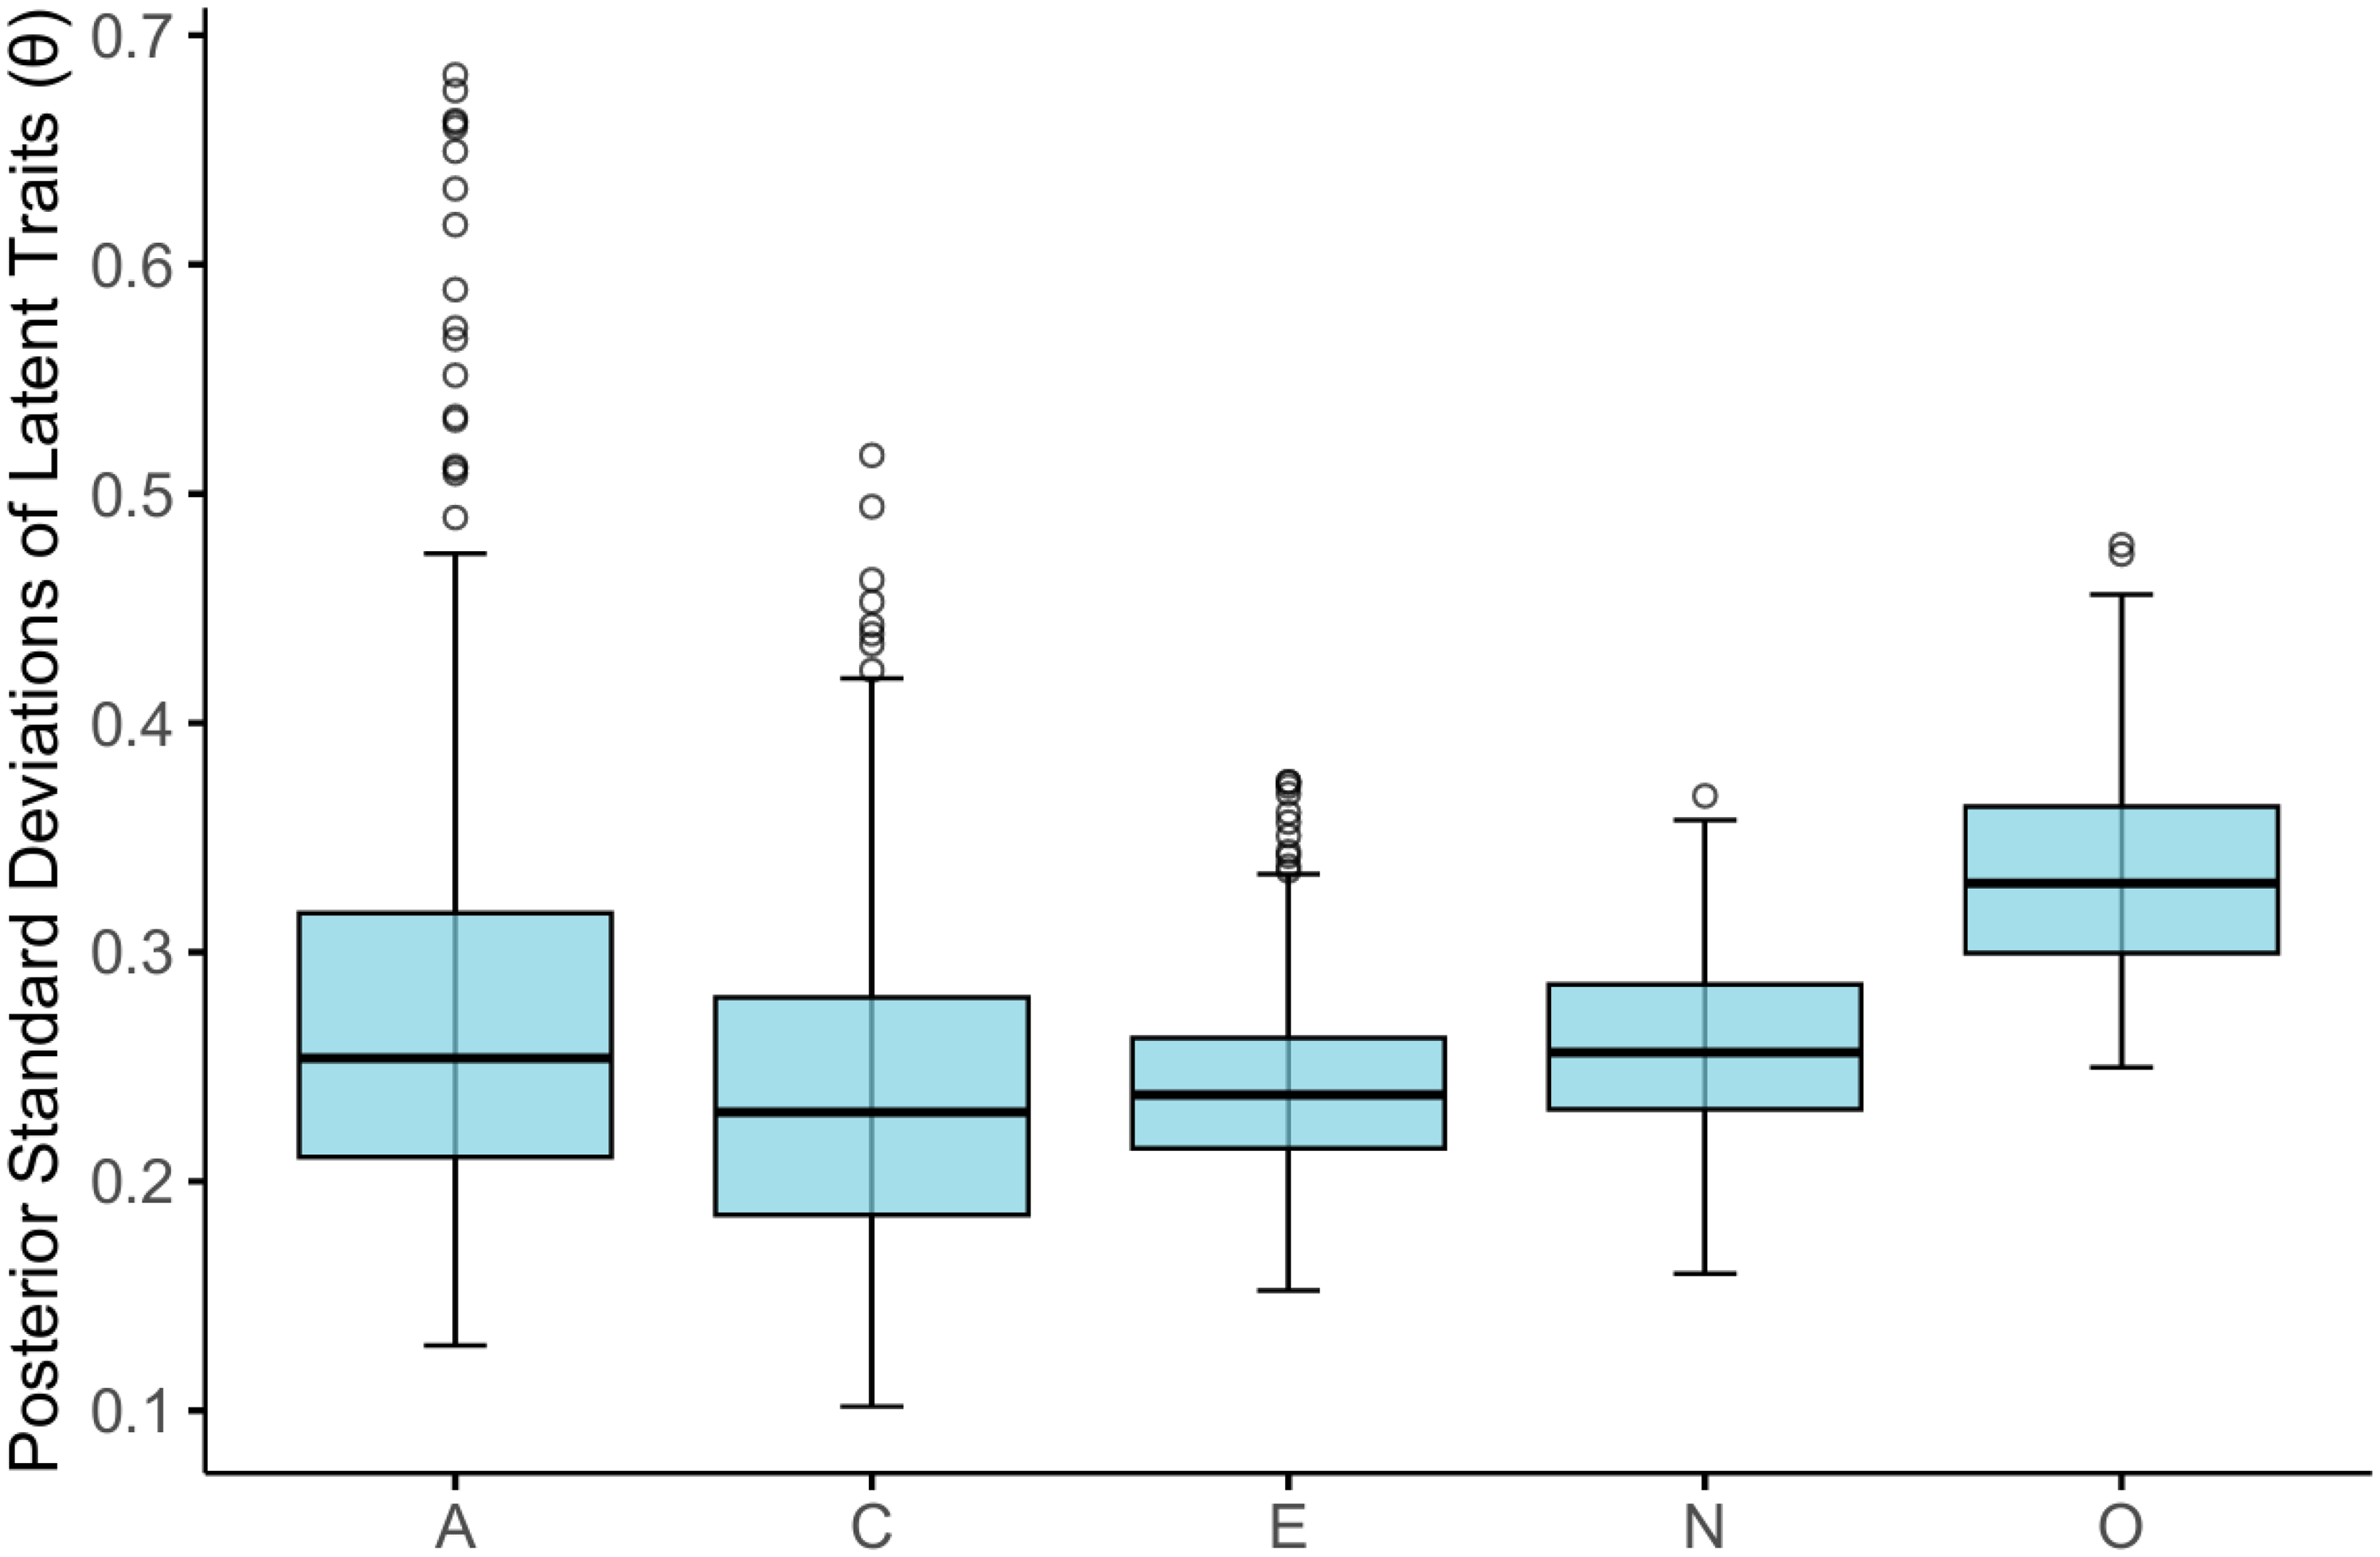
Boxplots of posterior standard deviations of latent traits (
To assess the fit of the multimodal model to the multimodal data, we examined scatter plots comparing observed and predicted log-RTs and FCs for each item in the Agreeableness dimension across all respondents (see Figure 5). Results for the other dimensions displayed a similar pattern. For brevity, detailed results for the remaining dimensions are provided in Part 3 of the Supplemental Document. In all cases, the relationships appeared essentially linear. The absence of significant nonlinear trends indicates that the model adequately captured item-level relationships. The scatter plots showed that predicted values closely matched the observed values. For both log-RTs and FCs, the multimodal model accurately captured the underlying data structure.
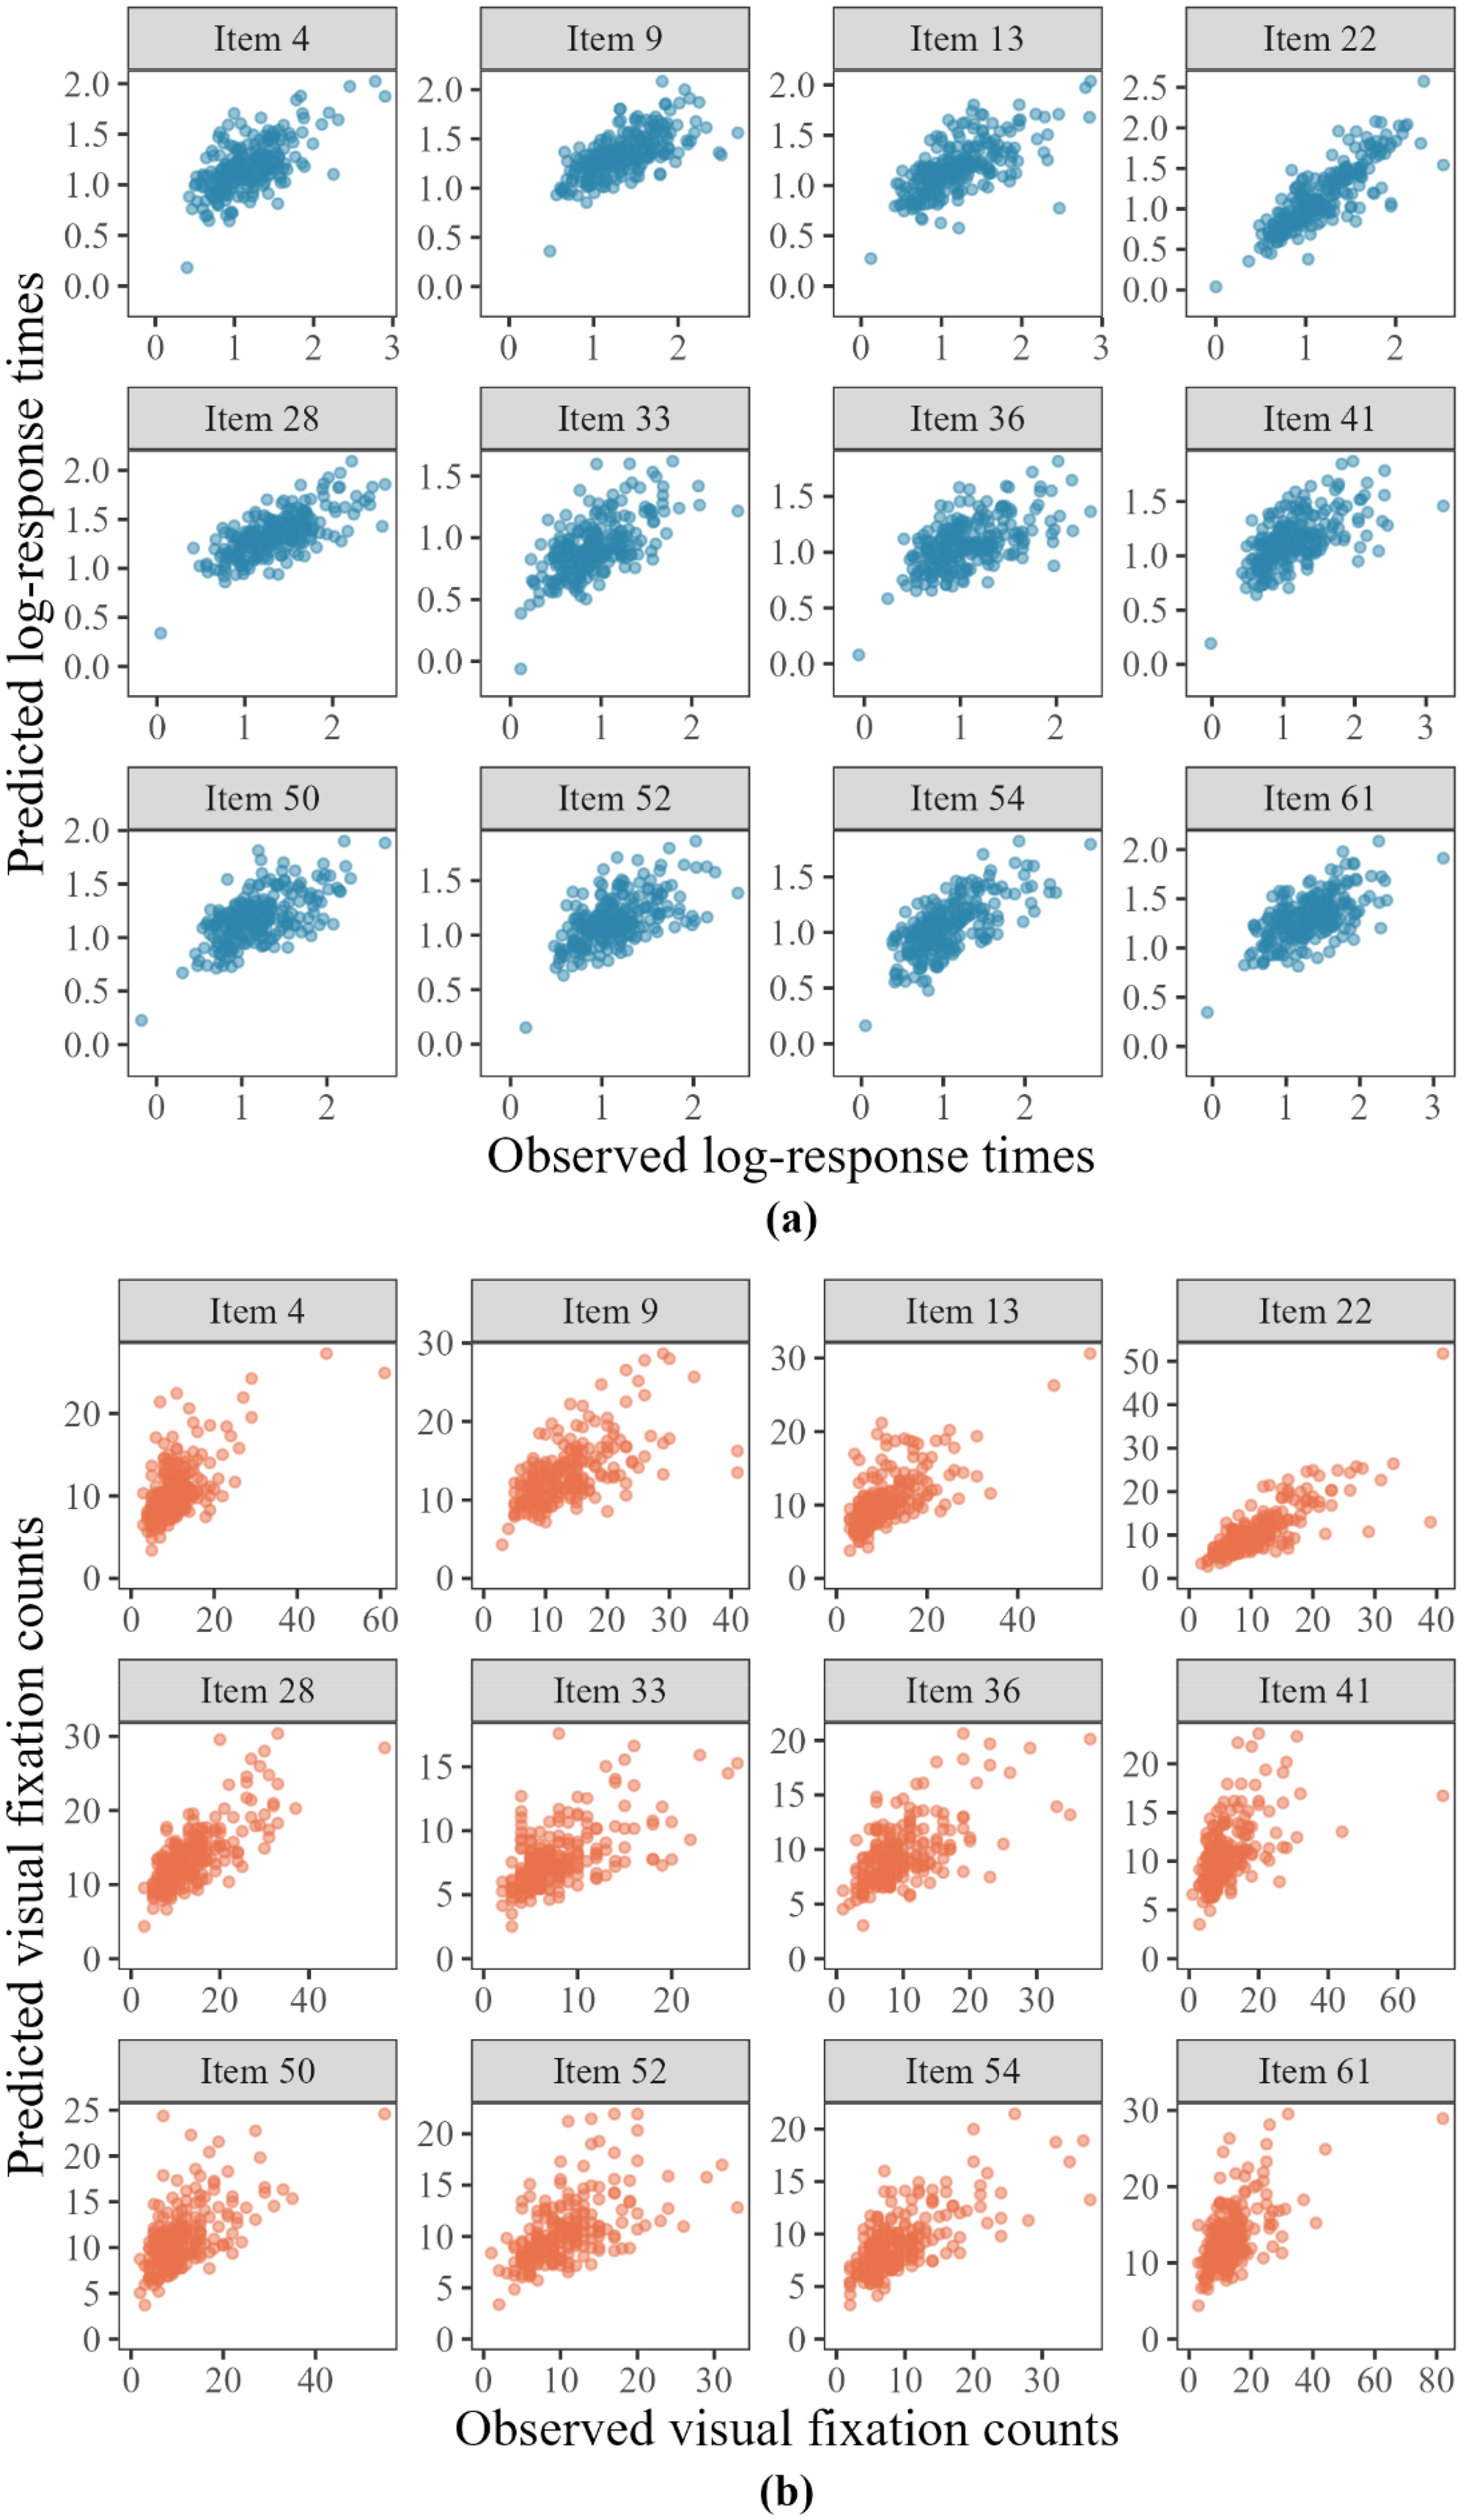
Scatter plots of the observed and predicted multimodal data for 12 agreeableness items: (a) log response times (log-RTs) data; (b) fixation counts (FCs) data.
Eye-Tracking Trajectory Analysis
Figure 6 presents the response patterns of participant #228 for two items within a single dimension, where panels (a) and (b) are both positively keyed, indicating that higher scores reflect greater endorsement of the construct, with response options ranging from “1 strongly disagree” to “5 strongly agree.” More examples can be found in Part 4 of the Supplemental Document.
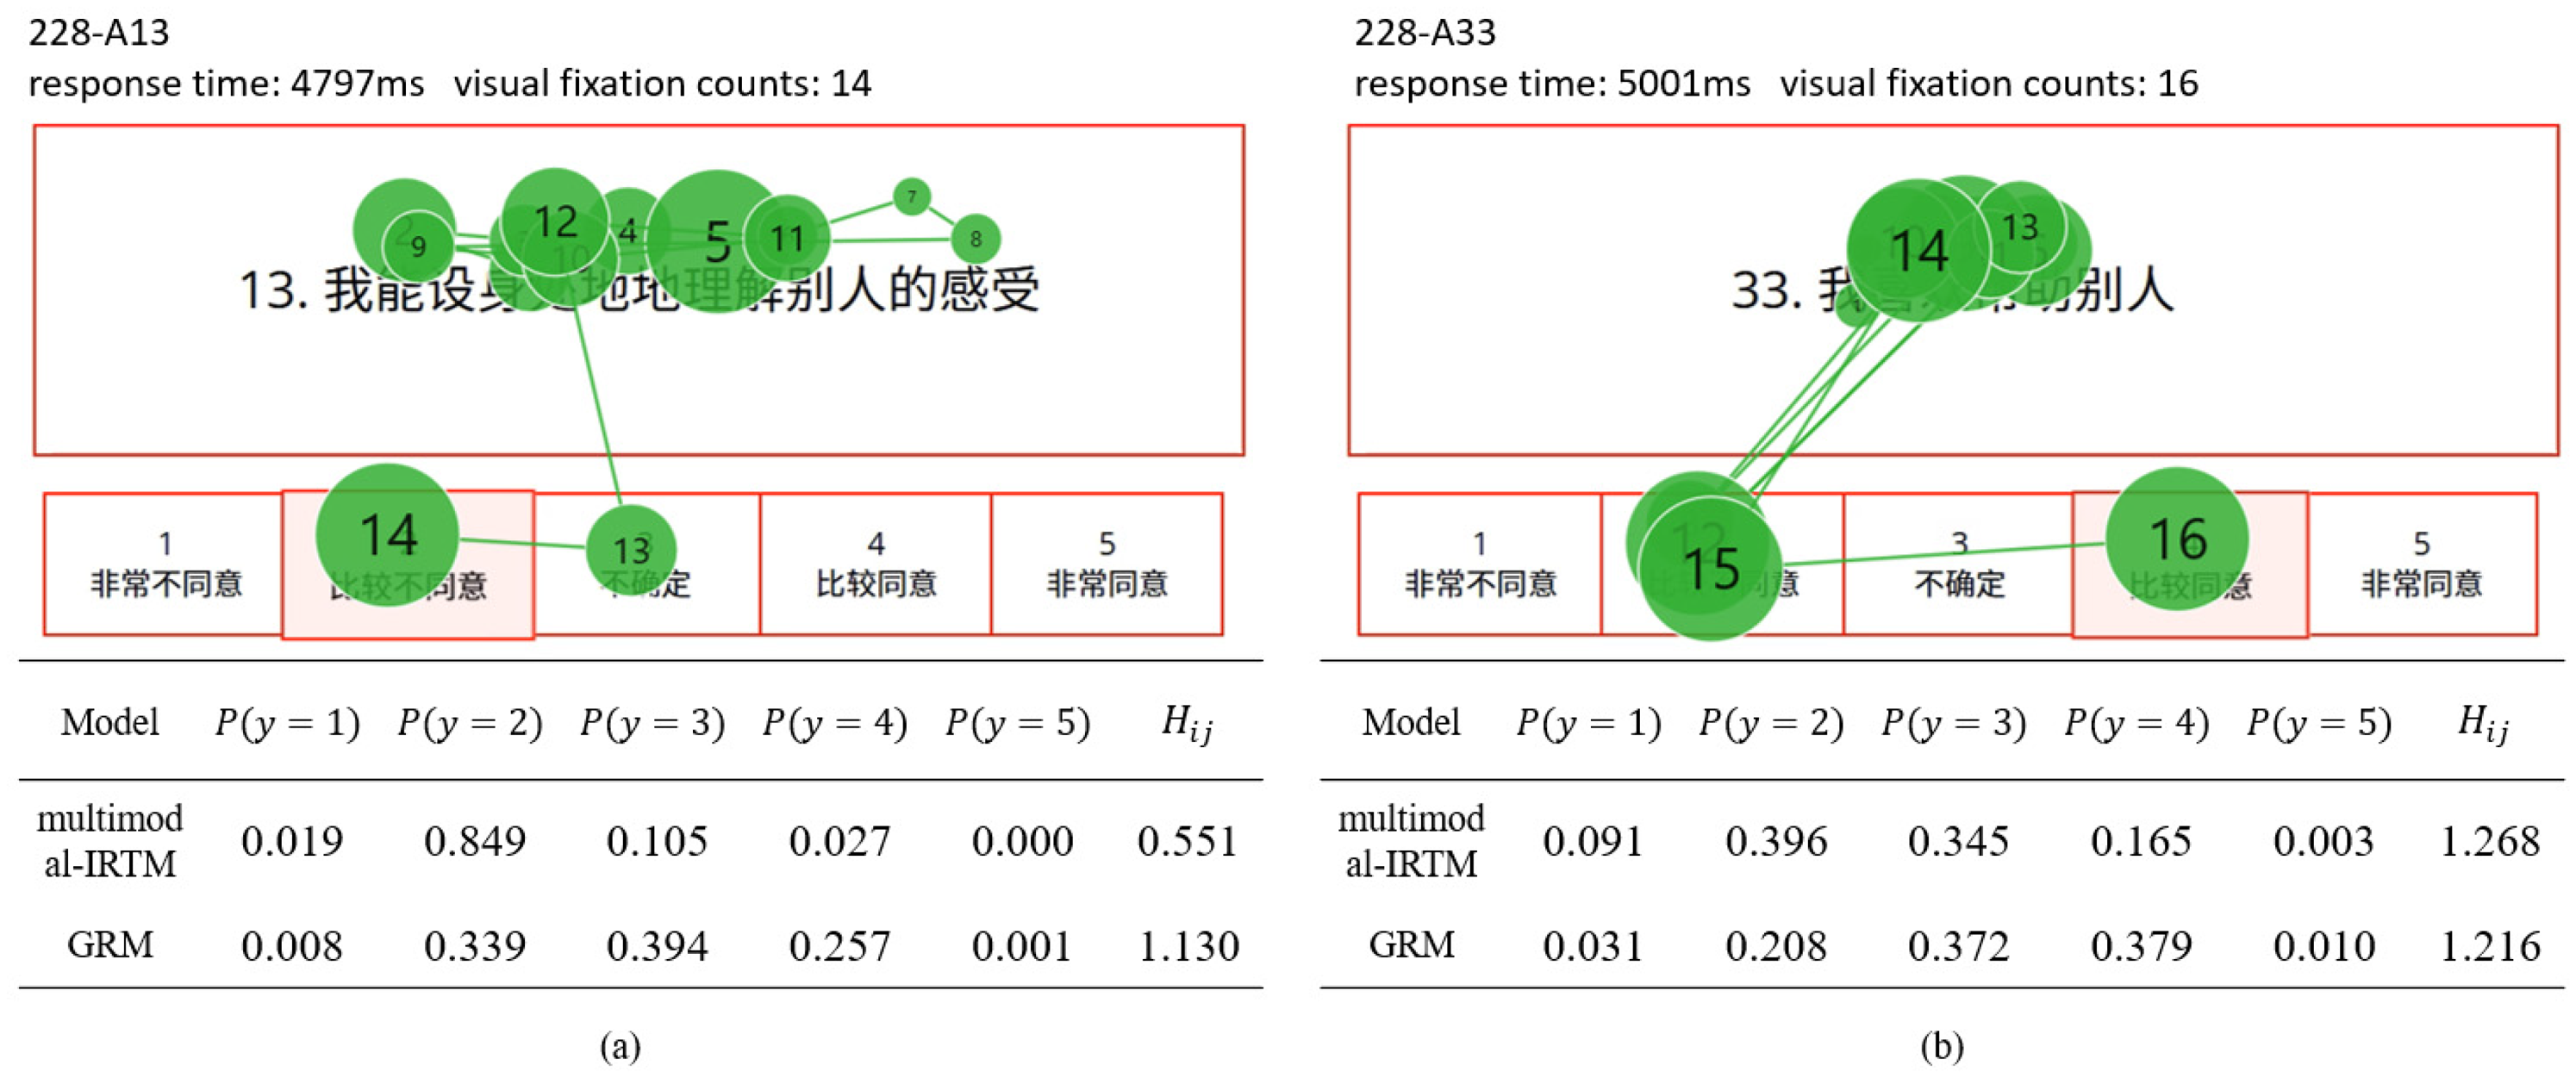
Response probabilities, information entropy and eye-movement trajectories of participant 228.
As shown in Figure 6(a), the participant's eye-movement pattern was relatively straightforward. More fixations and longer fixation durations were observed on the item stem, indicating that the participant devoted considerable effort to understanding the item. However, fixations on the response options were few, indicating that the participant made the selection with minimal hesitation and confidence. In contrast, panel (b) of Figure 6 shows that the participant exhibited uncertainty regarding the response options. After reading the item stem, the participant initially fixated on option “2 disagree” without making a decision. The participant then returned to the item stem for further cognitive processing, revisited option “2 disagree,” and ultimately changed the selection to “4 agree.” Had the participant been certain, the total number of fixations would have been approximately 12. However, due to hesitation and additional cognitive processing, the participant re-evaluated both the item stem and response options before making a final selection. The additional four fixations likely reflect the participant's response uncertainty.
Both the separate-model (i.e., the GRM) and the multimodal-IRTM were applied to analyze the empirical data. The table below the figure displays the response probabilities for all five categories under both models, alongside the corresponding information entropy. The alignment between predicted response probabilities and eye-movement trajectories shows that the multimodal-IRTM produces category probabilities that more accurately correspond to observed eye-movement patterns during the response process. Response uncertainty for panel (a) was low; however, predicted probabilities from the GRM indicate a comparatively high level of uncertainty. Furthermore, as shown in panel (a), the eye-tracking trajectory shows that the respondent did not fixate on option “4 agree,” whereas the GRM predicted a relatively high probability for this category. Taken together, by incorporating multimodal process data, the multimodal-IRTM better aligns with participants’ observed behavioral patterns than traditional response-only models.
The present study examines the association between participants’ latent traits and eye-FCs by modeling response uncertainty, under the assumption that cognitive uncertainty during the response process is reflected in multimodal measurements. This link is supported by analyses of eye-movement trajectories. Due to uncertainty in decision-making, participants engaged in more extensive cognitive processing, manifested as increased FCs. In other words, these additional fixations, exceeding both participants’ average fixation levels and the item-level average required fixations, are captured in the model by the latent visual engagement and item visual intensity parameters. In summary, by modeling uncertainty through information entropy, participants’ latent traits are linked to response times and visual FCs, enabling the model to represent cognitive processes during responding as reflected in multimodal measurements.
Discussion
Summary of the Present Study
Personality assessment plays a crucial role in organizational research, facilitating the selection of individuals whose traits align most closely with job requirements. If latent trait estimates can be made more precise, assessments will yield more informative and reliable guidance for personnel selection. Advances in technology have lowered the barrier to collecting rich process data, allowing researchers to capture information (e.g., response time, eye movements, mouse trajectories) that extends well beyond traditional self-reports. Multimodal assessment holds substantial potential. As noted in the introduction, research in cognitive and achievement testing increasingly demonstrates that incorporating multimodal data enhances measurement precision, provides deeper insights into test-taker behavior, and improves assessment quality and informativeness. However, despite their potential, the use of multimodal process data in noncognitive personality assessment remains limited, which is regrettable given its promise to improve measurement quality and support more effective personnel selection, job placement, and broader organizational decisions.
This research, situated in personality assessment using Likert-type items, leverages response uncertainty to connect participants’ latent traits with two types of process data: response times and eye-tracking measures. Using this link as a cross-loading term, we develop a joint model for response scores, response times, and visual FCs, referred to as the multimodal-IRTM. A simulation study evaluated the parameter recovery of the proposed model under multiple conditions. The results indicate that the MCMC algorithm yields reliable parameter estimates and that model parameters exhibit satisfactory recovery.
The simulation study also evaluated the performance of the proposed model relative to the GRM. In the simulation study, when the regression coefficient is positive, the person parameters (
In addition, the response probabilities estimated by the multimodal-IRTM are more consistent with participants’ eye-movement patterns. The findings in Figure 6 align with our expectations. Compared with the GRM, response probabilities from the multimodal-IRTM more closely matched the category preference patterns observed in eye-movement trajectories. One possible explanation is that this cognitive process arises from the mismatch between the five discrete Likert categories and the continuous latent traits. Confronted with this limitation, respondents engage in a decision-making process in which they select the option that better, rather than perfectly, represents their latent traits. The resulting score therefore reflects a comparative evaluation, and this cognitive decision-making process is evident in the multimodal data, as indicated by longer response times and increased fixations.
What Are the Advantages of the Proposed Multimodal-IRTM in Organizational Research?
As Meißner and Oll (2019) noted, “the time is right to expand the standard methodological toolkit of organizational scholars by bringing eye-tracking to their minds and hands.” In organizational research, incorporating multimodal data into noncognitive assessment represents a promising alternative to traditional self-report–based methods. This study proposes a method capable of simultaneously analyzing participants’ scores alongside multimodal data. By integrating multimodal behavioral data, richer layers of information can be accessed, enabling a more comprehensive and accurate estimation of participants’ latent traits. The key innovations of this approach are outlined as follows:
Enriching Self-Report Analysis with Multimodal Data. The present model provides a framework for integrating multimodal data with self-report scores, enabling self-report measures to be complemented by behavioral information. In future research, additional multimodal sources—such as eye-tracking, physiological signals, facial expressions, and mouse trajectories—could be incorporated to enrich organizational behavior studies. This approach can further enhance the assessment of latent constructs, capture underlying response dynamics, and improve both the precision and interpretability of self-report measures in applied contexts, including talent selection, employee development, and high-potential identification. Increased Person Traits Assessment Precision. Simulation results indicate that when the regression coefficient exceeds zero, the RMSE of latent trait estimates decreases, and the correlation between estimated and true latent traits increases. In the empirical study, the proposed model also produced lower LOO and WAIC values. Moreover, analyses of eye-tracking trajectories indicate that the model incorporating multimodal data generates predicted response patterns that more closely align with eye-movement patterns than predictions based solely on response scores. By incorporating behavioral and process-based indicators, multimodal assessment extends beyond static self-reports to capture latent differences in response processes that are unobservable from final Likert ratings. These latent differences allow researchers to distinguish individuals with similar observed scores but differing response patterns or decision-making strategies. This approach further enhances the model's ability to differentiate respondents with similar observed scores yet varying response behaviors or cognitive strategies. In practice, the proposed model can produce richer talent profiles for applications including personnel selection and high-potential identification. Beyond providing more accurate trait scores, the model also generates process indicators that enable practitioners to differentiate candidates with similar scores but varying levels of response stability. This, in turn, supports more informed and comprehensive talent decisions and reduces the risk of misclassification. Enhanced Interpretation of Process Data. Process-level behavioral data offer insights into several aspects of respondents’ noncognitive test performance, including: (a) person's main effect, (b) item's main effect, and (c) the person–item interaction effect. By explicitly modeling cross-loadings between person–item interactions (i.e., information entropy) and process indicators, this model directly connects latent traits to observed process behaviors. Unlike traditional hierarchical frameworks, which primarily capture correlations between latent traits and process variables without specifying mechanisms, the present model provides a more precise account of how respondents’ latent characteristics influence behavioral manifestations during the response process.
What are the Recommendations for Multimodal Assessment
Provision of R codes and detailed instructions. To facilitate replication and application of the proposed multimodal assessment models, R code implementing the MCMC analyses has been made available (https:/osf.io/wuq5d/overview). The resource includes two main components: (1) annotated R code for performing Multimodal MCMC analyses of simulation studies, and (2) a tutorial demonstrating how to apply the Multimodal MCMC method to empirical data. This enables other researchers to reproduce the analyses and adapt the code for their own datasets.
Consideration of sample size. Our simulation results indicate that when each group comprises more than 200 respondents, the proposed method performs reliably, supporting its direct application in routine assessment scenarios, including internal talent reviews and targeted recruitment within organizations. When higher estimation precision is required (e.g., for core position hiring or key talent evaluation), it is recommended to increase the sample size to over 500 to further reduce the RMSE of parameter estimates and improve the stability of results.
Flexibility to incorporate alternative multimodal data. The modeling framework permits seamless integration of additional process-level indicators, such as mouse-tracking, EEG, or electrodermal activity, without altering the core model structure. This flexibility facilitates adaptation to diverse organizational assessment contexts and allows exploration of how various multimodal signals enhance latent trait estimation. It is reasonable to anticipate that researchers will soon overcome current hardware limitations, enabling the acquisition and analysis of a broader range of multimodal data in large-scale assessments, thereby further increasing the applicability and impact of these models.
What Are the Limitations of the Current Study and Future Directions?
This study has several limitations that warrant further investigation in future research.
First, the present study employed the graded response model (GRM) as the psychometric foundation for the proposed multimodal framework. The GRM represents one of several viable models within the broader family of polytomous IRT. Future research could broaden this work by incorporating alternative polytomous IRT models, such as the partial credit model (PCM), generalized partial credit model (GPCM), or nominal response model (NRM). Moreover, personality and organizational assessments frequently involve multidimensional latent constructs. For example, the empirical dataset used in this study, the Big Five Personality Inventory, is multidimensional. The GRM was applied separately within each dimension to evaluate the feasibility and interpretability of the proposed multimodal framework. Future research should extend the current GRM-based framework to multidimensional graded response models (MGRM), enabling items to load on multiple latent traits simultaneously.
Second, the present study is conducted within the framework of dominance models, where the probability of endorsing an item increases monotonically as the person's latent trait exceeds the item location parameter. Within this framework, higher latent trait levels correspond to a higher probability of selecting keyed or higher-category responses, reflecting a cumulative response process. However, prior studies have assuming a dominance response process for personality data and have recommended ideal point models instead (e.g., Chernyshenko et al., 2001, 2007; Tay & Ng, 2018). Unlike dominance models, ideal point models assume a non-monotonic response function, where the probability of endorsing an item is highest when the person's latent trait is near the item location parameter. Therefore, incorporating multimodal process data into ideal point frameworks can provide deeper insights into the cognitive mechanisms underlying item endorsement, while improving parameter recovery and overall model fit.
Third, although the present study focused on unidimensional Likert-scale items, a key direction for future research is the adoption of forced-choice response formats. Forced-choice designs present respondents with multiple options simultaneously, requiring comparative judgments that can effectively reduce response biases, including social desirability, acquiescence, and extreme responding. Such designs compel respondents to prioritize among options. Incorporating process data into forced-choice formats has significant potential to deepen understanding of the cognitive mechanisms underlying decision-making. Process data can capture subtle aspects of respondents’ mental states, attentional allocation, and decision dynamics that are not observable from final choice outcomes alone. Extending the current multimodal framework to incorporate forced-choice response data could further improve the precision of latent trait estimation, enhance the ecological and psychological validity of personality and organizational assessments, and offer richer insights into the structure of multidimensional constructs.
Fourth, the empirical study should be interpreted as a preliminary demonstration of feasibility rather than a definitive validation in organizational settings. The sample size (N = 236) provides sufficient information for model estimation in this context; however, it is relatively small from an organizational research perspective and is drawn from a student sample with an age-constrained and female-dominated composition. Such characteristics limit the generalizability of the findings to typical organizational populations, which are generally more heterogeneous in age, gender, and work experience. Therefore, while the empirical results suggest that the multimodal-IRTM can be successfully estimated under moderate sample sizes, they should not be interpreted as evidence of its performance in representative organizational datasets. Future research should evaluate the robustness and generalizability of the proposed model using larger and more diverse samples, particularly in real-world organizational contexts.
Fifth, the current study focused exclusively on two types of multimodal response data: response times and visual FCs. Although these indicators offer valuable insights into the cognitive processes and attentional patterns underlying test-taking behavior, technological advances now allow for the collection of a broader range of process-related data. For example, researchers can record electrodermal responses, electroencephalography (EEG) signals, mouse or touchscreen interactions, and other behavioral or physiological measures. Future research could investigate whether the current multimodal framework can be extended to incorporate these diverse modalities, and whether such extensions might improve measurement precision, enhance model interpretability, and offer a richer understanding of the complex mechanisms underlying responses in personality, cognitive, and organizational assessments.
Sixth, the present study focused exclusively on data collected under normal and effortful response conditions and did not explicitly consider aberrant responding behaviors, such as careless or insufficient effort responding. Multimodal indicators, such as unusually short or long response times, atypical eye-movement patterns, or irregular physiological signals, may capture deviations in engagement, attention, or decision-making strategies that standard response models do not adequately explain. Disengaged examinees may interact with items using shorter response times and fewer fixations than would be expected if they were reading, comprehending, and providing an engaged response (Ulitzsch et al., 2020a). Under normal responding conditions, responses associated with higher uncertainty generally require more time than those associated with lower uncertainty. Responses with low uncertainty generally exhibit longer response times than random or careless responses, which are typically characterized by minimal cognitive engagement and abnormally short response times. Incorporating data from respondents exhibiting careless or insufficient effort responding in future research could allow for a systematic examination of whether multimodal measures improve the detection, modeling, and correction of aberrant responding, thereby enhancing the accuracy and robustness of latent trait estimation.
Supplemental Material
sj-docx-1-orm-10.1177_10944281261457337 - Supplemental material for A Multimodal Item Response Modeling for Personality Assessment in Organizational Research
Supplemental material, sj-docx-1-orm-10.1177_10944281261457337 for A Multimodal Item Response Modeling for Personality Assessment in Organizational Research by Dongbo Tu, Fumei Zhang, Siwei Peng, Daxun Wang and Yan Cai in Organizational Research Methods
Footnotes
Funding
This work was supported by Grants 32300942, 32160203, 62467002 and 62167004 from the National Natural Science Foundation of China.
Declaration of Conflicting Interests
The authors declared no potential conflicts of interest with respect to the research, authorship, and/or publication of this article.
Supplemental Materials
Supplemental material for this article is available online.
Author biographies
References
Supplementary Material
Please find the following supplemental material available below.
For Open Access articles published under a Creative Commons License, all supplemental material carries the same license as the article it is associated with.
For non-Open Access articles published, all supplemental material carries a non-exclusive license, and permission requests for re-use of supplemental material or any part of supplemental material shall be sent directly to the copyright owner as specified in the copyright notice associated with the article.